

Abstract
Background
Short or long sleep duration is proposed as a potential risk factor for all-cause mortality in the older people, yet the results of published studies are not often reproducible.
Methods
Literature retrieval, study selection and data extraction were completed independently and in duplicate. Only prospective cohort studies were included. Effect-size estimates are expressed as hazard ratio (HR) and 95% confidence interval (CI).
Results
Summary data from 28 articles, involving a total of 95,259 older people, were meta-analyzed. Overall analyses revealed a remarkably significant association between long sleep duration and all-cause mortality (adjusted HR = 1.24, 95% CI: 1.16–1.33, P < .001), whereas only marginal significance was observed for short sleep duration (adjusted HR = 1.04; 95% CI: 1.00–1.09; P = .033). Funnel plots suggested no publication bias for short sleep duration (P = .392). The probability of publication bias was high for long sleep duration (P = .020), yet the trim-and-fill method strengthened its significance in predicting all-cause mortality. In subgroup analyses, the association of long sleep duration with all-cause mortality was statistically significant in both women (HR = 1.48; 95% CI: 1.18–1.86; P = .001) and men (HR = 1.31; 95% CI: 1.10–1.58; P = .003). By contrast, with regard to short sleep duration, statistical significance was observed in men (HR = 1.13; 95% CI: 1.04–1.24; P = .007), but not in women (HR = 1.00; 95% CI: 0.85–1.18; P = .999) (Two-sample Z test P = .099). Besides gender, geographic region, sleep survey method, baseline age and follow-up interval were identified as possible causes of between-study heterogeneity in subgroup analyses. Further dose-response regression analyses revealed that trend estimation was more obvious for long sleep duration (regression coefficient: 0.13; P < .001) than for short sleep duration (regression coefficient: 0.02; P = .046).
Conclusions
Our findings indicate a significantly increased risk of all-cause mortality associated with long sleep duration, especially in women, as well as with short sleep duration in men only.
Keywords: All-cause mortality, Meta-analysis, Older people, Sleep duration
Background
It is widely recognized that sleep plays an important role in human mental and physical health [1, 2]. Experimental studies indicated that sleep deprivation and excessive sleep duration can exert an adverse effect on hormones, metabolism and immune function [3–5]. From epidemiological aspects, although dozens of studies reported that inappropriate sleep duration and poor sleep quality are reported to be associated with high risk of some common diseases, including diabetes [6], cardiovascular diseases [7] and cancer [8], as well as to increased all-cause and cause-specific mortality rates [9], these associations are not often reproducible.
Over the past decades, many prospective studies have reported a U-shaped relationship between sleep duration and all-cause mortality, with the nadir at 7–8 h of sleep per night [10–17]. In 2016, da Silva and colleagues conducted a meta-analysis by pooling the results of 27 cohort studies, and they found a significant association of both long and short sleep duration with increased all-cause mortality risk in the older people, and the association was more evident for long sleep duration [18]. However, the results of other studies have failed to provide any supportive data on sleep duration and mortality in the older people [19–21]. The reasons for these inconsistent reports are multifactorial, possibly relating to inadequate statistical power of individual studies, different backgrounds and characteristics of study groups, and lack of adjustment for confounding factors. Given the accumulating data afterwards, there is a need to reexamine this association in a more comprehensive manner.
To yield more information for future studies, we synthesized the results of prospective cohort studies in the older people, aiming to evaluate the association between sleep duration and all-cause mortality. Meanwhile, we also intended to explore possible causes of between-study heterogeneity.
Methods
This meta-analysis was conducted according to the guidelines of the Preferred Reporting Items for Systematic Reviews and Meta-analyses (PRISMA) statement [22], and the PRISMA checklist is presented in Supplementary Table 1.
Search strategy
We completed literature search by scanning PubMed, EMBASE and Web of Science databases as of November 30, 2019. The following medical topic terms are used: (sleep OR sleep disorders OR sleep duration OR drowse OR napping OR naps OR nap OR Siesta OR drowsiness OR drowse OR insomnia OR actigraphy sleep OR self-reported sleep [Title/Abstract], AND mortality OR death OR deaths OR premature death OR all-cause mortality [Title/Abstract]), AND (aged OR geriatrics OR older people OR older age OR older adult OR older adult OR older persons OR older people OR older men OR older women OR aging OR aging women OR aging men OR the older people OR aging individuals [Title/Abstract]). We also scanned the reference lists of retrieved articles and systematic reviews to avoid potential missing hits.
Two investigators (M.H. and X.D.) independently reviewed all retrieved articles, and, they carefully evaluated preliminary qualification based on their titles or abstracts and full texts if necessary.
Inclusion/exclusion criteria
Our analyses were restricted to the articles that met the following criteria: (1) participants aged ≥60 years old; (2) all-cause mortality as the outcome; (3) prospective cohort studies; (4) clear classification of sleep duration; (5) at least 70% follow-up rate. Studies with subgroup analysis in older people on sleep duration and all-cause mortality were also included in this meta-analysis. Articles were excluded if they focused on cause-specific mortality or involved participants with serious diseases, or if they are case reports/series, editorials, and narrative comments.
Data extraction
Two investigators (M.H. and X.D.) independently extracted data from each qualified article, and typed them into a standardized Excel spreadsheet, including name of the first author, year of publication, country where study was conducted, race, sample size, sex, baseline age, follow-up period, ascertainment of sleep duration, death certificate, adjusted confounders, sleep duration, effect estimation, and other traditional risk factors, if available. The divergences were resolved through joint reevaluation of original articles, and, if necessary, by a third author (W.N).
Statistical analysis
We used the Stata software version 14.1 for Windows (Stata Corp, College Station, TX) to manage and analyze data. Irrespective of the magnitude of between-study heterogeneity, the random-effects model was employed. Effect size estimates are expressed as hazard ratio (HR) and its 95% confidence interval (CI), and the difference between two estimated was tested by the Z-test as reported by Altman and Bland [23]. The dose-response association was examined by the generalized least squares regression proposed by Greenland and Longnecker [24] for trend estimation of summarized dose-response data. Additionally, the restricted cubic splines of exposure distribution with 3 knots (25th, 50th, and 75th percentiles) were used to conduct nonlinearity test between sleep duration and all-cause mortality.
The inconsistency index (I2) is used to assess heterogeneity between studies, and it represents the percentage of diversity observed between studies that results from chance rather than an accidental result. If the I2 value is greater than 50%, significant heterogeneity is recorded, and a higher value indicates a higher degree of heterogeneity. Because of diverse sources of heterogeneity possibly from clinical and methodological aspects, a large number of prespecified subgroups were analyzed according to baseline age, sex, region, race, follow-up, short sleep duration and long sleep duration, respectively.
The probability of publication bias was evaluated by both Begg’s funnel plots and Egger regression asymmetry tests at a significance level of 10%. The trim-and-fill method was used to estimate the number of theoretically missing studies.
Results
Eligible studies
After searching prespecified public databases using predefined medical subject terms, a total of 2098 articles were initially identified, and 28 of them with data on sleep duration and all-cause mortality were eligible for inclusion [10, 14, 17, 19, 21, 25–47], including 95,259 older persons in the final analysis. The detailed selection process including specific reasons for exclusion is schematized in Fig. 1. Since most articles provided data according to different age groups at baseline or follow-up periods, they are processed separately in subgroup analyses.
Fig. 1.
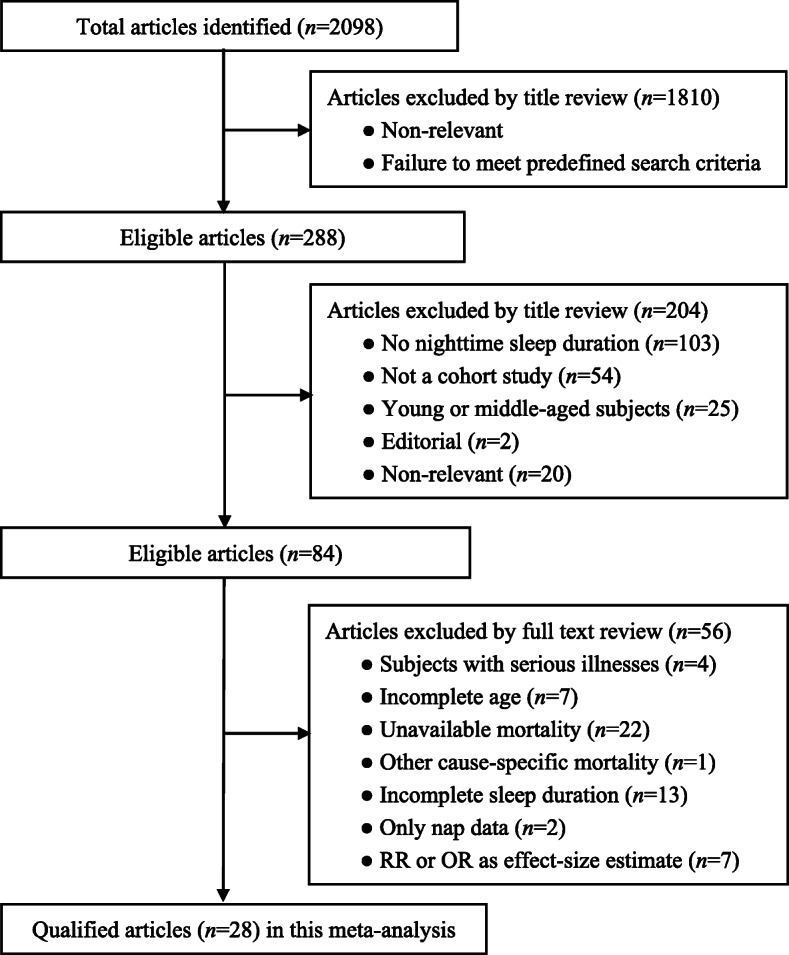
Flow chart of records retrieved, screened and included in this meta-analysis
Study characteristics
Table 1 and Table 2 show the baseline characteristics of all cohort studies involved in this meta-analysis. Of 28 eligible articles, 2 in older women [17, 19], and 6 specifically described the number of men and women and the number of deaths of men and women [27, 30, 35, 38–40]. Five articles provided data on the association between sleep duration and all-cause mortality by gender [30, 35, 36, 38, 42]. Of all eligible articles, 9 investigated the total sleep duration of 24 h in the older people [19, 26, 31, 33, 38, 39, 41–43], and the others focused on the nighttime. One article adopted the actigraphy method to collect sleep time [43], and 2 articles simultaneously used actigraphy method and questionnaires [17, 47]. Based on geographic locations, all eligible articles were classified into America [14, 17, 19, 26, 32, 33, 40, 42], Europe [10, 21, 34, 37, 42–45], and Asia [27–31, 35, 36, 38, 39, 41].
Table 1.
The baseline characteristics of all cohort studies involved in this meta-analysis
| First author (year) | Baseline year | Country | Age (years) | Ascertainment of sleep | TST | Comparison | Mortality ascertainment | Adjustment |
|---|---|---|---|---|---|---|---|---|
| Kaplan (1987) | 1965 | USA | 60–94 | Questionnaire | Nighttime sleep | 7-8 h vs. ≤7 h | Death certificate | YES |
| 7-8 h vs. > 8 h | All-cause | |||||||
| Seki (2001) | 1990 | Japan | 60–74 | Questionnaire | 24 h sleep | 7 h vs. ≤6 h | Death certificate | YES |
| 7 h vs. ≥9 h | All-cause | |||||||
| Goto (2003) | 1987 | Japan | ≥65 | Questionnaire | Nighttime sleep | 6-7 h vs. < 6 h | Death certificate | YES |
| 6-7 h vs. ≥7 h | All-cause | |||||||
| Lan (2007) | 1993 | China | ≥64 | Questionnaire | Nighttime sleep | 7–7.9 h vs. < 7 h | Death certificate | YES |
| 7–7.9 h vs. ≥10 h | All-cause, CVD, cancer | |||||||
| Gangwisch (2008) | 1982 | USA | 60–86 | Questionnaire | Nighttime sleep | 7 h vs. ≤5 h | Death certificate and proxy interviews | YES |
| 7 h vs. ≥9 h | All-cause | |||||||
| Stone (2009) | 1986 | USA | ≥68 | Questionnaire | Nighttime sleep | 6-8 h vs. < 6 h | Death certificate | YES |
| 6-8 h vs. ≥8 h | All-cause, CVD, cancer and other | |||||||
| Suzuki (2009) | 1999 | Japan | 65–85 | Questionnaire | 24 h sleep | 7 h vs. ≤5 h | Death certificate | YES |
| 7 h vs. ≥10 h | All-cause and CVD | |||||||
| Castro-Costa (2011) | 1997 | Brazil | > 60 | Questionnaire | 24 h sleep | 7–7.9 h vs. < 6 h | Death certificate and proxy interviews | YES |
| 7–7.9 h vs. ≥9 h | All-cause | |||||||
| Kripke (2011) | 1995 | USA | 60–81 | Questionnaire & actigraphy | Nighttime sleep | 7 h vs. ≤5 h | Proxy interviews and social security death index | NO |
| 7 h vs. ≥9 h | All-cause | |||||||
| Kronholm (2011) | 1972 | Finland | 60–64 | Questionnaire | Nighttime sleep | 7-8 h vs. ≤5 h | Death certificate and hospital discharge register | NO |
| 7-8 h vs. ≥10 h | All-cause and CVD | |||||||
| Qiu (2011) | 2005 | China | ≥65 | Questionnaire | 24 h sleep | 6-8 h vs. ≤5 h | Death certificate | YES |
| 6-8 h vs. ≥9 h | All-cause | |||||||
| Werle (2011) | 1994 | Brazil | ≥80 | Questionnaire | Nighttime sleep & 24 h sleep | ≤8 h vs. > 8 h | Death certificate, proxy interviews and patient records | YES |
| All-cause and CVD | ||||||||
| Cohen-Mansfield (2012) | 1989 | Israel | 75–94 | Questionnaire | Nighttime sleep | 7-9 h vs. < 7 h | Death certificate | YES |
| 7-9 h vs. ≥9 h | All-cause | |||||||
| Chen (2013) | 1999 | China | > 65 | Questionnaire | Nighttime sleep | 7 h vs. ≤4 h | Death certificate | YES |
| 7 h vs. ≥9 h | All-cause, CVD, cancer | |||||||
| Jung (2013) | 1984 | USA | 60–96 | Questionnaire | Nighttime sleep | 7-9 h vs. < 6 h | Death certificate or notice from a family member or published obituary | YES |
| 7-9 h vs. ≥9 h | All-cause | |||||||
| Kakizaki (2013) | 1994 | Japan | ≥70 | Questionnaire | 24 h sleep | 7 h vs. ≤6 h | Death certificate | YES |
| 7 h vs. ≥10 h | All-cause, CVD, cancer and the other | |||||||
| Kim (2013) | 1990 | USA | ≥65 | Questionnaire | 24 h sleep | 7 h vs. ≤5 h | Death certificate | YES |
| 7 h vs. ≥9 h | All-cause and CVD | |||||||
| Yeo (2013) | 1993 | Korea | ≥60 | Questionnaire | 24 h sleep | 7 h vs. ≤5 h | Death certificate | YES |
| 7 h vs. ≥10 h | All-cause, CVD, cancer | |||||||
| Lee (2014) | 2001 | China | > 65 | Questionnaire | Nighttime sleep | < 10 h vs. ≥10 h | Death certificate | YES |
| All-cause | ||||||||
| Hall (2015) | – | USA | 70–79 | Questionnaire | Nighttime sleep | 7 h vs. < 6 h | Death certificates, hospital records, informant interviews and autopsy data | YES |
| 7 h vs. > 8 h | All-cause | |||||||
| Zuurbier (2015) | 2004 | Holland | 60–98 | Questionnaire & actigraphy | 24 h sleep | 6–7.5 hvs. < 6 h | Death certificate and patient records | YES |
| 6–7.5 hvs. > 7.5 h | All-cause | |||||||
| Smagula (2016) | 2003 | USA | ≥65 | Questionnaire & actigraphy | 24 h sleep | 5-8 h vs. < 5 h | Death certificate | YES |
| 5-8 h vs. > 8 h | All-cause, CVD, cancer | |||||||
| Akersted (2017) | 1997 | Swedish | ≥65 | Questionnaire | Nighttime sleep | 7 h vs. ≤5 h | Death certificate | YES |
| 7 h vs. ≥8 h | All-cause, CVD, cancer | |||||||
| Beydoun (2017) | 2005 | USA | ≥65 | Questionnaire | Nighttime sleep | 7 h vs. < 7 h | Death certificate | YES |
| 7 h vs. > 8 h | All-cause | |||||||
| Brostrom (2018) | 2003 | Sweden | 65–82 | Questionnaire | Nighttime sleep | 7-8 h vs. ≤6 h | Death certificate | NO |
| 7-8 h vs. ≥9 h | All-cause | |||||||
| Cheng (2018) | 2009 | Singapore | ≥60 | Questionnaire | Nighttime sleep | 7-8 h vs. ≤6 h | Death certificate | YES |
| 7-8 h vs. ≥9 h | All-cause | |||||||
| Akersted (2019) | 1997 | Swedish | ≥65 | Questionnaire | Nighttime sleep | 7 h vs. ≤4 h | Death certificate, | YES |
| 7 h vs. ≥8 h | All-cause, CVD, cancer | |||||||
| Morgan (2019) | 1985 | UK | ≥65 | Questionnaire | Nighttime sleep | 7 h vs. ≤4 h | Death certificate | YES |
| 7 h vs. ≥9 h | All-cause | |||||||
| 4–9.9 h vs. ≥10 h | All-cause |
Abbreviations: CVD, cardiovascular disease; TST, total sleep time
Table 2.
The baseline characteristics of all cohort studies involved in this meta-analysis
| Published year | First author | Gender | Sample size | Age | Men | Women | Follow up (years) | Total deaths | Men deaths | Women deaths | Exposure (h) | Ref (h) | Adjusted | HR, 95% CI |
|---|---|---|---|---|---|---|---|---|---|---|---|---|---|---|
| 1987 | Kaplan | Men, Women | 4174 | 60–94 | – | – | 17 | – | – | – | > 8 | 7–8 | YES | 1.02, 0.87–1.19 |
| 1987 | Kaplan | Men, Women | 4174 | 60–94 | – | – | 17 | – | – | – | < 7 | 7–8 | YES | 1.02, 0.87–1.19 |
| 1987 | Kaplan | Men, Women | 4174 | 60–94 | – | – | 17 | – | – | – | > 8 | 7–8 | NO | 1.02, 0.87–1.21 |
| 1987 | Kaplan | Men, Women | 4174 | 60–94 | – | – | 17 | – | – | – | < 7 | 7–8 | NO | 1.02, 0.87–1.21 |
| 2011 | Kronholm | Men, Women | 1210 | 60–64 | – | – | 35 | 1065 | – | – | ≥10 | 7–8 | NO | 1.11, 1.05–1.18 |
| 2011 | Kronholm | Men, Women | 1210 | 60–64 | – | – | 35 | 1065 | – | – | ≤5 | 7–8 | NO | 1.07, 1.01–1.14 |
| 2008 | Gangwisch | Men, Women | 3983 | 60–86 | – | – | 10 | 1604 | – | – | ≥9 | 7 | YES | 1.36, 1.15–1.6 |
| 2008 | Gangwisch | Men, Women | 3983 | 60–86 | – | – | 10 | 1604 | – | – | ≤5 | 7 | YES | 1.27, 1.06–1.53 |
| 2008 | Gangwisch | Men, Women | 3983 | 60–86 | – | – | 10 | 1604 | – | – | ≥9 | 7 | NO | 1.98, 1.68–2.32 |
| 2008 | Gangwisch | Men, Women | 3983 | 60–86 | – | – | 10 | 1604 | – | – | ≤5 | 7 | NO | 1.72, 1.44–2.06 |
| 2013 | Jung | Men | 2001 | 60–96 | 889 | 1112 | 19 | 1224 | 632 | 592 | ≥9 | 7 | YES | 1.09, 0.82–1.45 |
| 2013 | Jung | Women | 2001 | 60–96 | 889 | 1112 | 19 | 1224 | 632 | 592 | ≥9 | 7 | YES | 1.51, 1.05–2.18 |
| 2013 | Jung | Men | 2001 | 60–96 | 889 | 1112 | 19 | 1224 | 632 | 592 | ≤5 | 7 | YES | 0.98, 0.67–1.43 |
| 2013 | Jung | Women | 2001 | 60–96 | 889 | 1112 | 19 | 1224 | 632 | 592 | ≤5 | 7 | YES | 1.11, 0.77–1.6 |
| 2013 | Jung | Men | 2001 | 60–96 | 889 | 1112 | 19 | 1224 | 632 | 592 | ≥9 | 7 | NO | 1.18, 0.92–1.52 |
| 2013 | Jung | Women | 2001 | 60–96 | 889 | 1112 | 19 | 1224 | 632 | 592 | ≥9 | 7 | NO | 1.50, 1.12–2.00 |
| 2013 | Jung | Men | 2001 | 60–96 | 889 | 1112 | 19 | 1224 | 632 | 592 | ≤5 | 7 | NO | 1.10, 0.79–1.55 |
| 2013 | Jung | Women | 2001 | 60–96 | 889 | 1112 | 19 | 1224 | 632 | 592 | ≤5 | 7 | NO | 1.07, 0.79–1.44 |
| 2019 | Morgan | Men, Women | 960 | ≥65 | 375 | 585 | 27 | 927 | – | – | ≥9 | 7 | YES | 1.18, 0.85–1.63 |
| 2019 | Morgan | Men, Women | 960 | ≥65 | 375 | 585 | 27 | 927 | – | – | ≤4 | 7 | YES | 1.08, 0.83–1.40 |
| 2019 | Morgan | Men, Women | 960 | ≥65 | 375 | 585 | 27 | 927 | – | – | ≥9 | 7 | NO | 1.40, 1.08–1.83 |
| 2019 | Morgan | Men, Women | 960 | ≥65 | 375 | 585 | 27 | 927 | – | – | ≤4 | 7 | NO | 1.02, 0.80–1.29 |
| 2009 | Stone | Women | 8101 | ≥68 | 0 | 8101 | 6.9 | 1922 | 0 | 1922 | > 8 | 6–8 | YES | 1.16, 0.97–1.39 |
| 2009 | Stone | Women | 8101 | ≥68 | 0 | 8101 | 6.9 | 1922 | 0 | 1922 | < 6 | 6–8 | YES | 1.02, 0.87–1.19 |
| 2009 | Stone | Women | 8101 | ≥68 | 0 | 8101 | 6.9 | 1922 | 0 | 1922 | ≥10 | 8–9 | YES | 1.58, 1.27–1.95 |
| 2009 | Stone | Women | 8101 | ≥68 | 0 | 8101 | 6.9 | 1922 | 0 | 1922 | < 6 | 8–9 | YES | 0.95, 0.76–1.18 |
| 2003 | Goto | Men | 724 | ≥65 | 251 | 473 | 12 | 305 | 139 | 166 | > 7 | 6–7 | YES | 1.54, 0.92–2.58 |
| 2003 | Goto | Women | 724 | ≥65 | 251 | 473 | 12 | 305 | 139 | 166 | > 7 | 6–7 | YES | 1.40, 0.91–2.15 |
| 2003 | Goto | Men | 724 | ≥65 | 251 | 473 | 12 | 305 | 139 | 166 | < 6 | 6–7 | YES | 1.29, 0.50–3.34 |
| 2003 | Goto | Women | 724 | ≥65 | 251 | 473 | 12 | 305 | 139 | 166 | < 6 | 6–7 | YES | 2.62, 1.36–5.07 |
| 2003 | Goto | Men | 724 | ≥65 | 251 | 473 | 12 | 305 | 139 | 166 | > 7 | 6–7 | NO | 1.62, 0.99–2.66 |
| 2003 | Goto | Women | 724 | ≥65 | 251 | 473 | 12 | 305 | 139 | 166 | > 7 | 6–7 | NO | 1.60, 1.06–2.42 |
| 2003 | Goto | Men | 724 | ≥65 | 251 | 473 | 12 | 305 | 139 | 166 | < 6 | 6–7 | NO | 1.42, 0.61–3.27 |
| 2003 | Goto | Women | 724 | ≥65 | 251 | 473 | 12 | 305 | 139 | 166 | < 6 | 6–7 | NO | 2.65, 1.42–4.95 |
| 2012 | Cohen-Mansfield | Men, Women | 1166 | ≥75 | – | – | 20 | 1108 | – | – | > 9 | 7–9 | YES | 1.32, 1.09–1.58 |
| 2012 | Cohen-Mansfield | Men, Women | 1166 | ≥75 | – | – | 20 | 1108 | – | – | < 7 | 7–9 | YES | 0.98, 0.84–1.13 |
| 2012 | Cohen-Mansfield | Men, Women | 1166 | ≥75 | – | – | 20 | 1108 | – | – | > 9 | 7–9 | NO | 1.29, 1.11–1.52 |
| 2012 | Cohen-Mansfield | Men, Women | 1166 | ≥75 | – | – | 20 | 1108 | – | – | < 7 | 7–9 | NO | 0.81, 0.71–0.93 |
| 2013 | Kim | Men, Women | – | 65–69 | – | – | 12.9 | 4764 | – | – | ≥9 | 7 | YES | 1.25, 1.14–1.38 |
| 2013 | Kim | Men, Women | – | 65–69 | – | – | 12.9 | 4764 | – | – | ≤5 | 7 | YES | 1.13, 1.02–1.26 |
| 2013 | Kim | Men, Women | – | ≥70 | – | – | 12.9 | 6444 | – | – | ≥9 | 7 | YES | 1.14, 1.05–1.24 |
| 2013 | Kim | Men, Women | – | ≥70 | – | – | 12.9 | 6444 | – | – | ≤5 | 7 | YES | 1.09, 0.99–1.19 |
| 2001 | Seki | Men, Women | 1065 | 60–74 | 440 | 625 | 7.5 | 123 | 77 | 46 | ≥9 | 7 | YES | 0.97, 0.50–1.90 |
| 2001 | Seki | Men, Women | 1065 | 60–74 | 440 | 625 | 7.5 | 123 | 77 | 46 | < 6 | 7 | YES | 1.74, 0.72–4.24 |
| 2001 | Seki | Men, Women | 1065 | 60–74 | 440 | 625 | 7.5 | 123 | 77 | 46 | ≥9 | 7 | NO | 1.00, 0.52–1.96 |
| 2001 | Seki | Men, Women | 1065 | 60–74 | 440 | 625 | 7.5 | 123 | 77 | 46 | < 6 | 7 | NO | 2.17, 0.91–5.21 |
| 2007 | Lan | Men | 3079 | ≥64 | 1748 | 1331 | 10 | 1338 | 816 | 522 | ≥10 | 7–7.9 | YES | 1.51, 1.19–1.92 |
| 2007 | Lan | Women | 3079 | ≥64 | 1748 | 1331 | 10 | 1338 | 816 | 522 | ≥10 | 7–7.9 | YES | 2.06, 1.50–2.83 |
| 2007 | Lan | Men | 3079 | ≥64 | 1748 | 1331 | 10 | 1338 | 816 | 522 | < 7 | 7–7.9 | YES | 0.98, 0.76–1.25 |
| 2007 | Lan | Women | 3079 | ≥64 | 1748 | 1331 | 10 | 1338 | 816 | 522 | < 7 | 7–7.9 | YES | 1.14, 0.77–1.67 |
| 2007 | Lan | Men | 3079 | ≥64 | 1748 | 1331 | 10 | 1338 | 816 | 522 | ≥10 | 7–7.9 | NO | 1.86, 1.48–2.34 |
| 2007 | Lan | Women | 3079 | ≥64 | 1748 | 1331 | 10 | 1338 | 816 | 522 | ≥10 | 7–7.9 | NO | 2.49, 1.84–3.37 |
| 2007 | Lan | Men | 3079 | ≥64 | 1748 | 1331 | 10 | 1338 | 816 | 522 | < 7 | 7–7.9 | NO | 0.97, 0.76–1.23 |
| 2007 | Lan | Women | 3079 | ≥64 | 1748 | 1331 | 10 | 1338 | 816 | 522 | < 7 | 7–7.9 | NO | 1.04, 0.71–1.51 |
| 2013 | Yeo | Men, Women | 5538 | ≥60 | – | – | 9.4 | 1223 | – | – | ≥10 | 7 | YES | 1.48, 1.13–1.93 |
| 2013 | Yeo | Men, Women | 5538 | ≥60 | – | – | 9.4 | 1223 | – | – | ≤5 | 7 | YES | 1.23, 1.03–1.47 |
| 2013 | Kakizaki | Men, Women | 9690 | ≥70 | – | – | 10.8 | 3960 | – | – | ≥9 | 7–7.9 | YES | 1.33, 1.24–1.43 |
| 2013 | Kakizaki | Men, Women | 9690 | ≥70 | – | – | 10.8 | 3960 | – | – | < 6 | 7–7.9 | YES | 0.98, 0.87–1.10 |
| 2011 | Werle | Men, Women | 187 | ≥80 | 68 | 119 | 8.7 | 141 | 56 | 85 | > 8 | 7 | YES | 0.95, 0.89–1.02 |
| 2011 | Werle | Men, Women | 187 | ≥80 | 68 | 119 | 8.7 | 141 | 56 | 85 | > 8 | 7 | NO | 0.95, 0.90–1.01 |
| 2011 | Kripke | Women | 355 | 60–81 | – | – | 10.5 | 79 | – | – | ≥9 | 7–7.9 | NO | 0.93, 0.37–2.35 |
| 2011 | Kripke | Women | 355 | 60–81 | – | – | 10.5 | 79 | – | – | ≤5 | 7 | NO | 0.83, 0.4–1.73 |
| 2017 | Akersted | Men, Women | 8089 | ≥65 | 3879 | 4210 | 13 | 2337 | – | – | ≥8 | 7 | YES | 1.01, 0.90–1.14 |
| 2017 | Akersted | Men, Women | 8089 | ≥65 | 3879 | 4210 | 13 | 2337 | – | – | ≤5 | 7 | YES | 1.05, 0.90–1.22 |
| 2017 | Akersted | Men, Women | 8089 | ≥65 | 3879 | 4210 | 13 | 2337 | – | – | ≥8 | 7 | NO | 1.06, 0.96–1.19 |
| 2017 | Akersted | Men, Women | 8089 | ≥65 | 3879 | 4210 | 13 | 2337 | – | – | ≤5 | 7 | NO | 1.02, 0.90–1.16 |
| 2011 | Castro-Costa | Men, Women | 1512 | > 60 | – | – | 7.5 | 440 | – | – | ≥9 | 7–7.9 | YES | 1.56, 1.12–2.18 |
| 2011 | Castro-Costa | Men, Women | 1512 | > 60 | – | – | 7.5 | 440 | – | – | < 6 | 7–7.9 | YES | 0.88, 0.61–1.28 |
| 2011 | Castro-Costa | Men, Women | 1512 | > 60 | – | – | 7.5 | 440 | – | – | ≥9 | 7–7.9 | NO | 1.84, 1.40–2.43 |
| 2011 | Castro-Costa | Men, Women | 1512 | > 60 | – | – | 7.5 | 440 | – | – | < 6 | 7–7.9 | NO | 1.01, 0.75–1.37 |
| 2013 | Chen | Men, Women | 4064 | > 65 | 2269 | 1795 | 9 | 1004 | 336 | 668 | ≥9 | 7 | YES | 1.66, 1.28–2.17 |
| 2013 | Chen | Men, Women | 4064 | > 65 | 2269 | 1795 | 9 | 1004 | 336 | 668 | ≤4 | 7 | YES | 1.00, 0.75–1.33 |
| 2009 | Suzuki | Men, Women | 11,395 | 65–85 | 5825 | 5570 | 7 | 1004 | 689 | 315 | ≥10 | 7 | YES | 1.96, 1.49–2.57 |
| 2009 | Suzuki | Men, Women | 11,395 | 65–85 | 5825 | 5570 | 7 | 1004 | 689 | 315 | ≤5 | 7 | YES | 0.92, 0.66–1.28 |
| 2009 | Suzuki | Men | 11,395 | 65–85 | 5825 | 5570 | 7 | 1004 | 689 | 315 | ≥10 | 7 | YES | 1.86, 1.34–2.56 |
| 2009 | Suzuki | Women | 11,395 | 65–85 | 5825 | 5570 | 7 | 1004 | 689 | 315 | ≥10 | 7 | YES | 2.27, 1.37–3.76 |
| 2009 | Suzuki | Men | 11,395 | 65–85 | 5825 | 5570 | 7 | 1004 | 689 | 315 | ≤5 | 7 | YES | 1.08, 0.72–1.61 |
| 2009 | Suzuki | Women | 11,395 | 65–85 | 5825 | 5570 | 7 | 1004 | 689 | 315 | ≤5 | 7 | YES | 0.71, 0.39–1.29 |
| 2009 | Suzuki | Men, Women | 11,395 | 65–85 | 5825 | 5570 | 7 | 1004 | 689 | 315 | ≥10 | 7 | NO | 2.29, 1.75–3.00 |
| 2009 | Suzuki | Men, Women | 11,395 | 65–85 | 5825 | 5570 | 7 | 1004 | 689 | 315 | ≤5 | 7 | NO | 1.03, 0.74–1.43 |
| 2009 | Suzuki | Men | 11,395 | 65–85 | 5825 | 5570 | 7 | 1004 | 689 | 315 | ≥10 | 7 | NO | 2.16, 1.57–2.98 |
| 2009 | Suzuki | Women | 11,395 | 65–85 | 5825 | 5570 | 7 | 1004 | 689 | 315 | ≥10 | 7 | NO | 2.65, 1.61–4.37 |
| 2009 | Suzuki | Men | 11,395 | 65–85 | 5825 | 5570 | 7 | 1004 | 689 | 315 | ≤5 | 7 | NO | 1.16, 0.78–1.73 |
| 2009 | Suzuki | Women | 11,395 | 65–85 | 5825 | 5570 | 7 | 1004 | 689 | 315 | ≤5 | 7 | NO | 0.82, 0.46–1.48 |
| 2014 | Lee | Men | 3427 | > 65 | 1745 | 1682 | 5 | 297 | 221 | 76 | ≥10 | < 10 | YES | 1.75, 1.09–2.81 |
| 2014 | Lee | Women | 3427 | > 65 | 1745 | 1682 | 5 | 297 | 221 | 76 | ≥10 | < 10 | YES | 2.88, 1.01–8.20 |
| 2014 | Lee | Men | 3427 | > 65 | 1745 | 1682 | 5 | 297 | 221 | 76 | ≥10 | < 10 | NO | 2.10, 1.33–3.33 |
| 2014 | Lee | Women | 3427 | > 65 | 1745 | 1682 | 5 | 297 | 221 | 76 | ≥10 | < 10 | NO | 2.70, 0.98–7.46 |
| 2018 | Brostrom | Men | 630 | 65–82 | 301 | 329 | 6 | 144 | 86 | 58 | ≥9 | 7–8 | YES | 1.10, 0.1–10.30 |
| 2018 | Brostrom | Women | 630 | 65–82 | 301 | 329 | 6 | 144 | 86 | 58 | ≥9 | 7–8 | YES | 0.35, 0.10–26.90 |
| 2018 | Brostrom | Men | 630 | 65–82 | 301 | 329 | 6 | 144 | 86 | 58 | ≤6 | 7–8 | YES | 0.60, 0.10–2.90 |
| 2018 | Brostrom | Women | 630 | 65–82 | 301 | 329 | 6 | 144 | 86 | 58 | ≤6 | 7–8 | YES | 0.34, 0.10–1.90 |
| 2016 | Smagula | Men | 2531 | ≥65 | 2531 | 0 | 7.4 | 628 | 628 | 0 | > 8 | 5–8 | YES | 0.83, 0.71–1.31 |
| 2016 | Smagula | Men | 2531 | ≥65 | 2531 | 0 | 7.4 | 628 | 628 | 0 | < 5 | 5–8 | YES | 1.12, 0.89–1.42 |
| 2016 | Smagula | Men | 2531 | ≥65 | 2531 | 0 | 7.4 | 628 | 628 | 0 | > 8 | 5–8 | NO | 1.02, 0.76–1.37 |
| 2016 | Smagula | Men | 2531 | ≥65 | 2531 | 0 | 7.4 | 628 | 628 | 0 | < 5 | 5–8 | NO | 1.28, 1.02–1.62 |
| 2015 | Zuurbier | Men, Women | 1073 | 60–98 | – | – | 7.3 | 142 | – | – | > 7.5 | 6–7.5 | YES | 1.24, 0.73–2.10 |
| 2015 | Zuurbier | Men, Women | 1073 | 60–98 | – | – | 7.3 | 142 | – | – | < 6 | 6–7.5 | YES | 1.12, 0.75–1.68 |
| 2011 | Qiu | Men, Women | 12,671 | ≥65 | 5421 | 7250 | 3 | 5199 | 2067 | 3132 | ≥10 | 8 | YES | 1.09, 1.00–1.180 |
| 2011 | Qiu | Men, Women | 12,671 | ≥65 | 5421 | 7250 | 3 | 5199 | 2067 | 3132 | ≤5 | 8 | YES | 0.97, 0.88–1.08 |
| 2011 | Qiu | Men | 12,671 | ≥65 | 5421 | 7250 | 3 | 5199 | 2067 | 3132 | ≥10 | 8 | YES | 1.22, 1.08–1.38 |
| 2011 | Qiu | Women | 12,671 | ≥65 | 5421 | 7250 | 3 | 5199 | 2067 | 3132 | ≥10 | 8 | YES | 1.00, 0.90–1.11 |
| 2011 | Qiu | Men | 12,671 | ≥65 | 5421 | 7250 | 3 | 5199 | 2067 | 3132 | ≤5 | 8 | YES | 1.17, 1.01–1.38 |
| 2011 | Qiu | Women | 12,671 | ≥65 | 5421 | 7250 | 3 | 5199 | 2067 | 3132 | ≤5 | 8 | YES | 0.85, 0.75–0.98 |
| 2011 | Qiu | Men, Women | 12,671 | 65–79 | 5421 | 7250 | 3 | 5199 | 2067 | 3132 | ≥10 | 8 | YES | 1.17, 0.88–1.54 |
| 2011 | Qiu | Men, Women | 12,671 | 65–79 | 5421 | 7250 | 3 | 5199 | 2067 | 3132 | ≤5 | 8 | YES | 1.00, 0.74–1.35 |
| 2011 | Qiu | Men, Women | 12,671 | ≥80 | 5421 | 7250 | 3 | 5199 | 2067 | 3132 | ≥10 | 8 | YES | 1.08, 0.99–1.18 |
| 2011 | Qiu | Men, Women | 12,671 | ≥80 | 5421 | 7250 | 3 | 5199 | 2067 | 3132 | ≤5 | 8 | YES | 0.97, 0.87–1.08 |
| 2011 | Qiu | Men, Women | 12,671 | ≥65 | 5421 | 7250 | 3 | 5199 | 2067 | 3132 | ≥10 | 8 | NO | 1.22, 1.13–1.32 |
| 2011 | Qiu | Men, Women | 12,671 | ≥65 | 5421 | 7250 | 3 | 5199 | 2067 | 3132 | ≤5 | 8 | NO | 1.19, 1.08–1.32 |
| 2011 | Qiu | Men | 12,671 | ≥65 | 5421 | 7250 | 3 | 5199 | 2067 | 3132 | ≥10 | 8 | NO | 1.36, 1.20–1.54 |
| 2011 | Qiu | Women | 12,671 | ≥65 | 5421 | 7250 | 3 | 5199 | 2067 | 3132 | ≥10 | 8 | NO | 1.12, 1.02–1.25 |
| 2011 | Qiu | Men | 12,671 | ≥65 | 5421 | 7250 | 3 | 5199 | 2067 | 3132 | ≤5 | 8 | NO | 1.47, 1.26–1.71 |
| 2011 | Qiu | Women | 12,671 | ≥65 | 5421 | 7250 | 3 | 5199 | 2067 | 3132 | ≤5 | 8 | NO | 1.03, 0.90–1.17 |
| 2011 | Qiu | Men, Women | 12,671 | 65–79 | 5421 | 7250 | 3 | 5199 | 2067 | 3132 | ≥10 | 8 | NO | 1.46, 1.11–1.91 |
| 2011 | Qiu | Men, Women | 12,671 | 65–79 | 5421 | 7250 | 3 | 5199 | 2067 | 3132 | ≤5 | 8 | NO | 1.32, 0.98–1.77 |
| 2011 | Qiu | Men, Women | 12,671 | ≥80 | 5421 | 7250 | 3 | 5199 | 2067 | 3132 | ≥10 | 8 | NO | 1.21, 1.12–1.32 |
| 2011 | Qiu | Men, Women | 12,671 | ≥80 | 5421 | 7250 | 3 | 5199 | 2067 | 3132 | ≤5 | 8 | NO | 1.18, 1.06–1.31 |
| 2017 | Beydoun | Men, Women | 2173 | ≥65 | – | – | 4.5 | – | – | – | > 8 | 7–8 | YES | 1.30, 0.73–2.29 |
| 2017 | Beydoun | Men, Women | 2173 | ≥65 | – | – | 4.5 | – | – | – | < 7 | 7–8 | YES | 0.96, 0.68–1.35 |
| 2017 | Beydoun | Men, Women | 2173 | ≥65 | – | – | 4.5 | – | – | – | > 8 | 7–8 | NO | 1.90, 1.44–2.50 |
| 2017 | Beydoun | Men, Women | 2173 | ≥65 | – | – | 4.5 | – | – | – | < 7 | 7–8 | NO | 1.20, 0.94–1.52 |
| 2018 | Cheng | Men, Women | 2448 | ≥60 | 1167 | 1281 | 4 | 274 | – | – | ≥9 | 7–8 | YES | 2.24, 1.05–4.77 |
| 2018 | Cheng | Men, Women | 2448 | ≥60 | 1167 | 1281 | 4 | 274 | – | – | ≤6 | 7–8 | YES | 2.14, 1.12–4.11 |
| 2018 | Cheng | Men, Women | 2448 | ≥60 | 1167 | 1281 | 4 | 274 | – | – | ≥9 | 7–8 | NO | 2.87, 1.36–6.05 |
| 2018 | Cheng | Men, Women | 2448 | ≥60 | 1167 | 1281 | 4 | 274 | – | – | ≤6 | 7–8 | NO | 2.69, 1.44–5.03 |
| 2015 | Hall | Men, Women | 3013 | ≥70 | 1463 | 1550 | 8.2 | 953 | – | – | > 8 | 7 | YES | 1.23, 0.93–1.63 |
| 2015 | Hall | Men, Women | 3013 | ≥70 | 1463 | 1550 | 8.2 | 953 | – | – | < 6 | 7 | YES | 1.06, 0.83–1.34 |
| 2015 | Hall | Men, Women | 3013 | ≥70 | 1463 | 1550 | 8.2 | 953 | – | – | > 8 | 7 | NO | 1.49, 1.15–1.93 |
| 2015 | Hall | Men, Women | 3013 | ≥70 | 1463 | 1550 | 8.2 | 953 | – | – | < 6 | 7 | NO | 1.30, 1.05–1.61 |
| 2019 | Akersted | Men, Women | – | ≥65 | – | – | 13 | – | – | – | ≥9 | 7 | YES | 0.99, 0.84–1.09 |
| 2019 | Akersted | Men, Women | – | ≥65 | – | – | 13 | – | – | – | ≤4 | 7 | YES | 0.97, 0.81–1.18 |
| 2019 | Akersted | Men, Women | – | ≥65 | – | – | 13 | – | – | – | ≥9 | 7 | YES | 0.91, 0.66–1.25 |
Abbreviations: Ref, reference; HR, hazard ratio; 95% CI, 95% confidence interval
Quality assessment
Table 3 shows the quality assessment results by using the Newcastle-Ottawa Scale (NOS) tool for cohort studies, with the total scores (mean: 7.46, standard deviation: 0.74) ranging from 6 to 9 in this meta-analysis.
Table 3.
The Newcastle-Ottawa Scale (NOS) for assessing the quality of all cohort studies involved in this meta-analysis
| First author | Published year | Representative of the exposed cohort | Selection of the non-exposed cohort | Ascertainment of exposed | Demonstration that outcome of interest was no present at start of study | Control for important cohort | Additional factors | Assessment of outcome | Follow up | Adequacy of follow up | Score |
|---|---|---|---|---|---|---|---|---|---|---|---|
| Kaplan | 1987 | 1 | 1 | 0 | 1 | 1 | 1 | 1 | 1 | 1 | 8 |
| Seki | 2001 | 1 | 1 | 0 | 1 | 1 | 1 | 1 | 1 | 1 | 8 |
| Goto | 2003 | 1 | 1 | 0 | 1 | 1 | 1 | 1 | 1 | 0 | 7 |
| Lan | 2007 | 1 | 1 | 0 | 1 | 1 | 1 | 1 | 1 | 0 | 7 |
| Gangwisch | 2008 | 1 | 1 | 0 | 1 | 1 | 1 | 1 | 1 | 0 | 7 |
| Stone | 2009 | 1 | 1 | 0 | 1 | 1 | 1 | 1 | 1 | 1 | 8 |
| Suzuki | 2009 | 1 | 1 | 0 | 1 | 1 | 1 | 1 | 1 | 1 | 8 |
| Kronholm | 2011 | 1 | 1 | 0 | 1 | 1 | 0 | 1 | 1 | 0 | 6 |
| Werle | 2011 | 1 | 1 | 0 | 1 | 0 | 1 | 1 | 1 | 0 | 6 |
| Kripke | 2011 | 1 | 1 | 1 | 1 | 1 | 0 | 1 | 1 | 1 | 8 |
| Castro-Costa | 2011 | 1 | 1 | 0 | 1 | 1 | 1 | 1 | 1 | 0 | 7 |
| Qiu | 2011 | 1 | 1 | 0 | 1 | 1 | 1 | 1 | 1 | 1 | 8 |
| Cohen-Mansfield | 2012 | 1 | 1 | 0 | 1 | 1 | 1 | 1 | 1 | 1 | 8 |
| Jung | 2013 | 1 | 1 | 0 | 1 | 1 | 1 | 1 | 1 | 1 | 8 |
| Kim | 2013 | 1 | 1 | 0 | 1 | 1 | 1 | 1 | 1 | 0 | 7 |
| Yeo | 2013 | 1 | 1 | 0 | 1 | 1 | 1 | 1 | 1 | 0 | 7 |
| Kakizaki | 2013 | 1 | 1 | 0 | 1 | 1 | 1 | 1 | 1 | 1 | 8 |
| Chen | 2013 | 1 | 1 | 0 | 1 | 1 | 1 | 1 | 1 | 1 | 8 |
| Lee | 2014 | 1 | 1 | 0 | 1 | 1 | 1 | 1 | 1 | 0 | 7 |
| Zuurbier | 2015 | 1 | 1 | 1 | 1 | 1 | 1 | 1 | 1 | 1 | 9 |
| Hall | 2015 | 1 | 1 | 0 | 1 | 1 | 1 | 1 | 1 | 0 | 7 |
| Smagula | 2016 | 1 | 1 | 1 | 1 | 1 | 1 | 1 | 1 | 1 | 9 |
| Akersted | 2017 | 1 | 1 | 0 | 1 | 1 | 1 | 1 | 1 | 0 | 7 |
| Beydoun | 2017 | 1 | 1 | 0 | 1 | 1 | 1 | 1 | 1 | 0 | 7 |
| Brostrom | 2018 | 1 | 1 | 0 | 1 | 1 | 0 | 1 | 1 | 1 | 7 |
| Cheng | 2018 | 1 | 1 | 0 | 1 | 1 | 1 | 1 | 1 | 0 | 7 |
| Morgan | 2019 | 1 | 1 | 0 | 1 | 1 | 1 | 1 | 1 | 1 | 8 |
| Akersted | 2019 | 1 | 1 | 0 | 1 | 1 | 1 | 1 | 1 | 0 | 7 |
Overall analyses
After pooling the results of all qualified prospective cohorts together (Table 4), unadjusted effect-size estimates for the association of the long (HR = 1.43; 95% CI: 1.30–1.58; P < .001; I2 = 88.6%) and short (HR = 1.15; 95% CI: 1.06–1.25; P < .001; I2 = 71.5%) sleep duration with all-cause mortality in the older people were remarkably significant. After adjusting for potential confounders, long sleep duration was significantly associated with an increased risk of all-cause mortality in the older people (HR = 1.24; 95% CI: 1.16–1.33; P < .001), whereas only marginal significance was observed for short sleep duration (HR = 1.04; 95% CI: 1.00–1.09; P = .033) (Table 4). In view of the striking differences before and after adjustment, the following analyses are based on adjusted effect-size estimates for the sake of relative accuracy.
Table 4.
Overall and subgroup analyses of short and long sleep duration with all-cause mortality in the older people
| Group | Number of qualified studies | Short sleep duration | Long sleep duration | ||
|---|---|---|---|---|---|
| HR (95% CI); P | I2 | HR (95% CI); P | I2 | ||
| Overall analyses | |||||
| Mortality (unadjusted) | 23/26 | 1.15 (1.06–1.25); <.001 | 71.5% | 1.43 (1.30–1.58); <.001 | 88.6% |
| Mortality (adjusted) | 32/36 | 1.04 (1.00–1.09); .033 | 16.1% | 1.24 (1.16–1.33); <.001 | 76.2% |
| Subgroup analyses based on adjusted mortality | |||||
| By gender | |||||
| Both genders | 20/23 | 1.04 (0.99–1.08); .096 | 11.1% | 1.20 (1.11–1.29); <.001 | 79.0% |
| Men | 8/8 | 1.13 (1.04–1.24); .007 | 0.0% | 1.31 (1.10–1.58); .003 | 62.3% |
| Women | 8/9 | 1.00 (0.85–1.18); .999 | 58.6% | 1.48 (1.18–1.86); .001 | 80.4% |
| By country | |||||
| America | 12/13 | 1.08 (1.03–1.14); .002 | 0.0% | 1.19 (1.07–1.31); .001 | 78.2% |
| Europe | 6/7 | 1.03 (0.93–1.14); .627 | 0.0% | 1.01 (0.93–1.09); .823 | 0.0% |
| Asia | 14/16 | 1.04 (0.96–1.12); .384 | 40.6% | 1.41 (1.26–1.57); <.001 | 75.4% |
| By total sleep time | |||||
| Nighttime | 19/23 | 1.05 (0.99–1.13); .113 | 17.8% | 1.25 (1.13–1.38); <.001 | 73.7% |
| 24 h | 13/13 | 1.04 (0.99–1.10); .146 | 19.9% | 1.25 (1.14–1.36); <.001 | 76.2% |
| By ascertainment of sleep | |||||
| Questionnaire | 30/34 | 1.04 (1.00–1.09); .055 | 20.5% | 1.26 (1.17–1.35); <.001 | 76.8% |
| Actigraphy | 1/1 | 1.12 (0.89–1.42); .342 | ─* | 0.83 (0.61–1.13); .233 | ─ |
| Both | 1/1 | 1.12 (0.75–1.68); .582 | ─ | 1.24 (0.73–2.10); .425 | ─ |
| By follow-up (years) | |||||
| ≥ 7.5 | 20/22 | 1.07 (1.02–1.12); .006 | 15.2% | 1.24 (1.14–1.34); <.001 | 80.2% |
| < 7.5 | 13/14 | 0.99 (0.93–1.05); .736 | 0.0% | 1.27 (1.12–1.45); <.001 | 68.3% |
| By age | |||||
| < 65 | 11/11 | 1.21 (1.02–1.23); .018 | 18.2% | 1.38 (1.19–1.60); <.001 | 61.5% |
| ≥ 65 | 21/25 | 1.03 (0.99–1.07); .193 | 4.2% | 1.20 (1.11–1.30); <.001 | 78.2% |
| Dose-analysis | |||||
| ≤ 5 h | 15 | 1.06 (1.01–1.11); .014 | 12.3% | ─ | ─ |
| ≤ 6 h | 27 | 1.05 (1.01–1.10); .031 | 26.7% | ─ | ─ |
| ≤ 7 h | 32 | 1.04 (1.00–1.09); .033 | 16.1% | ─ | ─ |
| ≥ 8 h | 33 | ─ | ─ | 1.24 (1.16–1.33); <.001 | 77.9% |
| ≥ 9 h | 26 | ─ | ─ | 1.31 (1.21–1.41); <.001 | 71.9% |
| ≥ 10 h | 10 | ─ | ─ | 1.45 (1.24–1.70); <.001 | 82.6% |
Abbreviations: HR, hazard ratio; 95% CI, 95% confidence interval. *Data are not available
Publication Bias
Figure 2 shows the Begg’s funnel plot to assess publication bias for the association of sleep duration with all-cause mortality, and only the plot of short sleep duration seemed symmetrical. As revealed by the Egger’s test, there was no evidence of publication bias for short sleep duration (P = .392), yet strong evidence of publication bias for long sleep duration (P = .020). Further filled funnel plots showed that there were 9 potentially missing studies due to publication bias to make the plot of long sleep duration symmetrical. After adjusting for these potentially missing studies, effect size estimates were still statistically significant for the association of long sleep duration with all-cause mortality (HR = 1.15; 95% CI: 1.07–1.23, P < .001).
Fig. 2.

The Begg’s and filled funnel plots for the association of both short and long sleep duration with all-cause mortality
Subgroup analyses
A series of prespecified subgroup analyses were conducted to account for possible causes of between-study heterogeneity for both short and long sleep duration in the older people (Table 4).
By gender, the association of long sleep duration with all-cause mortality was statistically significant in both women (HR = 1.48; 95% CI: 1.18–1.86; P = .001) and men (HR = 1.31; 95% CI: 1.10–1.58; P = .003) (Two-sample Z test P = .205). By contrast, with regard to short sleep duration, statistical significance was observed in men (HR = 1.13; 95% CI: 1.04–1.24; P = .007), but not in women (HR = 1.00; 95% CI: 0.85–1.18; P = .999) (Two-sample Z test P = .099).
By geographic locations, the association of long sleep duration with all-cause mortality was stronger in Asia (HR = 1.41; 95% CI: 1.26–1.57; P < .001) than in Europe (HR = 1.01; 95% CI: 0.93–1.09; P = .823) (Two-sample Z test P < .001) and America (HR = 1.19; 95% CI: 1.07–1.31; P = .001) (Two-sample Z test P = .013). There was no observable difference for short sleep duration between Asia (HR = 1.04; 95% CI: 0.96–1.12; P = .384) and Europe (HR = 1.03; 95% CI: 0.93–1.14; P = .627).
By total sleep time, significance was only observed for the association of long sleep duration with all-cause mortality, and there was no material difference between the nighttime (HR = 1.25; 95% CI: 1.13–1.38; P < .001) and the 24 h sleep duration (HR = 1.25; 95% CI: 1.14–1.36; P < .001).
By ascertainment of sleep, for long sleep duration, the association was more evident for questionnaire survey (HR = 1.26; 95% CI: 1.17–1.35; P < .001) than for actigraph survey (HR = 0.83; 95% CI: 0.61–1.13; P = .233) (Two-sample Z test P = .004). Contrastingly, for short sleep duration, there was no detectable significance.
By the median value (7.5 years) of follow-up intervals, the association of long sleep duration with all-cause mortality was significant in both long (≥7.5 years) (HR = 1.24; 95% CI: 1.14–1.34; P < .001) and short (< 7.5 years) (HR = 1.27; 95% CI: 1.12–1.45; P < .001) follow-up. As for short sleep duration, the association was only significant in studies with long follow-up intervals (HR = 1.07; 95% CI: 1.02–1.12; P = .006).
By the median value (65 years) of baseline age, long sleep duration was significantly associated with all-cause mortality in both subgroups (≥65 years: HR = 1.20; 95% CI: 1.11–1.30; P < .001, and < 65 years: HR = 1.38; 95% CI: 1.19–1.60; P < .001), and for short sleep duration, only marginal significance was observed for studies with median age < 65 years (HR = 1.21; 95% CI: 1.02–1.23; P = .018).
Dose-response analyses
In the dose-response analysis on short sleep duration, all-cause mortality increased with the decrease of sleep time (≤5 h: HR = 1.06; 95% CI: 1.01–1.11; P = .014, ≤6 h: HR = 1.05; 95% CI: 1.01–1.10; P = .031, and ≤ 7 h: HR = 1.04; 95% CI: 1.00–1.09; P = .033) (Two-sample Z test P = .379 for ≤5 h vs. ≤6 h, and P = .379 for ≤6 h vs. ≤7 h) (Table 4). For long sleep duration, the trend was more evident (≥8 h: HR = 1.24; 95% CI: 1.16–1.33; P < .001, ≥9 h: HR = 1.31; 95% CI: 1.21–1.41; P < .001, and ≥ 10 h: HR = 1.45; 95% CI: 1.24–1.70; P < .001) (Two-sample Z test P = .147 for ≥8 h vs. ≥9 h, and P = .128 for ≥9 h vs. ≥10 h) (Table 4 and Fig. 3A).
Fig. 3.

The trend plots of effect-size estimates with the increase of sleep duration in all older persons (A) and by genders (B and C). Abbreviations: HR, hazard ratio; 95% CI, 95% confidence interval
In men, the risk associated with all-cause mortality was significant and increased with both shorter and longer sleep duration, and the increasing trend was more obvious for long sleep duration (Fig. 3B). In women, the risk associated with all-cause mortality was nonsignificant for short sleep duration, yet it was significantly increased with longer sleep duration in a graded manner, which was steeper than men (Fig. 3C).
In both genders, dose-response regression analyses, using log (effect-size estimates) as dependent variable and categorized sleep duration as independent variable, revealed that trend estimation was more obvious for long sleep duration (regression coefficient: 0.13; P < .001) than for short sleep duration (regression coefficient: 0.02; P = .046) (Fig. 4). In men, the regression coefficient for tread estimation was 0.05 (P = .022) and 0.15 (P < .001) for short and long sleep duration, respectively, and the regression coefficient was separately 0.04 (P = .449) and 0.20 (P < .001) in women.
Fig. 4.
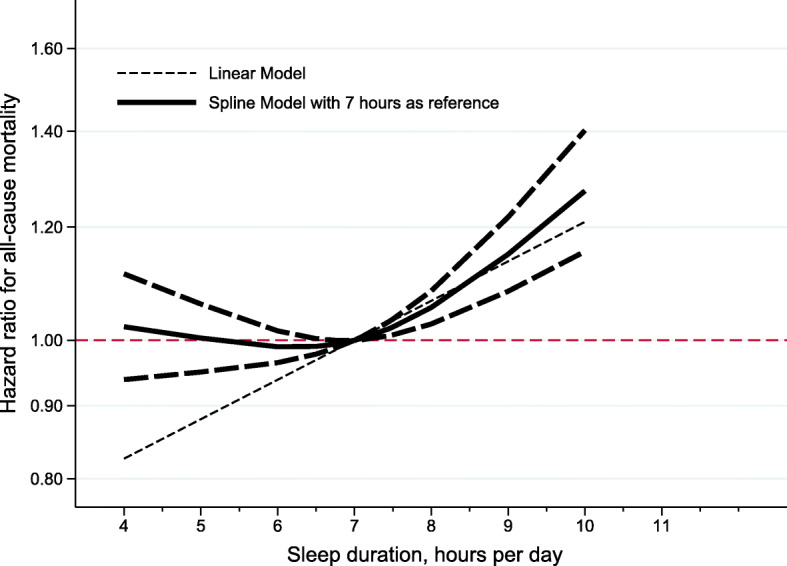
The dose-response relationship plot for the association of sleep duration with all-cause mortality. Lines with long dashes represent the pointwise 95% confidence intervals for the fitted nonlinear trend (solid line). Lines with short dashes represent the linear trend. The red horizontal line represents the reference line (hazard ratio: 1)
Discussion
To the best of our knowledge, this is thus far the most comprehensive meta-analysis that has explored the dose-response relationship between sleep duration and all-cause mortality in the older people. It is worth noting that long sleep duration was associated with a significantly increased risk of all-cause mortality, especially in women, and the mortality risk associated with short sleep duration was only significant in men. Moreover, besides gender, geographic region, sleep survey method, baseline age and follow-up interval were identified as possible causes of between-study heterogeneity. Our findings highlight the importance and the necessity of closely monitoring the sleep status of elders who have long sleep duration, as well as elderly men of sleep deficiency, to control and prevent all-cause mortality.
In the previous meta-analysis of 27 cohort studies by da Silva and colleagues, both long and short sleep duration were found to be associated with a significantly increased risk of all-cause mortality risk in the older people [18]. Differing from the meta-analysis by da Silva and colleagues [18], we restricted analysis only to prospective cohort studies that reported HRs and 95% CIs to quantify the association between sleep duration and all-cause mortality in elders. After synthesizing the adjusted effect-size estimates from 28 articles including 95,259 older persons, albeit the consistent marginal significance for short sleep duration in overall analyses, extending the findings by da Silva and colleagues [18], we in subsidiary analysis observed a remarkably significant mortality risk associated with short sleep duration in men only. Similarly, da Silva and colleagues [18] and we unanimously supported the significant contribution of long sleep duration to all-cause mortality. The reasons behind above inconsistent observations are manifold. First, the most likely reason is the unaccounted confounding, as our analysis based on unadjusted effect-size estimates indicated that short sleep duration was a significant predictor for all-cause mortality, yet no significance was detected after adjustment.
Another possible reason is the synthesis of different types of effect-size estimates. To minimize this statistical noise, we restricted analysis to only HRs that were calculated after adjusting for confounding factors, despite the varying panels of adjusted factors across each involved study in this meta-analysis. The third reason is the significant heterogeneity across individual studies. To fully account for this, we conducted both subgroup and meta-regression analyses, and found that gender, geographic region, sleep survey method, baseline age and follow-up interval were possible causes of between-study heterogeneity. We agree that future large-scale, well-designed cohort studies were warrant to derive a relatively reliable estimate.
Although the mechanisms for the association between long sleep duration and all-cause mortality are not completely understood, the current possible explanation is that sleep affects the human body through inflammatory processes. When sleep duration is too long, concentrations of inflammatory markers, such as interleukin-6 and C-reactive protein can increase [48, 49]. In addition, it is reported that unstable sleep duration was associated with some common diseases, such as hypertension [50, 51], diabetes [52], and coronary heart disease [53, 54]. It is hence reasonable to speculate that long-term irregular sleep duration is likely to destroy the body’s immune system balance through chronic inflammatory processes, and further increase all-cause mortality risk. There is also evidence showing that sleep has a crucial impact on autonomic nervous system, system dynamics, cardiac function, endothelial function and coagulation [55]. Nevertheless, over sleep duration can accelerate the occurrence or progression of chronic diseases, and further precipitate all-cause mortality.
It is worth noting that we identified strong evidence of between-study heterogeneity for the association of long sleep duration with all-cause mortality, irrespective of adjustment. By contrast, for short sleep duration, heterogeneity was dwindled from strong in the unadjusted model to low in the adjusted model. It is hence reasonable to expect that besides methodological heterogeneity (such as study design), clinical heterogeneity like different baseline characteristics (such as age, sex ratio, dietary habits) of study populations in this meta-analysis may explain the discrepancy. In particular, insufficient adjustment for residual confounding by incompletely measured or unmeasured clinical covariates might exist in our results. As such, translating our findings into clinical practice should be done with caution.
Finally, some limitations should be acknowledged for this present meta-analysis. First, only sleep duration was considered in this study, and other sleep-related indexes, such as sleep quality, are of added interest for explorations in case of sufficient eligible studies. Second, although adjusted effect-size estimates were synthesized in this meta-analysis, some important confounding factors are still not taken into account by all involved studies, such as physical activity and other lifestyle factors. For example, in a long-term follow up of older adults in the UK, physical activity and prefrailty was observed to be significant modifiers for the prediction of long sleep duration for all-cause mortality [40]. Third, although there was a high probability of publication bias for long sleep duration as reflected by Begg’s funnel plot and Egger’s test, we adopted the trim-and-fill method to impute theoretically missing studies and recalculated our pooled effect-sized estimate, which was still statistically significant. Fourth, although a large panel of subgroup and meta-regression analyses were undertaken to account for possible causes of heterogeneity, significant heterogeneity still persisted in some subgroups, limiting the interpretation of pooled effect-size estimates. Last but not the least, the majority of studies involved in this meta-analysis recorded sleep duration based on nighttime, and data on naps are sparse.
Conclusions
Taken together, our findings indicate a significantly increased risk of all-cause mortality associated with long sleep duration, especially in women, as well as with short sleep duration in men only. We agree that the findings of this meta-analysis pose a challenging task for searchers, clinicians, and policy makers to attach importance to monitor the sleep status of elders, especially with long sleep duration. Further investigations on the molecular mechanisms linking sleep duration and all-cause mortality are also warranted.
Supplementary information
Availability of data and material
The datasets used and/or analyzed during the current meta-analysis are available from the corresponding author upon reasonable request.
Authors’ contributions
All authors read and approved the final manuscript prior to submission. Conceived and designed the experiments: W.N. Performed the experiments: M.H., X.D., L.H. Analyzed the data: M.H., X. D, W.N. Contributed materials/analysis tools: M.H., X.D., Y.Z., H.Y. Wrote and revised the paper: M.H., W.N.
Funding
This work received no financial support.
Ethics approval and consent to participate
Ethics approval and consent to participate were received by each involved study in this meta-analysis.
Consent for publication
Not applicable.
Competing interests
The authors declare that they have no competing interests.
Footnotes
Publisher’s Note
Springer Nature remains neutral with regard to jurisdictional claims in published maps and institutional affiliations.
Mengyang He and Xiangling Deng shared first authors
Supplementary information
Supplementary information accompanies this paper at 10.1186/s12889-020-09275-3.
References
- 1.Hosker DK, Elkins RM, Potter MP. Promoting mental health and wellness in youth through physical activity, nutrition, and sleep. Child Adolesc Psychiatr Clin N Am. 2019;28(2):171–193. doi: 10.1016/j.chc.2018.11.010. [DOI] [PubMed] [Google Scholar]
- 2.Gothe NP, Ehlers DK, Salerno EA, Fanning J, Kramer AF, McAuley E. Physical activity, sleep and quality of life in older adults: influence of physical, mental and social well-being. Behav Sleep Med. 2019:1–12. [DOI] [PMC free article] [PubMed]
- 3.Li X, Gao X, Liu J: Cross-Sectional Survey on the Relationship Between Occupational Stress, Hormone Levels, and the Sleep Quality of Oilfield Workers in Xinjiang, China. Int J Environ Res Public Health 2019, 16(18). [DOI] [PMC free article] [PubMed]
- 4.Graff LA, Walker JR, Russell AS, Bissonnette R, Bernstein CN. Fatigue and quality of sleep in patients with immune-mediated inflammatory disease. J Rheumatol Suppl. 2011;88:36–42. doi: 10.3899/jrheum.110902. [DOI] [PubMed] [Google Scholar]
- 5.Lim YC, Hoe VCW, Darus A, Bhoo-Pathy N. Association between night-shift work, sleep quality and metabolic syndrome. Occup Environ Med. 2018;75(10):716–723. doi: 10.1136/oemed-2018-105104. [DOI] [PubMed] [Google Scholar]
- 6.Jemere T, Mossie A, Berhanu H, Yeshaw Y. Poor sleep quality and its predictors among type 2 diabetes mellitus patients attending Jimma University medical center, Jimma, Ethiopia. BMC Res Notes. 2019;12(1):488. doi: 10.1186/s13104-019-4531-6. [DOI] [PMC free article] [PubMed] [Google Scholar]
- 7.Kwok CS, Kontopantelis E, Kuligowski G, Gray M, Muhyaldeen A, Gale CP, Peat GM, Cleator J, Chew-Graham C, Loke YK, et al. Self-reported sleep duration and quality and cardiovascular disease and mortality: a dose-response meta-analysis. J Am Heart Assoc. 2018;7(15):e008552. doi: 10.1161/JAHA.118.008552. [DOI] [PMC free article] [PubMed] [Google Scholar]
- 8.Tuyan Ilhan T, Ucar MG, Gul A, Saymaz Ilhan T, Yavas G, Celik C. Sleep quality of endometrial cancer survivors and the effect of treatments. Turk J Obstet Gynecol. 2017;14(4):243–248. doi: 10.4274/tjod.59265. [DOI] [PMC free article] [PubMed] [Google Scholar]
- 9.Garfield V, Joshi R, Garcia-Hernandez J, Tillin T, Chaturvedi N. The relationship between sleep quality and all-cause, CVD and cancer mortality: the Southall and Brent REvisited study (SABRE) Sleep Med. 2019;60:230–235. doi: 10.1016/j.sleep.2019.03.012. [DOI] [PMC free article] [PubMed] [Google Scholar]
- 10.Akerstedt T, Ghilotti F, Grotta A, Bellavia A, Lagerros YT, Bellocco R. Sleep duration, mortality and the influence of age. Eur J Epidemiol. 2017;32(10):881–891. doi: 10.1007/s10654-017-0297-0. [DOI] [PMC free article] [PubMed] [Google Scholar]
- 11.Cappuccio FP, D'Elia L, Strazzullo P, Miller MA. Sleep duration and all-cause mortality: a systematic review and meta-analysis of prospective studies. Sleep. 2010;33(5):585–592. doi: 10.1093/sleep/33.5.585. [DOI] [PMC free article] [PubMed] [Google Scholar]
- 12.Ferrie JE, Shipley MJ, Cappuccio FP, Brunner E, Miller MA, Kumari M, Marmot MG. A prospective study of change in sleep duration: associations with mortality in the Whitehall II cohort. Sleep. 2007;30(12):1659–1666. doi: 10.1093/sleep/30.12.1659. [DOI] [PMC free article] [PubMed] [Google Scholar]
- 13.Gallicchio L, Kalesan B. Sleep duration and mortality: a systematic review and meta-analysis. J Sleep Res. 2009;18(2):148–158. doi: 10.1111/j.1365-2869.2008.00732.x. [DOI] [PubMed] [Google Scholar]
- 14.Gangwisch JE, Heymsfield SB, Boden-Albala B, Buijs RM, Kreier F, Opler MG, Pickering TG, Rundle AG, Zammit GK, Malaspina D. Sleep duration associated with mortality in elderly, but not middle-aged, adults in a large US sample. Sleep. 2008;31(8):1087–1096. [PMC free article] [PubMed] [Google Scholar]
- 15.Hublin C, Partinen M, Koskenvuo M, Kaprio J. Sleep and mortality: a population-based 22-year follow-up study. Sleep. 2007;30(10):1245–1253. doi: 10.1093/sleep/30.10.1245. [DOI] [PMC free article] [PubMed] [Google Scholar]
- 16.Ikehara S, Iso H, Date C, Kikuchi S, Watanabe Y, Wada Y, Inaba Y, Tamakoshi A. Association of sleep duration with mortality from cardiovascular disease and other causes for Japanese men and women: the JACC study. Sleep. 2009;32(3):295–301. doi: 10.1093/sleep/32.3.295. [DOI] [PMC free article] [PubMed] [Google Scholar]
- 17.Kripke DF, Langer RD, Elliott JA, Klauber MR, Rex KM. Mortality related to actigraphic long and short sleep. Sleep Med. 2011;12(1):28–33. doi: 10.1016/j.sleep.2010.04.016. [DOI] [PMC free article] [PubMed] [Google Scholar]
- 18.da Silva AA, de Mello RG, Schaan CW, Fuchs FD, Redline S, Fuchs SC. Sleep duration and mortality in the elderly: a systematic review with meta-analysis. BMJ Open. 2016;6(2):e008119. doi: 10.1136/bmjopen-2015-008119. [DOI] [PMC free article] [PubMed] [Google Scholar]
- 19.Stone KL, Ewing SK, Ancoli-Israel S, Ensrud KE, Redline S, Bauer DC, Cauley JA, Hillier TA, Cummings SR. Self-reported sleep and nap habits and risk of mortality in a large cohort of older women. J Am Geriatr Soc. 2009;57(4):604–611. doi: 10.1111/j.1532-5415.2008.02171.x. [DOI] [PMC free article] [PubMed] [Google Scholar]
- 20.Kurina LM, McClintock MK, Chen JH, Waite LJ, Thisted RA, Lauderdale DS. Sleep duration and all-cause mortality: a critical review of measurement and associations. Ann Epidemiol. 2013;23(6):361–370. doi: 10.1016/j.annepidem.2013.03.015. [DOI] [PMC free article] [PubMed] [Google Scholar]
- 21.Akerstedt T, Ghilotti F, Grotta A, Zhao H, Adami HO, Trolle-Lagerros Y, Bellocco R. Sleep duration and mortality - does weekend sleep matter? J Sleep Res. 2019;28(1):e12712. doi: 10.1111/jsr.12712. [DOI] [PMC free article] [PubMed] [Google Scholar]
- 22.Moher D, Liberati A, Tetzlaff J, Altman DG: Preferred reporting items for systematic reviews and meta-analyses: the PRISMA statement. BMJ (Clinical research ed) 2009, 339:b2535. [DOI] [PMC free article] [PubMed]
- 23.Altman DG, Bland JM. Interaction revisited: the difference between two estimates. BMJ. 2003;326(7382):219. doi: 10.1136/bmj.326.7382.219. [DOI] [PMC free article] [PubMed] [Google Scholar]
- 24.Greenland S, Longnecker MP. Methods for trend estimation from summarized dose-response data, with applications to meta-analysis. Am J Epidemiol. 1992;135(11):1301–1309. doi: 10.1093/oxfordjournals.aje.a116237. [DOI] [PubMed] [Google Scholar]
- 25.Beydoun HA, Beydoun MA, Chen X, Chang JJ, Gamaldo AA, Eid SM, Zonderman AB. Sex and age differences in the associations between sleep behaviors and all-cause mortality in older adults: results from the National Health and nutrition examination surveys. Sleep Med. 2017;36:141–151. doi: 10.1016/j.sleep.2017.05.006. [DOI] [PMC free article] [PubMed] [Google Scholar]
- 26.Brostrom A, Wahlin A, Alehagen U, Ulander M, Johansson P. Sex-specific associations between self-reported sleep duration, cardiovascular disease, hypertension, and mortality in an elderly population. The Journal of cardiovascular nursing. 2018;33(5):422–428. doi: 10.1097/JCN.0000000000000393. [DOI] [PubMed] [Google Scholar]
- 27.Castro-Costa E, Dewey ME, Ferri CP, Uchoa E, Firmo JO, Rocha FL, Prince M, Lima-Costa MF, Stewart R. Association between sleep duration and all-cause mortality in old age: 9-year follow-up of the Bambui cohort study, Brazil. J Sleep Res. 2011;20(2):303–310. doi: 10.1111/j.1365-2869.2010.00884.x. [DOI] [PubMed] [Google Scholar]
- 28.Chen HC, Su TP, Chou P. A nine-year follow-up study of sleep patterns and mortality in community-dwelling older adults in Taiwan. Sleep. 2013;36(8):1187–1198. doi: 10.5665/sleep.2884. [DOI] [PMC free article] [PubMed] [Google Scholar]
- 29.Cheng GH, Malhotra R, Ostbye T, Chan A, Ma S, Lo JC: Changes in nocturnal sleep and daytime nap durations predict all-cause mortality among older adults: the Panel on Health and Ageing of Singaporean Elderly. Sleep 2018, 41(7). [DOI] [PubMed]
- 30.Cohen-Mansfield J, Perach R. Sleep duration, nap habits, and mortality in older persons. Sleep. 2012;35(7):1003–1009. doi: 10.5665/sleep.1970. [DOI] [PMC free article] [PubMed] [Google Scholar]
- 31.Goto A, Yasumura S, Nishise Y, Sakihara S. Association of health behavior and social role with total mortality among Japanese elders in Okinawa, Japan. Aging Clin Exp Res. 2003;15(6):443–450. doi: 10.1007/BF03327366. [DOI] [PubMed] [Google Scholar]
- 32.Hall MH, Smagula SF, Boudreau RM, Ayonayon HN, Goldman SE, Harris TB, Naydeck BL, Rubin SM, Samuelsson L, Satterfield S, et al. Association between sleep duration and mortality is mediated by markers of inflammation and health in older adults: the health, Aging and Body Composition Study. Sleep. 2015;38(2):189–195. doi: 10.5665/sleep.4394. [DOI] [PMC free article] [PubMed] [Google Scholar]
- 33.Jung KI, Song CH, Ancoli-Israel S, Barrett-Connor E. Gender differences in nighttime sleep and daytime napping as predictors of mortality in older adults: the rancho Bernardo study. Sleep Med. 2013;14(1):12–19. doi: 10.1016/j.sleep.2012.06.004. [DOI] [PMC free article] [PubMed] [Google Scholar]
- 34.Kakizaki M, Kuriyama S, Nakaya N, Sone T, Nagai M, Sugawara Y, Hozawa A, Fukudo S, Tsuji I. Long sleep duration and cause-specific mortality according to physical function and self-rated health: the Ohsaki cohort study. J Sleep Res. 2013;22(2):209–216. doi: 10.1111/j.1365-2869.2012.01053.x. [DOI] [PubMed] [Google Scholar]
- 35.Kaplan GA, Seeman TE, Cohen RD, Knudsen LP, Guralnik J. Mortality among the elderly in the Alameda County study: behavioral and demographic risk factors. Am J Public Health. 1987;77(3):307–312. doi: 10.2105/ajph.77.3.307. [DOI] [PMC free article] [PubMed] [Google Scholar]
- 36.Kim Y, Wilkens LR, Schembre SM, Henderson BE, Kolonel LN, Goodman MT. Insufficient and excessive amounts of sleep increase the risk of premature death from cardiovascular and other diseases: the multiethnic cohort study. Prev Med. 2013;57(4):377–385. doi: 10.1016/j.ypmed.2013.06.017. [DOI] [PMC free article] [PubMed] [Google Scholar]
- 37.Kronholm E, Laatikainen T, Peltonen M, Sippola R, Partonen T. Self-reported sleep duration, all-cause mortality, cardiovascular mortality and morbidity in Finland. Sleep Med. 2011;12(3):215–221. doi: 10.1016/j.sleep.2010.07.021. [DOI] [PubMed] [Google Scholar]
- 38.Lan TY, Lan TH, Wen CP, Lin YH, Chuang YL. Nighttime sleep, Chinese afternoon nap, and mortality in the elderly. Sleep. 2007;30(9):1105–1110. doi: 10.1093/sleep/30.9.1105. [DOI] [PMC free article] [PubMed] [Google Scholar]
- 39.Lee JS, Auyeung TW, Leung J, Chan D, Kwok T, Woo J, Wing YK. Long sleep duration is associated with higher mortality in older people independent of frailty: a 5-year cohort study. J Am Med Dir Assoc. 2014;15(9):649–654. doi: 10.1016/j.jamda.2014.05.006. [DOI] [PubMed] [Google Scholar]
- 40.Morgan K, Hartescu I. Sleep duration and all-cause mortality: links to physical activity and prefrailty in a 27-year follow up of older adults in the UK. Sleep Med. 2019;54:231–237. doi: 10.1016/j.sleep.2018.11.008. [DOI] [PubMed] [Google Scholar]
- 41.Qiu L, Sautter J, Liu Y, Gu D. Age and gender differences in linkages of sleep with subsequent mortality and health among very old Chinese. Sleep Med. 2011;12(10):1008–1017. doi: 10.1016/j.sleep.2011.04.014. [DOI] [PMC free article] [PubMed] [Google Scholar]
- 42.Seki N. Relationships between walking hours, sleeping hours, meaningfulness of life (ikigai) and mortality in the elderly: prospective cohort study. Nihon eiseigaku zasshi Japanese journal of hygiene. 2001;56(2):535–540. doi: 10.1265/jjh.56.535. [DOI] [PubMed] [Google Scholar]
- 43.Smagula SF, Stone KL, Redline S, Ancoli-Israel S, Barrett-Connor E, Lane NE, Orwoll ES, Cauley JA. Actigraphy- and Polysomnography-measured sleep disturbances, inflammation, and mortality among older men. Psychosom Med. 2016;78(6):686–696. doi: 10.1097/PSY.0000000000000312. [DOI] [PMC free article] [PubMed] [Google Scholar]
- 44.Suzuki E, Yorifuji T, Ueshima K, Takao S, Sugiyama M, Ohta T, Ishikawa-Takata K, Doi H. Sleep duration, sleep quality and cardiovascular disease mortality among the elderly: a population-based cohort study. Prev Med. 2009;49(2–3):135–141. doi: 10.1016/j.ypmed.2009.06.016. [DOI] [PubMed] [Google Scholar]
- 45.Werle MH, Moriguchi E, Fuchs SC, Bruscato NM, de Carli W, Fuchs FD. Risk factors for cardiovascular disease in the very elderly: results of a cohort study in a city in southern Brazil. European journal of cardiovascular prevention and rehabilitation : official journal of the European Society of Cardiology, Working Groups on Epidemiology & Prevention and Cardiac Rehabilitation and Exercise Physiology. 2011;18(3):369–377. doi: 10.1177/1741826710389405. [DOI] [PubMed] [Google Scholar]
- 46.Yeo Y, Ma SH, Park SK, Chang SH, Shin HR, Kang D, Yoo KY: A prospective cohort study on the relationship of sleep duration with all-cause and disease-specific mortality in the Korean multi-center Cancer cohort study. Journal of preventive medicine and public health = Yebang Uihakhoe chi 2013, 46(5):271–281. [DOI] [PMC free article] [PubMed]
- 47.Zuurbier LA, Luik AI, Hofman A, Franco OH, Van Someren EJ, Tiemeier H. Fragmentation and stability of circadian activity rhythms predict mortality: the Rotterdam study. Am J Epidemiol. 2015;181(1):54–63. doi: 10.1093/aje/kwu245. [DOI] [PubMed] [Google Scholar]
- 48.Leng Y, Wainwright NW, Cappuccio FP, Surtees PG, Hayat S, Luben R, Brayne C, Khaw KT. Daytime napping and the risk of all-cause and cause-specific mortality: a 13-year follow-up of a British population. Am J Epidemiol. 2014;179(9):1115–1124. doi: 10.1093/aje/kwu036. [DOI] [PMC free article] [PubMed] [Google Scholar]
- 49.Prather AA, Vogelzangs N, Penninx BW. Sleep duration, insomnia, and markers of systemic inflammation: results from the Netherlands study of depression and anxiety (NESDA) J Psychiatr Res. 2015;60:95–102. doi: 10.1016/j.jpsychires.2014.09.018. [DOI] [PMC free article] [PubMed] [Google Scholar]
- 50.Cao Z, Shen L, Wu J, Yang H, Fang W, Chen W, Yuan J, Wang Y, Liang Y, Wu T. The effects of midday nap duration on the risk of hypertension in a middle-aged and older Chinese population: a preliminary evidence from the Tongji-Dongfeng cohort study, China. J Hypertens. 2014;32(10):1993–1998. doi: 10.1097/HJH.0000000000000291. [DOI] [PubMed] [Google Scholar]
- 51.Knutson KL. Sleep duration and cardiometabolic risk: a review of the epidemiologic evidence. Best Pract Res Clin Endocrinol Metab. 2010;24(5):731–743. doi: 10.1016/j.beem.2010.07.001. [DOI] [PMC free article] [PubMed] [Google Scholar]
- 52.Fang W, Li Z, Wu L, Cao Z, Liang Y, Yang H, Wang Y, Wu T. Longer habitual afternoon napping is associated with a higher risk for impaired fasting plasma glucose and diabetes mellitus in older adults: results from the Dongfeng-Tongji cohort of retired workers. Sleep Med. 2013;14(10):950–954. doi: 10.1016/j.sleep.2013.04.015. [DOI] [PubMed] [Google Scholar]
- 53.Cappuccio FP, Cooper D, D'Elia L, Strazzullo P, Miller MA. Sleep duration predicts cardiovascular outcomes: a systematic review and meta-analysis of prospective studies. Eur Heart J. 2011;32(12):1484–1492. doi: 10.1093/eurheartj/ehr007. [DOI] [PubMed] [Google Scholar]
- 54.Yang L, Yang H, He M, Pan A, Li X, Min X, Zhang C, Xu C, Zhu X, Yuan J, et al. Longer sleep duration and midday napping are associated with a higher risk of CHD incidence in middle-aged and older Chinese: the Dongfeng-Tongji cohort study. Sleep. 2016;39(3):645–652. doi: 10.5665/sleep.5544. [DOI] [PMC free article] [PubMed] [Google Scholar]
- 55.Pronk A, Ji BT, Shu XO, Xue S, Yang G, Li HL, Rothman N, Gao YT, Zheng W, Chow WH. Night-shift work and breast cancer risk in a cohort of Chinese women. Am J Epidemiol. 2010;171(9):953–959. doi: 10.1093/aje/kwq029. [DOI] [PMC free article] [PubMed] [Google Scholar]
Associated Data
This section collects any data citations, data availability statements, or supplementary materials included in this article.