

Abstract
Background
Diabetes has long been recognised as a strong, independent risk factor for cardiovascular disease, a problem which accounts for approximately 70% of all mortality in people with diabetes. Prospective studies show that compared to their non‐diabetic counterparts, the relative risk of cardiovascular mortality for men with diabetes is two to three and for women with diabetes is three to four. The two biggest trials in type 2 diabetes, the United Kingdom Prospective Diabetes Study (UKPDS) and the University Group Diabetes Program (UGDP) study did not reveal a reduction of cardiovascular endpoints through improved metabolic control. Theoretical benefits of the peroxisome proliferator activated receptor gamma (PPAR‐gamma) activator rosiglitazone on endothelial function and cardiovascular risk factors might result in fewer macrovascular disease events in people with type 2 diabetes mellitus.
Objectives
To assess the effects of rosiglitazone in the treatment of type 2 diabetes.
Search methods
Studies were obtained from computerised searches of MEDLINE, EMBASE and The Cochrane Library.
Selection criteria
Studies were included if they were randomised controlled trials in adult people with type 2 diabetes mellitus and had a trial duration of at least 24 weeks.
Data collection and analysis
Two authors independently assessed trial quality and extracted data. Pooling of studies by means of fixed‐effects meta‐analysis could be performed for adverse events only.
Main results
Eighteen trials which randomised 3888 people to rosiglitazone treatment were identified. Longest duration of therapy was four years with a median of 26 weeks. Published studies of at least 24 weeks rosiglitazone treatment in people with type 2 diabetes mellitus did not provide evidence that patient‐oriented outcomes like mortality, morbidity, adverse effects, costs and health‐related quality of life are positively influenced by this compound. Metabolic control measured by glycosylated haemoglobin A1c (HbA1c) as a surrogate endpoint did not demonstrate clinically relevant differences to other oral antidiabetic drugs. Occurrence of oedema was significantly raised (OR 2.27, 95% confidence interval (CI) 1.83 to 2.81). The single large RCT (ADOPT ‐ A Diabetes Outcomes Progression Trial) indicated increased cardiovascular risk. New data on raised fracture rates in women reveal extensive action of rosiglitazone in various body tissues.
Authors' conclusions
New studies should focus on patient‐oriented outcomes to clarify the benefit‐risk ratio of rosiglitazone therapy. Safety data and adverse events of all investigations (published and unpublished) should be made available to the public.
Plain language summary
Rosiglitazone for type 2 diabetes mellitus
Diseases of the heart and blood vessels account for approximately 70% of all mortality in people with diabetes. Compared to their non‐diabetic counterparts the relative risk of mortality caused by disorders of the heart and blood vessels is two to three for men and three to four for women with diabetes. Type 2 diabetes is mainly characterised by a reduced ability of the hormone insulin to stimulate glucose uptake in body fat and muscles (insulin resistance) and affects most people suffering from diabetes. Several medications are on the market to treat diabetes, amongst them rosiglitazone as a member of the 'glitazones' reduced risk markers for diseases of the heart and blood vessels. Since the two biggest trials in people with type 2 diabetes showed that improved blood glucose alone is not enough to reduce the risk of the above mentioned diseases we looked for longer‐term studies investigating 24 weeks as a minimum of rosiglitazone treatment on patient‐oriented outcomes. As patient‐oriented outcomes we defined mortality, complications of diabetes, side effects of the medication, health‐related quality of life, costs and metabolic control (lowering of blood glucose to near normal levels).
Eighteen trials randomised 3888 people to rosiglitazone therapy. The longest duration of rosiglitazone treatment was four years, most trials lasted around half a year. Unfortunately, the published studies of at least 24 weeks rosiglitazone treatment in people with type 2 diabetes mellitus did not provide relevant evidence that patient‐oriented outcomes are positively influenced by this agent. The chance of developing oedema was approximately doubled, the risk of cardiovascular diseases increased. The single large randomised controlled trial showed evidence of raised cardiovascular risk after rosiglitazone treatment. Moreover, new safety data show increased numbers of broken bones in women. This finding was published years after approval of this agent by drug regulatory authorities. New ways of exploring drug effects, for example by early long‐term studies in many people, as well as public access to all safety data of published and unpublished investigations have to be established.
Background
Description of the condition
Diabetes mellitus is a metabolic disorder resulting from a defect in insulin secretion, insulin action, or both. A consequence of this is chronic hyperglycaemia (that is elevated levels of plasma glucose) with disturbances of carbohydrate, fat and protein metabolism. Long‐term complications of diabetes mellitus include retinopathy, nephropathy and neuropathy. The risk of cardiovascular disease is increased. For a detailed overview of diabetes mellitus, please see under 'Additional information' in the information on the Metabolic and Endocrine Disorders Group in The Cochrane Library (see 'About', 'Cochrane Review Group (CRGs)'). For an explanation of methodological terms, see the main glossary in The Cochrane Library.
There are two main types of diabetes mellitus, type 1 (formerly termed insulin‐dependent diabetes mellitus) and type 2 (formerly termed non‐insulin dependent diabetes mellitus):
Type 1 diabetes mellitus
Type 1 diabetes is a chronic disease characterised by hyperglycaemia due to absolute deficiency of insulin secretion which is caused by autoimmune destruction of the pancreatic beta cells. Evidence of autoimmunity is provided by the appearance of autoantibodies prior to the onset of clinical disease. The clinical presentation ranges from mild nonspecific symptoms or no symptoms to coma. Although type 1 diabetes usually develops before 30 years of age, it can occur at any age. At presentation, most patients are thin and have experienced weight loss, polyuria, polydipsia, fatigue, and diabetic ketoacidosis.
Type 2 diabetes mellitus
In type 2 diabetes mellitus, the actions and secretion of insulin are impaired, as opposed to the absolute deficiency of insulin that occurs with type 1 diabetes mellitus. Type 2 diabetes is characterised by two major pathophysiologic defects: (1) insulin resistance, which results in increased hepatic glucose production and decreased peripheral glucose disposal, (2) impaired β‐cell secretory function (Kahn 1997). Insulin resistance is an impaired biological response to the effects of exogenous or endogenous insulin. Insulin resistance in the hepatic and peripheral tissues, particularly skeletal muscle, leads to unrestrained hepatic glucose production and diminished insulin‐stimulated peripheral glucose uptake and utilization (DeFronzo 1992). Insulin secretion by the pancreatic beta cell is initially sufficient to compensate for insulin resistance, thereby maintaining normal blood glucose levels. Hyperinsulinaemia, which accompanies insulin resistance, can maintain sufficiently normal glucose metabolism as long as pancreatic β‐cell function remains normal. However, in patients who may develop type 2 diabetes, insulin secretion eventually fails, leading to hyperglycaemia and clinical diabetes (Warram 1990). Individuals with type 2 diabetes may have few or no classic clinical symptoms (see above) of hyperglycaemia (Ruige 1997). The difficulty in maintaining metabolic control, for example measured by haemoglobin A1c (HbA1c) over time may be related to several behavioral factors (for example difficulties with healthy eating, exercise, medication regimens) but primarily reflects the underlying progressive decline in β‐cell function (UKPDS‐16 1995). Type 2 diabetes has traditionally been treated in a stepwise manner, starting with lifestyle modifications (Armour 2004; Gimenez‐Perez 2001; Moore 2005), exercise (Thomas 2001) and later on pharmacotherapy with oral agents. Several classes of oral agents are available for clinical use. These mainly include insulin secretagogues, drugs that delay the absorption of carbohydrates from the gastrointestinal tract, and insulin sensitizers. Over time, many patients with type 2 diabetes will require insulin therapy (Burt 2005; Misso 2005; Richter 2005; Roberts 2005; Royle 2003; Siebenhofer 2004). Insulin secretagogues: Currently, the sulphonylureas used are mainly glibenclamide (glyburide), glipizide, chlorpropamide, tolbutamide, and glimepiride. These drugs stimulate pancreatic β‐cell insulin secretion by binding to a sulphonylurea receptor (Lindberg 2002). The short‐acting non‐sulphonylurea insulin secretagogues are repaglinide and nateglinide (Black 2003). These are newer agents that also stimulate insulin secretion by binding to the sulphonylurea receptor. Alpha‐glucosidase inhibitors: Acarbose and miglitol are α‐glucosidase inhibitors. These drugs slow the absorption of carbohydrates, reducing especially postprandial elevations in plasma glucose levels. They do not significantly lower fasting plasma glucose levels but cause a modest reduction in HbA1c (Van de Laar 2005). Insulin sensitizers: Metformin belongs to the biguanides class (Saenz 2005; Salpeter 2003). It might increase insulin sensitivity in the liver by inhibiting hepatic gluconeogenesis and thereby reducing hepatic glucose production. Metformin also seems to increase peripheral insulin sensitivity by enhancing glucose uptake in the muscle. The thiazolidinediones consist of rosiglitazone and pioglitazone. These substances decrease insulin resistance in muscle and adipose tissue by activating the peroxisome proliferator‐activated receptor γ (PPAR−γ) which increases production of proteins involved in glucose uptake. They also decrease hepatic glucose production by improving hepatic insulin sensitivity (Meriden 2004).
Description of the intervention
Type 2 diabetes mellitus can be treated by non‐pharmacological (diet, exercise) and pharmacological means. Insulin, as the natural hormone of the body, might be given as animal (mainly pork or beef) insulin (Richter 2005), genetically constructed 'human' insulin or as insulin‐'analogues' with a modified molecular structure compared to human insulin (Roberts 2005; Siebenhofer 2004). Insulin is currently administered by diabetic people in various ways: Subcutaneous injections, insulin pumps (Misso 2005), and maybe in future by inhalation (Burt 2005; Royle 2003). Oral antidiabetic agents are most often used to treat type 2 diabetes mellitus in its initial stages if lifestyle modifications have failed. The thiazolidinediones rosiglitazone and pioglitazone offer new oral treatment options and affect many tissues and parts of the body. In order to evaluate their effects not only on metabolic control in type 2 diabetes mellitus but also on patient‐oriented outcomes like cardiovascular disease, longer‐term studies of at least 24 weeks continuous intake will be critically appraised in this review.
Adverse effects of the intervention
An increase in bodyweight has been associated with rosiglitazone. Oedema, anaemia and congestive heart failure have been reported in patients receiving rosiglitazone. The patients who appear to be at greatest risk of peripheral oedema, fluid retention and weight gain, congestive heart failure and pulmonary oedema related to rosiglitazone are probably those who use insulin or have New York Heart Association class II, III or IV cardiac status, left‐ventricular dysfunction or renal insufficiency. Some reports of visual impairment in patients taking rosiglitazone were described (Colucciello 2005). Case reports of liver function abnormalities associated with rosiglitazone were documented (Marcy 2004; Menees 2005; Su 2006).
How the intervention might work
Because traditional agents have a limited impact on insulin resistance and β‐cell function, thiazolidinediones may be an appropriate choice especially for combination therapy in patients achieving poor glycaemic control with initial monotherapy. By improving insulin sensitivity, thiazolidinediones may exert beneficial effects on cardiovascular risk factors. The excess cardiovascular risk in type 2 diabetes cannot be attributed to classic risk factors alone (mainly hypertension, hypercholesterolaemia and smoking), but if present, these risk factors are at least as important as in patients without diabetes (Stamler 1993). One explanation for the beneficial effects of thiazolidinediones is their unique mechanism of action as selective and potent inhibitors of PPAR‐γ. PPAR‐γ receptors are present in many tissues like adipose, hepatic and skeletal muscle tissue and control insulin‐responsive genes, which have a wide‐ranging influence. Thiazolidinediones appear to improve markers of inflammation and fibrinolysis, exert beneficial effects on vascular reactivity, improve the lipid profile and fat distribution, and decrease pancreatic β‐cell injury. Rosiglitazone is a member of the thiazolidinedione group which also encompasses troglitazone (withdrawn due to hepatic toxicity) and pioglitazone. It increases the sensitivity of skeletal muscle, liver and adipose tissue to insulin without directly stimulating insulin secretion from pancreatic ß‐cells, thereby reducing plasma glucose levels and endogenous glucose production (Wagstaff 2002). Differences in the side chain on the main thiazolidine‐structure in comparison to pioglitazone are thought to be responsible for the distinct bioavailability, metabolism and antihyperglycaemic potency of rosiglitazone. Although rosiglitazone appears to be associated with some effects that are not mediated by PPAR‐γ (Yang 2001), binding of rosiglitazone to this receptor seems to be the important component of its mechanism of action. Rosiglitazone has several pharmacodynamic properties which could ameliorate the increased risk of cardiovascular disease in type 2 diabetes mellitus. In clinical studies in patients with type 2 diabetes mellitus, rosiglitazone has been associated with reductions in the levels of small dense low density lipoprotein‐cholesterol (LDL‐C) ‐ despite overall increases in total LDL‐C ‐ and increases in the levels of high density lipoprotein‐cholesterol (HDL‐C). Diastolic and systolic blood pressure are thought to be decreased after rosiglitazone treatment. Some other surrogate parameters indicating especially cardiovascular risk were reported to be positively influenced by rosiglitazone therapy.
Why it is important to do this review
Diabetes has long been recognised as a strong, independent risk factor for cardiovascular disease, a problem which accounts for approximately 70% of all mortality in people with diabetes (Laakso 1999). Prospective studies show that compared to their non‐diabetic counterparts, the relative risk of cardiovascular mortality for men with diabetes is two to three and for women with diabetes is three to four (Manson 1991; Stamler 1993). The increased cardiovascular risk associated with diabetes is reflected in the observation that middle‐aged individuals with diabetes have mortality and morbidity risks that are similar to non‐diabetic individuals who have already suffered a cardiovascular event (Haffner 1998). Both epidemiological and prospective data have demonstrated that treatment of hyperglycaemia in type 2 diabetes mellitus is effective in reducing the risk of microvascular disease (for example diabetic retinopathy) but is less potent in reducing that of myocardial infarction, stroke and peripheral vascular disease. Treatment of other cardiovascular risk factors, although by definition less prevalent than hyperglycaemia, appears to be more effective in preventing macrovascular disease than treatment of hyperglycaemia. The University Group Diabetes Program (UGDP) study was the first published long‐term investigation of people with type 2 diabetes indicating no reduction of cardiovascular endpoints through improved metabolic control but raised cardiovascular mortality after tolbutamide treatment (UGDP 1982). The study of Ohkubo et al. which included relatively lean Japanese patients with type 2 diabetes, was the first to demonstrate prevention of microvascular complications by intensive glucose control in patients with type 2 diabetes (Ohkubo 1995). This study did not address the question of whether good glycaemic control retards the progression of macrovascular disease. The United Kingdom Prospective Diabetes Study (UKPDS) tested mainly whether intensive glucose control with either a sulphonylurea or insulin influences the risk of micro‐ and macrovascular complications compared with conventional treatment (UKPDS‐33 1998). The 10‐year results of the UKPDS evaluated drug treatment in non obese and obese participants with newly diagnosed type 2 diabetes who were referred to hospital clinics. Over 10 years, HbA1c was 7.0% in the intensive group compared with 7.9% in the conventional group. The 0.9% difference in HbA1c between the intensive and conventional groups over 10 years was smaller than the 1.9% difference (9.0% and 7.1%) in HbA1c in the Diabetes Control and Complications Trial (DCCT). The DCCT studied younger patients with type 1 diabetes and assessed the effects of intensive versus conventional insulin therapy on the incidence of microvascular complications of diabetes (retinopathy, nephropathy, neuropathy) over a mean follow‐up of 6.5 years (DCCT 1993). The risk of retinopathy, for example, was statistically significant reduced by intensive insulin therapy with a number needed to treat (NNT) to benefit of six (six type 1 diabetic patients need to be treated by intensive in comparison to conventional insulin therapy over 6.5 years to avoid one additional patient to develop diabetic retinopathy). The UKPDS had a factorial design meaning that another study investigating intensive versus regular blood pressure control (HDS 1993; UKPDS‐38 1998) was imbedded in the main study. Intensive versus conventional glucose control did not result in a statistically significant difference in diabetes related mortality or macrovascular disease endpoints but reduced the relative risk in the 'any diabetes related aggregate endpoint' (Freemantle 2003). Most of this benefit was due to a reduction in microvascular endpoints including the incidence of retinal photocoagulation, which was assessed by ophthalmologists independent of the study. In the UKPDS, the NNT to prevent one patient developing any of the single endpoints over 10 years was 20 (95% confidence interval (CI) 10 to 500) patients (UKPDS‐33 1998). In contrast to these results, publication of the UKPDS‐34, which focused on obese patients with newly diagnosed type 2 diabetes, found several clinically important differences in macrovascular disease endpoints with 10 years of treatment with metformin (UKPDS‐34 1998). In particular, the absolute risk reduction for the aggregate endpoints was more than 10% and for overall mortality was 7%, giving NNTs of 10 and 14, respectively, over 10 years (McCormack 2003). The UKPDS was criticised on several grounds especially emphasising hidden biases in interpreting the results of this randomised controlled trial (Ewart 2001; McCormack 2003; Nathan 1998). Stratton et al. in their UKPDS‐35 publication are often cited, who tried to determine the relation between exposure to glycaemia over time and the risk of macrovascular or microvascular complications in the UKPDS patients (Stratton 2000). This publication is an epidemiological re‐interpretation of UKPDS data proclaiming that with each 1% reduction in mean HbA1c, reductions in risk of 21% for deaths related to diabetes and 14% for myocardial infarction could be observed. The RCT itself, though, did not show significant differences in this respect. Moreover, the UKPDS‐38, investigating tight versus less tight blood pressure control with the use of an angiotensin converting enzyme inhibitor captopril or a β‐blocker atenolol as main treatment, showed relative risk reductions (in the group assigned to tight control compared with that assigned to less tight control) of 24% in diabetes related endpoints, 32% in deaths related to diabetes, 44% in strokes and 37% in microvascular endpoints (UKPDS‐38 1998). Due to the factorial design of the UKPDS with two interventions (improvement in metabolic and blood pressure control) aiming at the same outcomes, a fair interpretation of the data needs investigation of the interaction between the two main treatment strategies (McAlister 2003; Montgomery 2003). UKPDS data should be available to the scientific public to evaluate, among other things, the importance of the individual contribution of improved glucose versus blood pressure control in type 2 diabetes mellitus. Unfortunately, until now this has not happened. Therefore, any new compound in the treatment of type 2 diabetes mellitus, like rosiglitazone, should not only be evaluated with regards to surrogate outcomes (for example reductions in fasting plasma glucose or HbA1c) but information is urgently needed for the influence of any antidiabetic agent especially on cardiovascular endpoints, which is the greatest problem in the therapy of type 2 diabetes mellitus. Quite a number of health technology assessment reports, (narrative) reviews, systematic reviews and meta‐analyses analysed interventions with rosiglitazone in diabetes (Bloomgarden 2005; Boucher 2002; Boucher 2003; Chiquette 2004; Cox 2004; Czoski‐Murray 2004; Kreider 2002; Lebovitz 2002; Malinowski 2000; Mukhtar 2005; NICE 2000; NICE 2003; NICE 2003b; Wagstaff 2002; Wellington 2005). All of them either suffer from methodological problems like insufficient quality assessment of primary studies, focus on surrogate outcomes or are out‐of‐date. This systematic review tries to collate all available data from RCTs of rosiglitazone treatment and evaluates how many studies investigated patient‐oriented outcomes like mortality, cardiovascular endpoints, adverse events and health‐related quality of life.
A Cochrane review on the effects of pioglitazone treatment has already been published (Richter 2006). For changes to the published protocol see Appendix 12.
As this review contributes to the ongoing critical appraisal of RCTs investigating the risk‐benefit ratio of thiazolidinedione use by the German Institute for Quality and Efficiency in Health Care ('Institut fuer Qualitaet und Wirtschaftlichkeit im Gesundheitswesen ‐ IQWiG), additional data (for example raw data from pharmaceutical companies often provided to IQWiG) of relevance might be included in further updates.
Objectives
To assess the effects of rosiglitazone in the treatment of type 2 diabetes.
Methods
Criteria for considering studies for this review
Types of studies
Randomised controlled trials.
Types of participants
Adult persons (18 years or older) with type 2 diabetes mellitus. To be consistent with changes in classification and diagnostic criteria of type 2 diabetes mellitus through the years, the diagnosis should have been established using the standard criteria valid at the time of the beginning of the trial (for example ADA 1997; ADA 1999; WHO 1980; WHO 1985; WHO 1998). Ideally, diagnostic criteria should have been described. If necessary, authors' definition of type 2 diabetes mellitus was used. It was planned to subject diagnostic criteria to a sensitivity analysis.
Types of interventions
Therapy with rosiglitazone for a minimum of 24 weeks. The following comparisons were acceptable for evaluation:
rosiglitazone versus placebo;
rosiglitazone versus another oral antidiabetic medication (meglitinide analogues, metformin, pioglitazone, sulphonylureas);
rosiglitazone in combination with an oral antidiabetic medication or insulin versus a combination of an oral antidiabetic medication or insulin (agents and treatment schemes had to be identical).
Excluded interventions
Combination therapies consisting of different compounds in the treatment arms (for example rosiglitazone plus metformin versus uptitration of metformin or rosiglitazone plus gliclazide versus gliclazide). Another Cochrane review will investigate rosiglitazone‐metformin combination therapies including different treatment regimens of these compounds. Furthermore, dipeptidyl peptidase‐4 (DPP‐4) inhibitors for type 2 diabetes mellitus are excluded, since these are the topic of another Cochrane review (Richter 2007), as well as glucagon‐like peptide analogues for type 2 diabetes mellitus (Cochrane review, Snaith 2007).
Types of outcome measures
Primary outcomes
mortality (all‐cause mortality; diabetes related mortality (death from myocardial infarction, stroke, peripheral vascular disease, renal disease, hyper‐ or hypoglycaemia or sudden death));
morbidity (all‐cause morbidity as well as diabetes and cardiovascular related morbidity, for example angina pectoris, myocardial infarction, stroke, peripheral vascular disease, neuropathy, retinopathy, nephropathy, erectile dysfunction, amputation);
adverse events (for example hypoglycaemia, congestive heart failure, oedema).
Secondary outcomes
health‐related quality of life (using a validated instrument);
costs;
metabolic control as measured by glycosylated haemoglobin A1c (HbA1c).
Covariates, effect modifiers and confounders
compliance;
co‐morbidities (for example myocardial infarction, stroke);
co‐medication (for example antihypertensive drugs, aspirin);
age.
Timing of outcome measurement
Outcomes were assessed in the medium (24 weeks to less than 12 months of treatment) and long term (12 months or more of treatment).
Search methods for identification of studies
Electronic searches
We used the following sources for the identification of trials:
The Cochrane Library (issue 1, 2007);
MEDLINE ‐ OVID interface (until April 2007);
EMBASE ‐ OVID interface (until April 2007).
We also searched databases of ongoing trials: Current Controlled Trials (www.controlled‐trials.com ‐ with links to other databases of ongoing trials). The described search strategy (see for a detailed search strategy Appendix 1) was used for MEDLINE. For use with EMBASE and The Cochrane Library this strategy was slightly adapted.
Additional key words of relevance were not identified during any of the electronic or other searches. If this had been the case, electronic search strategies would have been modified to incorporate these terms. Studies published in any language were included.
Searching other resources
We tried to identify additional studies by searching the reference lists of included trials and (systematic) reviews, meta‐analyses and health technology assessment reports identified.
Data collection and analysis
Selection of studies
To determine the studies to be assessed further, two authors (BR in combination with all the other authors) independently scanned the abstract or titles, or both sections of every record retrieved. All potentially relevant articles were investigated as full text. Interrater agreement for study selection was measured using the kappa statistic (Cohen 1960). Where differences in opinion existed, they were resolved by a third party (other authors). If resolving disagreement was not possible, the article would have been added to those 'awaiting assessment' and authors would have been contacted for clarification. An adapted QUOROM (quality of reporting of meta‐analyses) flow‐chart of study selection is attached (Moher 1999).
Dealing with duplicate publications
In the case of duplicate publications and companion papers of a primary study, we tried to maximise yield of information by simultaneous evaluation of all available data. In cases of doubt, the original publication (usually but not always the oldest version) obtained priority.
Data extraction and management
For studies that fulfilled inclusion criteria, two authors (BR in combination with all the other authors) independently abstracted relevant population and intervention characteristics using standard data extraction templates (for details see Characteristics of included studies and Appendix 2 to Appendix 16) with any disagreements to be resolved by discussion, or if required by a third reviewer. The data extraction form was pilot tested prior to use and modified. Any relevant missing information on the trial would have been sought from the original author(s) of the article, if required.
Assessment of risk of bias in included studies
Two authors (BR in combination with all the other authors) assessed each trial independently. Possible disagreement was resolved by consensus, or with consultation of a third reviewer in case of disagreement. We planned to explore the influence of individual quality criteria in a sensitivity analysis (see under 'sensitivity analyses'). Interrater agreement for key quality indicators (concealment of allocation, blinding, attrition rates) was planned to be calculated using the kappa statistic (Cohen 1960). In cases of disagreement, the rest of the group was consulted and a judgement was made based on consensus.
Measures of treatment effect
Dichotomous data
Dichotomous outcomes (for example stroke yes/no) were planned to be expressed as odds ratios (OR) or relative risks (RR) with 95% confidence intervals (CI).
Continuous data
Continuous outcomes (for example metabolic control as measured by glycosylated haemoglobin A1c (HbA1c) were planned to be expressed, if possible, as mean differences with 95% CI.
Time‐to‐event data
Time‐to‐event outcomes (for example time until death) were planned to be expressed as hazard ratios (HR) with 95% CI.
Unit of analysis issues
Different units of analysis (for example OR and RR) were planned to be subjected to a sensitivity analysis.
Dealing with missing data
Relevant missing data were planned to be obtained from authors. Evaluation of important numerical data such as screened, eligible and randomised patients as well as intention‐to‐treat and per‐protocol population was carefully performed. Drop‐outs, misses to follow‐up and withdrawn study participants were investigated. Issues of last‐observation‐carried‐forward (LOCF) were critically appraised and compared to specification of primary outcome parameters and power calculation.
Assessment of heterogeneity
In the event of substantial clinical or methodological or statistical heterogeneity, study results were not planned to be combined in a meta‐analysis. Heterogeneity was identified by visual inspection of the forest plots, by using a standard χ2‐test and a significance level of α = 0.1, in view of the low power of such tests. Quantification of heterogeneity was also examined with I2, ranging from 0% to 100% including its 95% confidence interval (Higgins 2002). I2 demonstrates the percentage of total variation across studies due to heterogeneity and was used to judge the consistency of evidence. I2 values of 50% and more indicate a substantial level of heterogeneity (Higgins 2003). When heterogeneity was found, we attempted to determine potential reasons for it by examining individual study characteristics and those of subgroups of the main body of evidence.
Assessment of reporting biases
Funnel plots were planned to be used in exploratory data analyses to assess for the potential existence of small study bias. There are a number of explanations for the asymmetry of a funnel plot, including true heterogeneity of effect with respect to study size, poor methodological design of small studies and publication bias (Sterne 2001). Thus, this exploratory data tool may be misleading (Lau 2006; Tang 2000; Thornton 2000) and we did not place undue emphasis on this tool.
Data synthesis
Data were planned to be summarised statistically if they were available, sufficiently similar and of sufficient quality. Statistical analysis was planned to be performed according to the statistical guidelines referenced in the newest version of the Cochrane Handbook for Systematic Reviews of Interventions (Higgins 2005). Pooled results were planned to be analysed using primarily a fixed‐effect model. Meta‐regression was planned to be performed using Stata/SE (version 8, Stata Corporation, Texas USA) to determine whether various study‐level characteristics (for example follow‐up interval, duration of the intervention, total attrition, year of publication) affected the between‐group changes in primary outcomes. We planned to examine interaction terms for all models.
Subgroup analysis and investigation of heterogeneity
Subgroup analyses were planned to be performed only if one of the primary outcome parameters demonstrated statistically significant differences between treatment groups. The following subgroup analyses were planned:
gender (female versus male);
age (depending on data but especially older versus younger patients);
patients with or without co‐morbidities (for example heart attack, stroke, peripheral vascular disease);
patients with or without co‐medication (for example antihypertensive drugs, statins, aspirin).
Subgroup analyses were planned to be mainly used to explore clinical or methodological or statistical heterogeneity.
Sensitivity analysis
We planned to perform sensitivity analyses in order to explore the influence of the following factors on effect size:
repeating the analysis excluding unpublished studies;
repeating the analysis taking account of study quality, as specified above;
repeating the analysis excluding any very long or large studies to establish how much they dominate the results;
repeating the analysis excluding studies using the following filters: diagnostic criteria, language of publication, source of funding (industry versus other), country.
The robustness of the results was also planned to be tested by repeating the analysis using different measures of effects size (risk difference, odds ratio etc.) and different statistical models (fixed and random‐effects models).
Results
Description of studies
Results of the search
The initial search identified 6058 records with eight additional publications from reference lists; from these, 40 full papers were singled out for further examination. The other studies were excluded on the basis of their abstracts or titles because they were not relevant to the question under study (see Figure 1 for details of the amended QUOROM (quality of reporting of meta‐analyses) statement). After screening the full text of the selected papers, 32 publications describing 18 studies finally met the inclusion criteria.
1.

QUOROM (quality of reporting of meta‐analyses) flow‐chart of study selection
Most studies of at least 24 weeks rosiglitazone treatment were published in the years 2005 to 2007 (10 trials), with the first study was published in 2001.
Assessment of publication bias inter‐rater agreement
Inter‐rater agreement for study selection, that is qualifying a study as 'included' or 'potentially relevant' was 95%.
Included studies
For details see Characteristics of included studies.
Interventions
Comparisons
Ten of the 18 included publications investigated rosiglitazone monotherapy versus another monotherapy (12 monotherapy arms), eight publications evaluated the combination of rosiglitazone with another glucose‐lowering intervention versus a comparable combination.
Monotherapy
Five study arms compared rosiglitazone to placebo.
Three study arms investigated rosiglitazone versus metformin, two versus glyburide and one each versus repaglinide or pioglitazone.
Combination therapy
Eight publications investigated rosiglitazone combination therapy versus a similar combination with another compound.
Two studies evaluated glimepiride and metformin combination, and one glibenclamide plus metformin, pioglitazone plus metformin or pioglitazone plus glimepiride, respectively.
Three publications reported on triple combination comparisons (sulphonylurea or glimepiride plus metformin plus insulin).
Number of study centres
Number of study centres ranged between one and 488, the multicentre design was dominant with a median of 31 study centres. Seven trials involved a substantial number of more than 40 study centres (Garber 2006; Goldberg 2005; Hanefeld 2007; Kahn 2006; Lebovitz 2001; Phillips 2001; Rosenstock 2006b ).
Country and location
Ten studies were performed in the USA and Canada , six in Europe, one in Latin America, and one in China, Korea an Taiwan, respectively (summarising to more than 18 studies due to multinational designs).
Setting
Eight publications presented some details about the study setting, like recruitment of participants.
Treatment before study
If stated, most studies specified that pharmacotherapy like sulphonylureas, metformin or both were used by participants before entering the study. In two studies participants were treated by diet, exercise or both, only (Hällsten 2002; Kahn 2006).
Methods
Duration of the intervention
Median treatment duration lasted 26 weeks, the longest trial had a median duration of four years (Kahn 2006).
Duration of follow‐up
Treatment duration and follow‐up were identical in all studies, no post‐intervention follow‐up was reported.
Run‐in period
Ten studies described run‐in periods. These usually lasted four weeks where previous antidiabetic medication was stopped, titration of new medication started or a placebo intervention initiated.
Language of publication
All included studies were published in English.
Participants
Who participated
Study participants were mainly white individuals with type 2 diabetes mellitus, in two studies the entire cohort was pharmaco‐naive (that is, people treated with diet only ‐ Hällsten 2002; Kahn 2006).
Inclusion criteria
Investigators specified various inclusion criteria, such as diet non‐responders, sulphonylureas or metformin, or both failures and certain glycosylated haemoglobin A1c (HbA1c) levels.
Exclusion criteria
Investigators specified various exclusion criteria. Nine of 18 included studies stipulated specific exclusion criteria for the severity of congestive heart failure (NYHA (New York Heart Association) classification): Seven studies mentioned NYHA class III or IV and two studies NYHA I or above (including the biggest trial, the ADOPT (A Diabetes Outcomes Progression Trial) study ‐ Kahn 2006).
Diagnostic criteria
Twelve studies provided some details of diagnostic criteria for type 2 diabetes mellitus.
Co‐morbidities
Only four studies presented data on co‐morbidities (Goldberg 2005; Jung 2005; Stocker 2007; Sutton 2002 ).
Co‐medications
Six of the 18 included studies reported co‐medications, either glucose‐lowering drugs or medication for other disorders, or both (Derosa 2004; Derosa 2006b; Jung 2005; Kahn 2006; Ko 2006; Stocker 2007).
Outcomes
Primary outcomes
Most studies investigated HbA1c and lipid parameters (such as total cholesterol, high‐density and low‐density lipoprotein cholesterol, triglycerides) as primary endpoints.
Secondary and additional outcomes
Most studies evaluated lipid parameters, fasting and non‐fasting plasma glucose, adverse events, insulin, HbA1c, C‐peptide and indicators for insulin resistance as secondary outcomes.
Missing data
For this version of the review no author was contacted for additional data. As this review contributes to the ongoing critical appraisal of RCTs investigating the risk‐benefit ratio of thiazolidinedione use by the German Institute for Quality and Efficiency in Health Care ('Institut fuer Qualitaet und Wirtschaftlichkeit im Gesundheitswesen ‐ IQWiG), additional data (for example raw data from pharmaceutical companies often provided to IQWiG) of relevance might be included in further updates.
Excluded studies
Twenty‐two publications had to be excluded after careful evaluation of the full publication. Main reasons for exclusion were trial duration of less than 24 weeks or non comparable treatment regimens (for details see 'Characteristics of excluded studies').
Risk of bias in included studies
For details on methodological quality of included studies see Appendix 13 to Appendix 16.
Overview
All included trials were of a parallel study design. No crossover studies or factorial trials fulfilling the inclusion criteria were detected. Two of the 18 included studies primarily specified a non‐inferiority or equivalence design (Hanefeld 2007; Sutton 2002) with both trials specifying a 95% confidence interval (CI) of equivalence. The other studies investigated superiority or inferiority of rosiglitazone versus comparator compounds. Interrater agreement for the key quality indicators randomisation, concealment of allocation and blinding was 95%.
Allocation
All included studies were randomised controlled clinical trials of parallel design and randomised individuals. The method of randomisation was somewhat specified in five studies (Derosa 2004; Derosa 2006b; Goldberg 2005; Kahn 2006; Stocker 2007), four studies specified a randomisation ratio other than 1:1, that is randomisation numbers were a‐priori not equal between rosiglitazone and comparator drugs (Hanefeld 2007; Kahn 2006; Phillips 2001; Raskin 2004). Four studies particularized concealment of allocation (Derosa 2004; Derosa 2006a; Kahn 2006; Stocker 2007).
Blinding
Eleven studies had a double‐blind, five studies an open‐label design and two publications (Jung 2005; Ovalle 2004) did not lay down information on blinding. No publication reported checking of blinding conditions.
Incomplete outcome data
Screened and randomised patients
Nine studies or 50% of publications reported numbers of screened patients (Garber 2006; Goldberg 2005; Hanefeld 2007; Kahn 2006; Lebovitz 2001; Phillips 2001; Rosenstock 2006b; Stocker 2007; Yang 2002), ranging from 120 to 6676 screened patients with a median of 643 participants. Altogether approximately 3888 participants were randomised to rosiglitazone treatment and 4544 to control therapy, summing up to 8432 individuals taking part in the included studies. A single study contributed 52% of randomised individuals (Kahn 2006).
Discontinuing participants and attrition rates
Six studies described discontinuing participants and provided some details about the reasons for terminating the trial (Goldberg 2005; Hanefeld 2007; Ko 2006; Rosenstock 2006b; Stocker 2007; Sutton 2002). Discontinuation rates in the rosiglitazone arms varied between five and 40% (between four and 44% in control groups), with five studies reporting high drop‐out rates above 20% (Hanefeld 2007; Kahn 2006; Lebovitz 2001; Raskin 2004; Sutton 2002). Discontinuation rates between intervention and control groups were dissimilar in six studies (Garber 2006; Hanefeld 2007; Jung 2005; Rosenstock 2006b; Stocker 2007; Sutton 2002). Five studies did not report details on attrition rates.
Intention‐to‐treat and per‐protocol analyses, missing data
Thirteen of the 18 included studies reported an intention‐to‐treat analysis, three trials a per‐protocol evaluation and two both (Goldberg 2005; Sutton 2002). Intention‐to‐treat was clearly defined in 11 studies. Six studies used the last‐observation‐carried‐forward (LOCF) imputation method for missing data (Hanefeld 2007; Lebovitz 2001; Phillips 2001; Rosenstock 2006b; Sutton 2002). For example, a study of 12 months duration could extrapolate missing glycosylated haemoglobin A1c (HbA1c) values for randomised patients and declare these as endpoints, if the first post‐randomisation HbA1c value (for example after three months) was available. Two studies used other methods for imputation. A clear definition of the LOCF population was provided by one study, only (Lebovitz 2001).
Other potential sources of bias
Definition of primary endpoint and secondary endpoints
Ten studies clearly defined primary endpoints in association with power calculations, mostly one outcome, with one study presenting more than one parameter (Derosa 2006b). The number of secondary endpoints, if stated as such, varied between two and 16. The total number of detailed endpoints in the included studies ranged from seven to 17 with a mean of seven endpoints. Only four studies adjusted for multiple outcomes, repeated measurements, or both (Derosa 2004; Derosa 2006b; Ko 2006; Phillips 2001).
Power calculation
Seven studies showed details of power calculation, the calculated number of participants per group ranged from 40 to approximately 1394.
Compliance measures
Five of the 18 included studies tried to investigate patients' compliance with the recommended treatments (Derosa 2004; Derosa 2006a; Derosa 2006b; Hällsten 2002; Stocker 2007).
Funding
Ten studies reported commercial funding, six publications did not indicate possible funding sources (Derosa 2004; Derosa 2006b; Ko 2006; Lebovitz 2001; Phillips 2001; Sutton 2002).
Publication status
Sixteen studies were published in peer review journals, none was circulated as a journal supplement.
Effects of interventions
Baseline characteristics
For details of baseline characteristics see Appendix 2, Appendix 3, Appendix 4 and Appendix 5.
Six studies demonstrated clinically relevant differences between intervention and control groups, for example gender ratio (Garber 2006; Kahn 2006; Ko 2006; Raskin 2004; Rosenstock 2006b; Stocker 2007). More men then women participated in the studies, in the rosiglitazone arms women's involvement ranged between 25% and 57%. The mean age of patients randomised to rosiglitazone treatment encompassed 47 to 61 years. Studies in established type 2 diabetes patients and providing disease information (N = 13 ) showed a diabetes duration of four to 9 years. The main ethnic group participating in the trials consisted of white people, a few studies included other ethnic populations as well. Pharmaco‐naive patients usually constituted a minor part of the study participants, but two studies exclusively investigated this group (Hällsten 2002; Kahn 2006), including the largest trial (the ADOPT (A Diabetes Outcomes Progression Trial) study ‐ Kahn 2006). Most study participants with type 2 diabetes mellitus were also overweight or obese, the mean body mass indices (BMI) in patients randomised to rosiglitazone therapy ranged between 23.3 and 33.6 kg/m2 (mean BMI of 29 kg/m2). Baseline metabolic control as measured by mean glycosylated haemoglobin A1c (HbA1c) varied in the rosiglitazone arms between 6.8% and 9.5%, with a mean of 8.8%.
Primary outcomes
For details of primary outcomes see Appendix 10.
Mortality
No study included mortality as a primary or secondary endpoint. The ADOPT trial investigated rosiglitazone, metformin and glyburide (glibenclamide) as initial treatment for recently diagnosed type 2 diabetes mellitus by means of a double‐blind RCT involving more than 4000 patients (Kahn 2006). Eligible participants were between 30 and 75 years, with fasting plasma glucose levels between 126 to 180 mg/dl (7.0 to 10.0 mmol/L) and were treated by life style management only. The primary outcome was the time from randomisation to treatment failure. Treatment failure was defined as confirmed hyperglycaemia, that is fasting plasma glucose levels greater than 180 mg/dl on consecutive testing or according to the decision of an independent adjudication committee. Median duration of treatment was 4.0 years for rosiglitazone and metformin and 3.3 years for glyburide. At five years, when around 20% of the original cohort was being followed, the reported cumulative incidence of treatment failure was 15% in the rosiglitazone group and 21%/34% in the metformin/glyburide group, respectively. The mean HbA1c level at four years compared to max. 2g/day metformin and max. 15 mg/day glyburide, was 0.1% and 0.4% less after max. 8 mg/day rosiglitazone therapy. Attrition rates were high in the ADOPT study: 37%, 38% and 44% did not finish the study in the rosiglitazone, metformin and glyburide groups. Mortality data were reported in Table 2 of the publication ('Adverse events, laboratory assessment, concomitant use of cardiovascular drugs, hospitalization, and death'): All‐cause mortality was 34/1456 (2.3%) in the rosiglitazone group, 31/1454 (2.1%) in the metformin group and 31/1441 (2.2%) in the glyburide group.
Morbidity
No study included morbidity like diabetic complications as a primary or secondary endpoint. Eight studies made some statement about the number of participants who died during the course of the trial (Derosa 2004; Derosa 2006b; Goldberg 2005; Hällsten 2002; Hanefeld 2007; Kahn 2006; Stocker 2007; Yang 2002). The ADOPT trial (Kahn 2006) reported some data in Table 2 of the publication ('Adverse events, laboratory assessment, concomitant use of cardiovascular drugs, hospitalization, and death'):
Hospitalisation for any cause was comparable between the rosiglitazone, metformin and glyburide groups (11.6%, 11.8% and 10.4% of patients, respectively).
Cardiovascular disease [no (%)] of serious / total events was increased in the rosiglitazone compared to the glyburide group:
rosiglitazone 49 (3.4) / 62 (4.3)
metformin 46 (3.2) / 58 (4.0)
glyburide 26 (1.8) / 41 (2.8)
Investigator reported total events [no (%)] of congestive heart failure happened more often in the rosiglitazone compared to the glyburide group:
rosiglitazone 22/1456 (1.5)
metformin 19/1454 (1.3)
glyburide 9/1441 ( 0.6)
Peripheral vascular disease [no (%)] of serious / total events data were as follows:
rosiglitazone 7 (0.5) / 36 (2.5)
metformin 6 (0.4) / 27 (1.9)
glyburide 4 (0.3) / 31 (2.2)
Adverse events
For details of adverse events see Appendix 6, Appendix 7, Appendix 8 and Appendix 9.
The percentage of overall adverse events was comparable between the intervention and control groups, serious adverse events appeared to happen somewhat more often after rosiglitazone treatment (median of 6% versus 4% in the control groups). Median discontinuation rate following rosiglitazone administration was also higher than after control therapy (median of 7% versus 4%). Three studies evaluated and reported a more pronounced (apparently dose‐related) decrease of haemoglobin after rosiglitazone intake in comparison to other active compounds or placebo. Haemoglobin reductions ranged between 0.5 and 1.0 g/dl. Eleven studies evaluated body weight and observed an increase up to 5.0 kg after rosiglitazone treatment, four studies described changes in body mass index up to a rise of 1.5 kg/m2. Seven of the 18 included studies showed data on hypoglycaemic episodes: Compared to active monotherapy control rosiglitazone treatment resulted in somewhat lower rates of hypoglycaemia, especially when compared to sulphonylureas. Severe hypoglycaemic events were rarely reported.
Data on the specific adverse event "oedema" were available in nine of 18 studies. Overall, 4739 participants provided information on the occurrence of oedema. The total number of events was 287 in the rosiglitazone and 134 in the control groups. Pooling of the nine studies by means of fixed‐effect meta‐analysis revealed an odds ratio of 2.27 (95% confidence interval (CI) 1.83 to 2.81, P < 0.00001). The test for heterogeneity indicated an I2‐value of 53.4%. The use of a random‐effects model resulted in an odds ratio of 4.62 (95% CI 2.28 to 9.38, P < 0.00001). The robustness of this result was tested by repeating the analysis using the risk ratio as a different measure of effect size, demonstrating a relative risk of 2.10 (95% CI 1.72 to 2.55) for the fixed‐effect model. Since oedema event rates in most studies were below 10%, application of the odds ratio appeared to be the more valid parameter. We repeated the analysis excluding the large ADOPT study which had a weight of 89.4% in the fixed‐effect model. The odds ratio in the fixed‐effect model now was 6.04 (95% CI 3.31 to 11.02, P < 0.00001) and 6.79 (95% CI 3.76 to 12.25, P < 0.00001). Heterogeneity decreased to an I2 of 0%. The point estimate for the ADOPT study only was 1.76 (95% CI 1.39 to 2.22).
Furthermore, the ADOPT study provided additional data on fracture rates:
Men [n] fractures(%)
rosiglitazone 32 (3.95)
metformin 29 (3.36)
glyburide 28 (3.35)
Women [n] fractures(%)
Total
rosiglitazone 60 (9.30)
metformin 30 (5.08)
glyburide 21 (3.47)
Lower limb
rosiglitazone 36 (5.58)
metformin 18 (3.05)
glyburide 8 (1.32)
Upper limb
rosiglitazone 22 (3.41)
metformin 10 (1.69)
glyburide 9 (1.49)
Spinal
rosiglitazone 1 (0.16)
metformin 1 (0.17)
glyburide 1 (0.17)
Secondary outcomes
For details of secondary outcomes see Appendix 11.
Health‐related quality of life
No study investigated health‐related quality of life.
Costs
Only one study reported some data on costs of rosiglitazone therapy (Rosenstock 2006b). Rosiglitazone 8 mg/day plus 2 g/day metformin plus sulphonylurea agents were compared to the combination therapy 10 units/day insulin glargine plus 2 g/day metformin plus sulphonylurea agents. Overall, the estimated mean total cost of glycaemic control over 24 weeks was $235 lower among participants treated with insulin glargine ($1368) compared with rosiglitazone ($1603).
Metabolic control as measured by glycosylated haemoglobin A1c (HbA1c)
Active glucose‐lowering compounds like metformin, glibenclamide, or glimepiride resulted in similar reductions of HbA1c compared to rosiglitazone treatment.
Heterogeneity
Only adverse events (oedema) as one of our primary outcomes could be subjected to meta‐analysis. Heterogeneity as indicated by I2 was 53.4% but could be significantly reduced after elimination of the biggest trial by Kahn et al (Kahn 2006).
Subgroup analyses
Not performed due to lack of data.
Sensitivity analyses
Various sensitivity analyses did not change substantially the risk estimates for development of oedema after rosiglitazone treatment.
Publication bias
Not performed due to insufficient amounts of data.
Discussion
Summary of main results
This systematic review shows that published studies of at least 24 weeks rosiglitazone treatment in people with type 2 diabetes mellitus did not provide evidence that patient‐oriented outcomes like mortality, morbidity, adverse effects and health‐related quality of life are positively influenced by this compound. Metabolic control measured by glycosylated haemoglobin A1c (HbA1c) as a surrogate endpoint did not demonstrate clinically significant differences to other oral antidiabetic drugs. One study investigated economic costs of rosiglitazone versus insulin glargine therapy indicating lower costs of insulin glargine treatment. Occurrence of oedema was approximately doubled.
New safety data
The insulin‐sensitising thiazolidinediones pioglitazone and rosiglitazone act as potent inhibitors of the peroxisome‐proliferator‐activator receptor (PPAR) γ. Several PPARs exist with different expressions in various tissues. Activation of PPAR‐γ by thiazolidinediones may cause an increase in bone marrow adiposity and a decrease in osteoblastogenesis, resulting in reduced bone formation. Several publications of animal and human data are available (Ali 2005; Grey 2007; Lazarenko 2007; Schwartz 2006a; Schwartz 2006b; Yaturu 2007). To our knowledge, the ADOPT (A Diabetes Outcomes Progression Trial) ‐ Kahn 2006) study was the first randomised controlled clinical trial which demonstrated increased rates of fractures in women. According to the pharmaceutical company producing pioglitazone, a re‐analysis of the PROactive (Prospective Pioglitazone Clinical Trial In Macrovascular Events) study (Dormandy 2005) showed that 44/870 (5.1%) fractures were observed in pioglitazone treated female patients compared to 23/905 (2.5%) controls. It is unclear why it took so long to analyse adverse events in an appropriate way. Adverse reactions on fracture rates only showed up in a "Note added in proof" in the New England Journal of Medicine (Kahn 2006) and the PROactive study publication did not mention this side effect at all (Dormandy 2005). For an adequate analysis of possible adverse events of published and unpublished data adverse events information should be freely available to the public and researches alike which should pose no problems with nowadays information technology. Just before finishing this review a meta‐analysis on the effect of rosiglitazone on the risk of myocardial infarction and death from cardiovascular causes was published (Nissen 2007). Nissen and Wolski analysed 42 trials of rosiglitazone treatment with a study duration of more than 24 weeks. They found in the rosiglitazone group, as compared with the control group, a significant increase of the odds ratio for myocardial infarction of 1.43 (95% confidence interval (CI) 1.03 to 1.98, P = 0.03. The odds ratio for death from cardiovascular causes was 1.64 (95% CI 0.98 to 2.74, P = 0.06). Consequently, the US Food and Drug Administration (FDA), the European Medicines Agency (EMEA) and GlaxoSmithKline issued statements and warnings with regards to this meta‐analysis. Using the data from Nissen and Wolski we performed another meta‐analysis of the myocardial infarction rates for type 2 diabetes only, analysing all studies, rosiglitazone versus monotherapy and rosiglitazone versus combination therapies (in the original publication several other conditions were included as well to investigate the overall cardiovascular risk of rosiglitazone). So far and limited to the sparse data available, we could not confirm significant differences in odds ratios of rosiglitazone versus controls. On the other hand, all odds ratios (with the exception of the comparator glyburide ‐ three studies only) indicated an increased risk of rosiglitazone treatment, albeit not a statistically significant difference. Moreover, it is disturbing to hear that the manufacturer of rosiglitazone (Avandia) provided the FDA with a pooled analysis of 42 RCTs in which rosiglitazone was compared to either placebo or other antidiabetic therapies in patients with type 2 diabetes. The meta‐analysis suggested that patients receiving short‐term (most studies were of six months duration) treatment with rosiglitazone may have a 30% greater relative risk of heart attacks and other heart‐related adverse events than patients treated with placebo or another antidiabetic therapy. Questions of timing of this information and how it was circled arise. Ongoing trials using rosiglitazone (RECORD) may provide additional data but for a drug which was approved in 1999, the delay in obtaining information about the benefit‐risk ratio is considerable.
The one major ongoing study (RECORD) which eventually could contribute valuable information about the role of rosiglitazone treatment in type 2 diabetes mellitus (for details see Characteristics of ongoing studies). In the FDA statement 'FDA issues safety alert on Avandia' it is mentioned that "... other published and unpublished data from long‐term clinical trials of Avandia, including an interim analysis of data from the RECORD trial (a large, ongoing, randomized open label trial) and unpublished re analyses of data from DREAM (a previously conducted placebo‐controlled, randomized trial) provide contradictory evidence about the risks in patients treated with Avandia." We do hope that the conduct, analysis and interpretation of this trial will reflect high quality scientific standards and will not resemble the dishonourable events which accompanied the PROactive study (for more details, see Richter 2006). We agree with the commentators on the Nissen and Wolski publication that current drug approval for antidiabetic medications and possibly all new drugs needs to be changed (Psaty 2007). The benefit‐risk ratio of rosiglitazone therapy in type 2 diabetes mellitus needs urgent clarification.
Potential biases in the review process
We focused on a minimum duration of 24 weeks rosiglitazone therapy in order to have a chance to detect clinically meaningful differences in patient‐oriented parameters. Theoretically, studies of a shorter duration could demonstrate a significant impact on these outcomes but this is highly unlikely, even with regards to important adverse events. Moreover, it was difficult to separate primary studies from companion papers because the latter quite often did not identify themselves as an additional publication of a parent study; especially authors Derosa et al did not reference multiple publications to each other (for details see 'References of included studies', primary studies are marked by an asterisk).
Authors' conclusions
Implications for practice.
This systematic review shows that published studies of at least 24 weeks rosiglitazone treatment in people with type 2 diabetes mellitus did not provide evidence that patient‐oriented outcomes like mortality, morbidity, adverse effects and health‐related quality of life are positively influenced by this compound. Metabolic control measured by glycosylated haemoglobin A1c (HbA1c) as a surrogate endpoint did not demonstrate clinically significant differences to other oral antidiabetic drugs. Occurrence of oedema was approximately doubled. New safety data on increased rates of fractures and possibly the risk of myocardial infarction and cardiovascular disease should lead to a very cautious approach to rosiglitazone use. If possible, other antidiabetic medications should be employed.
Implications for research.
Patient‐oriented endpoint studies are urgently needed for the management of type 2 diabetes mellitus. The use of proxy indicators like metabolic control is not sufficient to approve drugs which many patients have to take for the rest of their lives. It appears questionable whether new studies with rosiglitazone will be ethical given the fact that less dangerous therapeutic alternatives exist.
Feedback
Dollow, July 2007
Summary
The following query was made on 18 July 2007:
The Cochrane Collaboration has a reputation for robustness of analysis and integrity of data interpretation. Therefore, it was disappointing to read the conclusions made in the recent Cochrane Review written by Richter et al, titled, "Rosiglitazone for type 2 diabetes mellitus."
The authors drew conclusions regarding the impact of rosiglitazone on mortality and morbidity by reviewing a limited number of short term studies (18) primarily designed to assess glycaemic control. This analysis cannot provide a full picture of all the research conducted with rosiglitazone. The conclusions provide no new evidence about the role of rosiglitazone in clinical practice. In addition, the conclusions regarding cardiovascular safety disagree with the authors' own meta‐analysis on myocardial infarction which could not confirm an increased risk.
The studies assessed in the review contained no stratification for baseline cardiovascular risk, leading to unavoidable imbalances between rosiglitazone and control groups. Most importantly the authors fail to include the interim findings of RECORD(1), a prospective long‐ term study primarily designed to evaluate the profile of rosiglitazone with respect to cardiovascular disease. The RECORD(1) data was available as an online publication some six weeks prior to the publication of this review. Its exclusion is surprising and adds question to the robustness of the authors' conclusions.
Questions about the safety of rosiglitazone should be answered by reviewing all relevant evidence, in particular long‐term prospective trials. The conclusion regarding the cardiovascular data from ADOPT(2,3) are puzzling, given that in ADOPT(2,3) all major adverse cardiovascular events (MACE) were analysed and found to be rare in this population and comparable for all treatments ‐ rosiglitazone, glibenclamide and metformin.. Additionally, no excess in mortality with rosiglitazone was seen overall. The significant benefits of rosiglitazone in maintaining the duration of glycaemic response in ADOPT(2) are unfortunately not given similar prominence.
The interim findings of RECORD(1), the only study specifically designed to look at cardiovascular outcomes with rosiglitazone, does not show evidence of a difference in cardiovascular death between rosiglitazone and control groups. Additionally, no significant differences for myocardial infarction between groups were seen.
The totality of the data ‐ including long‐term studies such as ADOPT(2) and RECORD(3) and a real‐world epidemiological analysis of 33,000 patients(5) ‐ show that rosiglitazone has a comparable ischaemic cardiovascular profile to the most commonly used oral anti‐diabetic medicines, metformin and sulphonylureas.
With respect to the analysis of glycaemic efficacy, it is puzzling that the authors excluded a number of studies which are applicable to decisions made in clinical practice, such as Bailey et al(4) in which uptitration of metformin is compared with metformin and rosiglitazone. Additionally, whilst a significant decrease in the rate of hypoglycaemia associated with rosiglitazone is reported in the results section of the review, this is not referred to in the authors' conclusions. Instead, only oedema is mentioned, which is a well recognised side‐effect of thiazolidenedione therapy.
The studies selected for use in a Cochrane systematic review should be appropriate to the purpose of the review. It is therefore difficult to understand how the limited range of studies selected from the much larger number of studies available, allow the authors to draw robust conclusions with respect to morbidity, mortality and health‐outcomes for rosiglitazone. In addition, the conclusions drawn regarding ischaemic cardiovascular safety should be substantiated by the data analysed and not inferred from statistically insignificant odds ratios.
Finally we question the appropriateness of raising comment about the timing of data release to regulatory authorities and regulatory approval requirements in diabetes as part of a systematic review. GSK has actively shared data on rosiglitazone with regulatory agencies worldwide in a timely manner. The company carries out its clinical trials with the highest level of ethical conduct and is committed to patient safety.
References 1. Home PD et al N Engl J Med 2007; 357: 28‐38 2. Kahn SE et al N Engl J Med 2006; 355: 2427‐43. 3. Krall RL Lancet 2007; 369: 1995‐1996 4. Bailey CJ et al Clin There 2005; 27:1548‐1561 5. McAfee AT et al Pharmacoepidemiology Drug Saf; 2007 16: 711‐725
Abbreviations ADOPT ‐ A Diabetes Outcome Progression Trial RECORD ‐ Rosiglitazone Evaluated for Cardiovascular Outcomes
Reply
The comments by Dr Dollow are answered in a point‐by‐point fashion:
The Cochrane Collaboration as well as the Metabolic and Endocrine Disorders Group adhere to high quality standards. It is unclear how Dr Dollow defines "integrity of data interpretation". As a matter of course, the discussion and conclusion sections are firmly based upon the data evaluated in our review.
The types of interventions we included had to have a minimum trial duration of 24 weeks. The point that a limited number of studies had a longer duration, for example more than one year, is due to the fact that neither the manufacturer nor the scientific community seems to be interested in the long‐term benefit‐risk ratio of rosiglitazone therapy, but cannot be attributed to the review itself. Furthermore, the bulk of studies investigated glycaemic control as primary efficacy endpoint and not patient‐oriented parameters like mortality, morbidity and health‐related quality of life which again has to be ascribed to the deficiencies of studies but not the systematic review. Our review so far provides the best overview of the risks and (with regard to relevant outcomes) missing benefits of rosiglitazone therapy and therefore is of great importance for clinical practice. We did not perform our own meta‐analysis on myocardial infarction but tried to replicate the findings by Nissen et al using their data in the discussion section of our review (Nissen 2007). Cardiovascular disease and safety in their clinical meaning include more than myocardial infarction, for example increased risk of congestive heart failure following rosiglitazone therapy. Therefore, we stand by the conclusions as stated in the review.
The studies and publications we discovered and assessed in our review ‐ with the exception of the ADOPT (A Diabetes Outcome Progression Trial) ‐ did not investigate cardiovascular risk. That is one of the reasons why Nissen et al (Nissen 2007) had to search the manufacturer's as well as drug authorities web sites. The publication schedule of the Cochrane Library demands from Cochrane review groups to hand in their "module" (all new and updated protocols and reviews) around two months before the publication of the Cochrane Library. Therefore, the interim findings of the RECORD (Rosiglitazone Evaluated for Cardiac Outcomes and Regulation of Glycaemia in Diabetes) study could not be included in our review (Home 2007). Furthermore, these interim data do not provide assurance of the cardiovascular safety of rosiglitazone treatment in type 2 diabetes mellitus (see below).
We agree that questions about the safety of rosiglitazone should be answered by critical appraisal of especially well‐performed long‐term randomised controlled clinical trials. With regard to the cardiovascular data from the ADOPT trial Dr Dollow mentions a letter to the Lancet editor by Dr Krall, Chief Medical Officer of GlaxoSmithKline. It is of interest to note that this letter to the editor which refers to the Nissen et al publication was published in the Lancet and not the New England Journal of Medicine where the study originally was published. The new endpoint MACE (major adverse cardiovascular events, that is all cardiovascular deaths, myocardial infarction serious adverse events (fatal and non‐fatal), and stroke serious adverse events (fatal and non‐fatal)) was not part of the original publication of the ADOPT trial, resulted from a post‐hoc analysis by the manufacturer and "forgot" to mention congestive heart failure which was part of the outcomes contributing to the overall endpoint cardiovascular disease. Here, significant differences between glyburide (glibenclamide) and rosiglitazone were reported, indicating increased cardiovascular disease risk after rosiglitazone therapy, as mentioned in our review. The ADOPT trial was not powered to investigate mortality. The primary outcome time from randomisation to treatment failure as measured by elevated fasting plasma glucose levels was not part of our pre‐specified outcomes but we agree with the accompanying New England Journal of Medicine editorial stating "the choice of time to failure based on a confirmed fasting glucose level of more than 180 mg per deciliter as the primary outcome, rather than one based upon glycated hemoglobin levels, seems anachronistic " (Nathan 2006).
The unscheduled interim analysis from the RECORD trial should not be interpreted as evidence for cardiovascular safety of rosiglitazone therapy (Home 2007). We once again agree with the statements of the associated editorial in the New England Journal of Medicine (Nathan 2007): "The primary end point of the RECORD trial consists of an aggregate of time to first hospitalization for a cardiovascular event or death from cardiovascular causes" ... "Unfortunately, this interim analysis, performed after a mean of 3.75 years (about 60% of the planned 6‐year duration of the study) fails to provide exculpatory evidence" ... "RECORD extremely underpowered for the primary outcome" ... "the results of this underpowered interim analysis suggest a possible adverse effect of treatment with rosiglitazone on the primary outcome, rather than the benefit that was hypothesized ... considering the low power of the study and the trend for more adverse outcomes in the rosiglitazone‐treated group, it is highly unlikely that the study will ever establish a cardiovascular benefit for rosiglitazone" ... "In the aggregate, however, these analyses support a concern regarding the safety of rosiglitazone" ... "It is reasonable to ask whether physicians should feel comfortable using a drug that might have an 8% excess risk of severe cardiovascular disease or death from cardiovascular causes" ... "Unless further studies provide convincing assurance that treatment with rosiglitazone does not increase the risk of cardiovascular disease, the largely circumstantial evidence of the meta‐analyses and the nonsignificant trend in the current report from the RECORD trial must be taken seriously" ... "The jury may still be out with regard to the cardiotoxicity of rosiglitazone, but when it comes to patient safety, "first, do no harm" should outweigh any presumption of innocence."
As demonstrated above, the totality of data do not show that rosiglitazone has a comparable ischaemic cardiovascular profile to the most commonly used oral antidiabetic medicines. To claim a comparable ischaemic cardiovascular risk profile especially to metformin in obese type 2 diabetes patients appears careless: Contrary to rosiglitazone treatment metformin positively influences patient‐oriented outcomes since the United Kingdom Prospective Diabetes Study (UKPDS) demonstrated that patients allocated metformin had significant reductions for any‐diabetes related endpoint, diabetes‐related death, stroke and all‐cause mortality (UKPDS‐34).
Dr Dollow claims that "authors excluded a number of studies which are applicable to decisions made in clinical practice, such as Bailey et al(4) in which uptitration of metformin is compared with metformin and rosiglitazone". In the 'criteria for considering studies for this review' we clearly exemplified under 'excluded interventions': "Combination therapies consisting of different compounds in the treatment arms (for example rosiglitazone plus metformin versus uptitration of metformin or rosiglitazone plus gliclazide versus gliclazide). Another Cochrane review will investigate rosiglitazone‐metformin combination therapies including different treatment regimens of these compounds." We want to perform another Cochrane review on different combination partners because it does not appear to be adequate to compare interventions with different combination partners neglecting the complicated interplay of various agents. Furthermore, we did not report on a significant decrease in the rate of hypoglycaemia associated with rosiglitazone but stated "Seven of the 18 included studies showed data on hypoglycaemic episodes: Compared to active monotherapy control rosiglitazone treatment resulted in somewhat lower rates of hypoglycaemia, especially when compared to sulphonylureas. Severe hypoglycaemic events were rarely reported." Apart from that, serious adverse events were noted more often after rosiglitazone treatment as were higher median discontinuation rates compared to control therapy.
Our studies selected for this review were indeed appropriate to our objectives. To speak of a "limited range of studies selected from the much larger number of studies available" does not understand our strategy. We especially focused on patient‐oriented parameters like mortality, morbidity, health‐related quality of life and adequately reported on all available study results according to our in‐ and exclusion criteria. Unfortunately, the availability of sound studies is scarce due to the fact that concerning this matter only the ADOPT and the RECORD trial provide some hypotheses about the benefit‐risk ratio of rosiglitazone therapy which does not appear to be positive (see above).
According to Krall (Krall 2007), GlaxoSmithKline performed similar meta‐analyses in 2005 and 2006 and found similar results as Nissen et al (Nissen 2007). We are not aware that the public was adequately informed about these results, otherwise the meta‐analysis by Nissen et al would not have aroused such a huge public interest. It is well know that glycosylated haemoglobin is a relatively poor surrogate for cardiovascular outcomes and these data urgently suggest that we need to change the regulatory pathway for drugs for the treatment of type 2 diabetes to make clinical outcomes, not surrogates, the primary endpoint (Rosen 2007). It would be prudent for one of the biggest pharmaceutical companies in the world being committed to patient care to engage in relevant clinical studies of patient‐oriented outcomes from the very beginning on.
References: HOME 2007: Home PD, Pocock SJ, Beck‐Nielsen H, Gomis R, Hanefeld M, et al. New England Journal of Medicine 2007;357:28‐38. KRALL 2007: Krall RL. Cardiovascular safety of rosiglitazone. Lancet 2007; 369:1995‐6. NATHAN 2006: Nathan DM. Thizolidinediones for initial treatment of type 2 diabetes? New England Journal of Medicine 2006;355:2477‐80. NATHAN 2007: Nathan DM. Rosiglitazone and cardiotoxicity ‐ weighing the evidence. New England Journal of Medicine 2007;357:64‐6. NISSEN 2007: Nissen SE, Wolski K. Effect of rosiglitazone on the risk of myocardial infarction and death from cardiovascular causes. New England Journal of Medicine 2007;356:2457‐71. ROSEN 2007: Rosen CJ. Rhe rosiglitazone story ‐ lessons from an FDA Advisory Committee Meeting. New England Journal of Medicine 2007;357: Published at www.nejm.org August 8, 2007. UKPDS‐34: UK Prospective Diabetes Study Group. Effect of intensive blood‐glucose control with metformin on complications in overweight patients with type 2 diabetes. Lancet 1998;352:854‐65.
Contributors
Comments made by Dr Stuart Dollow, Vice President and UK Medical Director GlaxoSmithKline (stuart.c.dollow@GSK.com).
Bernd Richter replied to the comments on behalf of the review authors for the review.
What's new
| Date | Event | Description |
|---|---|---|
| 6 November 2008 | Amended | Converted to new review format. |
History
Protocol first published: Issue 2, 2006 Review first published: Issue 3, 2007
| Date | Event | Description |
|---|---|---|
| 18 July 2007 | Feedback has been incorporated | Comments and criticisms |
Acknowledgements
We are grateful to Susan L Norris who kindly provided some standard text for our protocol/review templates.
Appendices
Appendix 1. Search strategy
| Search terms |
| Unless otherwise stated, search terms are free text terms; MesH = Medical subject heading (Medline medical index term); exp = exploded MeSH; the dollar sign ($) stands for any character(s); the question mark (?) = to substitute for one or no characters; tw = text word; pt = publication type; sh = MeSH; adj = adjacent. 1. exp THIAZOLIDINEDIONES/ 2. (rosiglitazon$ or thiazolidinedion$).tw. 3. 1 or 2 4. randomized controlled trial.pt. 5. controlled clinical trial.pt. 6. randomized controlled trials.sh. 7. random allocation.sh. 8. double‐blind method.sh. 9. single‐blind method.sh. 10. ((singl$ or doubl$ or tripl$ or trebl$) adj6 (mask$ or blind$)).tw. 11. (random$ adj25 (trial$ or stud$ or investigat$ or cross over or crossover)).tw. 12. 4 or 5 or 6 or 7 or 8 or 9 or 10 or 11 13. exp meta‐analysis/ 14. exp Review Literature/ 15. meta‐analysis.pt. 16. systematic review$.tw. 17. search$.tw. 18. medline.tw. 19. cochrane database of systematic reviews.jn. 20. 13 or 14 or 15 or 16 or 17 or 18 or 19 21. letter.pt. 22. comment.pt. 23. editorial.pt. 24. historical‐article.pt. 25. 21 or 22 or 23 or 24 26. 20 not 25 27. exp Technology Assessment, Biomedical/ 28. HTA.tw. 29. (health technology adj6 assessment$).tw. 30. (biomedical adj6 technology assessment$).tw. 31. 27 or 28 or 29 or 30 32. exp diabetes mellitus/ 33. diabet$.tw. 34. IDDM.tw. 35. NIDDM.tw. 36. MODY.tw. 37. (late onset adj diabet$).tw. 38. (maturity onset adj diabet$).tw. 39. (non insulin$ depend$ or noninsulin$ depend$ or non insulin?depend$ or noninsulin?depend$).tw. 40. ((typ$ 1 or typ$ 2) adj6 diabet$).tw. 41. ((typ$ I or typ$ II) adj6 diabet$).tw. 42. (insulin$ depend$ or insulin?depend$).tw. 43. (T1DM or T2DM).tw. 44. 32 or 33 or 34 or 35 or 36 or 37 or 38 or 39 or 40 or 41 or 42 or 43 45. 3 and 12 and 44 46. 3 and 26 and 44 47. 3 and 31 and 44 48. 45 or 46 or 47 |
Appendix 2. Baseline characteristics (I)
| Characteristic | Derosa 2004 | Derosa 2006a | Derosa 2006b |
| I1: rosiglitazone 4 mg + glimepiride 4 mg C1: pioglitazone 15 mg + glimepiride 4 mg | I1: rosiglitazone 4 mg + metformin 3000 mg C1: pioglitazone 15 mg + metformin 3000mg | I1: rosiglitazone 4 mg + metformin 1500 mg C1: glimepiride 2 mg+ metformin 1500 mg | |
| Sex [%] | I1: female 48; male 52 C1: female 53; male 447 | I1: female 48; male 52 C1: female 50; male 50 | I1: female 48; male 52 C1: female 51; male 49 |
| Age [years], mean (SD) | I1: 54 (5) C1: 53 (6) | I1: 56 (4) C1: 55 (5) | I1: 54 (4) C1: 52 (5) |
| Ethnic groups [%] | I1: white 100 C1: white 100 | I1: caucasians 100 C1: caucasians 100 | ? |
| Duration of disease [years], mean (SD) | I1: 6 (3) C1: 5 (2) | I1: 5(4) C1: 6(4) | I1: 5 (3) C1: 4 (3) |
| Body mass index [kg/m2], mean (SD) | I1: 24.3 (0.7) C1: 24.4 (0.8) | I1: 26.4 (1.4) C1: 26.9 (1.2) | I1: 26.6 (1.3) C1: 26.8 (1.5) |
| Pharmaco‐naive patients [%] | I1: none C1: none | I1: none C1: none | I1: none C1: none |
| HbA1c [%], mean (SD) | I1: 8.0 (0.8) C1: 8.2 (0.7) | I1: 8.1 (0.9) C1: 8.2 (0.8) | I1: 8.0 (0.7) C1: 7.9 (0.6) |
| Co‐morbidities [%] | ? | ? | I1: hypertension 42 C1: hypertension 47 |
| Notes | patients who completed the study | ./. | ./. |
|
Footnotes ? = unclear; I = intervention; C = control; SD = standard deviation; SE = standard error; ITT = intention‐to ‐treat | |||
Appendix 3. Baseline characteristics (II)
| Characteristic | Garber 2006 | Goldberg 2005 | Hanefeld 2007 | Hällsten 2002 | Jung 2005 |
| I1: rosiglitazone 4 mg + metformin 2000 C1: glibenclamide 5 mg +metformin 1000 mg | I1: rosiglitazone 8 mg + diet C1: pioglitazone 45 mg + diet | I1: rosiglitazone 4 mg + placebo I2: rosiglitazone 8 mg + placebo C1: glibenclamide + placebo | I1: rosiglitazone 8 mg C1: metformin 2 g C2: placebo | I1: rosiglitazone 4 mg + glimepiride 4 mg C1: metformin 1000 mg + glimepiride 4 mg | |
| Sex [%] | I1: female35; male 65 C1: female 44; male 56 | I1: female 45; male 55 C1: female 46; male 54 | I1: female 32; male 68 I2: female 42; male 58 C1: female 30; male 70 | I1: female 29; male 71 C1: female 38; male 62 C2: female 29; male 71 | I1: female 57; male 43 C1: female 54; male 46 |
| Age [years], mean (SD) | I1: 56 C1: 56 | I1: 56.3 (11.3) C1: 55.9 (10.5) | I1: 60.4 (8.2) I2: 60.6 (9.2) C1: 60.1 (8.3) | I1: 58.6 (7.5) C1: 57.8 (7.9) C2: 57.7 (7.1) | I1: 60 (8) C1: 54 (14) |
| Ethnic groups [%] | I1: white 79; black 6; hispanic/latino 10; asian/pacific islander 3; other 3 C1: white 80; black 5; hispanic/latino 11; asian/pacific islander 3; other 2 | I1: white 60; hispanic 32; asian 3; african 3; other 2 C1: white 65; hispanic 29; asian 3; african 2; other 2 | I1: white 99; other 1 I2: white 97; other 3 C1: white 99.5; other 0.5 | ? | I1: korean 100 C1: korean 100 |
| Duration of disease [years], mean (SD) | I1: 6 (5) C1: 5 (4) | I1: 4.0 (4.6) C1: 3.9 (4.4) | I1: 5.9 (6.0) I2: 6.0 (7.0) C1: 6.4 (6.9) | newly diagnosed | I1: 9 (5) C1 : 7 (6) |
| Body mass index [kg/m2], mean (SD) | I1: 32 (5) C1: 32 (5) | I1: 32.6 (6.6) C1: 33.7 (12.9) | I1: 28.7 (3.7) I2: 28.8 (3.7) C1: 28.7 (3.9) | I1: 29.3 (3.7) C1: 29.9 (4.0) C2: 30.3 (4.5) | I1: 23.3 (2.6) C1: 24.6 (2.4) |
| Pharmaco‐naive patients [%] | I1: none C1: none | Total: 8 | I1: 42 I2: 38 C1: 38 | ? | I1: none C1: none |
| HbA1c [%], mean (SD) | I1: 8.4 (1.1) C1: 8.5 (1.2) | I1: 7.5 (1.2) C1: 7.6 (1.2) | I1: 8.1 (1.3) I2: 8.2 (1.4) C1: 8.2 (1.3) | I1: 6.8 (0.8) C1: 6.9 (0.7) C2: 6.3 (0.4) | I1: 9.3 (0.9) C1: 9.0 (0.8) |
| Co‐morbidities [%] | ? | ? | ? | ? | ? |
| Notes | ./. | ./. | ./. | SDs calculated | text table data mismatch |
|
Footnotes ? = unclear; I = intervention; C = control; SD = standard deviation; SE = standard error; ITT = intention‐to‐treat | |||||
Appendix 4. Baseline characteristics (III)
| Characteristic | Kahn 2006 | Ko 2006 | Lebovitz 2001 | Ovalle 2004 | Philipps 2001 | Raskin 2004 |
| Kahn 2006 I1: rosiglitazone max. 8 mg C1: metformin max. 2 g C2: glyburide max. 15 mg | I1: rosiglitazone max. 8 mg + (sulfonylurea +/‐ metformin) C1: "bedtime insulin" + (sulfonylurea +/‐ metformin) | I1: rosiglitazone 4 mg I2: rosiglitazone 8 mg C1: placebo | I1: rosiglitazone 8 mg C1: insulin 70/30 | I1: rosiglitazone 4 mg I2: rosiglitazone 2 x 2 mg I3: rosigllitazone 8 mg I4: rosiglitazone 2 x 4 mg C1: placebo | I1: rosiglitazone 8 mg C1: repaglinide 12 mg C2: rosiglitazone 4 mg + repaglinide 6 mg | |
| Sex [%] | I1: female 44; male 56 C1: female 40; male 60 C2: female 42; male 58 | I1: female 43; male 57 C1: female 57; male 43 | I1: female 36; male 64 I2: female 33; male 67 C1: female 34; male 66 | ? | I1: female 41; male 59 I2: female 41; male 59 I3: female 34; male 66 I4: female 35; male 65 C1: female 31; male 69 | I1: female 47; male 53 C1: female 38; male 62 C2: female 49; male 51 |
| Age [years], mean (SD) | I1: 56.3 (10.0) C1: 57.9 (9.9) C2: 56.4 (10.2) | I1: 56.6 (10.7) C1: 59.8 (11.2) | I1: 60 (9.8) I2: 61 (9.5) C1: 59 (10.9) | I1: 47 (12) C1: 56 (14.1) | I1: 57.5 (9.9) I2: 56.8 (9.4) I3: 58.9 (9.9) I4: 56.5 (9.7) C1: 57.7 (9.2) | I1: 56.6 (10.8) C1: 58.5 (10.1) C2: 57.5 (10.8) |
| Ethnic groups [%] | I1: white 87; black 4; asian 3; hispanic 5; other 1 C1: white 89; black 4; asian 2; hispanic 4; other 1 C2: white 89; black 4; asian 2; hispanic 4; other 0.3 | Chinese patients | I1: white 75; black 8; other 16 I2: white 73; black 9; other 17 C1: white 74; black 8; other 18 | ? | I1: white 76; black 13; other 11 I2: white 78; black 8; other 14 I3: white 80; black 7; other 13 I4: white 71; black 11; other 18 C1: white 79; black 9; other 12 | I1: caucasian 68; black 13; hispanic 0; other 19 C1: caucasian 63; black 16; hispanic 2; other 19 C2: caucasian 65; black 17; hispanic 3; other 15 |
| Duration of disease [years], mean (SD) | ? | I1: 11.8 (7.7) C1: 13.6 (7.5) | I1: 4.8 (5.8) I2: 5.4 (6.0) C1: 4.6 (4.8) | I1: 7.6 (6.3) C1: 7.6 (4.8) | I1: 5.4 (6.1) I2: 5.5 (4.9) I3: 6.1 (6.7) I4: 5.9 (6.1) C1: 6.6 (6.9) | I1: 7.4 (6.6) C1: 7.2 (5.3) C2: 7.3 (6.9) |
| Body mass index [kg/m2], mean (SD) | I1: 32.2 (6.7) C1: 32.1 (6.1) C2: 32.2 (6.3) | I1: 25.3 (3.8) C1: 24.0 (2.7) | I1: 30.2 (4.1) I2: 29.1 (3.9) C1: 29.9 (4.1) | I1: 31.5 (6.9) C1: 30.8 (7.6) | I1: 29.9 (4.1) I2: 30.0 (4.2) I3: 30.0 (4.3) I4: 29.9 (4.3) C1: 29.1 (4.2) | I1: 31.4 (5.2) C1: 30.4 (4.7) C2: 32.3 (5.2) |
| Pharmaco‐naive patients [%] | I1: 100 C1: 100 C2: 100 | ? | I1: 26.5 I2: 26.6 C1: 28.5 | I1: none C1: none | I1: 22.1 (40/181) I2: 24.7 (46/186) I3: 29.3 (53/181) I4: 25.1 (47/187) C1: 22.5 (39/173) | I1: none C1: none C2: none |
| HbA1c [%], mean (SD) | I1: 7.4 (0.9) C1: 7.4 (0.9) C2: 7.4 (0.9) | I1: 10.1 (1.0) C1: 9.6 (0.9) | I1: 9.0 (1.5) I2: 8.8 (1.6) C1: 9.0 (1.7) | I1: 8.7 C1: 9.0 | I1: 8.9 (1.6) I2: 8.9 (1.5) I3:8.9 (1.5) I4:9.0 (1.5) C1: 8.9 (1.5) | I1: 9.0 C1: 9.3 C2: 9.1 |
| Co‐morbidities [%] | ? | ? | ? | ? | ? | ? |
| Notes | antihypertensive therapy: I1: 51%; C1: 51%; C2: 52% | antihypertensive agents: I1: 55%; C1: 25% lipid‐lowering agents: I1: 9%; C1: 4% | ITT population | SDs calculated | ITT population | ./. |
|
Footnotes ? = unclear; I = intervention; C = control; SD = standard deviation; SE = standard error; ITT = intention‐to‐treat | ||||||
Appendix 5. Baseline characteristics (IV)
| Characteristic | Rosenstock 2006b | Stocker 2007 | Sutton 2002 | Yang 2002 |
| I1: rosiglitazone until 8 mg + sulfonyurea + max. 2 g metformin C1: insulin glargine max. 10 U + sulfonylurea + max. 2 g metformin | I1: rosiglitazone 4 mg C1: metformin 1.7 g | I1: rosiglitazone 8 mg C1: glyburide less than 20 mg | I1: rosiglitazone 4 mg C1: placebo | |
| Sex [%] | I1:female 42; male 58 C1: female 55; male 45 | I1: female 29; male 71 C1: female 47; male 53 | I1: female 25; male 75 C1: female 29; male 71 | I1: female 57; male 43 C1: female 62; male 38 |
| Age [years], mean (SD) | I1: 55.3 (11.4) C1: 55.9 (10.5) | I1: 64 (11) C1: 65 (10) | I1: 55.1 (9.0) C1: 56.1 (8.9) | I1: 58.9 (9.4) C1: 57.8 (8.9) |
| Ethnic groups [%] | ? | ? | I1: white 73; black 5; other 22 C1: white 76; black 3; other 21 | ? |
| Duration of disease [years], mean (SD) | I1: 8.1 (5.1) C1: 8.5 (5.8) | ? | I1: 5.3 (6.2) C1: 6.2 (6.3) | ? |
| Body mass index [kg/m2], mean (SD) | I1: 33.6 (6.3) C1: 34.6 (7.0) | I1: 29.4 (0.7) C1: 29.7 (0.7) | >= 27: I1: 67.3% C1: 65.7% | I1: 25.8 (2.9) C1: 25.8 (3.5) |
| Pharmaco‐naive patients [%] | I1: none C1: none | I1: 24 C1: 28 | I1: 21.2 C1: 18.2 | I1: none C1: none |
| HbA1c [%], mean (SD) | I1: 8.7 (1.0) (ITT) C1: 8.8 (1.0) (ITT) | I1: 8.5 (0.3) C1: 8.5 (0.2) | I1: 9.1 (1.7) C1: 9.5 (1.6) | I1: 9.5 (1.1) C1: 9.7 (1.4) |
| Co‐morbidities [%] | cardiovascular disease I1: 4.4 C1: 6.4 | hypertension: I1: 7.7 C1: 7.0 | ? | |
| Notes | ITT population: for baseline characteristics (112:105) for HbA1c (112:104) | data on statin, aspirin, beta‐blocker, calcium‐channel blocker, angiotensin receptor blocker , ACE inhibitor and sulfonylurea use | ./. | ./. |
|
Footnotes ? = unclear; I = intervention; C = control; SD = standard deviation; SE = standard error; ITT = intention‐to‐treat | ||||
Appendix 6. Adverse events (I)
| Characteristic | Derosa 2004 | Derosa 2006a | Derosa 2006b |
| I1: rosiglitazone 4 mg + glimepiride 4 mg C1: pioglitazone 15 mg + glimepiride 4 mg | I1: rosiglitazone 4 mg + metformin 3000 mg C1: pioglitazone 15 mg + metformin 3000mg | I1: rosiglitazone 4 mg + metformin 1500 mg C1: glimepiride 2 mg + metformin 1500 mg | |
| [n] of participants who died | I1: 0 C1: 0 | ? | I1: 0 C1:0 |
| [%] adverse events | I1: 11.9 (5/42) C1: 6.7 ( 3/45) | I1: 10.4 (5/48) C1: 8.3 (4/48) | I: 12.5 (6/48) C1:8.5 (4/47) |
| [%] serious adverse events | I1: 0 C1: 0 | ? | ? |
| [%] drop‐outs due to adverse events | I1: 0 C1: 0 | ? | ? |
| [%] oedema | ? | ? | ? |
| haemoglobin [g/dl] | ? | ? | ? |
| body weight [kg] | ? | ? | I1: ? C1: ? |
| body mass index (BMI) [kg/m2] | I1: +1.5 C1: +1.2 | I1: ‐ 0.4 C1: ‐0.3 | I1: ‐2.1 C1: ‐1.6 |
| [%] hypoglycaemic episodes | ? | ? | ? |
| [%] severe hypoglycaemic episodes | ? | ? | ? |
| Notes | BMI change date calculated | BMI change data calculated | BMI change date calculated |
|
Footnotes ? = unclear; I = intervention; C = control | |||
Appendix 7. Adverse events (II)
| Characteristic | Garber 2006 | Goldberg 2005 | Hällsten 2002 | Hanefeld 2007 | Jung 2005 |
| I1: rosiglitazone 4 mg + metformin 2000 C1: glibenclamide 5 mg +metformin 1000 mg | I1: rosiglitazone 8 mg + diet C1: pioglitazone 45 mg+diet | I1: rosiglitazone 8 mg C1: metformin 2 g C2: placebo | I1: rosiglitazone (2 mg bid) + placebo I2: rosiglitazone (4 mg bid) + placebo C1: glibenclamide up to 15 mg + placebo | I1: rosiglitazone 4 mg+ glimepiride 4mg C1: metformin 1000 mg + glimepiride 4mg | |
| [n] of participants who died | ? | I1: 2 C1: 1 | I1:0 C2:0 C1:0 | I1: 0 I2: 0 C1: 0 | ? |
| [%] adverse events | I1: 63 (98/155) C1: 68 (108/160) | ? | ? | I1: 75.0 (150/200) I2: 75.4 (144/191) C1: 69.6 (144/207) | ? |
| [%] serious adverse events | I1: 6 (9/155) C1: 4 (7/159) | ? | ? | ? | ? |
| [%] drop‐outs due to adverse events | I1: 4.4 (7/158) C1: 10 (16/160) | I1: 2.7 (10/366) C1: 2.7 (10/369) | I1:0 C2:0 C1:0 | I1: 6 I2: 4.7 C1: 6.3 | I1:? C1: 3.3 (1/30) |
| [%] oedema | ? | ? | ? | I1: 3.5 (7/200) I2: 8.9 (17/191) C1: 1.9 (4/207) | ? |
| haemoglobin [g/dl] | ? | ? | ? | I1: ‐0.48 I2: ‐0.98 C1: 0 | ? |
| body weight [kg] | I1: +1.4 C1: +3 | I1: 1.6 C1: 2.0 | I1: + 0.6 C1: ‐ 2.0 C2: + 0.1 | I1: 1.75 I2: 2.95 C1: 1.9 | ? |
| body mass index (BMI) [kg/m2] | ? | ? | ? | ? | ? |
| [%] hypoglycaemic episodes | I1: 26 (41/155) C1: 73 (116/159) | ? | ? | I1: 0.5 (1/200) I2: 1.6 (3/191) C1: 12.1 (25/207) | ? |
| [%] severe hypoglycaemic episodes | ? | ? | ? | I1: I2: C1: 0.01 | ? |
| Notes | elevated levels of ALT ( > 3x pretreatment levels and > upper normal limit): I1: 2 patients C1: 3 patients | I1 + C1: no significant differences observed for: ‐ liver functions tests ‐ haemoglobin ans haematocrit ‐ hypoglycemic episodes ‐ adverse events (oedema, congestive heart failure) | body weight change data calculated | two hypoglycaemic events were severe and one required hospitalization; unclear in which medication group these events happened | ./. |
|
Footnotes ? = unclear; I = intervention; C = control; AE = adverse event; ALT = alanine aminotransferase | |||||
Appendix 8. Adverse events (III)
| Characteristic | Kahn 2006 | Ko 2006 | Lebovitz 2001 | Ovalle 2004 | Philipps 2001 | Raskin 2004 |
| I1: rosiglitazone max. 8 mg C1: metformin max. 2 g C2: glyburide max. 15 mg | I1: rosiglitazone max. 8 mg + (sulfonylurea +/‐ metformin) C1: "bedtime insulin" + (sulfonylurea +/‐ metformin) | I1: rosiglitazone 4 mg I2: rosiglitazone 8 mg C1: placebo | I1: rosiglitazone 8 mg C1: insulin 70/30 | I1: rosiglitazone 4 mg I2: rosiglitazone 2 x 2 mg I3: rosigllitazone 8 mg I4: rosiglitazone 2 x 4 mg C1: placebo | I1: rosiglitazone 8 mg C1: repaglinide 12 mg C2: rosiglitazone 4 mg + repaglinide 6 mg | |
| [n] of participants who died | I1: 34 C1: 31 C2: 31 | ? | ? | ? | ? | ? |
| [%] adverse events | I1: 91.9 (1338/1456) C1: 92.2 (1341/1454) C2: 91.7 (1321/1441) | I1: 7.1 C1: 10.7 | I1: 73.1 (121/166) I2: 74.3 (126/169) C1: 69.9 (110/158) | ? | I1+ I2+ I3+I4: 75 (551/ 735) C1: 71 (123/173) | I1: 24 (15/62) C1:37 (23/63) C2: 64 (81/127) |
| [%] serious adverse events | I1: 23.8 (346/1456) C1: 22.8 (331/1454) C2: 21.4 (308/1441) | I1: 5.4 C1: 0 | ? | ? | ? | ? |
| [%] drop‐outs due to adverse events | I1: 11.6 C1: 12.2 C2: 14.9 | I1: 7.1 C1: 0 | ? | ? | I1+I2 +I3 +I4: 5.6 (41/735) C1: 10.8 (19/173) | I1: 9.7 (6/62) C1: 6.3 (4/63) C2: 3.1 (4/127) |
| [%] oedema | I1: 14.1 (205/1456) C1: 7.2 (104/1454) C2: 8.5 (123/1441) | I1: 3.6 C1: 0 | I1: 6 (10/166) I2: 10.7(18/169) C1:1.9 (3/158) | ? | I1: 5.2 (10/181) I2: 4.1 (8/ 186) I3: 6.4 (12/181) I4: 6.6 (13/187) C1: 1.6 (3/173) | I1: 3 (2/62) C1: 0 C2: 4 (5/125) |
| haemoglobin [g/dl] | ? | ? | I1: ‐0.6 I2: ‐1.0 C1: ? | ? | I1+ I2+ I3+ I4 : ‐0.5 to ‐ 0.9 (dosage dependent) C: ? | I1: ‐ 0.7 C1: 0 C2: ‐ 0.8 |
| body weight [kg] | ? | ? | I1: 1.6 I2: 3.5 C1: ‐1 | ? | I1: 1.2 I2: 1.5 I3: 2.6 I4: 3.3 C1: ‐ 0.9 | I1: + 2.3 C1: +1.6 C2: + 4.4 |
| body mass index (BMI) [kg/m2] (SD) | ? | I1: 0.9 (1.3 ) C1: 0.8 (0.9) change data after one year | ? | ? | ? | ? |
| [%] hypoglycaemic episodes | I1: 9.8 (142/1456) C1: 11.6 (168/1454) C2: 38.7 (557/1441) | I1: 0 C1: 8.9 | ? | ? | ? | I1: 2 (1/62) C1: 6 (4/63) C2: 9 (11/127) |
| [%] severe hypoglycaemic episodes | I1: 0.1 (2/1456) C1: 0.1 (1/1454) C2: 0.6 (8/1441) | I1: 0 C1: 0 | ? | ? | ? | I1: 0 C1: 0 C2: <1 (1 episode) |
| Notes | ./. | ./. | ./. | ./. | ITT population | C1: one patient with elevated liver transaminase (>3X normal limit) |
| [n] fractures (%) | Men I1: 32 (3.95) C1: 29 (3.36) C2: 28 (3.35) Women I1: 60 (9.30) C1: 30 (5.08) C2: 21 (3.47) Lower limb I1: 36 (5.58) C1: 18 (3.05) C2: 8 (1.32) Upper limb I1: 22 (3.41) C1: 10 (1.69) C2: 9 (1.49) Spinal I1: 1 (0.16) C1: 1 (0.17) C2: 1 (0.17) | |||||
| [%] hospitalization for any cause | I1: 11.6 (169/1456) C1: 11.8 (172/1454) C2: 10.4 (150/1441) | |||||
| [%] cardiovascular disease, total events | I1: 4.3 (62/1456) C1: 4.0 (58/1454) C2: 2.8 (41/1441) | |||||
| [%] congestive heart failure, investigator‐reported, total events | I1: 1.5 (22/1456) C1: 1.3 (19/1454) C2: 0.6 (9/1441) | |||||
| [%] peripheral vascular disease, total events | I1: 2.5 (36/1456) C1: 1.9 (27/1456) C2: 2.2 (31/1441) | |||||
| [%] gastrointestinal events, total events | I1: 23.0 (335/1456) C1: 38.3 (557/1456) C2: 21.9 (316/1441) | |||||
| [%] weight gain, total events | I1: 6.9 (100/1456) C1: 1.2 (18/1456) C2: 7.2 (104/1441) | |||||
| [%] haematocrit >= 5 percentage points below the reference range | I1: 2.8 (41/1456) C1: 1.5 (22/1456) C2: 1.0 (14/1441) | |||||
|
Footnotes ? = unclear; I = intervention; C = control | ||||||
Appendix 9. Adverse events (IV)
| Characteristic | Rosenstock 2006b | Stocker 2007 | Sutton 2002 | Yang 2002 |
| I1: rosiglitazone max. 8 mg + sulfonyurea + metformin until 2000 mg C1: insulin glargine max. 10 U + sulfonylurea + metformin max. 2000 mg | I1: rosiglitazone 4 mg C1: metformin 1.7 g | I1: rosiglitazone 8 mg C1: glyburide less than 20 mg | I1: rosiglitazone 4 mg C1: placebo | |
| [n] of participants who died | ? | I1: 0 C1: 0 | ? | I1: none C1: none |
| [%] adverse events | I1: 28.6 (32/112) C1: 6.7 (7/105) | ? | ? | ? |
| [%] serious adverse events | I1: 9.8 (11/112) C1: 4.8 (5/105) | ? | ? | ? |
| [%] drop‐outs due to adverse events | I1: 8 (9/112) C1: 2 (2/105) | I1: 8.9 (4/45) C1: 14.9 (7/47) | I1: 8 (8/104) C1: 4 (4/99) | ? |
| [%] oedema | I1: 12.5 (14/112) C1: 0 | I1: 24.4 (11/45) C1: 0 | I1: 6.7 (7/104) C1: 1 (1/99) | ? |
| haemoglobin [g/dl] | ? | ? | ? | ? |
| body weight [kg] | I1: + 3 C1: + 1.7 | I1: 1.6 C1: ‐2.0 | I1: + 5 C1: + 3.4 | I1: + 3.0 C1: ‐ 0.4 |
| body mass index (BMI) [kg/m2] | ? | ? | ? | I1: + 1.2 C1: ‐0.4 |
| [%] hypoglycaemic episodes | I1: 42 (47/112) C1: 55 (57/104) | ? | I1: 1.9 (2/104) C1: 7.1 (7/99) | ? |
| [%] severe hypoglycaemic episodes | I1: 5.4 (6/112) C1: 2.9 (3/104) | ? | I1: 0 C1: 3 (3/99) | ? |
| Notes | severe hypoglycemia = plasma glucose < 36 mg/dl or prompt recovery after oral carbohydrate, intravenous glucose or glucagon adminstration nocturnal hypoglycemia = < 50 mg/dl: I1: 3 events C1: 10 events safety was assessed in the intent‐to‐treat (ITT) population | ./. | cardiac related adverse events: I1: 15.4%; C1: 12.1% heart disorder: I1: 9/104.; C1:5/99 cardiomegaly: I1: 5/104.; C1:2/99 I1: 1/104 clinical heart failure I1:2/104 initiated diuretic therapy as a result of a fluid related event C1: severe hypoglycaemia: 3 of 7 total hypoglycaemic episodes | |
|
Footnotes ? = unclear; I = intervention; C = control; AE = adverse events | ||||
Appendix 10. Primary outcomes
| Characteristic | Mortality | Morbidity | Adverse events | Notes |
| Derosa 2004 I1: rosiglitazone 4 mg + glimepiride 4 mg C1: pioglitazone 15 mg + glimepiride 4 mg | not investigated | not investigated | see table 'Adverse events' | ./. |
| Derosa 2006a I1: rosiglitazone 4 mg + metformin 3 g C1: pioglitazone 15 mg + metformin 3 g | not investigated | not investigated | see table 'Adverse events' | ./. |
| Derosa 2006b I1: rosiglitazone 4 mg + metformin 1.5 g C1: glimepiride 2 mg + metformin 1.5 g | not investigated | not investigated | see table 'Adverse events' | ./. |
| Garber 2006 I1: rosiglitazone 4 mg + metformin 2 g C1: glibenclamide 5 mg + metformin 1 g | not investigated | not investigated | see table 'Adverse events' | ./. |
| Goldberg 2005 I1: rosiglitazone 8 mg C1: pioglitazone 45 mg | not investigated | not investigated | see table 'Adverse events' | ./. |
| Hällsten 2002 I1: rosiglitazone 8 mg I2: metformin 2 g C1: placebo | not investigated | not investigated | see table 'Adverse events' | ./. |
| Hanefeld 2007 I1: rosiglitazone (2 mg bid) + placebo I2: rosiglitazone (4 mg bid) + placebo C1: glibenclamide up to 15 mg + placebo | not investigated | not investigated | see table 'Adverse events' | ./. |
| Jung 2005 I1: rosiglitazone 4 mg + glimepiride 4 mg C1: metformin 1 g + glimepiride 4 mg | not investigated | not investigated | see table 'Adverse events' | ./. |
| Kahn 2006 I1: rosiglitazone max. 8 mg C1: metformin max. 2 g C2: glyburide max. 15 mg | death rates reported but not part of the efficacy outcomes, as defined in the publication of the study design (Diabetes Care 2002): deaths from any cause [no]: I1: 34 C1: 31 C2: 31 | morbidity rates reported but not part of the efficacy outcomes, as defined in the publication of the study design (Diabetes Care 2002): cardiovascular disease [no (%)]: serious / total events I1: 49 (3.4) / 62 (4.3) C1: 46 (3.2) / 58 (4.0) C2: 26 (1.8) / 41 (2.8) Peripheral vascular disease [no (%)]: serious / total events I1: 7 (0.5) / 36 (2.5) C1: 6 (0.4) / 27 (1.9) C2: 4 (0.3) / 31 (2.2) | see table 'Adverse events' | ./. |
| Ko 2006 I1: rosiglitazone max. 8 mg + (sulfonylurea +/‐ metformin) C1: "bedtime insulin" + (sulfonylurea +/‐ metformin) | not investigated | not investigated | see table 'Adverse events' | ./. |
| Lebovitz 2001 I1: rosiglitazone 4 mg I2: rosiglitazone 8 mg C1: placebo | not investigated | not investigated | see table 'Adverse events' | ./. |
| Ovalle 2004 I1: rosiglitazone 8 mg I2: insulin (premixed 70/30) | not investigated | not investigated | see table 'Adverse events' | ./. |
| Philipps 2001 I1: rosiglitazone 4 mg o.d.; 2 mg b.i.d.; 8 mg o.d.; 4 mg b.i.d. C1: placebo | not investigated | not investigated | see table 'Adverse events' | ./. |
| Raskin 2004 I1: rosiglitazone 8 mg I2: repaglinide 12 mg C1: repaglinide + rosiglitazone 6 / 4 mg | not investigated | not investigated | see table 'Adverse events' | ./. |
| Rosenstock 2006b I1: rosiglitazone 8 mg + metformin 2g + sulfonylurea C1: insulin glargine 10 units/day + metformin 2g + sulfonylurea | not investigated | not investigated | see table 'Adverse events' | ./. |
| Stocker 2007 I1: rosiglitazone 4 mg C1: metformin 1.7 g | not investigated | not investigated | see table 'Adverse events' | ./. |
| Sutton 2002 I1: rosiglitazone 8 mg C1: glyburide (mean 10.5 mg) | not investigated | not investigated | see table 'Adverse events' | ./. |
| Yang 2002 I1: rosiglitazone 4 mg C1: placebo | not investigated | not investigated | see table 'Adverse events' | ./. |
|
Footnotes ? = unclear; I = intervention; C = control; o.d. = once daily; b.i.d. = twice daily | ||||
Appendix 11. Secondary outcomes
| Characteristic | Quality of life | Costs | HbA1c [%] (SD) | Notes |
| Derosa 2004 I1: rosiglitazone 4 mg + glimepiride 4 mg C1: pioglitazone 15 mg + glimepiride 4 mg | not investigated | not investigated | I1: end of study data: 6.7 (0.9) change data: C1: end of study data: 6.8 (0.8) change data: | ./. |
| Derosa 2006a I1: rosiglitazone 4 mg + metformin 3 g C1: pioglitazone 15 mg + metformin 3 g | not investigated | not investigated | I1: end of study data: 6.8 (0.5) change data: ‐1.3 C1: end of study data: 6.8 (0.3) change data: ‐1.4 | change data calculated |
| Derosa 2006b I1: rosiglitazone 4 mg + metformin 1.5 g C1: glimepiride 2 mg + metformin 1.5 g | not investigated | not investigated | I1: end of study data: 6.8 (0.6) change data: C1: end of study data: 7.0 (0.7) change data: | ./. |
| Garber 2006 I1: rosiglitazone 4 mg + metformin 2 g C1: glibenclamide 5 mg + metformin 1 g | not investigated | not investigated | I1: end of study data: change data: ‐1.1 C1: end of study data: change data: ‐1.5 | "change data" from abstract |
| Goldberg 2005 I1: rosiglitazone 8 mg C1: pioglitazone 45 mg | not investigated | not investigated | I1: end of study data: change data: ‐0.6 (1.89) C1: end of study data: change data: ‐0.7 (1.91) | SDs calculated |
| Hanefeld 2007 I1: rosiglitazone (2 mg bid) + placebo I2: rosiglitazone (4 mg bid) + placebo C1: glibenclamide up to 15 mg + placebo | not investigated | not investigated | I1: end of study data: change data: ‐0.3 I2: end of study data: change data: ‐0.5 I1: end of study data: change data: ‐0.7 | ./. |
| Hällsten 2002 I1: rosiglitazone 8 mg I2: metformin 2 g C1: placebo | not investigated | not investigated | I1: end of study data: 6.5 (0.75) change data: I2: end of study data: 6.2 (0.72) change data: C1: end of study data: 6.1 (0.37) change data: | SDs calculated |
| Jung 2005 I1: rosiglitazone 4 mg + glimepiride 4 mg C1: metformin 1 g + glimepiride 4 mg | not investigated | not investigated | I1: end of study data: 7.8 (1.1) change data: C1: end of study data: 8.0 (1.1) change data: | ./. |
| Kahn 2006 I1: rosiglitazone max. 8 mg C1: metformin max. 2 g C2: glyburide max. 15 mg | not yet reported but mentioned in the publication of the study design (Diabetes Care 2002) | not yet reported but mentioned in the publication of the study design (Diabetes Care 2002) | I1: end of study data: 7.1 change data: C1: end of study data: 7.3 change data: C2: end of study data: 7.4 change data: | estimated from graph (four year data) |
| Ko 2006 I1: rosiglitazone max. 8 mg + (sulfonylurea +/‐ metformin) C1: "bedtime insulin" + (sulfonylurea +/‐ metformin) | not investigated | not investigated | I1: end of study data: 9.1 (2.0) change data: ‐1.1 (1.7) C1: end of study data: 8.3 (1.3) change data: ‐1.3 (1.6) | ./. |
| Lebovitz 2001 I1: rosiglitazone 4 mg I2: rosiglitazone 8 mg C1: placebo | not investigated | not investigated | I1: end of study data: change data: ‐0.3 I2: end of study data change data: ‐0.6 C1: end of study data: change data: +0.9 | ./. |
| Ovalle 2004 I1: rosiglitazone 8 mg C1: insulin (premixed 70/30) | not investigated | not investigated | I1: end of study data: 7.8 (0.5) change data: C1: end of study data: 7.8 (0.3) change data: | ./. |
| Philipps 2001 I1: rosiglitazone 4 mg o.d.; 2 mg b.i.d.; 8 mg o.d.; 4 mg b.i.d. C1: placebo | not investigated | not investigated | patients who had received prior oral monotherapy: I1: end of study data: change data: 4 mg o.d. (+0.14); 2 mg b.i.d. (+0.02); 8 mg o.d. (‐0.26); 4 mg b.i.d. (‐0.54) C1: end of study data: change data: +0.98 | SDs calculated |
| Raskin 2004 I1: rosiglitazone 8 mg I2: repaglinide 12 mg C1: repaglinide + rosiglitazone 6 mg / 4 mg | not investigated | not investigated | I1: end of study data: 8.5 change data: ‐0.56 (1.0) I2: end of study data: 9.1 change data: ‐0.17 (1.1) C2: end of study data: 7.7 change data: ‐1.43 (1.1) | SDs calculated |
| Rosenstock 2006b I1: rosiglitazone 8 mg + metformin 2g + sulfonylurea C1: insulin glargine 10 units/day + metformin 2g + sulfonylurea | not investigated | I1: $ 1,603 C1: $ 1,368 | I1: end of study data: change data: ‐1.51 C1: end of study data: change data: ‐1.66 | ./. |
| Stocker 2007 I1: rosiglitazone 4 mg C1: metformin 1.7 g | not investigated | not investigated | I1: end of study data: change data: ‐1.08 (0.14) C1: end of study data: change data: ‐1.19 (0.13) | (SE or SD)? |
| Sutton 2002 I1: rosiglitazone 8 mg C1: glyburide (mean 10.5 mg) | not investigated | not investigated | I1: end of study data: 8.1 (0.3) change data: C1: end of study data: 8.4 (0.2) change data: | ./. |
| Yang 2002 I1: rosiglitazone 4 mg C1: placebo | not investigated | not investigated | I1: end of study data: change data: ‐0.7 (1.04) C1: end of study data: change data: 0.4 (1.3) | ./. |
|
Footnotes ? = unclear; I = intervention; C = control; o.d. = once daily; b.i.d. = twice daily | ||||
Appendix 12. Changes to the published protocol
| Changed items |
| The following changes to the published protocol with regards to 'types of intervention' were implemented: The following comparisons were acceptable for evaluation: ‐ rosiglitazone versus placebo; ‐ rosiglitazone versus another oral antidiabetic medication (meglitinide analogues, metformin, pioglitazone, sulphonylureas); ‐ rosiglitazone in combination with an oral antidiabetic medication or insulin versus a combination of an oral antidiabetic medication or insulin (agents and treatment schemes had to be identical). Excluded interventions: Combination therapies consisting of different compounds in the treatment arms (for example rosiglitazone plus metformin versus uptitration of metformin or rosiglitazone plus gliclazide versus gliclazide). Another Cochrane review will investigate rosiglitazone‐metformin combination therapies including different treatment regimens of these compounds. Furthermore, dipeptidyl peptidase‐4 (DPP‐4) inhibitors for type 2 diabetes mellitus are excluded, since these are the topic of another Cochrane review (Richter 2007), as well as glucagon‐like peptide analogues for type 2 diabetes mellitus (Cochrane review, Snaith 2007). |
Appendix 13. Risk of bias (I)
| Characteristic | Derosa 2004 | Derosa 2006a | Derosa 2006b |
| Intervention 1 (I1) / intervention 2 (I2) / control 1 (C1) | I1: rosiglitazone + glimepiride C1: pioglitazone + glimepiride | I1: rosiglitazone + metformin C1: pioglitazone + metformin | I1: rosiglitazone + metformin C1: glimepiride + metformin |
| Randomised controlled clinical trial (RCT) | Y | Y | Y |
| Non‐inferiority / equivalence trial | N | N | N |
| Controlled clinical trial | N | N | N |
| Design: parallel study | Y | Y | Y |
| Design: crossover study | N | N | N |
| Design: factorial study | N | N | N |
| Crossover study: wash‐out phase | NA | NA | NA |
| Crossover study: carryover effect tested | NA | NA | NA |
| Crossover study: period effect tested | NA | NA | NA |
| Method of randomisation | randomisation codes prepared by statistician | ? | drawing of envelopes; randomisation codes prepared by a statistician |
| Unit of randomisation (individuals, cluster ‐ specify) | individuals | ? | individuals |
| Randomisation stratified for centres | ? | ? | ? |
| Randomisation ratio | 1:1 | 1:1 | 1:1 |
| Concealment of allocation | envelopes; a copy of the randomisation code was provided only to the statistician | envelopes containing randomisation code; a copy of the randomisation code was provoided only for the statistician | ?; drawing of envelopes |
| Stated blinding (open; single, double, triple blind) | double‐blind | double‐blind | double‐blind |
| Actual blinding: participant | Y | Y | Y |
| Actual blinding: caregiver / treatment administrator | ? | ? | ? |
| Actual blinding: outcome assessor | ? | ? | ? |
| Actual blinding: others | ? | ? | ? |
| Blinding checked: participant | N | N | N |
| Blinding checked: caregiver / treatment administrator | N | N | N |
| Primary endpoint defined (power calculation) | N | N | Y |
| [n] of primary endpoint(s) | 6 | 5 | 5 |
| [n] of secondary endpoints | ? | ? | 6 |
| Total [n] of endpoints | ? | ? | 11 |
| Prior publication of study design | N | ? | N |
| Outcomes of prior/current publication identical | NA | N | N |
| Power calculation | N | N | ?; see notes for details |
| [n] participants per group calculated | NA | NA | ?; stated but no details provided |
| Non‐inferiority trial: interval for equivalence specified | NA | NA | NA |
| Intention‐to‐treat analysis (ITT) | Y | Y | Y |
| Per‐protocol‐analysis | N | N | N |
| ITT defined | Y | Y | Y |
| Missing data: last observation carried forward (LOCF) | ? | ? | N |
| Missing data: Other methods | Y Bonferroni | Y Bonferroni | N |
| LOCF defined | NA | NA | N |
| Analysis stratified for centres | N | ? | N |
| [n] of screened patients (I1 / I2/ C1/ total) | ? | ? | ? |
| [n] of randomised participants (I1/ I2 / C1 / total) ‐ primary endpoint | I1: 42 (baseline) C1: 45 (baseline) total: 91 | I1: 48 (baseline) C1: 48 (baseline) total: 103 | I1: 48 (baseline) C1: 47 (baseline) total: 99 |
| [n] of participants finishing the study (I1/ I2 / C1 / total) | I1: 42 C1: 45 total: 87 | I1: 48 C1:48 total: 96 | I1: 48 (baseline) C1: 47 (baseline) total: 95 |
| [n] of participants analysed (I1/ I2 / C1 / total) ‐ primary endpoint | I1: 42 C1: 45 total: 87 | I1: 48 C1:48 total: 96 | ? |
| Description of discontinuing participants | N | N | N |
| Drop‐outs (reasons explained) | Y | N | N |
| Withdrawals (reasons explained) | Y | N | Y |
| Losses‐to‐follow‐up (reasons explained) | N | N | N |
| [n] of participants who discontinued (I1/ I2 / C1 / total) | I1: 2 C1: 2 total: 4 | I1: ? C1: ? total: 7 | I1: 2 C1: 2 total: 4 |
| [%] discontinuation rate (I1/ I2 / C1 / total) | I1: 5 C1: 4 total: 4 | I1: ? C1: ? total: 6 | I1: ? C1: ? total: 4 |
| Discontinuation rate similar between groups | Y | ? | Y |
| [%] crossover between groups | ? | ? | ? |
| Differences [n] calculated to analysed patients | NA | ? | ? |
| Adjustment for multiple outcomes / repeated measurements | Y | see comments | N |
| Baseline characteristics: Clinically relevant differences | N | N | N |
| Treatment identical (apart from intervention) | N some patients received behaviour modification, sessions for weight‐loss | Y | Y |
| Compliance measured | Y pill count | Y pill count | Y pill count |
| Other important covariates measured (specify) | N | N | N |
| Co‐morbidities measured | N | N | N |
| Co‐medications measured | Y | N | Y |
| Specific doubts about study quality | Y see notes | Y see notes | ? |
| Funding: commercial | ? | N | ? |
| Funding: non‐commercial | ? | N | ? |
| Publication status: peer review journal | Y | Y | Y |
| Publication status: journal supplement | N | N | N |
| Publication status: abstract | N | N | N |
| Publication status: other | N | N | N |
| Notes | patients were requested to follow a controlled‐energy diet (ADA); some patients received behaviour modifications for weight‐loss; exercise recommendations were given; co‐medications not specified for intervention vs control | patients were requested to follow a controlled‐energy diet (ADA); patients received behaviour modifications for weight‐loss; exercise recommendations were given; adjustment stated as Bonferroni but P‐values provided show no indication of application of the method; drop‐outs per group not specified | patients were requested to follow a controlled‐energy diet (ADA); all patients received behaviour modifications for weight‐loss; exercise recommendations were given; co‐medication not specified for intervention vs control; publication in Pharmacotherapy 2005 states that a power calculation was performed whereas the publication in Clinical Therapeutics 2005 states that no power calculation was performed |
|
Footnotes Y = yes; N = no; ? = unclear I = intervention; C = control; (baseline) = if numbers for certain features could ne be derived from the text, numbers from baseline characteristics were used | |||
Appendix 14. Risk of bias (II)
| Characteristic | Garber 2006 | Goldberg 2005 | Hanefeld 2007 | Hällsten 2002 | Jung 2005 |
| Intervention 1 (I1) / intervention 2 (I2) / control 1 (C1) | I1: rosiglitazone + metformin C1: glibenclamide + metformin | I1: pioglitazone C1: rosiglitazone | I1: rosiglitazone 4 mg + placebo I2: rosiglitazone 8 mg + placebo C1: glibenclamide + placebo | I1: rosiglitazone I2: metformin C1: placebo | I1: rosiglitazone + glimipiride C1: metformin + glimipiride |
| Randomised controlled clinical trial (RCT) | Y | Y | Y | Y | Y |
| Non‐inferiority / equivalence trial | N | N | Y | N | N |
| Controlled clinical trial | N | N | N | N | N |
| Design: parallel study | Y | Y | Y | Y | Y |
| Design: crossover study | N | N | N | N | N |
| Design: factorial study | N | N | N | N | N |
| Crossover study: wash‐out phase | NA | NA | NA | NA | NA |
| Crossover study: carryover effect tested | NA | NA | NA | NA | NA |
| Crossover study: period effect tested | NA | NA | NA | NA | NA |
| Method of randomisation | ? | stratified for being previously treated with oral antidiabetic drugs and according to sex | ? | ? | ? |
| Unit of randomisation (individuals, cluster ‐ specify) | individuals | individuals | individuals | individuals | individuals |
| Randomisation stratified for centres | ? | N | ? | ? | ? |
| Randomisation ratio | 1:1 | 1:1 | 1:1:1 | 1:1 | 1:1 |
| Concealment of allocation | ? | ? | ? | ? | ? |
| Stated blinding (open; single, double, triple blind) | double‐blind | double‐blind | double‐blind, double‐dummy | double‐blind | ? |
| Actual blinding: participant | Y | ? | Y | Y | NA |
| Actual blinding: caregiver / treatment administrator | ? | ? | ? | ? | NA |
| Actual blinding: outcome assessor | ? | ? | ? | ? | NA |
| Actual blinding: others | ? | ? | ? | ? | NA |
| Blinding checked: participant | N | N | N | N | NA |
| Blinding checked: caregiver / treatment administrator | N | N | N | N | NA |
| Primary endpoint defined (power calculation) | Y | Y | Y | N | N |
| [n] of primary endpoint(s) | 1 | 1 | 1 | ? | ? |
| [n] of secondary endpoints | 7 | 16 | 13 | ? | ? |
| Total [n] of endpoints | 8 | 17 | 14 | 13 | 10 |
| Prior publication of study design | N | N | N | N | N |
| Outcomes of prior/current publication identical | NA | NA | NA | NA | NA |
| Power calculation | Y | N | Y | N | N |
| [n] participants per group calculated | 150 | NA | ? | NA | NA |
| Non‐inferiority trial: interval for equivalence specified | NA | NA | Y | NA | NA |
| Intention‐to‐treat analysis (ITT) | Y | Y | Y | ? | ? |
| Per‐protocol‐analysis | N | Y | ? | ? | ? |
| ITT defined | Y | Y | Y | NA | NA |
| Missing data: last observation carried forward (LOCF) | ? | Y | Y | N | N |
| Missing data: Other methods | N | N | N | N | N |
| LOCF defined | NA | N | N | NA | NA |
| Analysis stratified for centres | N | N | ? | N | N |
| [n] of screened patients (I1 / I2/ C1/ total) | total: 356 | total: 4410 | total: 662 | ? | ? |
| [n] of randomised participants (I1/ I2 / C1 / total) ‐ primary endpoint | I1: 158 C1: 160 total: 318 | I1: 369; C1: 366; total: 735 | I1: 200 I2: 191 C1: 207 total: 598 | I1: 15 I2: 16 C1: 14 total: 45 | I1: 15 C1: 15 total: 30 |
| [n] of participants finishing the study (I1/ I2 / C1 / total) | I1: 133 C1: 131 total: 264 | I1: 299 C1: 286 total: 585 | I1: 153 I2: 158 C1: 173 total: 484 | I1: 14 I2: 13 C1: 14 total: 41 | I1: 14 C1: 13 total: 27 |
| [n] of participants analysed (I1/ I2 / C1 / total) ‐ primary endpoint | I1: C1: total: 305 | I1: 363 C1: 356 total: 719 | I1: 195 I2: 189 C1: 202 total: 586 (ITT population) | I1: 14 I2: 13 C1: 14 total: 41 | I1: 14 C1: 13 total: 27 |
| Description of discontinuing participants | N | Y | Y | N | N |
| Drop‐outs (reasons explained) | Y | Y | ? | N | Y |
| Withdrawals (reasons explained) | Y | Y | Y | Y | N |
| Losses‐to‐follow‐up (reasons explained) | ? | Y | ? | N | N |
| [n] of participants who discontinued (I1/ I2 / C1 / total) | I1: 25 C1: 29 total: 54 | I1: 70 C1: 80 total: 150 | I1: 47 I2: 33 C1: 34 total: 114 | I1: 1 I2: 3 C1: 0 total: 4 | I1: 1 C1: 2 total: 3 |
| [%] discontinuation rate (I1/ I2 / C1 / total) | I1: 16 C1: 18 total: 17 | I1: 19 C1: 22 total: 20 | I1: 23.5 I2: 17.3 C1: 16.4 total: 19 | I1: 7 I2: 19 C1: 0 total: 9 | I1: 7 C1: 13 total: 10% |
| Discontinuation rate similar between groups | N | Y | N | ? | Y |
| [%] crossover between groups | ? | ? | ? | ? | ? |
| Differences [n] calculated to analysed patients | N | NA | ? | NA | NA |
| Adjustment for multiple outcomes / repeated measurements | N | N | N | N | N |
| Baseline characteristics: Clinically relevant differences | Y 9% more men in I1 than C | N | N rosiglitazone 8 mg less male participants) | ? HbA1c not included in baseline characteristics | ? HbA1c and resistin not included in baseline characteristics |
| Treatment identical (apart from intervention) | Y | Y | Y | Y | Y |
| Compliance measured | N | N | N | Y | N |
| Other important covariates measured (specify) | N | N | N | N | N |
| Co‐morbidities measured | N | Y | N | N | N |
| Co‐medications measured | N | N | N | N | N |
| Specific doubts about study quality | N | N | N | N | N |
| Funding: commercial | Y | Y | Y | Y | N |
| Funding: non‐commercial | ? | ? | N | Y | Y |
| Publication status: peer review journal | N | Y | Y | Y | N |
| Publication status: journal supplement | N | N | N | N | N |
| Publication status: abstract | N | N | N | N | N |
| Publication status: other | N | N | N | N | N |
| Notes | commercial funding not explicitly stated but three of five authors from pharmaceutical company | no quantitative data on adverse events | sample size not reported, LOCF parameter unclear, baseline no of participants 587 | patients received written diet instructions | poor reporting on quality criteria |
|
Footnotes Y = yes; N = no; ? = unclear I = intervention; C = control; (baseline) = if numbers for certain features could ne be derived from the text, numbers from baseline characteristics were used | |||||
Appendix 15. Risk of bias (III)
| Characteristic | Kahn 2006 | Ko 2006 | Lebovitz 2001 | Ovalle 2004 | Phillips 2001 | Raskin 2004 |
| Intervention 1 (I1) / intervention 2 (I2) / control 1 (C1) | I1: rosiglitazone I2: metformin C1: glyburide | I1: rosiglitazone + (sulfonylurea +/‐ metformin) C1: bedtime isophane insulin + (sulfonylurea +/‐ metformin) | I1: rosiglitazone 2 mg I2: rosiglitazone 4 mg C1: placebo | I1: rosiglitazone + glimepiride + metformin + C1: glimepiride + metformin + 70/30 mixed human insulin | I1: rosiglitazone 4 mg od I2: rosiglitazone 2 mg bid I3: rosiglitazone 8 mg od I4: rosiglitazone 4 mg bid C1: placebo | I1: rosiglitazone I2: repaglinide C1: rosiglitazone + repaglinide |
| Randomised controlled clinical trial (RCT) | Y | Y | Y | Y | Y | Y |
| Non‐inferiority / equivalence trial | N | N | N | N | Primary hypothesis: superiority of rosiglitazone vs placebo; secondary hypothesis: equivalence of once daily vs twice daily administration of rosiglitazones | ? |
| Controlled clinical trial | N | N | N | N | N | N |
| Design: parallel study | Y | Y | Y | Y | Y | Y |
| Design: crossover study | N | N | N | N | N | N |
| Design: factorial study | N | N | N | N | N | N |
| Crossover study: wash‐out phase | NA | NA | NA | NA | NA | NA |
| Crossover study: carryover effect tested | NA | NA | NA | NA | NA | NA |
| Crossover study: period effect tested | NA | NA | NA | NA | NA | NA |
| Method of randomisation | stratified according to sex in blocks of six | ? | ? | ? | ? | ? |
| Unit of randomisation (individuals, cluster ‐ specify) | individuals | individuals | individuals | individuals | individuals | individuals |
| Randomisation stratified for centres | N | NA | ? | NA | ? | ? |
| Randomisation ratio | 1:1:1 | 1:1 | 1:1 | 1:1 | 1:1:1:1:1 | 1:1:2 |
| Concealment of allocation | Y | ? | ? | ? | ? | ? |
| Stated blinding (open; single, double, triple blind) | double‐bind | open | double‐blind | ? | double‐blind | open |
| Actual blinding: participant | ? | NA | Y | ? | ? | N |
| Actual blinding: caregiver / treatment administrator | ? | NA | ? | ? | ? | N |
| Actual blinding: outcome assessor | ? | ? | ? | ? | ? | ? |
| Actual blinding: others | Y | ? | N | N | N | ? |
| Blinding checked: participant | N | NA | N | N | N | NA |
| Blinding checked: caregiver / treatment administrator | N | NA | N | N | N | NA |
| Primary endpoint defined (power calculation) | Y | Y | N | N | N | Y |
| [n] of primary endpoint(s) | 1 | 1 | 1 | 1 | 1 | 1 |
| [n] of secondary endpoints | ? | ? | 10 | 6? | 8 | 7 |
| Total [n] of endpoints | ? | 9 | 11 | 7 | 9 | 8 |
| Prior publication of study design | Y | N | N | N | N | N |
| Outcomes of prior/current publication identical | ? | NA | NA | NA | NA | NA |
| Power calculation | Y | Y | N | N | N | Y |
| [n] participants per group calculated | 3600 (initially); 4182 (March 2002); further extension of trial was decided in February 2004 to compensate withdrawals | 50 | NA | NA | NA | total: 190 |
| Non‐inferiority trial: interval for equivalence specified | NA | NA | NA | NA | Y | NA |
| Intention‐to‐treat analysis (ITT) | Y | Y | Y | ? | Y | Y |
| Per‐protocol‐analysis | NA | N | ? | ? | N | ? |
| ITT defined | N | N | Y | NA | Y | Y |
| Missing data: last observation carried forward (LOCF) | N | ? | Y | ? | Y | N |
| Missing data: Other methods | N | ? | N | N | N | Y |
| LOCF defined | NA | ? | Y | NA | N | NA |
| Analysis stratified for centres | N | NA | Y | NA | N | N |
| [n] of screened patients (I1 / I2/ C1/ total) | total: 6676 | ? | total: 623 | total: ? | total: 1503 | total: ? |
| [n] of randomised participants (I1/ I2 / C1 / total) ‐ primary endpoint | I1: 1456 I2: 1454 C1: 1441 total: 4351 | I1: 56 C1: 56 total: 112 | I1: ? I2: ? C1: ? total: 533 | I1: 9 C1: 8 total: 17 | I1: ? I2: ? I3: ? I4: ? C1: ? total: 959 | I1: 62 I2: 63 I3: 127 total: 252 |
| [n] of participants finishing the study (I1/ I2 / C1 / total) | I1: 917 I2: 903 C1: 807 total: 2627 | I1: 50 C1: 52 total: 102 | I1: ? I2: ? C1: ? total: 365 | I1: ? C1: ? total: ? | I1: ? I2: ? I3: ? I4: ? C1: ? total: ? | I1: 37 I2: 38 I3: 106 total: 181 |
| [n] of participants analysed (I1/ I2 / C1 / total) ‐ primary endpoint | I1: 1393 I2: 1397 C1: 1337 total: 4127 | I1: ? C1: ? total: ? | I1: ? I2: ? C1: ? total: 472 | I1: ? C1: ? total: ? | I1: 181 I2: 186 I3: 181 I4: 187 C1: 173 total: 908 | I1: 55 I2: 59 I3: 126 total: 240 |
| Description of discontinuing participants | N | Y | N | N | N | N |
| Drop‐outs (reasons explained) | N | Y partly | N | N | N | Y |
| Withdrawals (reasons explained) | Y | N | N | N | Y | N |
| Losses‐to‐follow‐up (reasons explained) | N | N | N | N | N | N |
| [n] of participants who discontinued (I1/ I2 / C1 / total) | I1: 539 I2: 551 C1: 634 total: 1724 | I1: 6 C1: 2 total: 8 | I1: 46 I2: 45 C1: 77 total: 168 | I1: ? C1: ? total: ? | I1: ? I2: ? I3: ? I4: ? C1: ? total: 51 | I1: 25 I2: 25 I3: 21 total: 71 |
| [%] discontinuation rate (I1/ I2 / C1 / total) | I1: 37 I2: 38 C1:44 total: 44 | I1: 10.7 C1: 3.6 total: 7.1 | I1: 26 I2: 25 C1: 44 total: 32 | I1: ? C1: ? total: ? | I1: ? I2: ? I3: ? I4: ? C1: ? total: 5% | I1: 40.3 I2: 39.7 I3: 16.5 total: 28.2 |
| Discontinuation rate similar between groups | ? | N | N | ? | N "patients who withdrew from treatment were more poorly controlled at baseline" | N discontinuation rate lower for repaglinide/rosiglitazone combination therapy due to lack of efficiency in the monotherapy groups |
| [%] crossover between groups | ? | ? | ? | ? | ? | ? |
| Differences [n] calculated to analysed patients | additional patients were recruited during the study | N | NA | NA | NA | N |
| Adjustment for multiple outcomes / repeated measurements | N | ? | Y | N | Y | N |
| Baseline characteristics: Clinically relevant differences | Y | Y gender, HbA1c, metformin dosage, antihypertensive and lipid‐lowering agents | N | ? only few characteristics reported, numerical differences in age | N | previous sulfonylurea / metformin treatment |
| Treatment identical (apart from intervention) | Y | Y | Y | there was no titration period in the rosiglitazone group | Y | Y |
| Compliance measured | N | N | N | N | N | N |
| Other important covariates measured (specify) | N | N | N | N | N | N |
| Co‐morbidities measured | N | N | N | N | N | N |
| Co‐medications measured | N | Y | N | N | N | N |
| Specific doubts about study quality | N | N | N | Y | N | N |
| Funding: commercial | Y | ? | ? | Y | ? | Y |
| Funding: non‐commercial | ? | ? | ? | ? | ? | ? |
| Publication status: peer review journal | Y | Y | Y | Y | Y | Y |
| Publication status: journal supplement | N | N | N | N | N | N |
| Publication status: abstract | N | N | N | N | N | N |
| Publication status: other | N | N | N | N | N | N |
| Notes | 24 weeks treatment duration as inclusion criterion | ./. | authors from a pharmaceutical company | ./. | two authors hold stocks in pharmaceutical companies | ./. |
|
Footnotes Y = yes; N = no; ? = unclear I = intervention; C = control; (baseline) = if numbers for certain features could ne be derived from the text, numbers from baseline characteristics were used |
||||||
Appendix 16. Risk of bias (IV)
| Characteristic | Rosenstock 2006b | Stocker 2007 | Sutton 2002 | Yang 2002 |
| Intervention 1 (I1) / intervention 2 (I2) / control 1 (C1) | I1: rosiglitazone + sulfonylurea + metformin C1: insulin glargine + sulfonylurea + metformin | I1: rosiglitazone C1: metformin | I1: rosiglitazone C1: glyburide | I1: rosiglitazone C1: placebo |
| Randomised controlled clinical trial (RCT) | Y | Y | Y | Y |
| Non‐inferiority / equivalence trial | ? | N | Y | N |
| Controlled clinical trial | N | N | N | N |
| Design: parallel | Y | Y | Y | Y |
| Design: crossover study | N | N | N | N |
| Design: factorial study | N | N | N | N |
| Crossover study: wash‐out phase | NA | NA | NA | NA |
| Crossover study: carryover effect tested | NA | NA | NA | NA |
| Crossover study: period effect tested | NA | NA | NA | NA |
| Method of randomisation | ? | random number generator, stratified by the use of statins | ? | ? |
| Unit of randomisation (individuals, cluster ‐ specify) | ? | individuals | ? | ? |
| Randomisation stratified for centres | ? | NA | ? | ? |
| Randomisation ratio | 1:1 | 1:1 | 1:1 | 1 : 1 |
| Concealment of allocation | ? | "allocation‐concealed randomization" | ? | ? |
| Stated blinding (open; single, double, triple blind) | open | open | open | double‐blind |
| Actual blinding: participant | N | NA | N | Y |
| Actual blinding: caregiver / treatment administrator | N | NA | N | ? |
| Actual blinding: outcome assessor | ? | Y | ? | ? |
| Actual blinding: others | N | N | N | N |
| Blinding checked: participant | NA | NA | NA | N |
| Blinding checked: caregiver / treatment administrator | NA | NA | NA | N |
| Primary endpoint defined (power calculation) | Y | Y | Y | N |
| [n] of primary endpoint(s) | 1 | 1 | 1 | 1 |
| [n] of secondary endpoints | 7 | 2 | 10 | 10 |
| Total [n] of endpoints | 8 | 8 | 11 | 11 |
| Prior publication of study design | N | N | N | N |
| Outcomes of prior/current publication identical | NA | NA | NA | NA |
| Power calculation | N | Y | Y | N |
| [n] participants per group calculated | NA | 40 | 60 | NA |
| Non‐inferiority trial: interval for equivalence specified | NA | NA | Y | NA |
| Intention‐to‐treat analysis (ITT) | Y | N | Y | ? |
| Per‐protocol‐analysis | N | Y | Y | ? |
| ITT defined | Y | NA | Y | N |
| Missing data: last observation carried forward (LOCF) | Y | N | Y | ? |
| Missing data: Other methods | N | N | N | N |
| LOCF defined | N | NA | N | N |
| Analysis stratified for centres | Y | NA | N | ? |
| [n] of screened patients (I1 / I2/ C1/ total) | total: 341 | total: 120 | total: 351 | ? |
| [n] of randomised participants (I1/ I2 / C1 / total) ‐ primary endpoint | I1: ? C1: ? total: 219 | I1: 45 C1: 47 total: 92 | I1: 104 C1: 99 total: 203 | ? |
| [n] of participants finishing the study (I1/ I2 / C1 / total) | I1: ? C1: ? total: ? | I1: ? C1: ? total: | I1: ? C1: ? total: 130 | ? |
| [n] of participants analysed (I1/ I2 / C1 / total) ‐ primary endpoint | I1: 105 C1: 112 total: 216 | I1: 37 C1: 38 total: 75 | I1: ? C1: ? total: ? | I1: 30 C1: 34 total: 64 |
| Description of discontinuing participants | Y | Y | Y | N |
| Drop‐outs (reasons explained) | N | Y | N | N |
| Withdrawals (reasons explained) | Y | Y | Y | N |
| Losses‐to‐follow‐up (reasons explained) | N | NA | N | N |
| [n] of participants who discontinued (I1/ I2 / C1 / total) | I1: 11 C1: 7 total: 18 | I1: 8 C1: 9 total: 17 | I1: 40 C1: 34 total: 74 | I1: ? C1: ? total: ? |
| [%] discontinuation rate (I1/ I2 / C1 / total) | I1: ? C1: ? total: 8 | I1: 17.8 C1: 19.2 total: 18.5 | I1: 38 C1: 34 total: 36 | I1: ? C1: ? total: ? |
| Discontinuation rate similar between groups | Y | Y | Y | ? |
| [%] crossover between groups | ? | ? | ? | ? |
| Differences [n] calculated to analysed patients | NA | N | N | NA |
| Adjustment for multiple outcomes / repeated measurements | N | N | N | ? |
| Baseline characteristics: Clinically relevant differences | Y sex | Y medications, sex | N | N baseline values for adiponectin not reported |
| Treatment identical (apart from intervention) | Y | Y | Y | Y |
| Compliance measured | N | Y patient surveys, prescription renewals, pill counts | N | N |
| Other important covariates measured (specify) | N | N | N | N |
| Co‐morbidities measured | N | Y partly | N | N |
| Co‐medications measured | N | Y | N | N |
| Specific doubts about study quality | Y | N | Y | Y |
| Funding: commercial | Y | Y | ? | Y |
| Funding: non‐commercial | N | N | N | ? |
| Publication status: peer review journal | Y | Y | Y | Y |
| Publication status: journal supplement | N | N | N | N |
| Publication status: abstract | N | N | N | N |
| Publication status: other | N | N | N | N |
| Notes | allocation concealment unclear, blinding of outcome assessor unclear, open design | open design, unclear outcome assessment | one author employed by GlaxoSmithKline | unclear how many patients were randomised, how many discontinued, were withdrawn or lost to follow‐up; efficacy evaluation seems to be published in a different publication; unclear if patients were still randomised under this follow‐up study |
|
Footnotes Y = yes; N = no; ? = unclear I = intervention; C = control; (baseline) = if numbers for certain features could ne be derived from the text, numbers from baseline characteristics were used | ||||
Data and analyses
Comparison 1. Adverse events.
| Outcome or subgroup title | No. of studies | No. of participants | Statistical method | Effect size |
|---|---|---|---|---|
| 1 No. of patients experiencing oedema | 9 | 4739 | Odds Ratio (M‐H, Fixed, 95% CI) | 2.27 [1.83, 2.81] |
1.1. Analysis.
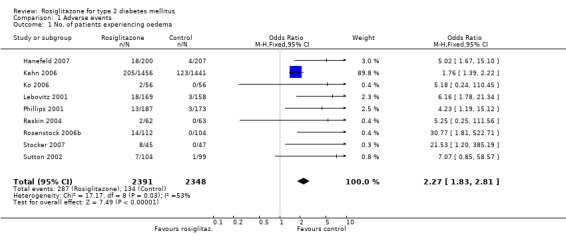
Comparison 1 Adverse events, Outcome 1 No. of patients experiencing oedema.
Characteristics of studies
Characteristics of included studies [ordered by study ID]
Derosa 2004.
| Methods | DURATION OF INTERVENTION: 12 months DURATION OF FOLLOW‐UP: 12 months RUN‐IN PERIOD: none LANGUAGE OF PUBLICATION: English | |
| Participants | WHO PARTCIPATED: white patients with type 2 diabetes mellitus and metabolic syndrome INCLUSION CRITERIA: white patients of either sex and ages >=18 years; type 2 diabetes according to ADA criteria (duration >=6 months); poor glycaemic control (HbA1c >=7.5% or >=1 adverse effect with diet and oral hypoglycaemic agents (e.g. SU or metformin) given up to the maximum tolerated dose; all patients also diagnosed with metabolic syndrome (National Cholesterol Education Program Adult Treatment Panel III classification; triglyceridaemia (TG >=150 mg/dl) and hypertension (WHO criteria BP >=130/>=85 mmHg); fasting C‐peptide level >1.0 ng/ml EXCLUSION CRITERIA: receiving glimepiride, history of ketoacidosis, unstable or rapidly progressive diabetic retinopathy, nephropathy or neuropathy; impaired hepatic function, impaired renal function, severe anaemia; severe cardiovascular disease (e.g. NYHA III or IV congestive heart failure or a history of myocardial infarction or stroke) or cerebrovascular conditions within 6 months before enrolment; women who were pregnant or breastfeeding or of childbearing potential and not taking adequate contraceptive precautions DIAGNOSTIC CRITERIA: ADA 2001 CO‐MORBIDITIES: not stated CO‐MEDICATIONS: 40.2% receiving antihypertensive drugs; no patient was receiving lipid‐lowering or antiaggregant drugs | |
| Interventions | NUMBER OF STUDY CENTRES: three COUNTRY/ LOCATION: Italy SETTING: unclear INTERVENTION (DOSE/DAY): rosiglitazone 4 mg once daily (before lunch); +fixed oral dose of glimepiride (4 mg/day divided into 2 doses; before breakfast and before dinner) CONTROL (DOSE/DAY): pioglitazone 15 mg once daily (before lunch); + fixed oral dose of glimepiride (4 mg/day divided into 2 doses; before breakfast and before dinner) TREATMENT BEFORE STUDY: 52.9% poor glycaemic control with metformin; 31% with SUs; 16.1% with glyburide; 14.9% with gliclazide TITRATION PERIOD: none | |
| Outcomes | PRIMARY OUTCOMES: changes in BMI, HbA1c, lipid profile, and lipoprotein variables were the primary efficacy variables SECONDARY OUTCOMES: fasting and postprandial plasma glucose, insulin levels, insulin resistance (HOMA); blood pressure; adverse events | |
| Notes | AIM OF STUDY: to assess the differential effect on glucose and lipid variables of the combination of glimepiride plus pioglitazone or rosiglitazone in patients with type 2 diabetes and the metabolic syndrome | |
| Risk of bias | ||
| Bias | Authors' judgement | Support for judgement |
| Allocation concealment? | Low risk | A ‐ Adequate |
Derosa 2006a.
| Methods | DURATION OF INTERVENTION: 12 months DURATION OF FOLLOW‐UP: 12 months RUN‐IN PERIOD: none LANGUAGE OF PUBLICATION: English | |
| Participants | WHO PARTCIPATED: Caucasian patients with type 2 diabetes and poor glycaemic control with diet or experiencing adverse effects with diet and metformin, administered up to the maximum tolerated dose INCLUSION CRITERIA: patients aged >= 18 years of either sex if they had type 2 diabetes mellitus according to the ADA (duration >= 6 months), and if they had poor glycaemic control (HbA1c levels > 7.5%) or experienced adverse effects with diet and metformin, administered up to the maximum tolerated dose; all patients were diagnosed with metabolic syndrome according to the National Cholesterol Education Program Adult Treatment Panel III classification and they presented with triglyceridaemia (triglycerides >= 150 mg/dL) and hypertension according to WHO 1999 criteria (systolic/diastolic BP >= 130/ >= 85 mmHg); all patients had a fasting C‐peptide level > 1.0 ng/mL and were overweight (BMI 25.0 ‐ 28.1) EXCLUSION CRITERIA: history of ketoacidosis; unstable or rapidly progressive diabetic retinopathy, nephropathy, or neuropathy; impaired hepatic function (defined as plasma aminotransferase and/or gamma‐glutamyltransferase levels higher than the upper limit of normal (ULN) for age and sex], impaired renal function (defined as serum creatinine levels higher than the ULN for age and sex) or severe anaemia; patients with serious cardiovascular disease (e.g. NYHA class I–IV congestive heart failure or a history of myocardial infarction or stroke) or cerebrovascular conditions within 6 months before study enrollment; women who were pregnant, breastfeeding or of childbearing potential and not taking adequate contraceptive precautions DIAGNOSTIC CRITERIA: ADA 2001 CO‐MORBIDITIES: not stated CO‐MEDICATIONS: not stated | |
| Interventions | NUMBER OF STUDY CENTRES: 3 COUNTRY/ LOCATION: Italy SETTING: Department of Internal Medicine and Therapeutics, University of Pavia (Pavia, Italy); the ‘G. Descovich’ Atherosclerosis Study Center, ‘D. Campanacci’ Clinical Medicine and Applied Biotechnology Department, University of Bologna (Bologna, Italy); the Diabetes Care Unit at S. Carlo Hospital of Milano (Milano, Italy). INTERVENTION (DOSE/DAY): metformin (mean dose 2250 mg/day) + rosiglitazone 4 mg/day (o.d., before lunch) CONTROL (DOSE/DAY): metformin (mean dose 2250 mg/day) + pioglitazone 15 mg/day (15 mg o.d., before lunch) TREATMENT BEFORE STUDY: diet or diet and metformin, administered up to the maximum tolerated dose TITRATION PERIOD: all paitents received metformin beginning with a dose of 1500 mg/day and increasing up to 3000 mg/day, self‐administered for 12 months, this dose depended on the tolerance or glycaemic control of the patients (mean dosage: 2250 ± 750 mg/day) | |
| Outcomes | PRIMARY OUTCOMES:
changes in BMI, HbA1c, lipid profile, lipoprotein variables
SECONDARY OUTCOMES:
(not stated)
"FPG, PPG and HOMA index
were also used to assess efficacy" BMI, HbA1c, fasting and postprandial plasma glucose (FPG, PPG) and insulin levels; HOMA; lipid profile; treatment tolerability |
|
| Notes | AIM OF STUDY: to assess the differential effect on glucose and lipid variables of the combination of metformin plus pioglitazone or metformin plus rosiglitazone in patients with type 2 diabetes mellitus and metabolic syndrome. | |
| Risk of bias | ||
| Bias | Authors' judgement | Support for judgement |
| Allocation concealment? | Low risk | A ‐ Adequate |
Derosa 2006b.
| Methods | DURATION OF INTERVENTION: 12 months DURATION OF FOLLOW‐UP: 12 months RUN‐IN PERIOD: none LANGUAGE OF PUBLICATION: English | |
| Participants | WHO PARTCIPATED:
type 2 diabetic patients with inadequate control on diet and oral hypoglycaemic agents
INCLUSION CRITERIA:
patients with metabolic syndrome diagnosis according to National Cholesterol Education Program (NCEP) (ATP III) classification and they presented at least three following components:
1. type 2 diabetes mellitus.
2. triglyceridemia >= 150 mg/dl.
3. Blood pressure >= 130/85 mmHg type 2 diabetes mellitus, according to ADA criteria; all were required to have been diagnosed as being diabetic for at least 6 months and did not have adequate glycaemic control (as suggested by ADA guidelines) with diet and oral hypoglycaemic agents such as sulphonylureas or metformin, both to the maximum tolerated dose; no patients were taking glimepiride or thiazolidinediones; all patients had a fasting C‐peptide level > 1.0 ng/ml; mean BMI of 25.3; furthermore, patients were hypertensive according to the WHO 1999 criteria (systolic BP >= 130 mmHg and diastolic BP >= 85mm Hg) and had triglyceridaemia >= 150 mg/dl EXCLUSION CRITERIA: history of ketoacidosis; unstable or rapidly progressive diabetic background retinopathy, nephropathy (microalbuminuria, evaluated by proteinuria <300mg/24 h) or neuropathy (evaluated by electromyography); impaired liver function (transaminases > 40 U/L), impaired kidney function (creatinine > 1.5mg/dl) or anaemia (Hb < 11.5 g/L); unstable cardiovascular conditions (e.g. NYHA class III or IV congestive heart failure or a history of myocardial infarction or stoke) or cerebrovascular conditions within 6months of study enrolment; women who were pregnant, lactating, or of child‐bearing potential while not taking adequate contraceptive precautions DIAGNOSTIC CRITERIA: ADA 2001 CO‐MORBIDITIES: not stated CO‐MEDICATIONS: at entry, 42 patients (44.2%) were taking antihypertensive drugs [16 participants, ACE‐inhibitors (38.1%); 12 participant, calcium antagonists (28.6%); 10 participants, AT II antagonists (23.8%) and four patients, alpha1‐antagonists (9.5%)]; no patients were taking lipid‐lowering or antiaggregation drugs |
|
| Interventions | NUMBER OF STUDY CENTRES: 2 COUNTRY/ LOCATION: Italy SETTING: Department of Internal Medicine and Therapeutics at University of Pavia, the G. Descovich Atherosclerosis Study Center, D. Campanacci Clinical Medicine and Applied Biotechnology Department at University of Bologna INTERVENTION (DOSE/DAY): rosiglitazone 4 mg/day + metformin 1500 mg/day CONTROL (DOSE/DAY): glimepiride 2 mg/day+ metformin 1500 mg/day TREATMENT BEFORE STUDY: patients did not have adequate glycaemic control with diet and oral hypoglycaemic agents such as sulphonylureas or metformin, both to the maximum tolerated dose TITRATION PERIOD: none | |
| Outcomes | PRIMARY OUTCOMES: changes in BMI, HbA1c, lipid profile and lipoprotein parameters were the primary efficacy variables SECONDARY OUTCOMES: (not stated) height, weight, BMI, HbA1c, FPG, PPG, fasting plasma insulin; postprandial plasma insulin; lipid profile and lipoprotein parameters; HOMA; adverse events | |
| Notes | AIM OF STUDY: the aim of this study is to compare the metabolic changes induced by metformin associated to glimepiride or rosiglitazone in type 2 diabetic patients | |
| Risk of bias | ||
| Bias | Authors' judgement | Support for judgement |
| Allocation concealment? | Low risk | A ‐ Adequate |
Garber 2006.
| Methods | DURATION OF INTERVENTION: 24 weeks DURATION OF FOLLOW‐UP: 24 weeks RUN‐IN PERIOD: during the 1‐week, open‐label lead‐in phase, patients maintained their prescreening dosage of >= 1500 mg/day metformin therapy; LANGUAGE OF PUBLICATION: English | |
| Participants | WHO PARTCIPATED: type 2 diabetes patients inadequately controlled on metformin monotherapy. INCLUSION CRITERIA: adults (age 20–78 years) with established type 2 diabetes requiring oral therapy; before screening, patients were required to be on a stable dosage of metformin >= 1500 mg/day for >= 8 weeks, HbA1c levels >7.0 and <= 12.0% and BMI >= 23 and <= 45; only patients willing and able to perform self‐blood glucose; women of childbearing potential had to practise acceptable methods of birth control and to have negative pregnancy test results within 72 h of study treatment EXCLUSION CRITERIA: marked polyuria and polydipsia with >10% weight loss; the use of any hypoglycaemic agent other than metformin within 8 weeks before screening; anaemia [haemoglobin level: <12.5 g/dl (men) and <11.0 g/dl (women)] and significantly abnormal renal, cardiac or hepatic dysfunction or disease; pregnant or nursing women and patients with known sensitivity to any study medications were excluded. DIAGNOSTIC CRITERIA: not stated CO‐MORBIDITIES: not stated CO‐MEDICATIONS: not stated | |
| Interventions | NUMBER OF STUDY CENTRES:
76
COUNTRY/ LOCATION:
USA
SETTING:
not stated
INTERVENTION (DOSE/DAY):
metformin 500 mg plus rosiglitazone 4 mg/day (initial daily dose 1000–2000 mg + 4 mg, depending on previous treatment)
[mean final dose of metformin plus rosiglitazone was 1819 and 7.1 mg]
CONTROL (DOSE/DAY):
metformin‐glibenclamide 500/2.5 mg/day (initial daily dose 1000/5 mg)
[mean final dose of metformin‐glibenclamide tablets was 1509/7.6 mg]
TREATMENT BEFORE STUDY:
patients were required to be on a stable dosage of metformin >= 1500 mg/day for >= 8 weeks
TITRATION PERIOD:
patients were randomly assigned to one of two double‐blind treatments, according to the dose of metformin during the lead‐in phase:
patients receiving 1500 mg/day metformin before screening received metformin‐glibenclamide 1000/5 mg/day (in divided doses) or metformin 1500 mg plus rosiglitazone 4 mg daily (in divided doses); those previously receiving >1500 mg/day were randomly assigned to metformin‐glibenclamide 1000/5 mg (in divided doses) or metformin 2000 mg plus rosiglitazone 4 mg daily (in divided doses) study medications were titrated based on mean daily glucose levels to achieve a therapeutic glycaemic target |
|
| Outcomes | PRIMARY OUTCOMES: change in HbA1c from baseline to week 24 or the last prior blinded visit SECONDARY OUTCOMES: changes in body weight and changes in fructosamine, FPG, 2‐h postprandial plasma glucose and fasting insulin levels from baseline to week 24 or the last prior blinded visit; proportion of patients achieving therapeutic glycaemic response (HbA1c levels <7.0% and FPG levels <7 mmol/L) at week 24 or the last prior blinded visit; safety outcomes included adverse events, particularly hypoglycaemic symptoms; standard haematology, serum chemistry and urinalysis | |
| Notes | AIM OF STUDY: to compare the effects of two combination regimens, metformin‐glibenclamide combination tablets versus metformin plus rosiglitazone in patients inadequately controlled on metformin monotherapy. | |
| Risk of bias | ||
| Bias | Authors' judgement | Support for judgement |
| Allocation concealment? | Unclear risk | B ‐ Unclear |
Goldberg 2005.
| Methods | DURATION OF INTERVENTION: 24 weeks DURATION OF FOLLOW‐UP: 24 weeks RUN‐IN PERIOD: oral placebo; single‐blind; 4 weeks LANGUAGE OF PUBLICATION: English | |
| Participants | WHO PARTCIPATED: patients with type 2 diabetes mellitus who were treated with diet alone or oral monotherapy INCLUSION CRITERIA: men or women >= 35 years of age with a diagnosis of type 2 diabetes (WHO) with fasting triglyceride levels >= 150 mg/dl and< 600 mg/dl and fasting LDL cholesterol levels < 130 mg/dl; fasting serum C‐peptide levels >= 1 ng/ml and HbA1c values >= 7 and <= 11% if naive to previous oral antihyperglycemic therapy or HbA1c values >= 7 and <= 9.5% if previously treated with oral antihyperglycemic monotherapy. EXCLUSION CRITERIA: treatment within 60 days of screening with insulin, systemic glucocorticoid therapy; combination oral antihyperglycemic therapy, any lipid‐lowering agent, or any weight loss agent; known allergy to any thiazolidinedione; serum creatinine >= 176.8 µmol/dl (>= 2.0 mg/dl) or 2+ dipstick proteinuria at screening; ALT or AST >= 1.5 times the upper limit of normal or significant clinical liver disease; hemoglobin < 10.5 g/dl (females) or < 11.5 g/dl (males) at screening; abnormal thyrotropin; functional NYHA class III or IV, history of CVD, or heart surgery within 6 months of screening; receiving renal dialysis or having renal transplant; current therapy for malignancy other than basal cell or squamous cell skin cancer; known history of HIV infection; signs or symptoms of drug or alcohol abuse; any condition or situation precluding adherence to and completion of the protocol. For female subjects, appropriate birth control was required, and pregnancy, breast‐feeding, or the intent to become pregnant during the study period prohibited participation. DIAGNOSTIC CRITERIA: WHO CO‐MORBIDITIES: control vs intervention: ‐ pre‐existing CVD or previous myocardial infarction 8.4% vs 6.6% CO‐MEDICATIONS: not stated | |
| Interventions | NUMBER OF STUDY CENTRES:
100 (USA 78)
COUNTRY/ LOCATION:
USA, Puerto Rico, Mexico, Colombia
SETTING:
not stated
INTERVENTION (DOSE/DAY):
rosiglitazone 4 mg daily for 12 weeks; thereafter 4 mg twice daily (8 mg/day) for 12 weeks
CONTROL (DOSE/DAY):
pioglitazone 30 mg daily for 12 weeks; thereafter 45 mg once daily for 12 weeks
TREATMENT BEFORE STUDY:
participants discontinued any current oral antihyperglycaemic treatment drug naive (%) ‐ I1: 26.5, I2: 26.6, C: 28.5 prior monotherapy (%) ‐ I1: 68.7, I2: 65.7, C1: 63.9 prior combination therapy (%) ‐ TITRATION PERIOD ‐ pioglitazone: 30 mg daily for 12 weeks; thereafter 45 mg once daily for 12 weeks ‐ rosiglitazone: 4 mg daily for 12 weeks; thereafter 4 mg twice daily (8 mg/day) for 12 weeks |
|
| Outcomes | PRIMARY OUTCOMES: triglycerides change from baseline to the last observed value SECONDARY OUTCOMES: total cholesterol; plasma glucose; free fatty acids; apolipoprotein B; total insulin; C‐peptide; highly sensitive C‐reactive protein; plasminogen activator inhibitor‐1 (PAI‐1); HDL‐C; LDL‐C particle size and concentration; surrogates of insulin resistance and beta‐cell function (HOMA); safety assessments including adverse events, body weight, pedal oedema and hypoglycaemic episodes | |
| Notes | AIM OF STUDY: to test the hypothesis that pioglitazone has greater triglyceride‐lowering effects than rosiglitazone ‐ comparison of maximally effective monotherapy doses of pioglitazone and rosiglitazone in patients with type 2 diabetes and dyslipidemia receiving no concomitant glucose‐lowering or lipid‐lowering therapies | |
| Risk of bias | ||
| Bias | Authors' judgement | Support for judgement |
| Allocation concealment? | Unclear risk | B ‐ Unclear |
Hanefeld 2007.
| Methods | DURATION OF INTERVENTION: 52 weeks DURATION OF FOLLOW‐UP: 52 weeks RUN‐IN PERIOD: eligible patients on oral antidiabetic medication stopped treatment 2 weeks before starting a 4‐week, single‐blind placebo run‐in period LANGUAGE OF PUBLICATION: English | |
| Participants | WHO PARTCIPATED: patients with type 2 diabetes INCLUSION CRITERIA: FPG = 7.0 ‐ 15.0 mmol/L C‐peptide >= 27 nmol/L; BMI = 22 ‐ 38 EXCLUSION CRITERIA: patients on insulin therapy or those with diabetic complications requiring treatment, heart failure NYHA III/IV, or serious renal, hepatic (liver function tests > 2.5 times the upper limit of normal). haematologic impairment or women of childbearing potential DIAGNOSTIC CRITERIA: see above CO‐MORBIDITIES: not stated CO‐MEDICATIONS: not stated | |
| Interventions | NUMBER OF STUDY CENTRES:
71
COUNTRY/ LOCATION:
8 European countries
SETTING:
not stated
INTERVENTION (DOSE/DAY):
rosiglitazone as two equal daily doses (i.e. 2 mg bid or 4 mg bid) + placebo
CONTROL (DOSE/DAY):
glibenclamide once daily + placebo
TREATMENT BEFORE STUDY:
patients on monotherapy, combination therapy or diet and exercise only
TITRATION PERIOD:
over the first 12 weeks of treatment, the glibenclamide dose was titrated in 2.5 mg increments (final dose
range = 2.5 ‐ 15 mg) to achieve optimal glycaemic
control a double‐dummy system allowed ‘‘titration’’ of rosiglitazone without a change of dose concomitant medications with potential effects on glucose or lipid metabolism were kept at constant dose throughout the study |
|
| Outcomes | PRIMARY OUTCOMES: difference between rosiglitazone 8 mg/day and glibenclamide treatment groups with respect to change from baseline in HbA1c after 52 weeks of treatment SECONDARY OUTCOMES: (not stated) lipids, insulin resistance (HOMA), insulin, proinsulin, 32‐33 split proinsulin, safety, adverse effects | |
| Notes | AIM OF STUDY: to compare the efficacy, tolerability and safety of rosiglitazone with that of glibenclamide as monotherapy for patientswith type 2 diabetes over a 12‐month treatment period | |
| Risk of bias | ||
| Bias | Authors' judgement | Support for judgement |
| Allocation concealment? | Unclear risk | B ‐ Unclear |
Hällsten 2002.
| Methods | DURATION OF INTERVENTION: 26 weeks DURATION OF FOLLOW‐UP: 26 weeks RUN‐IN PERIOD: 4‐weeks with written diet instructions LANGUAGE OF PUBLICATION: English | |
| Participants | WHO PARTCIPATED: patients with newly diagnosed or diet‐treated type 2 diabetes INCLUSION CRITERIA: patients with type 2 diabetes, as defined by the WHO criteria and no diabetes complications EXCLUSION CRITERIA: fasting plasma glucose value < 6.1 mmol/l or > 11.0 mmol/L after the run‐in period; patients with cardiovascular disease, blood pressure > 160/100 mm Hg, previous or present abnormal hepatic or renal function, antidiabetic medication, anemia, or oral corticosteroid treatment DIAGNOSTIC CRITERIA: WHO 1998 CO‐MORBIDITIES: not stated CO‐MEDICATIONS: not stated | |
| Interventions | NUMBER OF STUDY CENTRES: not stated (1) COUNTRY/ LOCATION: Finland SETTING: the patients were recruited by advertisement and among clients of the occupational health service in Turku, Finland INTERVENTION (DOSE/DAY): rosiglitazone 8 mg/day (4 mg b.i.d.) CONTROL (DOSE/DAY): C1: metformin 2 g (1g b.i.d.) C2: placebo TREATMENT BEFORE STUDY: none or diet only TITRATION PERIOD: rosiglitazone (2 mg b.i.d. for 2 weeks, thereafter 4 mg b.i.d.), metformin (500 mg b.i.d. for 2 weeks, thereafter 1 g b.i.d.), or placebo | |
| Outcomes | PRIMARY OUTCOMES: not stated (insulin‐ and exercise‐stimulated skeletal muscle glucose uptake, measured by means of positron emission tomography (PET) during euglycemic‐hyperinsulinemic clamp and one‐legged exercise) SECONDARY OUTCOMES: (not stated) FPG, insulin, HbA1c, body weight, blood pressure | |
| Notes | AIM OF STUDY: to compare the effects of treatment with rosiglitazone and metformin on insulin‐ and exercise‐stimulated glucose uptake and perfusion in skeletal muscle tissue in patients with type 2 diabetes. | |
| Risk of bias | ||
| Bias | Authors' judgement | Support for judgement |
| Allocation concealment? | Unclear risk | B ‐ Unclear |
Jung 2005.
| Methods | DURATION OF INTERVENTION: 6 months DURATION OF FOLLOW‐UP: 6 months RUN‐IN PERIOD: none LANGUAGE OF PUBLICATION: English | |
| Participants | WHO PARTCIPATED: Koreans with type 2 diabetes mellitus who showed poor glycaemic control with glimepiride INCLUSION CRITERIA: aged 20‐70 years; secondary treatment failure (HbA1c > 8% on glimepiride 4 mg/day or equivalent dose of other sulfonylureas) EXCLUSION CRITERIA: no other severe illnesses including liver failure, renal failure, heart failure DIAGNOSTIC CRITERIA: not stated CO‐MORBIDITIES: retinopathy ‐ I: 3/14, C: 3/13 proteinuria ‐ I: 2/14, C: 3/13 coronary heart disease ‐ I: 2/14, C: 2/13 CO‐MEDICATIONS lipid‐lowering agents ‐ I: 5/14, C: 3/13 | |
| Interventions | NUMBER OF STUDY CENTRES: 1 COUNTRY/ LOCATION: Korea SETTING: diabetes clinic of the Seoul National University Hospital INTERVENTION (DOSE/DAY): rosiglitazone 4 mg/day + glimepiride 4 mg/day CONTROL (DOSE/DAY): metformin 1000 mg/day + glimepiride 4 mg/day TREATMENT BEFORE STUDY: glimepiride 4 mg/day or equivalent dose of other sulfonylureas TITRATION PERIOD: none | |
| Outcomes | PRIMARY OUTCOMES: not stated (resistin) SECONDARY OUTCOMES: (not stated) adiponectin, FPG, lipids, HbA1c, plasma insulin, plasma C‐peptide | |
| Notes | AIM OF STUDY: to see whether improving insulin resistance can modulate circulating resistin levels, the effects of two different insulin sensitizers, rosiglitazone and metformin, on plasma resistin concentrations in Korean participants with type 2 diabetes mellitus were investigated | |
| Risk of bias | ||
| Bias | Authors' judgement | Support for judgement |
| Allocation concealment? | Unclear risk | B ‐ Unclear |
Kahn 2006.
| Methods | DURATION OF INTERVENTION: 4.0 years (median) DURATION OF FOLLOW‐UP: 4.0 years (median) RUN‐IN PERIOD: 4 weeks, placebo + diet/exercise LANGUAGE OF PUBLICATION: English | |
| Participants | WHO PARTCIPATED:
people with recently diagnosed type 2 diabetes mellitus, treated with life style management only
INCLUSION CRITERIA:
eligible patients were between the ages of 30 and 75 years, with fasting plasma glucose levels ranging from 126 to 180 mg per deciliter (7.0 to 10.0 mmol per liter) while their only treatment was lifestyle management
EXCLUSION CRITERIA:
clinically significant hepatic disease, renal impairment, a history of lactic acidosis, unstable or severe angina, known congestive heart failure (CHF, New York Heart Association class I, II, III, or IV), or uncontrolled hypertension
DIAGNOSTIC CRITERIA:
"recently diagnosed (i.e., within 3 years)"
CO‐MORBIDITIES:
not stated
CO‐MEDICATIONS:
Antihypertensive therapy [no. (%)]:
I1: 744 (51.1)
C1: 737 (50.7)
C2: 753 (52.3) Lipid‐lowering therapy [no. (%)] I1: 378 (26.0) C1: 377 (25.9) C2: 370 (25.7) |
|
| Interventions | NUMBER OF STUDY CENTRES:
488
COUNTRY/ LOCATION:
United States, Canada, and 15 European countries
SETTING:
not stated
INTERVENTION (DOSE/DAY):
rosiglitazone (max 8 mg/day)
CONTROL (DOSE/DAY):
metformin (max 2g/day)
glyburide (max 15 mg/day)
TREATMENT BEFORE STUDY:
diet/exercise
TITRATION PERIOD:
patients received initial daily doses of 4 mg of rosiglitazone, 500 mg of metformin, or 2.5 mg of glyburide for each drug, the dose was increased according to the protocol to the maximum daily effective dose (4 mg of rosiglitazone twice daily, 1 g of metformin twice daily, and 7.5 mg of glyburide twice daily a dose increase was required at each visit if the fasting plasma glucose level was 140 mg per deciliter or more; a dose reduction was permitted if adverse events occurred |
|
| Outcomes | PRIMARY OUTCOMES:
time from randomization to treatment failure, which was defined as confirmed hyperglycemia (fasting plasma glucose level, >180 mg/dl) on consecutive testing after at least 6 weeks of treatment at the maximum‐dictated or maximum‐tolerated dose
of the study drug an independent adjudication committee, whose members were unaware of assignments to treatment groups, used prespecified criteria (available at www.nejm.org) to determine whether the primary outcome was reached in cases in which a confirmatory fasting plasma glucose level had not been obtained, a patient had withdrawn because of an insufficient therapeutic effect, or an additional glucose lowering drug had been administered before the confirmation of hyperglycemia (according to a protocol amendment adopted in February 2004) the threshold of more than 180 mg per deciliter for confirmed hyperglycemia was selected to represent unequivocal failure in the maintenance of adequate glycemic control without incurring undue hyperglycemic symptoms; the threshold of a fasting plasma glucose level of more than 140 mg per deciliter for increasing the dose of a study drug reflected clinical guidelines at the time of study design. SECONDARY OUTCOMES: time from randomization to a confirmed fasting plasma glucose level of more than 140 mg per deciliter after at least 6 weeks of treatment at the maximum‐tolerated dose of a study drug (for patients who entered the study with a fasting plasma glucose level of 140 mg per deciliter or less) other prespecified outcomes were levels of fasting plasma glucose and glycated hemoglobin, weight, and measures of insulin sensitivity and beta‐cell function, as determined by homeostasis model assessment (HOMA 2) with the use of the HOMA calculator (www.dtu.ox.ac.uk) Secondary endpoints according to the published study protocol (Diabetes Care 2002): ‐ glycaemic control ‐ insulin sensitivity ‐ beta‐cell function ‐ cardiovascular risk markers ‐ renal function ‐ patient reported outcomes (quality of life) ‐ resource utilization (direct health care costs will be assessed as the number of emergency room visits, number of unscheduled visits to the study physician’s office, number of hospitalizations, and length of stay. Furthermore, indirect economic costs associated with bed days (days when patients stay in bed for half a day or more) and restricted activity days (days when patients reduce their usual activities, such as housework or shopping) will be evaluated) ‐ safety parameters (including hypoglycaemia) |
|
| Notes | AIM OF STUDY:
to evaluate the durability of glycemic control in
patients receiving monotherapy with rosiglitazone, metformin or glyburide zhe therapeutic goal was a fasting plasma glucose level below 140 mg/dl (7.8 mmol/L). |
|
| Risk of bias | ||
| Bias | Authors' judgement | Support for judgement |
| Allocation concealment? | Low risk | A ‐ Adequate |
Ko 2006.
| Methods | DURATION OF INTERVENTION: one year DURATION OF FOLLOW‐UP: one year RUN‐IN PERIOD: none LANGUAGE OF PUBLICATION: English | |
| Participants | WHO PARTCIPATED:
Chinese patients with type 2 diabetes and conventional oral antidiabetic drugs failure
INCLUSION CRITERIA:
OAD failure was defined as persistent hyperglycaemia with haemoglobin AIc (HbA1c) >= 8.5% for 6 mo or longer despite continuous use of maximal doses of conventional OAD; maximum recommended doses of various OADs were given as follows: glibenclamide 20 mg/d, gliclazide 320 mg/d, glipizide 20 mg/d, and metformin 3 g/d
EXCLUSION CRITERIA:
uncontrolled hypertension
with sitting blood pressure (BP) >200/110 mm Hg and/or a history of myocardial
infarction, cerebrovascular accident, or uncontrolled congestive heart failure during the previous 6 mo, or significant renal impairment (plasma creatinine concentration >= 150 mmol/L)
DIAGNOSTIC CRITERIA:
not stated
CO‐MORBIDITIES:
not stated
CO‐MEDICATIONS:
antihypertensive agents [no (%)]:
I1: 31 (55.3)
C1: 14 (25.0) lipid‐lowering agents [no (%)]: I1: 5 (8.9) C1: 2 (3.6) |
|
| Interventions | NUMBER OF STUDY CENTRES:
1
COUNTRY/ LOCATION:
Hong Kong, China
SETTING:
Diabetic Clinic and Diabetes Center at AH Nethersole Hospital, in Tai PO, Hong Kong.
INTERVENTION (DOSE/DAY):
rosiglitazone max 8 mg/d
CONTROL (DOSE/DAY):
bedtime isophane insulin
TREATMENT BEFORE STUDY:
OAD ‐ original OAD and other medications remained the same throughout the study patients who fulfilled the inclusion criteria were referred to dietitians and diabetic nursing specialists for reinforcement of their dietary habits, drug compliance, and an understanding of OAD failure; those with HbA1c >=8.5% three months after reinforcement were included TITRATION PERIOD: oral rosiglitazone was started at 2 mg/d, insulin was begun at a dose of 6 units administered at night; the insulin dose was titrated 2 to 4 wk later by a diabetic nursing specialist with an increment of 2 to 4 units according to tolerability of the insulin injection and fasting plasma glucose (PG) improvement at 12, 24, 36, and 52 wk, all patients were seen for assessment of tolerability and compliance with treatment, and for measurement of lipid, glycemic, and other biochemical indices; insulin dosage was adjusted at each visit if this was deemed necessary, with the goal of achieving an HbA1c concentration <7.5%; if the drug was tolerable to patients, rosiglitazone was also increased to the maximum dose of 8 mg daily, with the goal of reducing HhA1c to <7.5% without the occurrence of significant hypoglycemia |
|
| Outcomes | PRIMARY OUTCOMES: not stated (differences in HbA1c) SECONDARY OUTCOMES: (not stated) lipids, BMI, FPG, blood pressure | |
| Notes | AIM OF STUDY: to evaluate the efficacy and tolerability of rosiglitazone in patients with secondary oral anti‐diabetic drug failure and to directly compare rosiglitazone with bedtime insulin | |
| Risk of bias | ||
| Bias | Authors' judgement | Support for judgement |
| Allocation concealment? | Unclear risk | B ‐ Unclear |
Lebovitz 2001.
| Methods | DURATION OF INTERVENTION: 26 weeks DURATION OF FOLLOW‐UP: 26 weeks RUN‐IN PERIOD: 4‐week single blind placebo baseline period (instruction on a weight maintenance diet) LANGUAGE OF PUBLICATION: English | |
| Participants | WHO PARTCIPATED: patients with type 2 diabetes whose hyperglycemia was inadequately controlled by diet or an oral antihyperglycemic agent INCLUSION CRITERIA: 36–81 years old, patients with a diagnosis of type 2 diabetes (as defined by the NDDG) if they had FPG between 7.8 –16.7 mmol/L, fasting plasma C‐peptide level greater than 0.26 nmol/L, and a body mass index (BMI) between 22–38 kg/m2 at screening EXCLUSION CRITERIA: patients with angina or cardiac insufficiency NYHA class III or IV; renal impairment (serum creatinine > 159 mmol/L), hepatic disease (alanine aminotransferase (ALT), aspartate aminotransferase (AST), alkaline phosphatase, or total bilirubin, > 2.5 times the upper limit of the reference range); history of diabetic ketoacidosis, history of chronic insulin use, symptomatic diabetic neuropathy; a serious major illness that would compromise their participation; women of childbearing potential DIAGNOSTIC CRITERIA: NDDG 1979 CO‐MORBIDITIES: not stated CO‐MEDICATIONS: not stated | |
| Interventions | NUMBER OF STUDY CENTRES:
42
COUNTRY/ LOCATION:
USA
SETTING:
not stated
INTERVENTION (DOSE/DAY):
I1: rosiglitazone 4 mg/day
(2 mg twice daily)
I2: rosiglitazone 8 mg/day
(4 mg twice daily)
CONTROL (DOSE/DAY):
placebo
TREATMENT BEFORE STUDY:
diet or an oral antihyperglycemic agent drug naive (%) ‐ I1: 26.5, I2: 26.6, C: 28.5 prior monotherapy (%) ‐ I1: 68.7, I2: 65.7, C1: 63.9 prior combination therapy (%) ‐ TITRATION PERIOD: screening period of up to 14 days (during which patients discontinued all antidiabetic medications); 4‐week run‐in; 26 weeks treatment period |
|
| Outcomes | PRIMARY OUTCOMES: change in HbA1c from baseline to 26 weeks SECONDARY OUTCOMES: (not stated) comparisons of rosiglitazone with placebo for changes from baseline to week 26 in FPG, C‐peptide, immunoreactive insulin, proinsulin, 32–33 split proinsulin, fructosamine, urinary albumin excretion as determined by urinary albumin/creatinine ratio (ACR), and serum lipids; the proportions of patients who had a reduction in HbA1c of more than 1 percentage point or a reduction in FPG of more than 1.67 mmol/L at week 26 compared with baseline; HOMA; interim medical histories, reports of adverse events, and standard laboratory assessments (including clinical chemistry, hematology, and urinalysis) were obtained at each visit; ECGs | |
| Notes | AIM OF STUDY: to assess the efficacy and safety of rosiglitazone monotherapy in patients with type 2 diabetes whose hyperglycemia was inadequately controlled by diet or an oral antihyperglycemic agent | |
| Risk of bias | ||
| Bias | Authors' judgement | Support for judgement |
| Allocation concealment? | Unclear risk | B ‐ Unclear |
Ovalle 2004.
| Methods | DURATION OF INTERVENTION: 6 months DURATION OF FOLLOW‐UP: 6 months RUN‐IN PERIOD: none LANGUAGE OF PUBLICATION: English | |
| Participants | WHO PARTCIPATED: patients with type 2 diabetes inadequately controlled on a maximized oral antihyperglycemic double regimen of glimepiride and metformin INCLUSION CRITERIA: not stated EXCLUSION CRITERIA: not stated DIAGNOSTIC CRITERIA: not stated CO‐MORBIDITIES: not stated CO‐MEDICATIONS: not stated | |
| Interventions | NUMBER OF STUDY CENTRES: 1 COUNTRY/ LOCATION: USA SETTING: University of Alabama (Birmingham, Alabama, USA) INTERVENTION (DOSE/DAY): rosiglitazone 8 mg + metformin/sulfonylurea (administered once daily) CONTROL (DOSE/DAY): insulin injection of 70130 mixed human insulin (administered once daily before supper) + metformin/sulfonylurea TREATMENT BEFORE STUDY: maximized oral antihyperglycemic double regimen of glimepiride and metformin TITRATION PERIOD: the dose of rosiglitazone was fixed, whereas the 70/30 insulin was started at 0.2 units/kg and adjusted to achieve a FPG level of <= 120 mgldl without occurrence of severe or frequent hypoglycaemia | |
| Outcomes | PRIMARY OUTCOMES: not stated (pancreatic beta‐cell function) SECONDARY OUTCOMES: (not stated) fasting glucose, serum insulin, proinsulin levels, intravenous glucose tolerance tests, glucagon stimulation test for C‐peptide, HOMA | |
| Notes | AIM OF STUDY: to confirm that TZDs improve pancreatic beta‐cell function independent of the improvement in glycaemic control | |
| Risk of bias | ||
| Bias | Authors' judgement | Support for judgement |
| Allocation concealment? | Unclear risk | B ‐ Unclear |
Phillips 2001.
| Methods | DURATION OF INTERVENTION: 26 weeks DURATION OF FOLLOW‐UP: 26 weeks RUN‐IN PERIOD: 4‐week placebo LANGUAGE OF PUBLICATION: English | |
| Participants | WHO PARTCIPATED: type 2 diabetes patients INCLUSION CRITERIA: age 40–80 years; BMI 22–38 kg/m2; type 2 diabetes as defined by the NDDG; FPG 7.8–16.7 mmol/L (140–300 mg/dl), and fasting C‐peptide >= 0.27 nmol/L (>= 0.8 ng/ml) at the time of screening EXCLUSION CRITERIA: clinically significant renal disease, NYHA class III‐IV, coronary insufficiency or congestive heart failure, symptomatic diabetic neuropathy, or elevations in total bilirubin, alkaline phosphatase, alanine aminotransferase (ALT), or aspartate aminotransferase 2.5 times the upper limit DIAGNOSTIC CRITERIA: NDDG 1979 CO‐MORBIDITIES: not stated CO‐MEDICATIONS: not stated | |
| Interventions | NUMBER OF STUDY CENTRES:
65
COUNTRY/ LOCATION:
USA
SETTING:
not stated
INTERVENTION (DOSE/DAY):
I1: rosiglitazone 4 mg/day (4mg o.d)
I2: rosiglitazone 4 mg/day (2 mg b.i.d.)
I3: rosiglitazone 8 mg/day (8 mg o.d.)
I4: rosiglitazone 8 mg/day (4 mg b.i.d.)
CONTROL (DOSE/DAY):
placebo
TREATMENT BEFORE STUDY:
oral antihyperglycaemic agents were discontinued at least 14 days before a 4‐week placebo run‐in period diet only (%) ‐ I1: 22.1, I2: 24.7, I3: 29.3, I4: 25.1, C: 22.5 oral monotherapy (%) ‐ I1: 61.3, I2: 55.9, I3: 54.7, I4: 64.7, C: 61.8 oral combination therapy (%) ‐ I1: 16.6, I2: 19.4, I3: 16.0, I4: 10.2, C1: 15.6 TITRATION PERIOD: none |
|
| Outcomes | PRIMARY OUTCOMES:
change in HbA1c from baseline (end of the 4‐week placebo run‐in period) after 26 weeks of treatment
SECONDARY OUTCOMES:
the change from baseline after 26 weeks of treatment in FPG, immunoreactive insulin, C‐peptide, lipid levels Clinical chemistry, hematology, liver enzymes, and urinalysis; HOMA |
|
| Notes | AIM OF STUDY: to examine the efficacy of rosiglitazone in reducing HbA1c and to evaluate the therapeutic equivalence of once‐daily and twice‐daily dosing regimens. | |
| Risk of bias | ||
| Bias | Authors' judgement | Support for judgement |
| Allocation concealment? | Unclear risk | B ‐ Unclear |
Raskin 2004.
| Methods | DURATION OF INTERVENTION: 24 weeks DURATION OF FOLLOW‐UP: 24 weeks RUN‐IN PERIOD: a screening visit was followed by a 2‐week washout period (previous diabetes medication discontinued) LANGUAGE OF PUBLICATION: English | |
| Participants | WHO PARTCIPATED: type 2 diabetic patients who had shown treatment failure using sulphonylurea monotherapy or metformin monotherapy INCLUSION CRITERIA: type 2 diabetes for at least 12 months, with HbA1c values > 7.0% and <= 12% during previous monotherapy with sulphonylurea or metformin (at 50% or more of the maximal recommended dosages) for at least 3 months EXCLUSION CRITERIA: if being treated within the previous 3 months with any of the following agents: insulin, repaglinide, thiazolidinediones, alpha‐glucosidase inhibitors, or combination therapy with antidiabetic medications DIAGNOSTIC CRITERIA: not stated CO‐MORBIDITIES: not stated CO‐MEDICATIONS: not stated | |
| Interventions | NUMBER OF STUDY CENTRES:
not stated (multicentre)
COUNTRY/ LOCATION:
USA
SETTING:
not stated
INTERVENTION (DOSE/DAY):
I1: rosiglitazone 8.0 mg/day (mean final dose)
I2: rosiglitazone 6.0 mg/day (mean final dose) + repaglinide 4.0 mg/day (mean final dose)
CONTROL (DOSE/DAY):
repaglinide 12 mg/day (mean final dose)
TREATMENT BEFORE STUDY:
previous monotherapy with sulphonylurea or metformin (at 50% or more of the maximal recommended dosages) for at least 3 months:
previous SU/metformin (n/n/tot) ‐
I1: 30/32/62, I2: 81/46/127 ,
C: 40/23/63
TITRATION PERIOD:
12‐week dose‐adjustment period:
repaglinide monotherapy
was initiated at 0.5 mg per meal if HbA1c levels were <= 8%, and at 1 mg per meal for all other patients;
the initial dosage of rosiglitazone monotherapy was 2 mg b.i.d.;
repaglinide/rosiglitazone combination therapy was initiated at 0.5 mg or 1 mg repaglinide per meal (adjusted according to HbA1c as above), plus 2 mg rosiglitazone b.i.d. all patients in groups treated with repaglinide (monotherapy or combination) could have dosage adjusted up to a maximal dose of 4 mg per meal; the rosiglitazone dosage could be doubled in monotherapy or combination therapy groups at week 12, up to a maximum dose not to exceed 4 mg b.i.d.; the dose‐adjustment period was followed by 12 additional weeks of maintenance therapy |
|
| Outcomes | PRIMARY OUTCOMES: change in HbA1c values from baseline to the end of study treatment SECONDARY OUTCOMES: changes in FPG values; alanine aminotransferase (ALT); lipids; adverse events and reports of hypoglycemic episodes | |
| Notes | AIM OF STUDY: to investigate the therapeutic effects of repaglinide combination therapy with rosiglitazone; the efficacy, safety, and tolerability of the combination were compared with those of monotherapy with either agent alone, in patients who had shown treatment failure using sulphonylurea monotherapy or metformin monotherapy | |
| Risk of bias | ||
| Bias | Authors' judgement | Support for judgement |
| Allocation concealment? | Unclear risk | B ‐ Unclear |
Rosenstock 2006b.
| Methods | DURATION OF INTERVENTION: 24 weeks DURATION OF FOLLOW‐UP: 24 weeks RUN‐IN PERIOD: during the screening/titration phase, patients not on the maximum metformin dose were titrated to 2000 mg/day; patients on 1000 mg/day increased their dose to 1500 mg/day immediately and to 2000 mg/day 1 week later (or maximum tolerated dose), followed by a 2‐week stabilization period; patients on 1500 mg/ day increased their dose to 2000 mg/day immediately followed by a 2‐week stabilization period LANGUAGE OF PUBLICATION: English | |
| Participants | WHO PARTCIPATED: insulin‐naive patients with type 2 diabetes inadequately controlled on dual oral therapy with sulfonylurea plus metformin INCLUSION CRITERIA: participants >= 18 years of age with type 2 diabetes (HbA1c >= 7.5 and <= 11%) and a BMI of > 25; continuous oral hypoglycemic treatment using stable daily doses of >= 50% of the maximally labeled dose of a sulfonylurea and at least 1000 mg metformin was required for >= 3 months before the screening visit EXCLUSION CRITERIA: stroke, myocardial infarction, angina pectoris, coronary artery bypass graft, or percutaneous transluminal coronary angioplasty within the previous 12 months; history of congestive heart failure; treatment with nonselective beta‐blockers; hypoglycemia unawareness; impaired renal function; active liver disease; substance or alcohol abuse; malignancy; planned radiological examinations requiring administration of contrasting agents DIAGNOSTIC CRITERIA: HbA1c >= 7.5 and <= 11% CO‐MORBIDITIES: not stated CO‐MEDICATIONS: not stated | |
| Interventions | NUMBER OF STUDY CENTRES:
42
COUNTRY/ LOCATION:
USA
SETTING:
not stated
INTERVENTION (DOSE/DAY):
>= 50% of maximal‐dose sulfonylurea and metformin + rosiglitazone 4 mg/day (mean daily dose rosiglitazone
was 7.1 +‐ 1.7 mg)
CONTROL (DOSE/DAY):
>= 50% of maximal‐dose sulfonylurea and metformin + insulin glargine 10 units/day (mean daily dose of insulin
glargine was 38.5 +‐ 26.5 IU)
TREATMENT BEFORE STUDY:
slfonylurea and metformin doses remained unchanged during the treatment phase of the study
TITRATION PERIOD:
(see run‐in phase)
all patients randomized to insulin glargine received a single daily subcutaneous injection at bedtime at a starting dose of 10 IU/day for 7days, the dose was titrated weekly according to self‐monitored FPG, supervised centrally to ensure compliance, to meet target FPG <100 –120 mg/dl (<5.5– 6.7 mmol/L) all patients randomized to treatment with rosiglitazone received a starting oral dose of 4 mg once daily for 6 weeks; if the FPG value was >100 mg/dl (>5.5 mmol/L) after 6 weeks, rosiglitazone was increased to a maximum of 8 mg/day |
|
| Outcomes | PRIMARY OUTCOMES:
not stated (HbA1c differences between therapies)
SECONDARY OUTCOMES:
(not stated)
assessment of hypoglycaemia profile; changes in FPG, body weight, and serum lipids; proportion of patients achieving HbAA1C <= 7%; cost of therapy safety was assessed in the intent to treat (ITT) population through adverse events, hypoglycaemia, body weight, physical examinations, vital signs, standard hematology,and blood chemistry a physical examination to identify signs of peripheral oedema was performed at baseline and final visit or at patient discontinuation Cost analysis: The economic costs of glyceemic control were compared by combining selected measures of resource use with unit‐cost estimates. Resource measures included study medication, other antihyperglycaemic agents, syringes for insulin glargine, glucose testing supplies for both groups, and recommended liver function tests for the rosiglitazone group. Resource use was based on trial data over the 24‐week period. Costs of medications, insulin syringes, test strips, and lancets were estimated using average wholesale prices expressed in 2002 U.S. dollars and were based on the numbers actually dispensed. The cost of hepatic function panels was estimated using fee schedules under Medicare’s Resource‐Based Relative Value Scale. Economic costs were summarized using means and 95% CIs and calculated through techniques of bootstrapping. Results were not adjusted for differences between treatment |
|
| Notes | AIM OF STUDY: to evaluate the efficacy and safety of insulin glargine or rosiglitazone as add‐on therapy in patients with type 2 diabetes with chronic hyperglycemic control despite maximized combination therapy with metformin plus a sulfonylurea | |
| Risk of bias | ||
| Bias | Authors' judgement | Support for judgement |
| Allocation concealment? | Unclear risk | B ‐ Unclear |
Stocker 2007.
| Methods | DURATION OF INTERVENTION: 24 weeks DURATION OF FOLLOW‐UP: 24 weeks RUN‐IN PERIOD: none LANGUAGE OF PUBLICATION: English | |
| Participants | WHO PARTCIPATED: type 2 diabetes patients with suboptimally controlled diabetes mellitus INCLUSION CRITERIA: between 21 and 80 years of age, with a glycosylated hemoglobin level above 7.0% during treatment with either diet modification or sulfonylurea monotherapy EXCLUSION CRITERIA: known inflammatory diseases (including inflammatory bowel disease, vasculitis, and rheumatologic disease), insulin use, corticosteroid use, an infection within 1 month of enrollment, glomerular filtration rate < 60 ml/min, pregnancy, known history of myocardial infarction or congestive heart failure, secondary diabetes (including Cushing’s syndrome and acromegaly), hypersensitivity to metformin or rosiglitazone, or a history of carotid endarterectomy DIAGNOSTIC CRITERIA: not stated CO‐MORBIDITIES: known cardiovascular disease [no (%)] I1: 2 (4.4%) C1: 3 (6.4%) CO‐MEDICATIONS: statin use [no (%)]: I1: 24 (53.3%) C1: 23 (48.9%) aspirin use [no (%)] : I1: 21 (46.7%) C1: 28 (59.6%) beta‐blocker use [no (%)]: I1: 8 (17.8%) C1: 7 (14.9%) calcium‐channel blocker use [no (%)]: I1: 6 (13.3%) C1: 13 (27.7%) angiotensin receptor blocker use [no (%)]: I1: 2 (4.4%) C1: 0 (0%) ACE inhibitor use [no (%)]: I1: 23 (51.1%) C1: 30 (63.8%) sulfonylurea use [no (%)]: I1: 34 (75.6%) C1: 34 (72.3%) | |
| Interventions | NUMBER OF STUDY CENTRES:
1
COUNTRY/ LOCATION:
USA
SETTING:
Diabetes Institute of theWalter Reed Army Medical Center, Washington DC, USA
INTERVENTION (DOSE/DAY):
rosiglitazone 4 mg o.d.
CONTROL (DOSE/DAY):
metformin 850 mg b.i.d.
TREATMENT BEFORE STUDY:
diet modification or sulfonylurea monotherapy
TITRATION PERIOD:
other concurrent therapies (sulfonylurea, antihypertensive, or
statin medications) were continued at stable doses during the study nutrition counseling and diabetes education was offered to all participants at enrollment, in addition to their study medication |
|
| Outcomes | PRIMARY OUTCOMES:
change in C‐reactive protein (CRP) levels after 24 weeks between the metformin and rosiglitazone treatment groups
SECONDARY OUTCOMES:
the predefined secondary
end point was the change in mean and maximal CIMT of the common carotid artery further outcomes: FPG, HbA1c, lipids, weight, carotid intima media thickness (CIMT) |
|
| Notes | AIM OF STUDY: to compare the effects of rosiglitazone and metformin on C‐reactive protein (CRP) and carotid intima media thickness (CIMT) | |
| Risk of bias | ||
| Bias | Authors' judgement | Support for judgement |
| Allocation concealment? | Unclear risk | B ‐ Unclear |
Sutton 2002.
| Methods | DURATION OF INTERVENTION: 52 weeks DURATION OF FOLLOW‐UP: 52 weeks RUN‐IN PERIOD: 4‐week placebo run‐in period (single‐blind, with diet maintenance) LANGUAGE OF PUBLICATION: English | |
| Participants | WHO PARTCIPATED: type 2 diabetic patients INCLUSION CRITERIA: patients aged 40–80 years were eligible if they met the NDDG definition forvtype 2 diabetes, with endogenous insulin production (fasting C‐peptide concentration >= 0.8 ng/ml at screening); female patients had to be postmenopausal, surgically sterile, or currently using hormonal contraceptives or intrauterine devices EXCLUSION CRITERIA: clinically significant renal disease (serum creatinine level >= 1.8 mg/dl) or hepatic disease (alanine transaminase, aspartate transaminase, total bilirubin, or alkaline phosphatase levels > 2.5 times the upper limit of the normal laboratory range); previous treatment for myocardial infarction; NYHA class III‐IV, coronary insufficiency or congestive heart failure; previous or existing treatment with ACE inhibitors, angiotensin II receptor antagonists, beta‐blockers, or calcium‐channel blockers; echocardiographic evidence of marked left ventricular hypertrophy at baseline; or uncontrolled BP (>160/>100 mmHg); whereas patients taking diuretics and lipid‐lowering agents were not excluded from the study, doses were not to be changed during the study unless deemed medically appropriate DIAGNOSTIC CRITERIA: NDDG CO‐MORBIDITIES: concomitant hypertension (%) ‐ I: 7.7, C: 7.0 CO‐MEDICATIONS: not stated | |
| Interventions | NUMBER OF STUDY CENTRES:
19
COUNTRY/ LOCATION:
USA
SETTING:
not stated
INTERVENTION (DOSE/DAY):
rosiglitazone 8 mg (4 mg b.i.d.)
CONTROL (DOSE/DAY):
glyburide
TREATMENT BEFORE STUDY:
previous antidiabetic treatment :
diet only (%) ‐ I: 21.2, C: 18.2
single agent (%) ‐ I: 70.2, C: 69.7
combination therapy (%): I: 8.7, C: 12.1 2‐week screening period; previous oral antidiabetic medications were discontinued at the screening visit, at which time all patients received placebo and dietary instruction; patients were reevaluated at 2‐week intervals during the placebo run‐in period; those with FPG >= 140 mg/dl but <= 300 mg/dl at visits 2 and 3 were eligible to enter the treatment period TITRATION PERIOD: glyburide (q.i.d. or b.i.d.) was titrated at the discretion of the investigator to optimal glycemic effect over the first 8 weeks and then held constant for the duration of the study period; the dose of glyburide did not exceed 20 mg/day |
|
| Outcomes | PRIMARY OUTCOMES:
change from baseline in left ventricular mass index, at weeks 28 and 52, with the between‐groups difference as the primary comparison of interest
SECONDARY OUTCOMES:
(not stated)
changes from baseline to weeks 28 and 52 in left ventricular end‐diastolic volume and ejection fraction as well as mean values of BP, heart rate, arterial pressure, and pulse pressure (from 24‐h ambulatory monitoring); glycemic control (HbA1c and FPG); serum lipids fasting clinical laboratory tests, including chemistry, haematology, and urinalysis clinical interpretation of safety was based on review of ECG and echocardiographic data, adverse event reports, and laboratory values |
|
| Notes | AIM OF STUDY: to assess the effect of long‐term rosiglitazone treatment on cardiac structure/function and glycaemic control in patients with type 2 diabetes compared with glyburide | |
| Risk of bias | ||
| Bias | Authors' judgement | Support for judgement |
| Allocation concealment? | Unclear risk | B ‐ Unclear |
Yang 2002.
| Methods | DURATION OF INTERVENTION: 6 months DURATION OF FOLLOW‐UP: 6 months RUN‐IN PERIOD: single‐blind placebo/sulfonylurea run‐in period for 4 weeks to establish baseline characteristics LANGUAGE OF PUBLICATION: English | |
| Participants | WHO PARTCIPATED: type 2 diabetic patients on concurrent sulphonylurea therapy INCLUSION CRITERIA: aged 30–80 years; type 2 diabetic patients according to diagnostic criteria of the WHO, FPG 7–15 mmol/L and HbA1c > 7.5%; who had been stable on sulfonylurea therapy for at least 2 months before the screening EXCLUSION CRITERIA: other severe medical problems and severe microvascular complications requiring immediate medical attention DIAGNOSTIC CRITERIA: WHO CO‐MORBIDITIES: not stated CO‐MEDICATIONS: not stated | |
| Interventions | NUMBER OF STUDY CENTRES: not stated (1) COUNTRY/ LOCATION: Taiwan SETTING: not stated INTERVENTION (DOSE/DAY): rosiglitazone 4 mg/day (2mg b.i.d.) + sulfonylureas CONTROL (DOSE/DAY): placebo (twice daily) + sulfonylureas TREATMENT BEFORE STUDY: who had been stable on sulfonylurea therapy for at least 2 months before the screening TITRATION PERIOD: | |
| Outcomes | PRIMARY OUTCOMES: not stated (plasma levels of adiponectin) SECONDARY OUTCOMES: (not stated) HbA1c; body weight, height, blood pressure, heart rate, plasma glucose, total cholesterol, triglycerides, HOMA | |
| Notes | AIM OF STUDY: to assess whether adiponectin levels might increase in type 2 diabetes patients treated with rosiglitazone | |
| Risk of bias | ||
| Bias | Authors' judgement | Support for judgement |
| Allocation concealment? | Unclear risk | B ‐ Unclear |
ACE = angiotensin converting enzyme; ADA = American Diabetes Association; ALT = alanine aminotransferase; AST = aspartate aminotransferase; AT II = angiotensin II; b.(i.)d. = bis in die, twice daily; BMI = body mass index (kg/m2); BP = blood pressure; C = control group; CRP = C‐reactive protein; CVD = cardiovascular disease; ECG = electrocardiogram; FCBG = fasting capillary blood glucose; FPG = fasting plasma glucose; HbA1c = glycosylated haemoglobin A1c; HOMA = homeostasis model assessment (of insulin sensitvity); I = intervention group; ITT = intention‐to‐treat; NDDG = National Diabetes Data Group; NYHA = New York Heart Association; OAD = oral antidiabetic drug: OAM = oral antidiabetic medication; o.d. = once daily; PPAR = peroxisome proliferator activated receptor; PPG = postprandial glucose; q.d. = quaque die, once a day; SU = sulfonylureas; t.i.d. = ter in die, three times daily; TZD = thiazolidinediones ("glitazones"); U = Unit; WHO = World Health Organization
Characteristics of excluded studies [ordered by study ID]
| Study | Reason for exclusion |
|---|---|
| Bailey 2005 | treatment regimens not comparable (rosiglitazone plus metformin versus metformin) |
| Baksi 2004 | treatment regimens not comparable (rosiglitazone plus gliclazide versus gliclazide) |
| Barnett 2003 | treatment regimens not comparable (rosiglitazone plus sulfonylureas versus sulfonylureas plus placebo) |
| Dailey 2004 | treatment regimens not comparable (rosiglitazone plus glyburide/metformin versus placebo plus glyburide/metformin) |
| Fonseca 2000 | treatment regimens not comparable (rosiglitazone plus metformin versus placebo plus metformin) |
| Fonseca 2003 | treatment regimens not comparable (rosiglitazone plus placebo versus rosiglitazone plus nateglinide) |
| Gomez‐Perez 2002 | treatment regimens not comparable (rosiglitazone plus metformin versus placebo plus metformin) |
| Hubacek 2004 | rosiglitazone treatment less than 24 weeks |
| Kerenyi 2004 | treatment regimens not comparable (rosiglitazone plus glibenclamide versus glibenclamide) |
| McCluskey 2004 | treatment regimens not comparable (rosiglitazone plus glimepiride versus glimepiride) |
| Negro 2005 | treatment regimens not comparable (rosiglitazone plus metformin versus placebo plus metformin) |
| Raskin 2001 | treatment regimens not comparable (rosiglitazone plus insulin versus placebo plus insulin) |
| Reynolds 2002 | treatment regimens not comparable (rosiglitazone plus insulin plus life‐style modification versus placebo plus insulin plus life‐style modification) |
| Rosenstock 2006a | treatment regimens not comparable (rosiglitazone plus glipizide versus placebo plus glipizide) |
| Tan 2005a | rosiglitazone treatment less than 24 weeks |
| Tan 2005b | rosiglitazone treatment less than 24 weeks |
| Vongthavaravat 2002 | treatment regimens not comparable (rosiglitazone plus sulfonylureas versus sulfonylureas alone) |
| Wang 2005 | treatment regimens not comparable (rosiglitazone versus "control" without treatment) |
| Weissman 2005 | treatment regimens not comparable (rosiglitazone plus metformin versus metformin) |
| Wolffenbuttel 2000 | treatment regimens not comparable (rosiglitazone plus sulfonylureas versus sulfonylureas plus placebo) |
| Wong 2005 | treatment regimens not comparable (rosiglitazone plus insulin versus insulin) |
| Zhu 2003 | treatment regimens not comparable (rosiglitazone plus sulfonylureas versus sulfonylureas plus placebo) |
Characteristics of ongoing studies [ordered by study ID]
RECORD.
| Trial name or title | Rosiglitazone Evaluated for Cardiac Outcomes and Regulation of Glycaemia in Diabetes (RECORD) |
| Methods | |
| Participants | RECORD is a 6‐year, randomised, open‐label study in type 2 diabetic patients with inadequate blood glucose control (HbA1c 7.1‐9.0%) on metformin or sulphonylurea alone. |
| Interventions | after a 4‐week run‐in, participants are randomised by current treatment stratum to add‐on rosiglitazone, metformin or sulphonylurea, with dose titration to a target HbA1c of <=7.0%; if confirmed HbA1c rises to >= 8.5%, either a third glucose‐lowering drug is added (rosiglitazone‐treated group) or insulin is started (non‐rosiglitazone group); the same criterion for failure of triple oral drug therapy in the rosiglitazone‐treated group is used for starting insulin in this group |
| Outcomes | the primary endpoint is the time to first cardiovascular hospitalisation or death, blindly adjudicated by a central endpoints committee; the study aim is to evaluate non‐inferiority of the rosiglitazone group versus the non‐rosiglitazone group with respect to cardiovascular outcomes; safety, tolerability and study conduct are monitored by an independent board |
| Starting date | recruitment began in April 2001 and was completed in April 2003 |
| Contact information | P. D. Home
School of Clinical Medical Sciences‐Diabetes,
University of Newcastle upon Tyne,
Medical School, Framlington Place,
Newcastle upon Tyne,
NE2 4HH, UK E‐mail: philip.home@newcastle.ac.uk Tel.: +44‐191‐2227019 Fax: +44‐191‐2220723 |
| Notes | study design and protocol published in Diabetologia 2005;48: 1726–35 |
Differences between protocol and review
The following changes to the published protocol with regards to 'types of intervention' were implemented:
The following comparisons were acceptable for evaluation:
rosiglitazone versus placebo;
rosiglitazone versus another oral antidiabetic medication (meglitinide analogues, metformin, pioglitazone, sulphonylureas);
rosiglitazone in combination with an oral antidiabetic medication or insulin versus a combination of an oral antidiabetic medication or insulin (agents and treatment schemes had to be identical).
Excluded interventions:
Combination therapies consisting of different compounds in the treatment arms (for example rosiglitazone plus metformin versus uptitration of metformin or rosiglitazone plus gliclazide versus gliclazide). Another Cochrane review will investigate rosiglitazone‐metformin combination therapies including different treatment regimens of these compounds. Furthermore, dipeptidyl peptidase‐4 (DPP‐4) inhibitors for type 2 diabetes mellitus are excluded, since these are the topic of another Cochrane review (Richter 2007), as well as glucagon‐like peptide analogues for type 2 diabetes mellitus (Cochrane review, Snaith 2007).
Contributions of authors
BERND RICHTER: Protocol development, selection of studies, quality assessment, data extraction, data analysis, review development.
ELIZABETH BANDEIRA‐ECHTLER: Protocol development, selection of studies, quality assessment, data extraction.
KARLA BERGERHOFF: Searching for trials, quality assessment, data extraction.
CHRISTINE CLAR: Protocol development, selection of studies, quality assessment, data extraction.
SUSANNE EBRAHIM: Protocol development, selection of studies, quality assessment, data extraction.
Sources of support
Internal sources
Heinrich‐Heine University of Duesseldorf, Germany.
External sources
No sources of support supplied
Declarations of interest
This review in part contributes to the ongoing critical appraisal of RCTs investigating the risk‐benefit ratio of thiazolidinedione use by the German Institute for Quality and Efficiency in Health Care ('Institut fuer Qualitaet und Wirtschaftlichkeit im Gesundheitswesen ‐ IQWiG).
Edited (no change to conclusions)
References
References to studies included in this review
Derosa 2004 {published data only}
- Derosa G, Cicero AFG, D'Angelo A, Gaddi A, Ragonesi PD, Piccinni MN, Salvadeo S, Ciccarelli L, Pricolo F, Ghelfi M, Ferrari I, Montagna L, Fogari R. Thiazolidinedione effects on blood pressure in diabetic patients with metabolic syndrome treated with glimepiride. Hypertension Research 2005;28(11):917‐924. [DOI] [PubMed] [Google Scholar]
- Derosa G, Cicero AFG, Gaddi A, Ragonesi PD, Fogari E, Bertone G, et al. Metabolic effects of pioglitazone and rosiglitazone in patients with diabetes and metabolic syndrome treated with glimepiride: A twelve‐month, multicenter, double‐blind, randomized, controlled, parallel‐group trial. Clinical Therapeutics 2004;26(5):744‐54. [DOI] [PubMed] [Google Scholar]
- Derosa G, Cicero AFG, Gaddi A, Ragonesi PD, Piccinni MN, Fogari E, Salvadeo S, Ciccarelli L, Fogari R. A comparison of the effects of pioglitazone and rosiglitazone combined with glimepiride on prothrombotic state in type 2 diabetic patients with the metabolic syndrome. Diabetes Research & Clinical Practice 2005;69(1):5‐13. [DOI] [PubMed] [Google Scholar]
Derosa 2006a {published data only}
- Derosa G, Angelo AD, Ragonesi PD, Ciccarelli L, Piccini MN, Pricolo F, et al. Metformin‐pioglitazone and metformin‐rosiglitazone effects on non‐conventional cardiovascular risk factors plasma level in type 2 diabetic patients with metabolic syndrome. Journal of Clinical Pharmacology and Therapeutics 2006;31:375‐83. [DOI] [PubMed] [Google Scholar]
- Derosa G, D'Angelo A, Ragonesi PD, Ciccarelli L, Piccinni MN, Pricolo F, et al. Metabolic effects of pioglitazone and rosiglitazone in patients with diabetes and metabolic syndrome treated with metformin. Internal Medicine Journal 2007;37:79‐86. [DOI] [PubMed] [Google Scholar]
Derosa 2006b {published data only}
- Derosa G, Cicero AFG, Gaddi AV, Ciccarelli L, Piccinni MN, Salvadeo S, et al. Long‐term effects of glimepiride or rosiglitazone in combination with metformin on blood pressure control in type 2 diabetic patients affected by the metabolic syndrome: a 12‐month, double‐blind, randomized trial. Clinical Therapeutics 2005;27(9):1383‐90. [DOI] [PubMed] [Google Scholar]
- Derosa G, Gaddi AV, Ciccarelli L, Fogari E, Ghelfi M, Ferrari I, et al. Long‐term effect of glimepiride and rosiglitazone on non‐conventional cardiovascular risk factors in metformin‐treated patients affected by metabolic syndrome: A randomized, double‐blind clinical trial. Journal of International Medical Research 2005;33(3):284‐94. [DOI] [PubMed] [Google Scholar]
- Derosa G, Gaddi AV, Piccinni MN, Ciccarelli L, Salvadeo S, Peros E, et al. Antithrombotic effects of rosiglitazone‐metformin versus glimepiride‐metformin combination therapy in patients with type 2 diabetes mellitus and metabolic syndrome. Pharmacotherapy 2005;25(5 I):637‐45. [DOI] [PubMed] [Google Scholar]
- Derosa G, Gaddi AV, Piccinni MN, Salvadeo S, Ciccarelli L, Fogari E, et al. Differential effect of glimepiride and rosiglitazone on metabolic control of type 2 diabetic patients treated with metformin: a randomized, double‐blind, clinical trial. Diabetes, Obesity and Metabolism 2006;8:197‐205. [DOI] [PubMed] [Google Scholar]
Garber 2006 {published data only}
- Garber A, Klein E, Bruce S, Sankoh S, Mohideen P. Metformin‐glibenclamide versus metformin plus rosiglitazone in patients with type 2 diabetes inadequately controlled on metformin monotherapy. Diabetes, Obesity and Metabolism 2006;8:156‐63. [DOI] [PubMed] [Google Scholar]
Goldberg 2005 {published data only}
- Goldberg RB, Kendall DM, Deeg MA, Buse JB, Zagar AJ, Pinaire JA, et al. A comparison of lipid and glycemic effects of pioglitazone and rosiglitazone in patients with type 2 diabetes and dyslipidemia. Diabetes Care 2005;28(7):1547‐54. [DOI] [PubMed] [Google Scholar]
Hanefeld 2007 {published data only}
- Hanefeld M, Patwardhan R, Jones NP, Rosiglitazone Clinical Trials Study Group. A one‐year study comparing the efficacy and safety of rosiglitazone and glibenclamide in the treatment of type 2 diabetes. Nutrition, Metabolism, and Cardiovascular Diseases 2007;17(1):13‐23. [DOI] [PubMed] [Google Scholar]
Hällsten 2002 {published data only}
- Hällsten K, Virtanen KA, Lonnqvistt F, Janatuinen T, Turiceanu M, Ronnemaa T, et al. Enhancement of insulin‐stimulated myocardial glucose uptake in patients with Type 2 diabetes treated with rosiglitazone. Diabetic Medicine 2004;21(12):1280‐7. [DOI] [PubMed] [Google Scholar]
- Hällsten K, Virtanen KI, Lönnqvist F, Sipilä H, Oksanen A, Viljanen T, et al. Rosiglitazone but not metformin enhances insulin‐ and exercise‐stimulated skeletal muscle glucose uptake in patients with newly diagnosed type 2 diabetes. Diabetes 2002;51:3479‐85. [DOI] [PubMed] [Google Scholar]
- Iozzo P, Hallsten K, Oikonen V, Virtanen KA, Parkkola R, Kemppainen J, et al. Effects of metformin and rosiglitazone monotherapy on insulin‐mediated hepatic glucose uptake and their relation to visceral fat in type 2 diabetes. Diabetes Care. 26 2003; Vol. 26, issue 7:2069‐74. [DOI] [PubMed]
- Karlsson HK, Hallsten K, Bjornholm M, Tsuchida H, Chibalin AV, Virtanen KA, et al. Effects of metformin and rosiglitazone treatment on insulin signaling and glucose uptake in patients with newly diagnosed type 2 diabetes: a randomized controlled study. Diabetes 2005;54(5):1459‐67. [DOI] [PubMed] [Google Scholar]
- Viljanen APM, Virtanen KA, Järvisalo MJ, Hällsten K, Parkkola R, Rönnemaa T, et al. Rosiglitazone treatment increases subcutaneous adipose tissue glucose uptake in parallel with perfusion in patients with type 2 diabetes: a double‐blind, randomized study with metformin. Journal of Clinical Endocrinology & Metabolism 2005;90(12):6523‐8. [DOI] [PubMed] [Google Scholar]
- Virtanen KA, Hallsten K, Parkkola R, Janatuinen T, Lonnqvist F, Viljanen T, et al. Differential effects of rosiglitazone and metformin on adipose tissue distribution and glucose uptake in type 2 diabetic subjects. Diabetes 2003;52:283‐90. [DOI] [PubMed] [Google Scholar]
Jung 2005 {published data only}
- Jung HS, Youn BS, Cho YM, Yu KY, Park HJ, Shin CS, et al. The effects of rosiglitazone and metformin on the plasma concentrations of resistin in patients with type 2 diabetes mellitus. Metabolism: Clinical and Experimental 2005;54(3):314‐20. [DOI] [PubMed] [Google Scholar]
Kahn 2006 {published data only}
- Correction to Kahn, et al. N Engl J Med 355(23):2427‐2443 December 7, 2006. Glycemic durability of rosiglitazone, metformin, or glyburide monotherapy. New England Journal of Medicine 2007;356(13):1387‐8. [DOI] [PubMed] [Google Scholar]
- Gandhi GY, Montori VM. Glycemic durability of monotherapy for diabetes. New England Journal of Medicine 2007;356(13):1378‐80. [PubMed] [Google Scholar]
- Kahn SE, Haffner SM, Heise MA, Herman WH, Holman RR, Jones NP, et al. ADOPT Study Group. Glycemic durability of rosiglitazone, metformin, or glyburide monotherapy. New England Journal of Medicine 2006;355(23):2427‐43. [DOI] [PubMed] [Google Scholar]
- Nathan DM. Thiazolidinediones for initial treatment of type 2 diabetes?. New England Journal of Medicine 2006;355(23):2477‐80. [DOI] [PubMed] [Google Scholar]
- Viberti G, Kahn SE, Greene DA, Herman WH, Zinman B, Holman RR, et al. A Diabetes Outcome Progression Trial (ADOPT): An international multicenter study of the comparative efficacy of rosiglitazone, glyburide, and metformin in recently diagnosed type 2 diabetes. Diabetes Care 2002;25:1737‐43. [DOI] [PubMed] [Google Scholar]
- Viberti G, Lachin J, Holman R, Zinman B, Haffner S, Kravitz MA, et al. A Diabetes Outcome Progression Trial (ADOPT): baseline characteristics of Type 2 diabetic patients in North America and Europe. Diabetic Medicine 2006;23(12):1289‐94. [DOI] [PubMed] [Google Scholar]
Ko 2006 {published data only}
- Ko GT, Tsang PC, Wai HP, Kan EC, Chan HC. Rosiglitazone versus bedtime insulin in the treatment of patients with conventional oral antidiabetic drug failure: a 1‐year randomized clinical trial. Advances in Therapy 2006;23(5):799‐808. [DOI] [PubMed] [Google Scholar]
Lebovitz 2001 {published data only}
- Haffner SM, Greenberg AS, Weston WM, Chen H, Williams K, Freed MI. Effect of rosiglitazone treatment on nontraditional markers of cardiovascular disease in patients with type 2 diabetes mellitus. Circulation 2002;106(6):679‐84. [DOI] [PubMed] [Google Scholar]
- Lebovitz HE, Dole JF, Patwardhan R, Rappaport EB, Freed MI. Rosiglitazone monotherapy is effective in patients with type 2 diabetes. Journal of Clinical Endocrinology & Metabolism 2001;86(1):280‐8. [DOI] [PubMed] [Google Scholar]
Ovalle 2004 {published data only}
- Ovalle F, Bell DSH. Effect of rosiglitazone versus insulin on the pancreatic beta‐cell function of subjects with type 2 diabetes. Diabetes Care 2004;27(11):2585‐9. [DOI] [PubMed] [Google Scholar]
Phillips 2001 {published data only}
- Phillips LS, Grunberger G, Miller E, Patwardhan R, Rappaport EB, Salzman A. Once‐ and twice‐daily dosing with rosiglitazone improves glycemic control in patients with type 2 diabetes. Diabetes Care 2001;24(2):308‐15. [DOI] [PubMed] [Google Scholar]
Raskin 2004 {published data only}
- Raskin P, McGill J, Saad MF, Cappleman JM, Kaye W, Khutoryansky N et al ‐ for the Repaglinide/Rosiglitazone Study Group. Combination therapy for type 2 diabetes: repaglinide plus rosiglitazone. Diabetic Medicine 2004;21:329‐35. [DOI] [PubMed] [Google Scholar]
Rosenstock 2006b {published data only}
- Rosenstock J, Sugimoto D, Strange P, Stewart JA, Soltes‐Rak E, Dailey G ‐ on behalf of the Insulin Glargine 4014 Study Investigators. Insulin glargine or rosiglitazone added to combination therapy of sulfonylurea plus metformin in insulin‐naive patients. Diabetes Care 2006;29:554‐9. [DOI] [PubMed] [Google Scholar]
Stocker 2007 {published data only}
- Stocker DJ, Taylor AJ, Langley RW, Jezior MR, Vigersky RA. A randomized trial of the effects of rosiglitazone and metformin on inflammation and subclinical atherosclerosis in patients with type 2 diabetes. American Heart Journal 2007;153(3):445.e1‐6. [DOI] [PubMed] [Google Scholar]
Sutton 2002 {published data only}
- Bakris G, Viberti G, Weston WM, Heise M, Porter LE, Freed MI. Rosiglitazone reduces urinary albumin excretion in type II diabetes. Journal of Human Hypertension 2003;17(1):7‐12. [DOI] [PubMed] [Google Scholar]
- John Sutton M, Rendell M, Dandona P, Dole JF, Murphy K, Patwardhan R, et al. A comparison of the effects of rosiglitazone and glyburide on cardiovascular function and glycemic control in patients with type 2 diabetes. Diabetes Care 2002;25(11):2058‐64. [DOI] [PubMed] [Google Scholar]
Yang 2002 {published data only}
- Yang W‐S, Jeng C‐Y, Wu T‐J, Tanaka S, Funahashi T, Matsuzawa Y, et al. Synthetic peroxisome proliferator‐activated receptor‐gamma agonist, rosiglitazone, increases plasma levels of adiponectin in type 2 diabetic patients. Diabetes Care 2002;25(2):376‐80. [DOI] [PubMed] [Google Scholar]
References to studies excluded from this review
Bailey 2005 {published data only}
- Bailey CJ, Bagdonas A, Rubes J, McMorn SO, Donaldson J, Biswas N, et al. Rosiglitazone/metformin fixed‐dose combination compared with uptitrated metformin alone in type 2 diabetes mellitus: a 24‐week, multicenter, randomized, double‐blind, parallel‐group study. Clinical Therapeutics 2005;27(10):1548‐61. [DOI] [PubMed] [Google Scholar]
Baksi 2004 {published data only}
- Baksi A, James RE, Zhou B, Nolan JJ. Comparison of uptitration of gliclazide with the addition of rosiglitazone to gliclazide in patients with type 2 diabetes inadequately controlled on half‐maximal doses of a sulphonylurea. Acta Diabetologica 2004;41(2):63‐9. [MEDLINE: ] [DOI] [PubMed] [Google Scholar]
Barnett 2003 {published data only}
- Barnett AH, Grant PJ, Hitman GA, Mather H, Pawa M, Robertson L, et al. Rosiglitazone in Type 2 diabetes mellitus: An evaluation in British Indo‐Asian patients. Diabetic Medicine 2003;20(5):387‐93. [DOI] [PubMed] [Google Scholar]
Dailey 2004 {published data only}
- Dailey III GE, Noor MA, Park J‐S, Bruce S, Fiedorek FT. Glycemic control with Glyburide/Metformin tablets in combination with rosiglitazone in patients with type 2 diabetes: A randomized, double‐blind trial. American Journal of Medicine 2004;116(4):223‐29. [DOI] [PubMed] [Google Scholar]
Fonseca 2000 {published data only}
- Desouza C, Fonseca VA. Insulin sensitizer combination therapy for type 2 diabetes. Cardiology Review 2001;18(1):11‐15. [Google Scholar]
- Fonseca V, Rosenstock J, Patwardhan R, Salzman A. Effect of metformin and rosiglitazone combination therapy in patients with type 2 diabetes mellitus: A randomized controlled trial. Journal of the American Medical Association 2000;283(13):1695‐1702. [DOI] [PubMed] [Google Scholar]
Fonseca 2003 {published data only}
- Fonseca V, Grunberger G, Gupta S, Shen S, Foley JE. Addition of nateglinide to rosiglitazone monotherapy suppresses mealtime hyperglycemia and improves overall glycemic control. Diabetes Research and Clinical Practice 2003;26(6):1685‐90. [DOI] [PubMed] [Google Scholar]
Gomez‐Perez 2002 {published data only}
- Gomez‐Perez FJ, Fanghanel‐Salmon G, Barbosa JA, Montes‐Villarreal J, Berry RA, Warsi G, et al. Efficacy and safety of rosiglitazone plus metformin in Mexicans with type 2 diabetes. Diabetes/Metabolism Research Reviews 2002;18(2):127‐34. [DOI] [PubMed] [Google Scholar]
Hubacek 2004 {published data only}
- Hubacek J, Verma S, Shewchuk L, Ross SJ, Edwards A, Anderson TJ. Rationale and design of the Glitazones and the Endothelium (GATE) study: evaluation of rosiglitazone on endothelial function in patients with diabetes. Canadian Journal of Cardiology 2004;20(14):1449‐53. [PubMed] [Google Scholar]
Kerenyi 2004 {published data only}
- Kerenyi Z, Samer H, James R, Yan Y, Stewart M. Combination therapy with rosiglitazone and glibenclamide compared with upward titration of glibenclamide alone in patients with type 2 diabetes mellitus. Diabetes Research and Clinical Practice 2004;63(3):213‐23. [DOI] [PubMed] [Google Scholar]
McCluskey 2004 {published data only}
- McCluskey D, Touger MS, Melis R, Schleusener DS, McCluskey D. Results of a randomized, double‐blind, placebo‐controlled study administering glimepiride to patients with type 2 diabetes mellitus inadequately controlled with rosiglitazone monotherapy. Clinical Therapeutics 2004;26(11):1783‐90. [DOI] [PubMed] [Google Scholar]
Negro 2005 {published data only}
- Negro R, Mangieri T, Dazzi D, Pezzarossa A, Hassan H. Rosiglitazone effects on blood pressure and metabolic parameters in nondipper diabetic patients. Diabetes Research and Clinical Practice 2005;70:20‐5. [DOI] [PubMed] [Google Scholar]
Raskin 2001 {published data only}
- Raskin P, Rendell M, Riddle MC, Dole JF, Freed MI, Rosenstock J ‐ Rosiglitazone‐Clinical‐Trials‐Study‐Group. A randomized trial of rosiglitazone therapy in patients with inadequately controlled insulin‐treated type 2 diabetes. Diabetes Care 2001;24:1226‐32. [DOI] [PubMed] [Google Scholar]
Reynolds 2002 {published data only}
- Reynolds LR, Konz EC, Frederich RC, Anderson JW. Rosiglitazone amplifies the benefits of lifestyle intervention measures in long‐standing type 2 diabetes mellitus. Diabetes, Obesity & Metabolism 2002;4(4):270‐5. [DOI] [PubMed] [Google Scholar]
Rosenstock 2006a {published data only}
- Herman WH, Dirani RG, Horblyuk R, O'Neill MC, Kravitz B, Heise MA et al ‐ and the RESULT Study Group. Reduction in use of healthcare services with combination sulfonylurea and rosiglitazone: findings from the Rosiglitazone Early vs SULfonylurea Titration (RESULT) Study. American Journal of Managed Care 2005;11(4):273‐8. [PubMed] [Google Scholar]
- Rosenstock J, Goldstein BJ, Vinik AI, O'Neill MO, Porter LE, Heise MA et al ‐ and the RESULT Study Group. Effect of early addition of rosiglitazone to sulphonylurea therapy in older type 2 diabetes patients (>60 years): the Rosiglitazone Early vs SULphonylurea Titration (RESULT) study. Diabetes, Obesity and Metabolism 2006;8:49‐57. [DOI] [PubMed] [Google Scholar]
Tan 2005a {published data only}
- Tan GD, Fielding BA, Currie JM, Humphreys SM, Desage M, Frayn KN, et al. The effects of rosiglitazone on fatty acid and triglyceride metabolism in type 2 diabetes. Diabetologia 2005;48(1):83‐95. [DOI] [PubMed] [Google Scholar]
Tan 2005b {published data only}
- Tan GD, Debard C, Funahashi T, Humphreys SM, Matsuzawa Y, Frayn KN, et al. Changes in adiponectin receptor expression in muscle and adipose tissue of type 2 diabetic patients during rosiglitazone therapy. Diabetologia 2005;48(8):1585‐9. [DOI] [PubMed] [Google Scholar]
Vongthavaravat 2002 {published data only}
- Vongthavaravat V, Wajchenberg BL, Waitman JN, Quimpo JA, Menon PS, Ben KF, et al. An international study of the effects of rosiglitazone plus sulphonylurea in patients with type 2 diabetes. Current Medical Research and Opinion 2002;18(8):456‐61. [DOI] [PubMed] [Google Scholar]
Wang 2005 {published data only}
- Wang G, Wei J, Guan Y, Jin N, Mao J, Wang X. Peroxisome proliferator‐activated receptor‐gamma agonist rosiglitazone reduces clinical inflammatory responses in type 2 diabetes with coronary artery disease after coronary angioplasty. Metabolism 2005;54(5):590‐7. [DOI] [PubMed] [Google Scholar]
Weissman 2005 {published data only}
- Weissman P, Goldstein BJ, Rosenstock J, Waterhouse B, Cobitz AR, Wooddell MJ, et al. Effects of rosiglitazone added to submaximal doses of metformin compared with dose escalation of metformin in type 2 diabetes: the EMPIRE Study. Current Medical Research and Opinion 2005;21(12):2029‐35. [DOI] [PubMed] [Google Scholar]
Wolffenbuttel 2000 {published data only}
- Wolffenbuttel BHR, Gomis R, Squatrito S, Jones NP, Patwardhan RN. Addition of low‐dose rosiglitazone to sulphonylurea therapy improves glycaemic control in Type 2 diabetic patients. Diabetic Medicine 2000;17(1):40‐7. [DOI] [PubMed] [Google Scholar]
Wong 2005 {published data only}
- Wong TYH, Szeto CC, Chow KM, Leung CB, Lam CWK, Li PKT. Rosiglitazone reduces insulin requirements and c‐reactive protein levels in type 2 diabetic patients receiving peritoneal dialysis. American Journal of Kidney Diseases 2005;46(4):713‐9. [DOI] [PubMed] [Google Scholar]
Zhu 2003 {published data only}
- Zhu X‐X, Pan C‐Y, Li G‐W, Shi H‐L, Tian H, Yang W‐Y, et al. Addition of rosiglitazone to existing sulfonylurea treatment in Chinese patients with type 2 diabetes and exposure to hepatitis B or C. Diabetes Technology & Therapeutics 2003;5(1):33‐42. [DOI] [PubMed] [Google Scholar]
References to ongoing studies
RECORD {published data only}
- Home PD, Pocock SJ, Beck‐Nielsen H, Gomis R, Hanefeld M, Dargie H, et al. Rosiglitazone evaluated for cardiac outcomes and regulation of glycaemia in diabetes (RECORD): study design and protocol. Diabetologia 2005;48:1726‐35. [DOI] [PubMed] [Google Scholar]
Additional references
ADA 1997
- American Diabetes Association. Report on the Expert Committee on the Diagnosis and Classification of Diabetes Mellitus. Diabetes Care 1997;20 Suppl 1:S5‐20. [DOI] [PubMed] [Google Scholar]
ADA 1999
- The Expert Committee on the Diagnosis and Classification of Diabetes Mellitus. Report of the Expert Committee on the diagnosis and classification of diabetes mellitus. Diabetes Care 1999;22 Suppl 1:S5‐19. [DOI] [PubMed] [Google Scholar]
Ali 2005
- Ali AA, Weinstein RA, Stewart SA, Parfitt AM, Manolagas SC, Jilka RL. Rosiglitazone causes bone loss in mice by suppressing osteoblast differentiation and bone formation. Endocrinology 2005;146:1226‐35. [DOI] [PubMed] [Google Scholar]
Armour 2004
- Armour T, Norris S, Brown D, Zhang X, Caspersen C. Initiating and maintaining physical activity for type 2 diabetes mellitus. Cochrane Database of Systematic Reviews 2004, Issue 1. [Google Scholar]
Black 2003
- Black C, McIntyre L, Mesa‐Perez JA, Royle PL, Thomas S, Waugh N. Meglitinide analogues for type 2 diabetes mellitus. Cochrane Database of Systematic Reviews 2003, Issue 4. [DOI] [PMC free article] [PubMed] [Google Scholar]
Bloomgarden 2005
- Bloomgarden ZT. Thiazolidinediones. Diabetes Care 2005;28(2):488‐93. [DOI] [PubMed] [Google Scholar]
Boucher 2002
- Boucher M, McAuley L, Brown A, Keely E, Skidmore B. Comparative clinical and budget evaluations of rosiglitazone and pioglitazone with other anti‐diabetic agents. Ottawa, Canada: Canadian Coordinating Office for Health Technology Assessment, 2002.
Boucher 2003
- Boucher M, McAuley L, Brown A, Keely E, Skidmore B. Efficacy of rosiglitazone and pioglitazone compared to other anti‐diabetic agents: systematic review and budget impact analysis. Ottawa, Canada: Canadian Office for Health Technology Assessment, 2003. [Google Scholar]
Burt 2005
- Burt AL, Green S, Kwan I, Mugglestone M, Thomas J. Intranasal insulin for type 1 diabetes mellitus. Cochrane Database of Systematic Reviews 2005, Issue 2. [Google Scholar]
Chiquette 2004
- Chiquette E, Ramirez G, DeFronzo R. A meta‐analysis comparing the effect of thiazolidinediones on cardiovascular risk factors. Archives of Internal Medicine 2004;164(19):2097‐104. [DOI] [PubMed] [Google Scholar]
Cohen 1960
- Cohen J. A coefficient of agreement for nominal scales. Educational and Psychological Measurement 1960;20:37‐46. [Google Scholar]
Colucciello 2005
- Colucciello M. Vision loss due to macular edema induced by rosiglitazone treatment of diabetes mellitus. Archives of Ophthalmology 2005;123(9):1273‐5. [DOI] [PubMed] [Google Scholar]
Cox 2004
- Cox SL. Rosiglitazone maleate/metformin hydrochloride: A new formulation therapy for type 2 diabetes. Drugs of Today 2004;40(7):633‐43. [DOI] [PubMed] [Google Scholar]
Czoski‐Murray 2004
- Czoski‐Murray C, Warren E, Chilcott J, Beverley C, Psyllaki MA, Cowan J. Clinical effectiveness and cost‐effectiveness of pioglitazone and rosiglitazone in the treatment of type 2 diabetes: A systematic review and economic evaluation. Winchester, England: Health Technology Assessment, 2004. [DOI] [PubMed]
DCCT 1993
- The diabetes control and complications trial research group. The effect of intensive treatment of diabetes on the development and progression of long‐term complications in insulin‐dependent diabetes mellitus. The New England Journal of Medicine 1993;329(14):977‐86. [DOI] [PubMed] [Google Scholar]
DeFronzo 1992
- DeFronzo RA, Bonadonna RC, Ferrannini E. Pathogenesis of NIDDM: a balanced overview. Diabetes Care 1992;15:318‐68. [DOI] [PubMed] [Google Scholar]
Dormandy 2005
- Dormandy JA, Charbonnel B, Eckland DJ, Erdmann E, Massi‐Benedetti M, Moules IK, et al. Secondary prevention of macrovascular events in patients with type 2 diabetes in the PROactive Study (PROspective pioglitAzone Clinical Trial in macroVascular Events): A randomised controlled trial. Lancet 2005;366(9493):1279‐89. [DOI] [PubMed] [Google Scholar]
Ewart 2001
- Ewart RM. The case against aggressive treatment of type 2 diabetes: critique of the UK prospective diabetes study. BMJ 2001;323(7317):854‐8. [DOI] [PMC free article] [PubMed] [Google Scholar]
Freemantle 2003
- Freemantle N, Calvert M, Wood J, Eastaugh J, Griffin C. Composite outcomes in randomized trials: greater precision but with greater uncertainty?. JAMA 2003;289(19):2554‐9. [DOI] [PubMed] [Google Scholar]
Gimenez‐Perez 2001
- Gimenez‐Perez G, Gonzalez‐Clemente JM, Mauricio D. Lifestyle interventions for preventing type 2 diabetes mellitus. Cochrane Database of Systematic Reviews 2001, Issue 1. [Google Scholar]
Grey 2007
- Grey A, Bolland M, Gamble G, Wattie D, Horne A, Davidson J, et al. The peroxisome proliferator‐activated receptor‐gamma agonist rosiglitazone decreases bone formation and bone mineral density in healthy postmenopausal women: a randomized, controlled trial. Journal of Clinical Endocrinology and Metabolism 92;4:1305‐10. [DOI] [PubMed] [Google Scholar]
Haffner 1998
- Haffner SM, Lehto S, Ronnemaa T, Pyorala K, Laakso M. Mortality from coronary heart disease in subjects with type 2 diabetes and in nondiabetic subjects with and without prior myocardial infarction. New England Journal of Medicine 1998;339:229‐34. [DOI] [PubMed] [Google Scholar]
HDS 1993
- The Hypertension in Diabetes Study Group. Hypertension in diabetes study (HDS): I. Prevalence of hypertension in newly presenting type 2 diabetic patients and the association with risk factors for cardiovascular and diabetic complications. Journal of Hypertension 1993;11:309‐17. [DOI] [PubMed] [Google Scholar]
Higgins 2002
- Higgins JPT, Thompson SG. Quantifying heterogeneity in a meta‐analysis. Statistics in medicine 2002;21:1539‐58. [DOI] [PubMed] [Google Scholar]
Higgins 2003
- Higgins JPT, Thompson SG, Deeks JJ, Altman DG. Measuring inconsistency in meta‐analysis. BMJ 2003;327:557‐60. [DOI] [PMC free article] [PubMed] [Google Scholar]
Higgins 2005
- Higgins JPT, Green S, editors. Cochrane Handbook for Systematic Reviews of Interventions 4.2.5 [updated May 2005]. In: The Cochrane Library, Issue 3, 2005. Chichester, UK: John Wiley & Sons, Ltd.
Kahn 1997
- Kahn SE, Porte D Jr. The pathophysiology of type II (noninsulindependent) diabetes mellitus: implications for treatment. In: Porte D Jr, Sherwin RS editor(s). Ellenberg & Rifkin's Diabetes Mellitus. 5th Edition. Stamford, Conneticut (U.S.A.): Appleton & Lange, 1997. [Google Scholar]
Kreider 2002
- Kreider M, Heise M. Rosiglitazone in the management of older patients with type 2 diabetes mellitus. International Journal of Clinical Practice 2002;56(7):538‐41. [PubMed] [Google Scholar]
Laakso 1999
- Laakso M. Hyperglycemia and cardiovascular disease in type 2 diabetes. Diabetes 1999;48:937‐42. [DOI] [PubMed] [Google Scholar]
Lau 2006
- Lau J, Ioannidis JPA, Terrin N, Schmid CH, Olkin I. The case of the misleading funnel plot. BMJ 2006;333:597‐600. [DOI] [PMC free article] [PubMed] [Google Scholar]
Lazarenko 2007
- Lazarenko OP, Rzonca SO, Hogue WR, Swain FL, Suva LJ, Lecka‐Czernik B. Rosiglitazone induces decreases in bone mass and strength that are reminiscent of aged bone. Endocrinology 2007;148(6):2669‐80. [DOI] [PMC free article] [PubMed] [Google Scholar]
Lebovitz 2002
- Lebovitz HE, Kreider M, Freed MI. Evaluation of liver function in type 2 diabetic patients during clinical trials: evidence that rosiglitazone does not cause hepatic dysfunction. Diabetes Care 2002;25:815‐21. [DOI] [PubMed] [Google Scholar]
Lindberg 2002
- Lindberg G, Lindblad U, Melander A. Sulfonylureas for treating type 2 diabetes mellitus. Cochrane Database of Systematic Reviews 2002, Issue 4. [Google Scholar]
Malinowski 2000
- Malinowski JM, Bolesta S. Rosiglitazone in the treatment of type 2 diabetes mellitus: A critical review. Clinical Therapeutics 2000;22(10):1151‐68. [DOI] [PubMed] [Google Scholar]
Manson 1991
- Manson JE, Coldlitz GA, Stampfer MJ, Willet WC, Krolewski AS, Rosner B, et al. A prospective study of maturity‐onset diabetes mellitus and risk of coronary heart disease and stroke in women. Archives of Internal Medicine 1991;151:1141‐7. [PubMed] [Google Scholar]
Marcy 2004
- Marcy TR, Britton ML, Blevins SM. Second‐generation thiazolidinediones and hepatotoxicity. The Annals of Pharmacotherapy 2004;38(9):1419‐23. [DOI] [PubMed] [Google Scholar]
McAlister 2003
- McAlister FA, Straus SE, Sackett DL, Altman DG. Analysis and reporting of factorial trials: a systematic review. JAMA 2003;289(19):2545‐53. [DOI] [PubMed] [Google Scholar]
McCormack 2003
- McCormack J, Greenhalgh T. Seeing what you want to see in randomised controlled trials: versions and perversions of UKPDS data. United Kingdom prospective diabetes study. BMJ 2000;320(7251):1720‐3. [DOI] [PMC free article] [PubMed] [Google Scholar]
Menees 2005
- Menees SB, Anderson MA, Chensue SW, Moseley RH. Hepatic injury in a patient taking rosiglitazone. Journal of Clinical Gastroenterology 2005;39(7):638‐40. [DOI] [PubMed] [Google Scholar]
Meriden 2004
- Meriden T. Progress with thiazolidinediones in the management of type 2 diabetes mellitus. Clinical Therapeutics 2004;26(2):177‐90. [DOI] [PubMed] [Google Scholar]
Misso 2005
- Misso ML, O'Connor DA, Egberts KJ, Shaw J. Continuous subcutaneous insulin infusion (CSII) versus multiple insulin injections for type 1 diabetes mellitus. Cochrane Database of Systematic Reviews 2005, Issue 1. [DOI] [PMC free article] [PubMed] [Google Scholar]
Moher 1999
- Moher D, Cook DJ, Eastwood S, Olkin I, Rennie D, Stroup DF. Improving the quality of reports of meta‐analyses of randomised controlled trials: the QUOROM statement. Quality of Reporting of Meta‐analyses. Lancet 1999;354(9193):1896‐900. [DOI] [PubMed] [Google Scholar]
Montgomery 2003
- Montgomery AA, Peters TJ, Little P. Design, analysis and presentation of factorial randomised controlled trials. BMJ 2003;3:26. [DOI] [PMC free article] [PubMed] [Google Scholar]
Moore 2005
- Moore H, Summerbell C, Hooper, L, Ashton V, Kopelman P. Dietary advice for the prevention of type 2 diabetes mellitus in adults. Cochrane Database of Systematic Reviews 2005, Issue 1. [Google Scholar]
Mukhtar 2005
- Mukhtar R, Reckless JPD. Dyslipidaemia in type 2 diabetes: effects of the thiazolidinediones pioglitazone and rosiglitazone. Diabetic Medicine 2005;22:6‐10. [DOI] [PubMed] [Google Scholar]
Nathan 1998
- Nathan DM. Some answers, more controversy, from UKPDS. United Kingdom Prospective Diabetes Study. Lancet 1998;352(9131):832‐3. [DOI] [PubMed] [Google Scholar]
NICE 2000
- Guidance on rosiglitazone for Type 2 diabetes mellitus. London: National Institute for Clinical Excellence, 2000.
NICE 2003
- Guidance on the use of glitazones for the treatment of type 2 diabetes. London: National Institute for Clinical Excellence, 2003.
NICE 2003b
- Review of rosiglitazone and pioglitazone for type II diabetes ‐ appraisal (project). London: National Institute for Clinical Excellence, 2003.
Nissen 2007
- Nissen SE, Wolski K. Effect of rosiglitazone on the risk of myocardial infarction and death from cardiovascular causes. New England Journal of Medicine 2007;356:www.nejm.org (10.1056/NEJMoa072761). [DOI] [PubMed] [Google Scholar]
Ohkubo 1995
- Ohkubo Y, Kishikawa H, Araki E, Miyata T, Isami S, Motoyoshi S, et al. Intensive insulin therapy prevents the progression of diabetic microvascular complications in Japanese patients with non‐insulin‐dependent mellitus: a randomized prospective 6‐year study. Diabetes Research and Clinical Practice 1995;28:103‐17. [DOI] [PubMed] [Google Scholar]
Psaty 2007
- Psaty BM, Furberg CD. Rosiglitazone and cardiovascular risk. New England Journal of Medicine 2007;356:www.nejm.org (10.1056/NEJMe078099). [DOI] [PubMed] [Google Scholar]
Richter 2005
- Richter B, Neises G. 'Human' insulin versus animal insulin in people with diabetes mellitus. Cochrane Database of Systematic Reviews 2005, Issue 1. [DOI] [PMC free article] [PubMed] [Google Scholar]
Richter 2006
- Richter B, Bandeira‐Echtler E, Bergerhoff K, Clar C, Ebrahim SH. Pioglitazone for type 2 diabetes mellitus. Cochrane Database of Systematic Reviews 2006, Issue 4. [DOI] [PMC free article] [PubMed] [Google Scholar]
Richter 2007
- Richter B, Bandeira‐Echtler E, Bergerhoff K. Dipeptidyl peptidase‐4 (DPP‐4) inhibitors for type 2 diabetes mellitus. Cochrane Database of Systematic Reviews 2007, Issue 3. [DOI] [PMC free article] [PubMed] [Google Scholar]
Roberts 2005
- Roberts D, Van NW, Chang H, Pohula W, MCheang, Moffatt M, et al. Glargine versus other basal insulins (NPH, Lente, or Ultralente) for the treatment of type 1 diabetes mellitus. Cochrane Database of Systematic Reviews 2005, Issue 2. [Google Scholar]
Royle 2003
- Royle P, Waugh N, McAuley L, McIntyre L, Thomas S. Inhaled insulin in diabetes mellitus. Cochrane Database of Systematic Reviews 2003, Issue 4. [DOI] [PubMed] [Google Scholar]
Ruige 1997
- Ruige JB, deNeeling JND, Kostense PJ, Bouter LM, Heine RJ. Performance of an NIDDM screening questionnaire based on symptoms and risk factors. Diabetes Care 1997;20:491–6. [DOI] [PubMed] [Google Scholar]
Saenz 2005
- Saenz A, Fernandez‐Esteban I, Mataix A, Ausejo M, Roque M, Moher D. Metformin monotherapy for type 2 diabetes mellitus. Cochrane Database of Systematic Reviews 2005, Issue 3. [DOI] [PubMed] [Google Scholar]
Salpeter 2003
- Salpeter S, Greyber E, Pasternak G, Salpeter E. Risk of fatal and nonfatal lactic acidosis with metformin use in type 2 diabetes mellitus. Cochrane Database of Systematic Reviews 2003, Issue 3. [DOI] [PubMed] [Google Scholar]
Schwartz 2006a
- Schwartz AV, Sellmeyer DE, Vittinghoff E, Palermo L, Lecka‐Czernik B, Feingold KR, et al. Thiazolidinedione use and bone loss in older diabetic adults. Journal of Clinical Endocrinology and Metabolism 2006;91:3349‐54. [DOI] [PMC free article] [PubMed] [Google Scholar]
Schwartz 2006b
- Schwartz AV. Diabetes, TZDs, and bone: A review of the clinical evidence. PPAR Research 2006;19:1‐6. [DOI] [PMC free article] [PubMed] [Google Scholar]
Siebenhofer 2004
- Siebenhofer A, Plank J, Berghold A, Narath M, Gfrerer R, Pieber TR. Short acting insulin analogues versus regular human insulin in patients with diabetes mellitus. Cochrane Database of Systematic Reviews 2004, Issue 4. [DOI] [PubMed] [Google Scholar]
Snaith 2007
- Snaith A, McIntyre L, Rothnie H, Thomas S, Royle P, Waugh N. Glucagon‐like peptide analogues for type 2 diabetes mellitus. Cochrane Database of Systematic Reviews 2007, Issue 1. [Google Scholar]
Stamler 1993
- Stamler J, Vaccaro O, Neaton JD, Wentworth D. Diabetes, other risk factors, and 12‐year cardiovascular mortality for men screened in the multiple risk factor intervention trial. Diabetes Care 1993;16:434‐44. [DOI] [PubMed] [Google Scholar]
Sterne 2001
- Sterne JAC, Egger M, Davey Smith G. Investigating and dealing with publication and other biases. In: Egger M, Davey Smith G, Altman DG editor(s). Systematic Reviews in Health Care; Meta‐analysis in Context. London: BMJ Publishing Group, 2001:189‐208. [Google Scholar]
Stratton 2000
- Stratton IM, Adler AI, Neil HA, Matthews DR, Manley SE, Cull CA, et al. Association of glycaemia with macrovascular and microvascular complications of type 2 diabetes (UKPDS 35): prospective observational study. BMJ 2000;321(7258):405‐12. [DOI] [PMC free article] [PubMed] [Google Scholar]
Su 2006
- Su DH, Lai MY, Wu HP. Liver failure in a patient receiving rosiglitazone therapy. Diabetic Medicine 2006;23(1):105‐6. [DOI] [PubMed] [Google Scholar]
Tang 2000
- Tang JL, Liu JLY. Misleading funnel plot for detection of bias in meta‐analysis. Journal of Clinical Epidemiology 2000;53:477‐84. [DOI] [PubMed] [Google Scholar]
Thomas 2001
- Thomas D, Elliott E. Exercise for type 2 diabetes mellitus. Cochrane Database of Systematic Reviews 2001, Issue 1. [DOI] [PMC free article] [PubMed] [Google Scholar]
Thornton 2000
- Thornton A, Lee P. Publication bias in meta‐analysis: its causes and consequences. Journal of Clinical Epidemiology 2000;53:207‐16. [DOI] [PubMed] [Google Scholar]
UGDP 1982
- University Group Diabetes Program. Effects of hypoglycemic agents on vascular complications in patients with adult‐onset diabetes, VIII. Evaluation of insulin therapy: final report. Diabetes 1982;31 Suppl 5:1‐81. [PubMed] [Google Scholar]
UKPDS‐16 1995
- U.K. Prospective Diabetes Study Group. U.K. prospective diabetes study 16: overview of 6 years' therapy of type II diabetes: a progressive disease. Diabetes 1995;44:1249‐58. [PubMed] [Google Scholar]
UKPDS‐33 1998
- UK Prospective Diabetes Study Group. Intensive blood‐glucose control with sulphonylureas or insulin compared with conventional treatment and risk of complications in patients with type 2 diabetes‐UKPDS 33. Lancet 1998;352:837‐52. [PubMed] [Google Scholar]
UKPDS‐34 1998
- UK Prospective Diabetes Study Group. Effect of intensive blood‐glucose control with metformin on complications in overweight patients with type 2 diabetes. Lancet 1998;352:854‐65. [PubMed] [Google Scholar]
UKPDS‐38 1998
- UK Prospective Diabetes Study Group. Tight blood pressure control and risk of macrovascular and microvascular complications in type 2 diabetes: UKPDS 38. BMJ 1998;317(7160):703‐13. [PMC free article] [PubMed] [Google Scholar]
Van de Laar 2005
- Laar FA, Lucassen PLBJ, Akkermans RP, Lisdonk EH, Rutten GEHM, Van WC. Alpha‐glucosidase inhibitors for type 2 diabetes mellitus. Cochrane Database of Systematic Reviews 2005, Issue 2. [DOI] [PMC free article] [PubMed] [Google Scholar]
Wagstaff 2002
- Wagstaff AJ, Goa KL. Rosiglitazone: A review of its use in the management of type 2 diabetes mellitus. Drugs 2002;62(12):1805‐37. [DOI] [PubMed] [Google Scholar]
Warram 1990
- Warram JH, Martin BC, Krolewski AS, Soeldner JS, Kahn CR. Slow glucose removal rate and hyperinsulinemia precede the development of Type 2 diabetes in the offspring of diabetic parents. Annals of Internal Medicine 1990;113:909–15. [DOI] [PubMed] [Google Scholar]
Wellington 2005
- Wellington K. Rosiglitazone/Metformin. Drugs 2005;65(11):1581‐92. [DOI] [PubMed] [Google Scholar]
WHO 1980
- WHO Expert Committee on Diabetes Mellitus. Geneva: World Health Organisation, 1980. Second report. Technical Report Series 646. [PubMed]
WHO 1985
- WHO Expert Committee on Diabetes Mellitus. Geneva: World Health Organization, 1985. Technical Report Series 727.. [PubMed]
WHO 1998
- Alberti KM, Zimmet PZ. Definition, diagnosis and classification of diabetes mellitus and its compliactions. Part I: diagnosis and classification of diabetes mellitus. Provisional report of a WHO consultation. Diabetic Medicine 1998;15:539‐53. [DOI] [PubMed] [Google Scholar]
Yang 2001
- Yang C, Chang TJ, Chang JC, Liu MW, Tai TY, Hsu WH, et al. Rosiglitazone (BRL 49653) enhances insulin secretory response via phosphatidylinositol 3‐kinase pathway. Diabetes 2001;50:2598‐602. [DOI] [PubMed] [Google Scholar]
Yaturu 2007
- Yaturu S, Bryant B, Jain SK. Thiazolidinediones treatment decreases bone mineral density in type 2 diabetic men. Diabetes Care 2007;0:dc06‐2606v1‐0. [DOI] [PubMed] [Google Scholar]