

Abstract
Exosomes are microvesicles of endocytic origin constitutively released by multiple cell types into the extracellular environment. With evidence that exosomes can be detected in the blood of patients with various malignancies, the development of a platform that uses exosomes as a diagnostic tool has been proposed. However, it has been difficult to truly define the exosome proteome due to the challenge of discerning contaminant proteins that may be identified via mass spectrometry using various exosome enrichment strategies. To better define the exosome proteome in breast cancer, we incorporated a combination of Tandem-Mass-Tag (TMT) quantitative proteomics approach and Support Vector Machine (SVM) cluster analysis of three conditioned media derived fractions corresponding to a 10 000g cellular debris pellet, a 100 000g crude exosome pellet, and an Optiprep enriched exosome pellet. The quantitative analysis identified 2 179 proteins in all three fractions, with known exosomal cargo proteins displaying at least a 2-fold enrichment in the exosome fraction based on the TMT protein ratios. Employing SVM cluster analysis allowed for the classification 251 proteins as “true” exosomal cargo proteins. This study provides a robust and vigorous framework for the future development of using exosomes as a potential multiprotein marker phenotyping tool that could be useful in breast cancer diagnosis and monitoring disease progression.
Graphical Abstract

Exosomes are microvesicles (40–130 nm) of endocytic origin constitutively released by multiple cell types into the extracellular environment. Exosome biogenesis begins with the invagination and budding of the endosomal membrane and the formation of intraluminal vesicles (ILVs) within a maturing endosome, now called a multivesicle body (MVB).1 The MVB can fuse with the plasma membrane, releasing exosomes into the extracellular environment. Exosome biogenesis regulation includes the initial formation of ILVs within the endosome by ESCRT-complexes,2,3 localization of proteins into exosomes by a ALIX-syndecan-syntenin mechanism,4 as well as the GTPases Rab27a and Rab27b mediating fusion of the MVB with the plasma membrane.5 Additional factors that have been implicated in regulating exosome biogenesis include p53 signaling,6,7 hypoxia,8 the enzyme heparanase,9 ceramide synthesis,10 and microenvironment pH.11
Previous studies have identified mRNA, miRNA, and a wide range of proteins as exosomal cargo, implicating the secreted vesicles in intercellular communication.12 In cancer, several oncogenic factors have been identified as exosomal cargo, linking exosomes to cancer progression and metastasis. Exosomes have been shown to have increased secretion from tumor cells and have been identified in a multitude of bodily fluids, thus their potential as a diagnostic vesicle has been gaining attention.13,14 With the aim of elucidating the protein profile of cancer-derived exosomes, a multitude of proteomic studies have been performed, analyzing exosomes in breast cancer,15,16 colorectal cancer,17 ovarian cancer,18 melanoma,19 and bladder cancer.20 These studies have revealed that exosomal cargo contains a conserved repertoire of proteins including ALIX, TSG101, CD63, CD9, and CD81 as well as proteins involved in cell adhesion, cell signaling, and proteins associated with tumorigenesis and metastasis.
Current methods for isolation of exosomes include the use of commercial kits, immunoaffinity capture, and differential ultracentrifugation.21 By far, the latter method is the most common and is often paired with electron microscopy (EM) as exosomes can be identified by their distinct “cup-shaped” morphology and size range. As more and more proteomic studies of exosomes are designed, especially with the goal of using exosomes as a diagnostic vesicle, it is vital to ascertain whether contaminants exists in the final analyte and thus might misidentify proteins as part of the exosome proteome. Proteomic studies analyzing organelle protein inventories have suggested that despite methods to purify a sample, it may be impossible to discern between a true organelle protein and a residual contaminant, without first determining protein abundance distribution between sample preparations.22 In response to the contaminant problem, spatial proteomics has combined techniques such as density gradient separation, protein quantitation, and multivariate analysis to confidently identify the organelle location of proteins in a complex sample.22–25 Similarly, techniques to isolate exosomes may leave residual contaminant proteins that confound which proteins are true exosome cargo and which may be artifacts as a result of the exosome enrichment method. In the following study, we define the breast cancer exosome proteome in a representative and widely used breast cancer cell line SKBR3B by pairing tandem-mass-tag (TMT) quantitative proteomics and multivariate cluster analysis. By comparing a protein’s abundance in three distinct fractions, obtained during exosome isolation, to the abundance of known exosome protein markers, we were able to calculate the probability of an identified protein being exosomal in origin. With this method, we were able to determine proteins enriched in our exosome fraction in an unbiased manner and identify potential residual contaminant proteins.
MATERIALS AND METHODS
Materials.
Metastatic breast cancer SKBR3B cells were from American Type Culture Collection (ATCC, Manassas, VA). Media, L-glutamine, and fetal bovine serum were from Life Technologies (Grand Island, NY) and penicillin/streptomycin from Cellgro/Corning (Manassas, VA). Optiprep was from Sigma-Aldrich (St. Louis, MO). Mouse anti-ALIX (1A12), rabbit anti-CD63 (H193), mouse anti-PARP1 (C2–10), rabbit anti-histone H3 (FL-136) were from Santa Cruz Biotechnology (Dallas, TX), rabbit anti-GSK3β (27C10), and rabbit anti-cytochrome C (D18C7) were from Cell Signaling Technology (Danvers, MA), mouse anti-TSG101 (51/TSG101) was from BD Biosciences (San Jose, CA), and mouse anti-β-actin (AC-15) was from Sigma-Aldrich (St. Louis, MO). The BCA assay kit and TMT six-plex Isobaric Mass Tagging Kit were from Pierce (Rockford, IL); trypsin/Lys-C Mix was from Promega (Madison, WI); SAX and C18 solid phase extraction disk were from 3 M (St Paul, MN), and C18 resin was from Prospereon Life Science (Arlington Height, IL).
Cell Culture.
SKBR3B cells were seeded in 15 cm dishes (Corning) and cultured in McCoy’s 5A medium supplemented with 10% FBS, L-glutamine (2 mM), and antibiotics (100 U/ mL penicillin and 100 μg/mL streptomycin), and grown in a humidified air with 5% CO2 at 37 °C. Cells were further maintained in McCoy’s 5A media supplements with 3% dFBS (which had been depleted of bovine-derived exosomes by ultracentrifugation for 16 h at 100 000g twice, prior to filtration through a 0.22 μm filter (Millipore, Billerica, MA) in the same incubation conditions.
Sample Generation and Exosome Enrichment.
SKBR3B cells were grown approximately to 90% confluency in their standard media with 10% FBS. The medium was removed and the cells rinsed with phosphate-buffered saline (PBS) and grown in 3% dFBS media. After 24 h, the conditioned media was collected and centrifuged at 300g for 10 min and then 2 000g for 20 min at 4 °C to eliminate whole cells and larger cell debris. The supernatant was further centrifuged at 10 000g for 30 min at 4 °C and the pellet retained (10K pellet). To isolate the crude exosome pellet, the supernatant was spun at 100 000g for 70 min at 4 °C. The pellet was washed in PBS and spun at 100 000g for 70 min at 4 °C (100 K pellet). To enrich the crude exosome pellet further, an Optiprep density gradient was applied.26 The crude exosome pellet was resuspended in 500 μL of 0.25 M sucrose, 10 mM Tris-HCl, pH 7.5 and layered on top of the gradient. The formed gradient was centrifuged at 100 000g for 18 h at 4 °C. Twelve 1 mL aliquots were collected (from top to the bottom) and diluted with 5 mL of PBS. Fractions were centrifuged at 100 000g for 70 min and the resulting pellets resuspended in 50 μL of PBS. To determine which Optiprep fractions contained exosomes, fractions were immunoblotted for the presence of the exosomal markers ALIX and CD63. Fractions positive for the markers were pooled and used in subsequent analyses (Opti pellet). Density of the individual Optiprep fractions was determined by running a control gradient in parallel. Fractions were collected as previously described, diluted 1:10 000 with dH2O, and absorbance read at 244 nm using a Nanodrop 1000 Spectrometer (Nanodrop, Wilmington, DE). A standard curve was constructed to determine our respective fraction densities.27
Size Exclusion Chromatography (SEC) Exosome Enrichment.
SKBR3B cells were grown and exosome conditioned media obtained. The conditioned media was subjected to filtration through a 0.22 μm filter (Millipore, Billerica, MA), concentrated in a Vivacell 100 (100 000 MWCO; Vivaproducts) and then loaded onto qEV SEC column (Izon Sciences) following manufacturer’s instructions for fraction collection. To determine which SEC fractions contained exosomes, fractions were immunoblotted for the presence of the exosomal markers ALIX and CD63. Fractions positive for the markers were pooled and used in subsequent analyses (SEC fraction).
Electron Microscopy.
For negative staining microscopy, 10 μL of exosomes (1 μg/μL) were layered and absorbed on a formvarcoated 400 mesh copper grid and stained with 1% PTA. Sample was imaged using a FEI tecnai T12 transmission electron microscope (FEI, Hillsboro, OR) equipped with a thermionic Lab6 filament and operated at an acceleration of 80 kV. Images were taken with a pixel size of 0.46 nm and a direct magnification of 21 000× using an AMT CCD camera.
Western Blotting.
For immune detection, exosomes were lysed by adding SDS to a final concentration of 4%, sonicated at 90% amplitude, 0.5 s cycle, and boiled at 95 °C. Lysate was mixed with Laemmli buffer with 50 mM DTT and separate using precast 12% BioRad Mini-PROTEAN TGX gels with TGS running buffer. Following electrophoresis, proteins were electrotransferred onto a polyvinylidene fluoride (PVDF) membrane. After being blocked in 5% nonfat milk in TBST for 1 h at RT, the membrane was probed with the primary antibody (1:1000 dilution) overnight at 4 °C. HRP-conjugated secondary antibodies (goat antimouse or goat antirabbit) were diluted 1:5000 and detected using SuperSignal West Pico Chemiluminescent Substrate (Pierce, Rockford, IL).
Peptide Digestion, TMT Labeling, and nano-ESI-LC– MS/MS Analysis.
Each pellet (10K, 100 K, and Opti) was subjected to lysis (4% SDS, 50 mM triethylammonium bicarbonate (TEAB)) and tryptic digestion using the Enhanced FASP (eFASP) protocol with slight modifications.28 In brief, each sample lysate was processed individually; 50 μg of sample was subjected to reduction and alkylation with 10 mM Tris 2-carboxyethyl phosphine (TCEP) and 50 mM iodoacetamide, respectively, in a Microcon UF Unit (YM-30 30 kDa cutoff limit; Millipore). Samples were washed with 50 mM TEAB,0.2% DCA, and subjected to proteolytic digestion with 2.5 μg of Lys-C/trypsin mix (1:20 w/w) overnight at 37 °C. Peptides were recovered via centrifuging and rinsing with 50 mM TEAB. To remove the DCA, the sample was acidified and mixed with ethyl acetate as described in the eFASP protocol. The sample was lyophilized to reduce sample volume and then subjected to the TMT-labeling protocol, wherein the digested peptide were reconstituted in 100 μL of 100 mM TEAB and incubated with the respective reconstituted TMT Label Reagents: 10K fraction, TMT-129; 100K fraction, TMT-130; and Optiprep fraction, TMT-131 for 1 h at RT (Pierce). The reaction was quenched with 8 μL of 5% hydroxylamine for 15 min. Samples were lyophilized and subjected to StageTip SAX fractionation and desalted prior to LC–MS/MS analysis.29 Peptides were separated by nanoscale reversed-phase liquid chromatography using an Xtreme Simple nanoLC system (CVC/Micro-Tech) and analyzed with a LTQ-Orbitrap XL mass spectrometer (Thermo Electron) equipped with a nanospray ionization source, as described previously.30 MS1 data were acquired in profile mode in the Orbitrap, and the top 5 most intense ions in each MS1 scan were selected first for pulsed Q collision dissociation (PQD) and then collision induced dissociation (CID) in the linear ion trap. Dynamic exclusion was enabled with a repeat count 2, repeat duration 30 s, and exclusion duration 180 s. Other mass spectrometry data generation parameters were as follows: collision energy 35%, ion selection threshold for MS/MS 500 counts, isolation width 3 m/z, default charge state 3, charge state screening enabled, activation time 0.100 ms, and Activation Q of 0.700 and 0.250 for the PQD and CID, respectively.
Protein Identification and Quantification.
MSConvert (v3.06736) was used to convert the acquired RAW files to mzML. Database searches and PSM validation were performed in the Trans-Proteomic Pipeline (TPP).31 Comet (v2014.1) was used to perform the database searches against a UniProtKB human protein database (version July 2014; 40 826 reviewed sequences; 48 167 unreviewed sequences) with a concatenated reverse sequence decoy database.32 Search parameters include 50 ppm peptide mass tolerance; 1.0 Da fragment tolerance; variable modification, methionine +15.99492; and the following fixed modifications, cysteine +57.02510 (carbamidomethylation), N-term peptide +229.1629, lysine +229.1629, (oxidation), and semitryptic peptides with up to three missed cleavages. Digestion efficiency was evaluated for both replicates and calculated at 98% (with ~4% of identified peptides having 1 missed cleavage). PeptideProphet was used to validate the peptide search results from Comet and only peptide identifications with greater than 0.8 probability, with a calculated false positive rate <1%, were kept for quantification. All peptides were used in ProteinProphet to infer proteins from the identified peptides and proteins with zero probability or zero quantified peptides were discarded. QuantiMORE (formerly IsoQuant) was employed to calculate the isobaric tag ratios for the validated peptides in each replicate.30 The software has been updated to include isobaric tag quantitation and is available for download at the following Web address: http://www.proteomeumb.org/MZw.html. Protein ratios were computed in the R programming language (v3.2.1) from the peptide ratios generated by QuantiMORE. The protein ratio is the average of the peptide ratios assigned by ProteinProphet and weighted by the number of quantified PSMs for each peptide. The reported protein ratios are the average and standard deviation between two replicates. The protein ratios were subjected to multivariate analysis using the pRoloc (v1.8.0) and MSnbase (v1.16.12) R packages.33,34 The R scripts can be accessed at the following Web address: http://wfondrie.github.io/SKBR3B_Exosome_Proteome. Protein ratios were rescaled using a log2 transformation, such that positive values reflect fold increases and negative values reflect fold decreases. The mass spectrometry proteomics data, including raw MS data, COMET search results, and QuantiMORE result files, have been deposited to the ProteomeXchange Consortium35 via the PRIDE partner repository with the data set identifier PXD002053.
Multivariate Cluster Analysis.
Protein classification was performed using Support Vector Machine (SVM) analysis, a supervised machine learning approach. SVM model free parameters, cost and sigma, were optimized using 5-fold cross validation via grid search over 100 iterations. Exosome markers were chosen from established exosome proteins in the literature (Syndecan-1, CD9, CD81, ALIX, and TSG101).36 Nonexosome markers were chosen from proteins that were quantified but do not appear in the Homo sapiens database of ExoCarta, a compendium of proteins, RNAs, and lipids identified in exosomes.37 A total of five exosome makers and eight nonexosome markers were selected, with all markers having two or more peptides quantified.
RESULTS AND DISCUSSION
To better define the exosome proteome, we adapted previously used subcellular proteomic strategies that incorporated protein quantitation and density fractionation and paired them with the common exosome enrichment strategy of differential centrifugation.22–24 In doing so, we illustrated a novel approach to confidently identify components of the breast cancer exosome proteome.
Isolation of Exosomes by Ultracentrifugation and Optiprep Gradient Separation.
Using differential centrifugation, we first removed whole cells (300g and 2 000g) and then with a secondary spin at higher g-force (10 000g) removed cell debris and retained this pellet to include in our analysis. The 10 000g pellet (10K fraction) established a baseline for our enrichment strategy and acted as a background profile of potential residual components that were identified in the exosome fractions. A crude exosome pellet (100 K fraction) was generated after 100 000g ultracentrifugation; similar to the pellets that have been generated in previous breast cancer exosome proteome studies.16 To further reduce residual nonexosomal proteins such as secreted proteins, protein aggregates and other vesicles associated with post-100 000g ultracentrifugation, exosomes were further enriched using an Optiprep/iodixanol gradient (Figure 1A). We probed twelve 1 mL Optiprep fractions for the exosomal marker proteins ALIX and CD63 to determine which fractions were enriched for exosomes. Fractions 6 and 7 stained positive for CD63 and ALIX at a calculated density of 1.14–1.19 g/mL, which is comparable to the accepted density of exosomes from previous studies (Figure 1B).36 Electron microscopy was performed on the pooled exosome-positive Optiprep fractions, revealing a 40–130 nm vesicle size range and morphology associated with exosomes (Figure 1C). The Optiprep fraction (Opti fraction) was included in our analysis and represented the most enriched exosome fraction, with the density gradient removing additional contaminants that may be enriched when performing 100 000g centrifugation but are not associated with the exosome vesicle.
Figure 1.

Overview of exosome isolation, characterization, and TMT-labeling strategy to elucidate exosomal protein enrichment. (A) Differential ultracentrifugation was performed, and pellets obtained after 10 000g spin (10K pellet), 100 000g spin (100 K pellet), and post-Optiprep density gradient (Opti pellet) were retained for MS analysis. (B) Immunoblot for known exosome markers ALIX and CD63 in the recovered 1 mL Optiprep fractions. Fractions 6 and 7 were positive for the exosome markers with a corresponding density of 1.14–1.19 g/mL. (C) Electron microscopy image of negatively stained SKBR3B exosome vesicles. Bar = 100 nm. (D) Peptide digest from each fraction was TMT-labeled and mixed equally prior to LC–MS/MS analysis. Hybridization method of PQD-CID allowed for quantification of reporter ions and identification of the peptide.
Tandem Mass Tagging Analysis Reveals Protein Abundance Differences between the Ultracentrifugation and Optiprep Fractions.
As noted by Simpson et al., with the multitude of strategies used to isolate exosomes combined with differences in the protein composition as a result of originating from different parental cells, it is difficult to reach a consensus regarding exosome purity.38 In the context of protein localization to subcellular organelles, the identification of a protein in a specific subcellular fraction is not sufficient evidence to assign organelle localization; rather it is knowing the relative abundance profile of a protein throughout all subcellular fractions.22 For a protein to be considered exosomal, the protein’s abundance should increase in conditions where exosomes are enriched. To assess protein abundance differences between our 10K fraction, 100 K fraction, and Optiprep fraction, tandem-mass-tagging (TMT) was paired with two-dimensional liquid chromatography followed by tandem mass spectrometry on a peptide mixture of fraction lysates. A schematic of the TMT 3-plex (TMT-129, TMT-130, TMT-131) workflow is illustrated in Figure 1D. In total, 2 179 proteins from 1 905 protein groups were quantified, indicating identification in all three analyte fractions (10K, 100 K, and Optiprep fractions). Mass tag fragmentation revealed abundance differences of the identified proteins between the three fractions, indicative of the distribution of these proteins as a result of our exosome enrichment technique. An example of the mass tag intensity differences observed between the three fractions can be seen in the representative reporter ion spectra from identified peptides of ATP synthase 5 subunit δ and CD63 (Figure 2A). Quantified proteins were reported in ratios of TMT-130/TMT-129 (100K/10K) and TMT-131/TMT-129 (Optiprep/10K) to represent protein enrichment in the 100 000g fraction and Optiprep fraction, respectively. Alternatively, the TMT-131/TMT-130 (Optiprep/100 K) could have been used to represent protein enrichment in the Optiprep fractions. However, the Optiprep appears to have minimal orthogonal impact on exosome isolation when compared directly to the 100 K fraction and is more of a “refining” step (Figure S-1).39 Quantified proteins showing greater than 1.5 ratio enrichment in the Optiprep fraction (Optiprep/10K) included known exosomal proteins ALIX (2.07 ± 0.39), CD63 (3.66 ± 0.45), TSG101 (2.30 ± 0.31), Syndecan 1 (1.55 ± 0.19), CD9 (4.94 ± 0.30), and CD81 (5.56 ± 2.12). Proteins that were observed to have decreased abundance in both the crude exosome fraction and enriched exosome fraction, with 100K/10K and Optiprep/10K ratios below 1.0 included: histone proteins, such as Histone H4 (0.36 ± 0.01, 0.12 ± 0.02), Histone H3 (0.26 ± 0.01, 0.09 ± 0.004), and Histone H1.4 (0.30 ± 0.02, 0.14 ± 4.0 × 10⁴); and mitochondrial proteins, including ATP synthase subunit D (0.37 ± 0.09, 0.21 ± 2.0 × 10⁴) and cytochrome C oxidase subunit 2 (0.37 ± 0.02, 0.14 ± 0.04). An expanded list of the quantified proteins with their respective protein ratios can be seen in Table S-1. It has been noted that TMT quantitation can be influenced by ratio distortion, wherein coeluting precursor ions can influence reporter ion values.40 To address this, protein abundance was verified via Western blot, wherein we probed for several of the previously mentioned proteins including ALIX, CD63, and TSG101, as well as Histone H3, and found total protein amounts to be reflective of the TMT-quantitative analysis (Figure 2B). Additional proteins that were immunoblotted included GSK3β, which was found to be enriched in the exosome fraction, and PARP1 and β-actin, which were found to have decreased abundance in the exosome fractions. The results of the TMT quantitation show that our exosome enrichment steps are successful in enriching common exosome marker proteins, resulting in an increased abundance of these proteins in the 100 K and Optiprep fractions relative to our 10K cell debris pellet. In addition, the quantitative data reveals that there are identified proteins with higher relative abundances in the 10K fraction compared to the 100 K and Optiprep fractions. Although identified in our 100 K and Optiprep exosome fractions, the reduced abundance of these proteins, in contrast to the exosome markers, suggests that these proteins may not be derived from exosome vesicles. By incorporating quantitative information on the various fractions in our exosome enrichment strategy, we can accurately assess a protein’s abundance distribution in the various fractions and determine if its abundance is related to exosome enrichment or depletion of contaminants.
Figure 2.
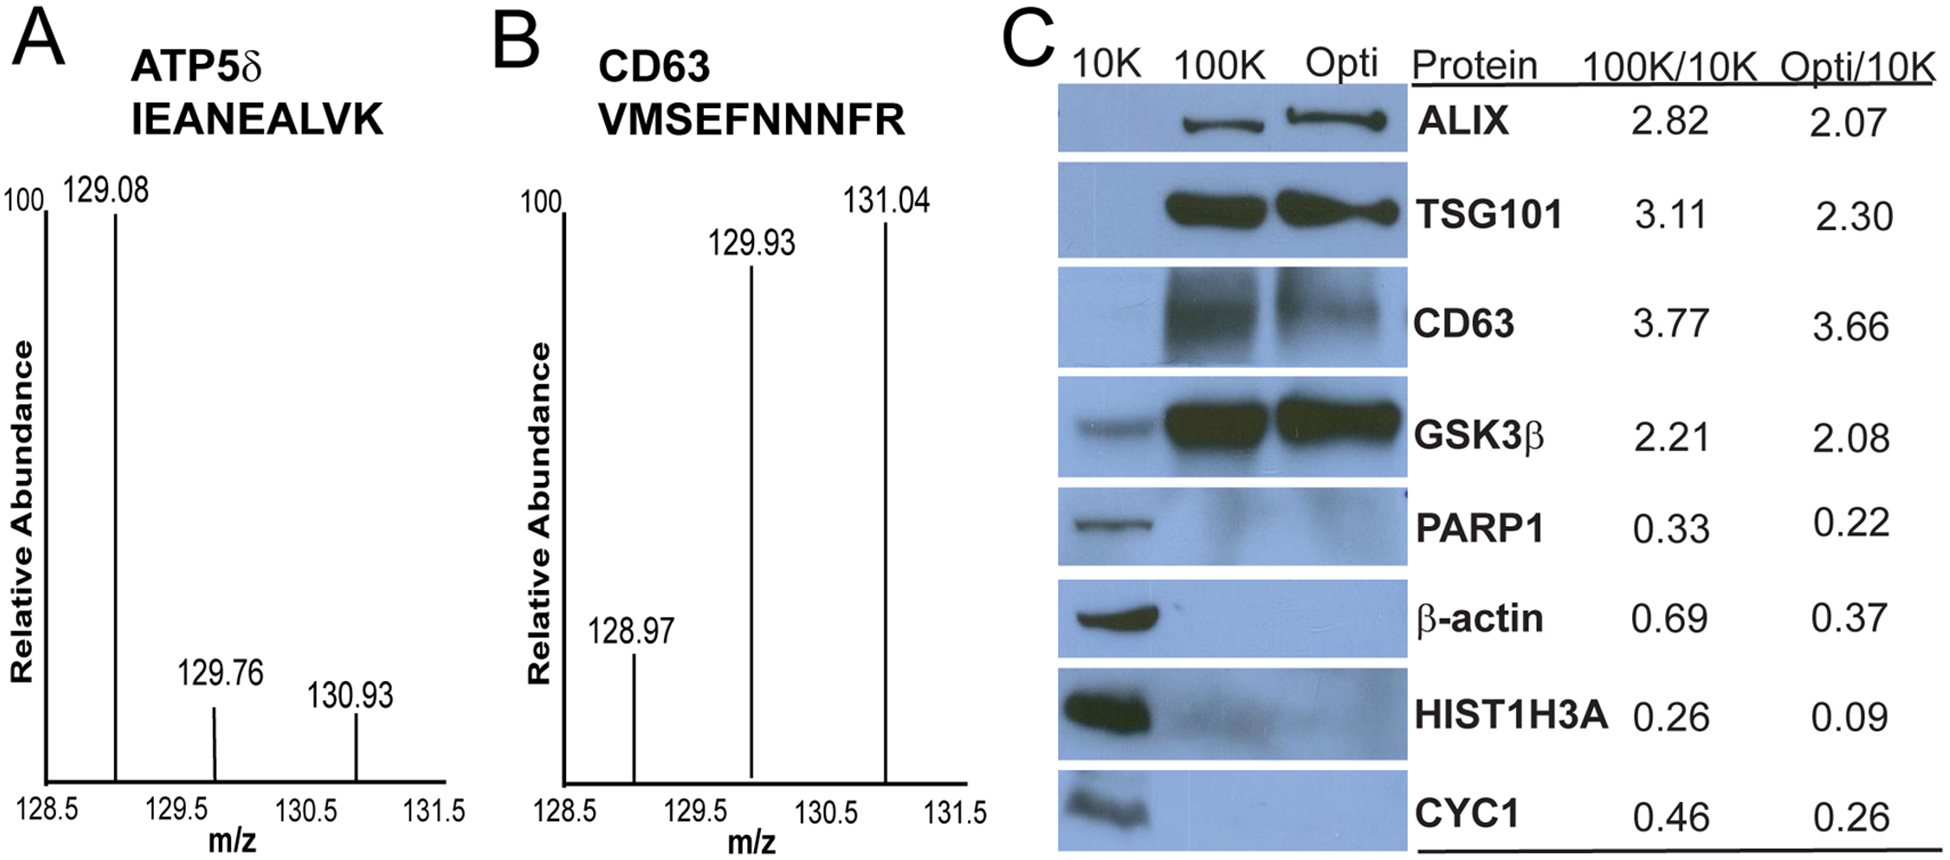
Peptides and proteins display differential abundance in various analysis fractions. Identified peptides from ATP synthase subunit δ (A) and CD63 (B) display differences in TMT reporter ion intensities between the three fractions. TMT reporter ions are as follows: 129–10K fraction, 130–100 K fraction, and 131-Opti fraction. (C) Western Blot analysis of individual fraction lysates reveals differential protein abundance (left). Known exosome proteins ALIX, TSG101, and CD63 as well as GSK3β increased in abundance with exosome enrichment. Levels of nuclear proteins (PARP1 and Histone H3 (HISTH3A)), cytoskeletal protein β-actin, and the mitochondrial protein, Cytochrome C (CYC1), decreased during exosome enrichment. Reported QuantiMORE TMT ratios for each respective protein representing 100 000g ultracentrifugation (100K/10K) and Optiprep (Opti/10K) exosome enrichment (right).
Unbiased Classification of the Exosome Proteome Using Supervised Clustering of Quantified Proteins.
To further analyze the quantitative proteomics results, we employed support vector machine (SVM) analysis, a supervised machine learning method, to cluster the quantified proteins as likely exosomal or nonexosomal based on the observed TMT protein ratios. A set of five exosome protein markers (Syndecan 1, ALIX, CD9, CD81, and TSG101) were chosen based on various criteria including being previously accepted exosomal proteins in the literature and quantification of 2 or more unique peptides in our proteomic analysis. We chose eight nonexosome markers from our data set that were not found in the human ExoCarta database and have subcellular localizations based on gene ontology not associated with exosome biogenesis (i.e., nuclear, mitochondrial, Golgi). These markers were subjected to the same quality criteria as the exosome markers and included SEC63, Hexokinase-2, and very-long-chain enoyl-CoA reductase. The complete list of both exosome and nonexosome markers can be seen in Table 1. A visualization of our TMT quantitation data was created from the log2 transformed protein ratios and the individual proteins plotted, with annotation of our selected protein markers can be seen in Figure 3. As expected, the exosome markers appear to be localized to the upper right quadrant, which indicated proteins enriched by the 100 000g ultracentrifugation and the Optiprep density gradient. In contrast, the nonexosome markers are found in the bottom left quadrant indicating a decrease in relative protein abundance as a result of our exosome enrichment strategy. The scatter plot of the log2 transformed protein ratios did not reveal a distinct grouping pattern that would allow us to distinguish between exosome and nonexosome protein populations visually. On the basis of the hypothesis that exosomal proteins would follow a similar enrichment pattern to the exosome markers, we performed multivariate cluster analysis to distinguish likely exosome proteins from coisolated proteins of different origins. Supervised SVM analysis was employed using the exosome markers and nonexosome markers as a training set for the algorithm prior to being expanded to our larger quantitative proteomics data set, assigning a probability of each protein to belong to the exosome or nonexosome cluster (Figure 4A). The clustering resulted in 251 proteins classified as exosomal. Proteins with a high SVM probability in this exosome cluster, previously identified in exosomes, included CD63 (0.87), heat shock protein 71 (0.85), and Syntenin-1 (0.86), which were not used in our training set and could be considered positive controls of our analysis strategy.41 The 1922 proteins classified as nonexosomal were considered unlikely to be of exosomal origin due to the serial depletion of protein abundance during exosome enrichment. The other six proteins were predicted to have an equal probability to be either exosomal or nonexosomal (Table S-1). To address the possibility that our enrichment strategy may include larger plasma membrane fragment vesicles, we investigated the location of 12 plasma membrane (PM) marker proteins in our clusters (Figure 4B). Only two plasma membrane proteins, Integrin alpha-V and CD151, were found in the exosome cluster, albeit with relatively low exosome SVM probabilities, 0.60 and 0.62, respectively. The remaining nine plasma membrane markers, which included the sodium/ potassium transporter ATP1A1 and the calcium transporters ATP2B1, ATP2B3, and ATPB4, clustered as nonexosomal (Table S-2). In the SVM analysis, these various ion transporters did not cluster with the exosome markers and when paired with the EM analysis showing distribution of vesicles smaller than 200 nm, the results indicate that our exosome enrichment strategy is not selectively enriching membrane vesicle fragments. Overall, the results of our cluster analysis revealed 251 proteins to be likely of breast cancer exosome origin and suggest that the remaining proteins may be artifacts of our exosome isolation and enrichment strategies.
Table 1.
Protein Marker with Their Respective Assignments Used in Multivariate Cluster Analysisa
| Log 2 ratiob | |||||
|---|---|---|---|---|---|
| gene name | description | 100K/10K | Opti/IOK | unique peptides | cluster marker |
| SDC1 | Syndecan-1 | 1.01 | 0.63 | 5 | exosome |
| CD9 | CD9 antigen | 2.51 | 2.30 | 5 | exosome |
| CD81 | CD 81 antigen | 3.03 | 2.47 | 3 | exosome |
| PDCD6IP | Programmed cell death 6-interacting protein (ALIX) | 1.50 | 1.05 | 33 | exosome |
| TSG101 | Tumor susceptibility gene 101 protein | 1.64 | 1.20 | 10 | exosome |
| SEC63 | Translocation protein SEC63 homologue | −0.87 | −2.00 | 7 | non-exosome |
| TMX3 | Protein disulfide-isomerase TMX3 | −1.25 | −2.06 | 3 | Non-exosome |
| HK2 | Hexokinase-2 | −1.26 | −1.69 | 8 | non−exosome |
| PCK2 | Phosphoenolpyruvate carboxykinase; mitochondrial | −1.79 | −1.59 | 3 | Non-exosome |
| SEC62 | Translocation protein SEC62 | −1.01 | −1.43 | 3 | Non-exosome |
| TECR | Very-long-chain enoyl-CoA reductase | −1.62 | −2.18 | 7 | Non-exosome |
| MST4 | Serine/threonine-protein kinase MST4 | −1.07 | −1.94 | 6 | Non-exosome |
| BCLAF1 | Isoform 2 of Bcl-2-associated transcription factor 1 | −0.53 | −1.12 | 3 | non-exosome |
Five exosome and eight intercellular organelle (non-exosome) markers were selected.
Log 2 transformed TMT ratios reported by QuantiMORE between 10K, 100 K, and Optiprep lysates derived from SKBR3B conditioned media.
Figure 3.

Known exosome markers localize to the quadrant corresponding to 100 K and Optiprep enrichment. TMT log2 protein ratios were plotted by 100K enrichment (x-axis) against Optiprep enrichment (y-axis). Selected Exosome (red) and Nonexosome (blue) protein markers are annotated.
Figure 4.
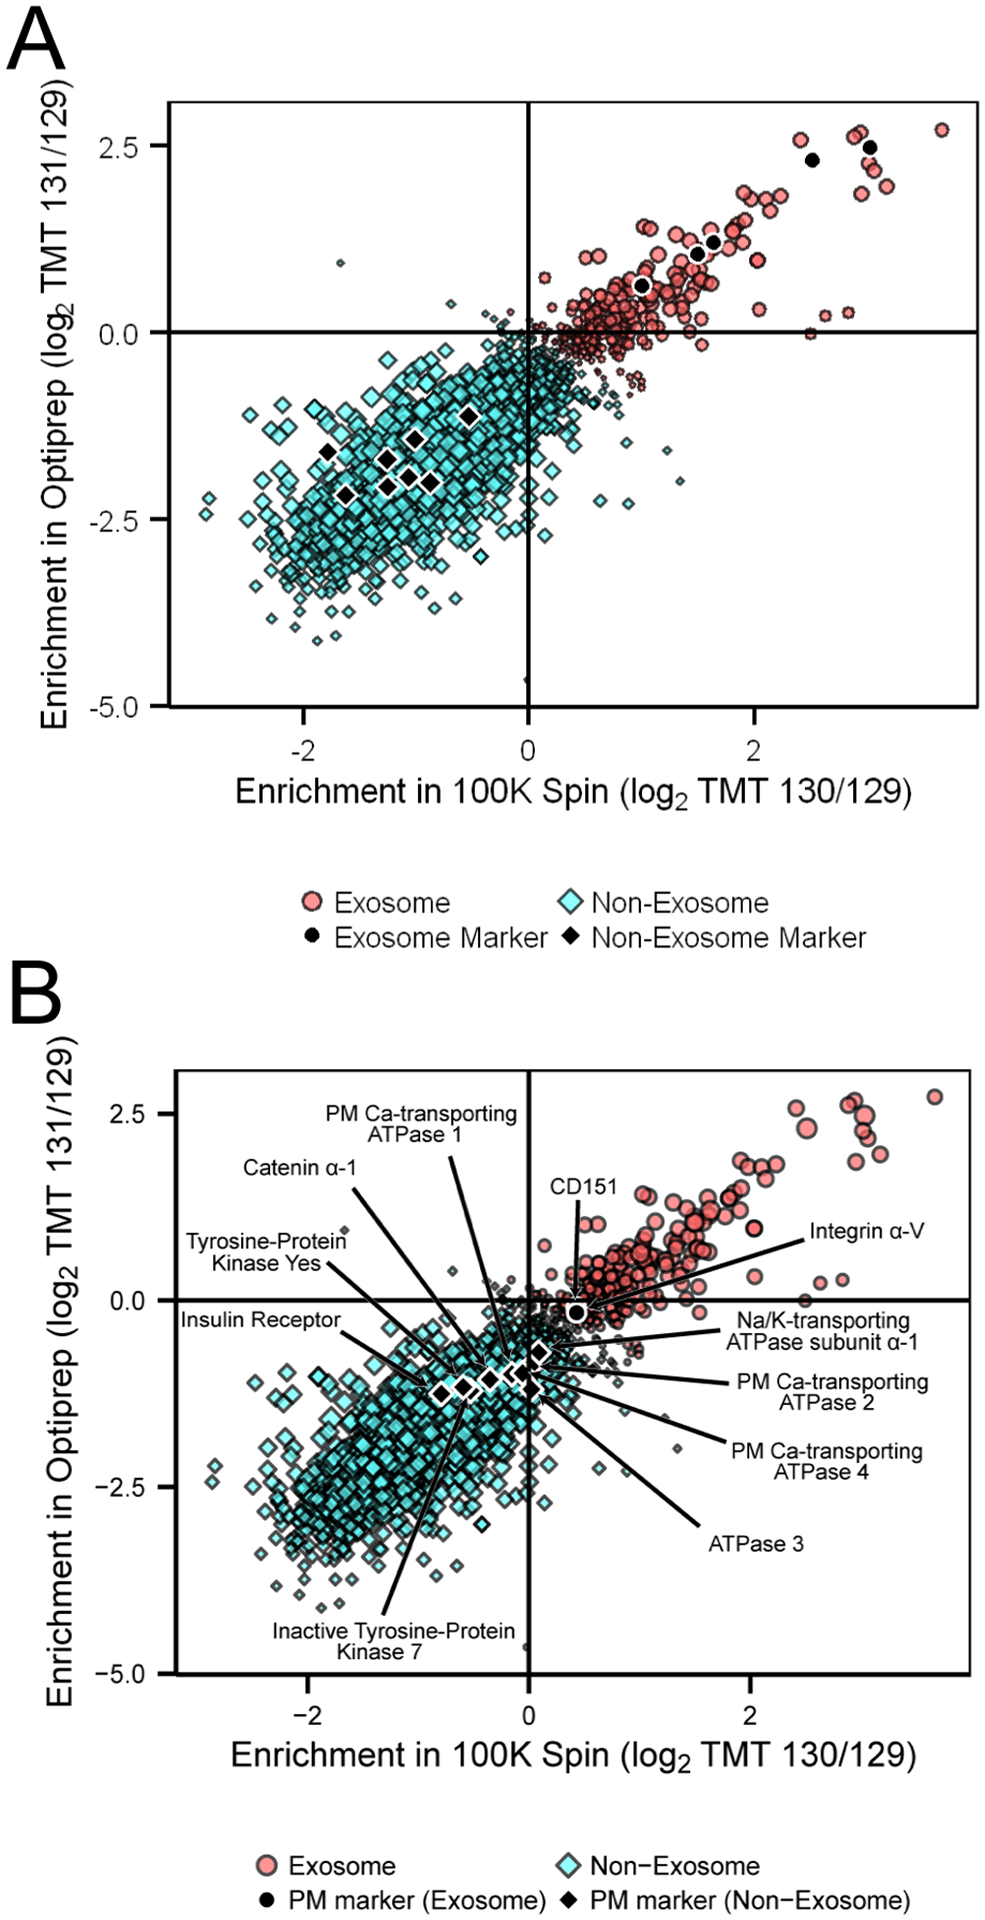
SVM cluster analysis classified 241 proteins as exosomal: (A) plotted SVM cluster of all 2 179 quantified proteins from the TMT analysis. Exosome proteins (red circles) localized in the upper right quadrant, with exosome markers and nonexosome markers indicated by black circles. Proteins classified as nonexosomal are indicated by the blue squares. (B) Plotted SVM cluster with annotated plasma membrane markers indicated by black circles.
Size-Exclusion Chromatography Isolation of Exosomes Affirms Exosome Protein Classifications.
To validate the SVM classifications, we employed size-exclusion chromatography (SEC) as a distinct method of exosome isolation. The SEC fractions were probed for exosome marker proteins ALIX and CD63, revealing fractions 9 and 10 to be positive for both markers (Figure S-2A). These fractions were pooled, digested, and analyzed via tandem mass spectrometry. A total of 638 proteins were identified in this analysis, containing identifications from 9.7% of the nonexosome cluster (187 proteins) and 39.4% of the exosome cluster (99 proteins) (Figure S-2B). The 4-fold greater proportion of exosome cluster proteins identified in the SEC isolation indicates that the SVM classifications are accurate. Incomplete overlap with the exosome cluster can be attributed insufficient depth from lack of post digest fractionation of the SEC isolates. Likewise, the 352 proteins unique to the SEC fractions may have resulted from the stringent requirement for replicate protein quantification in the classification experiment or unique contaminants introduced by the distinct method of isolation.42 Regardless, the SEC fractions support our analysis strategy by demonstrating the increased reproducibility of exosome cluster protein identifications in comparison to proteins found in the nonexosome cluster.
CONCLUSION
As the number of studies exploring the exosome proteome continue to grow in an effort to better understand their role in cancer and serve as potential biomarker vesicles, it has become necessary to develop and improve current methods for accurate characterization of these extracellular vesicles. One significant issue plaguing the exosome field is a lack of consensus in regards to exosome purity resulting from the multiple methods of exosome isolation. The ability to discriminate protein contaminants from the exosome proteome precedes the development of a platform incorporating exosomes as a multimarker phenotyping tool. Our analysis describes one method to characterize the exosome proteome, wherein we emphasize protein abundance rather than protein presence in an exosome fraction as a more accurate determinant of a protein being a constituent of the exosome proteome. Although only a breast cancer exosome proteome was examined, the application of this methodology to other cancer types will enable a better understanding of the core cancer exosome proteome as well as discern cancer-specific exosome signatures. We detailed an analytical approach which paired quantitative and spatial proteomics to unbiasedly characterize the exosome proteome. Methods such as this enable the further pursuit of exosomes as biomarker vesicles in human disease.
Supplementary Material
ACKNOWLEDGMENTS
This work was funded by the National Institutes of Health Grant R01AG25323 to A.J.Y. The University of Maryland Cancer Center is supported by an NIH NCI Cancer Center Support Grant (Grant P30CA134274) and the Maryland Cigarette Restitution Fund.
Footnotes
Supporting Information
The Supporting Information is available free of charge on the ACS Publications website at DOI: 10.1021/acs.anal-chem.5b02586.
TMT log2 protein ratios were plotted by 100 K enrichment (x-axis) against Optiprep/100 K enrichment (y-axis); Western blot analysis of our SEC fractions and Venn diagram of LC–MS/MS results; quantified proteins and SVM analysis probability values; plasma membrane markers; and SEC protein identification information (PDF)
The authors declare no competing financial interest.
REFERENCES
- (1).Fevrier B; Raposo G Curr. Opin. Cell Biol 2004, 16, 415–421. [DOI] [PubMed] [Google Scholar]
- (2).Wollert T; Hurley JJ Nature 2010, 464 (7290), 864–869. [DOI] [PMC free article] [PubMed] [Google Scholar]
- (3).Hurley JH; Hanson PI Nat. Rev. Mol. Cell Biol 2010, 11 (8), 556–566. [DOI] [PMC free article] [PubMed] [Google Scholar]
- (4).Baietti MF; Zhang Z; Mortier E; Melchior A; Degeest G; Geeraerts A; Ivarsson Y; Depoortere F; Coomans C; Vermeiren E; Zimmermann P; David G Nat. Cell Biol 2012, 14 (7), 677–685. [DOI] [PubMed] [Google Scholar]
- (5).Ostrowski M; Carmo NB; Krumeich S; Fanget I; Raposo G; Savina A; Moita CF; Schauer K; Hume AN; Freitas RP; Goud B; Benaroch P; Hacohen N; Fukuda M; Desnos C; Seabra MC; Darchen F; Amigorena S; Moita LF; Thery C Nat. Cell Biol 2010, 12 (1), 19–30. [DOI] [PubMed] [Google Scholar]
- (6).Yu X; Harris SL; Levine AJ Cancer Res. 2006, 66 (9), 4795–4801. [DOI] [PubMed] [Google Scholar]
- (7).Lespagnol a; Duflaut D; Beekman C; Blanc L; Fiucci G; Marine J-C; Vidal M; Amson R; Telerman a. Cell Death Differ. 2008, 15, 1723–1733. [DOI] [PubMed] [Google Scholar]
- (8).King HW; Michael ZM; Gleadle JM BMC Cancer 2012, 12, 421. [DOI] [PMC free article] [PubMed] [Google Scholar]
- (9).Thompson CA; Purushothaman A; Ramani VC; Vlodavsky I; Sanderson RD J. Biol. Chem 2013, 288 (14), 10093–10099. [DOI] [PMC free article] [PubMed] [Google Scholar]
- (10).Trajkovic K; Hsu C; Chianta S; Rajendran L; Wenzel D; Wieland F; Schwille P; Brugger B; Simons M Science (Washington, DC, U. S.) 2008, 319 (5867), 1244–1247. [DOI] [PubMed] [Google Scholar]
- (11).Parolini I; Federici C; Raggi C; Lugini L; Palleschi S; De Milito A; Coscia C; Iessi E; Logozzi M; Molinari A; Colone M; Tatti M; Sargiacomo M; Fais SJ Biol. Chem 2009, 284 (49), 34211–34222. [DOI] [PMC free article] [PubMed] [Google Scholar]
- (12).Ge R; Tan E; Sharghi-Namini S; Asada HH Cancer Microenviron. 2012, 5, 323–332. [DOI] [PMC free article] [PubMed] [Google Scholar]
- (13).Andre F; Schartz NEC; Movassagh M; Flament C; Pautier P; Morice P; Pomel C; Lhomme C; Escudier B; Le Chevalier T; Tursz T; Amigorena S; Raposo G; Angevin E; Zitvogel L Lancet 2002, 360 (9329), 295–305. [DOI] [PubMed] [Google Scholar]
- (14).Vlassov AV; Magdaleno S; Setterquist R; Conrad R Biochim. Biophys. Acta, Gen. Subj 2012, 1820 (7), 940–948. [DOI] [PubMed] [Google Scholar]
- (15).Kruger S; Elmageed Z; Hawke DH; Worner PM; Jansen DA; Abdel-Mageed AB; Alt EU; Izadpanah R BMC Cancer 2014, 14, 44. [DOI] [PMC free article] [PubMed] [Google Scholar]
- (16).Palazzolo G; Albanese NN; Di Cara G; Gygax D; Vittorelli ML; Pucci-Minafra I Anticancer Res. 2012, 32, 847–860. [PubMed] [Google Scholar]
- (17).Ji H; Greening DW; Barnes TW; Lim JW; Tauro BJ; Rai A; Xu R; Adda C; Mathivanan S; Zhao W; Xue Y; Xu T; Zhu H-J; Simpson RJ Proteomics 2013, 13 (10–11), 1672–1686. [DOI] [PubMed] [Google Scholar]
- (18).Liang B; Peng P; Chen S; Li L; Zhang M; Cao D; Yang J; Li H; Gui T; Li X; Shen KJ Proteomics 2013, 80, 171–182. [DOI] [PubMed] [Google Scholar]
- (19).Xiao D; Ohlendorf J; Chen Y; Taylor DD; Rai SN; Waigel S; Zacharias W; Hao H; McMasters KM PLoS One 2012, 7 (10), e46874. [DOI] [PMC free article] [PubMed] [Google Scholar]
- (20).Welton JL; Khanna S; Giles PJ; Brennan P; Brewis IA; Staffurth J; Mason MD; Clayton A Mol. Cell. Proteomics 2010, 9(6), 1324–1338. [DOI] [PMC free article] [PubMed] [Google Scholar]
- (21).Simpson RJ; Jensen SS; Lim JW E. Proteomics 2008, 8(19), 4083–4099. [DOI] [PubMed] [Google Scholar]
- (22).Marelli M; Smith JJ; Jung S; Yi E; Nesvizhskii AI; Christmas RH; Saleem RA; Tam YYC; Fagarasanu A; Goodlett DR; Aebersold R; Rachubinski RA; Aitchison JD J. Cell Biol 2004, 167 (6), 1099–1112. [DOI] [PMC free article] [PubMed] [Google Scholar]
- (23).Dunkley TPJ; Hester S; Shadforth IP; Runions J; Weimar T; Hanton SL; Griffin JL; Bessant C; Brandizzi F; Hawes C; Watson RB; Dupree P; Lilley KS Proc. Natl. Acad. Sci.U. S. A 2006, 103 (17), 6518–6523. [DOI] [PMC free article] [PubMed] [Google Scholar]
- (24).Jung S; Smith JJ; von Haller PD; Dilworth DJ; Sitko KA; Miller LR; Saleem RA; Goodlett DR; Aitchison JD Mol. Cell. Proteomics 2013, 12 (5), 1421–1435. [DOI] [PMC free article] [PubMed] [Google Scholar]
- (25).Breckels LM; Gatto L; Christoforou a; Groen a J.; Lilley KS; Trotter MWB J. Proteomics 2013, 88, 129–140. [DOI] [PubMed] [Google Scholar]
- (26).Tauro BJ; Greening DW; Mathias R. a; Ji H; Mathivanan S; Scott AM; Simpson RJ Methods 2012, 56 (2), 293–304. [DOI] [PubMed] [Google Scholar]
- (27).Schröder M; Schäfer R; Friedl P Anal. Biochem 1997, 244 (1993), 174–176. [DOI] [PubMed] [Google Scholar]
- (28).Erde J; Loo RRO; Loo J. a. J. Proteome Res 2014, 13, 1885–1895. [DOI] [PMC free article] [PubMed] [Google Scholar]
- (29).Wiśniewski JR; Zougman A; Mann MJ Proteome Res. 2009, 8 (12), 5674–5678. [DOI] [PubMed] [Google Scholar]
- (30).Liao Z; Wan Y; Thomas SN; Yang AJ Anal. Chem 2012, 84 (10), 4535–4543. [DOI] [PMC free article] [PubMed] [Google Scholar]
- (31).Chambers MC; Maclean B; Burke R; Amodei D; Ruderman DL; Neumann S; Gatto L; Fischer B; Pratt B; Egertson J; Hoff K; Kessner D; Tasman N; Shulman N; Frewen B; Baker TA; Brusniak MY; Paulse C; Creasy D; Flashner L; Kani K; Moulding C; Seymour SL; Nuwaysir LM; Lefebvre B; Kuhlmann F; Roark J; Rainer P; Detlev S; Hemenway T; Huhmer A; Langridge J; Connolly B; Chadick T; Holly K; Eckels J; Deutsch EW; Moritz RL; Katz JE; Agus DB; MacCoss M; Tabb DL; Mallick P Nat. Biotechnol 2012, 30 (10), 918–920. [DOI] [PMC free article] [PubMed] [Google Scholar]
- (32).Eng JK; Jahan TA; Hoopmann MR Proteomics 2013, 13(1), 22–24. [DOI] [PubMed] [Google Scholar]
- (33).Gatto L; Breckels LM; Burger T; Nightingale DJ; Groen AJ; Campbell C; Nikolovski N; Mulvey CM; Christoforou A; Ferro M; Lilley KS Mol. Cell. Proteomics 2014, 13 (8), 1937–1952. [DOI] [PMC free article] [PubMed] [Google Scholar]
- (34).Gatto L; Breckels LM; Wieczorek S; Burger T; Lilley KS Bioinformatics 2014, 30 (9), 1322–1324. [DOI] [PMC free article] [PubMed] [Google Scholar]
- (35).Vizcaíno J; Deutsch E; Wang R Nat. Biotechnol 2014, 32 (3), 223–226. [DOI] [PMC free article] [PubMed] [Google Scholar]
- (36).Thery C; Amigorena S; Raposo G; Clayton A Curr. Protoc. Cell Biol 2006, 3.22. [DOI] [PubMed] [Google Scholar]
- (37).Mathivanan S; Simpson RJ Proteomics 2009, 9 (21), 4997–5000. [DOI] [PubMed] [Google Scholar]
- (38).Simpson RJ; Lim JWE; Moritz RJ; Mathivana S Expert Rev. Proteomics 2009, 6 (3), 267–283. [DOI] [PubMed] [Google Scholar]
- (39).Taylor DD; Shah S Methods 2015, 1–8. [Google Scholar]
- (40).Christoforou AL; Lilley KS Anal. Bioanal. Chem 2012, 404, 1029–1037. [DOI] [PubMed] [Google Scholar]
- (41).Rappa G; Mercapide J; Anzanello F; Pope RM; Lorico A Mol. Cancer 2013, 12, 62. [DOI] [PMC free article] [PubMed] [Google Scholar]
- (42).Lobb RJ; Becker M; Wen Wen S; Wong CSF; Wiegmans AP; Leimgruber A; Möller AJ Extracell. Vesicles 2015, 4, 27031. [DOI] [PMC free article] [PubMed] [Google Scholar]
Associated Data
This section collects any data citations, data availability statements, or supplementary materials included in this article.