

Abstract
Background
The proportion of total healthcare expenditures spent on drugs has continued to grow in countries of all income categories. Policy‐makers are under pressure to control pharmaceutical expenditures without adversely affecting quality of care. Financial incentives seeking to influence prescribers' behaviour include budgetary arrangements at primary care and hospital settings (pharmaceutical budget caps or targets), financial rewards for target behaviours or outcomes (pay for performance interventions) and reduced benefit margin for prescribers based on medicine sales and prescriptions (pharmaceutical reimbursement rate reduction policies). This is the first update of the original version of this review.
Objectives
To determine the effects of pharmaceutical policies using financial incentives to influence prescribers' practices on drug use, healthcare utilisation, health outcomes and costs (expenditures).
Search methods
We searched the Cochrane Central Register of Controlled Trials (CENTRAL) (searched 29/01/2015); MEDLINE, Ovid SP (searched 29/01/2015); EMBASE, Ovid SP (searched 29/01/2015); International Network for Rational Use of Drugs (INRUD) Bibliography (searched 29/01/2015); National Health Service (NHS) Economic Evaluation Database (searched 29/01/2015); EconLit ‐ ProQuest (searched 02/02/2015); and Science Citation Index and Social Sciences Citation Index, Institute for Scientific Information (ISI) Web of Knowledge (citation search for included studies searched 10/02/2015). We screened the reference lists of relevant reports and contacted study authors and organisations to identify additional studies.
Selection criteria
We included policies that intend to affect prescribing by means of financial incentives for prescribers. Included in this category are pharmaceutical budget caps or targets, pay for performance and drug reimbursement rate reductions and other financial policies, if they were specifically targeted at prescribing or drug utilisation. Policies in this review were defined as laws, rules, regulations and financial and administrative orders made or implemented by payers such as national or local governments, non‐government organisations, private or social insurers and insurance‐like organisations. One of the following outcomes had to be reported: drug use, healthcare utilisation, health outcomes or costs. The study had to be a randomised or non‐randomised trial, an interrupted time series (ITS) analysis, a repeated measures study or a controlled before‐after (CBA) study.
Data collection and analysis
At least two review authors independently assessed eligibility for inclusion of studies and risks of bias using Cochrane Effective Practice and Organisation of Care (EPOC) criteria and extracted data from the included studies. For CBA studies, we reported relative effects (e.g. adjusted relative change). The review team re‐analysed all ITS results. When possible, the review team also re‐analysed CBA data as ITS data.
Main results
Eighteen evaluations (six new studies) of pharmaceutical policies from six high‐income countries met our inclusion criteria. Fourteen studies evaluated pharmaceutical budget policies in the UK (nine studies), two in Germany and Ireland and one each in Sweden and Taiwan. Three studies assessed pay for performance policies in the UK (two) and the Netherlands (one). One study from Taiwan assessed a reimbursement rate reduction policy. ITS analyses had some limitations. All CBA studies had serious limitations. No study from low‐income or middle‐income countries met the inclusion criteria.
Pharmaceutical budgets may lead to a modest reduction in drug use (median relative change ‐2.8%; low‐certainty evidence). We are uncertain of the effects of the policy on drug costs or healthcare utilisation, as the certainty of such evidence has been assessed as very low. Effects of this policy on health outcomes were not reported. Effects of pay for performance policies on drug use and health outcomes are uncertain, as the certainty of such evidence has been assessed as very low. Effects of this policy on drug costs and healthcare utilisation have not been measured. Effects of the reimbursement rate reduction policy on drug use and drug costs are uncertain, as the certainty of such evidence has been assessed as very low. No included study assessed the effects of this policy on healthcare utilisation or health outcomes. Administration costs of the policies were not reported in any of the included studies.
Authors' conclusions
Although financial incentives are considered an important element in strategies to change prescribing patterns, limited evidence of their effects can be found. Effects of policies, including pay for performance policies, in improving quality of care and health outcomes remain uncertain. Because pharmaceutical policies have uncertain effects, and because they might cause harm as well as benefit, proper evaluation of these policies is needed. Future studies should consider the impact of these policies on health outcomes, drug use and overall healthcare expenditures, as well as on drug expenditures.
Plain language summary
The effects of financial incentives for prescribers
This review is the first update of the Cochrane review of the effects of different financial policies seeking to influence prescriber behaviour. Researchers at The Cochrane Collaboration searched for all studies that could answer this question and found 18 studies. Their findings are summarised below.
What are financial incentives for prescribers?
Large amounts of healthcare funds are spent on medicines, and these amounts are increasing. Increased spending on medicines could mean less money for other healthcare or non‐healthcare services. Health insurers and policy‐makers are therefore looking for ways to ensure better use of medicines and to control the costs of medicines while still ensuring that patients get the medicines they need.
One way to try to control medicine spending is to influence the people who prescribe medicines, for instance, through financial incentives. One way of doing this involves introducing a budget cap or a budget target. Here, doctors and healthcare organisations are given a budget and the responsibility of staying within this budget. Another approach is to enforce a pay for performance policy, whereby doctors or their organisations are financially rewarded or punished for their prescribing behaviour. A third approach is to apply a reimbursement rate policy. Here, the amount of money doctors are reimbursed for medicine prescriptions is reduced, making the prescription of medicines less financially attractive to doctors.
These policies may lead doctors to prescribe fewer or cheaper medicines. This may reduce the use of unnecessary medicines but may also lead to poorer health outcomes.
What happens when financial incentives for prescribers are introduced?
Pharmaceutical budget caps or targets:
‐ This policy may lead to a modest reduction in overall drug use per patient (low‐certainty evidence).
‐ We are uncertain of the effects of this policy on drug costs or on healthcare utilisation, as the certainty of the evidence has been assessed as very low.
‐ The effects of this policy on health outcomes have not been measured.
Pay for performance policies:
‐ We are uncertain of the effects of these policies on drug use or health outcomes, as the certainty of the evidence has been assessed as very low.
‐ The effects of this policy on drug costs or on healthcare utilisation have not been measured.
Reimbursement rate policies:
‐ We are uncertain about the effects of reimbursement rate policies because the quality of the evidence has been assessed as very low.
How up‐to‐date is this review?
The review authors searched for studies that had been published up to January 2015.
Summary of findings
Background
This is the first update of the original review (Sturm 2007).
Description of the condition
The proportion of total healthcare expenditures spent on drugs has continued to grow in numerous countries over past decades (Reinhardt 2002; Granlund 2006; Okunade 2006; Martens 2007), and it has increased about 50% from 1995 to 2006 (Lu 2011). For instance in the UK and Spain, drug costs in primary care consumed over 50% of total primary care expenditures (Bradlow 1993; Antonanzas 2003). Although the growth rate has slowed in recent years, growth in pharmaceutical expenditures continues at a considerably faster rate than the general economy (Doloresco 2011). Middle‐income countries have observed a faster pace of pharmaceutical expenditure growth than low‐ or high‐income countries (Lu 2011). This is particularly the case for the high‐growth pharmaceutical markets of 17 low‐ and middle‐income 'pharmerging' countries as defined by IMS Health (Campbell 2013) and a few others not covered by IMS analyses.
In many low‐ and middle‐income countries, prescribing costs represent a major portion of total healthcare expenditures (Lu 2011). In low‐ and lower‐middle‐income countries, an even bigger proportion of the total health expenditures is spent on medicines (on average about 27% to 30% of total health expenditures), and affordability barriers hinder access to medicines, as many households are not supported by reliable financial mechanisms to secure such access (Steinbrook 2007; Lu 2011). Recent studies in different regions of the world have highlighted important concerns about access to and use of medicines in low‐ and middle‐income countries (Bigdeli 2013; Zaidi 2013; Sarayani 2014), and limited research evidence is available to guide the decisions of policy‐makers (Rashidian 2013; Emmerick 2013). It has been demonstrated that evidence on financing and health systems‐related decisions in low‐ and middle‐income countries is meagre (Rashidian 2013).
Thus, policy‐makers are under pressure to control pharmaceutical expenditures without adversely affecting the quality of care. Unexplained variations in prescribing between individual physicians, differences among settings and countries (Sturm 2005) and the fact that evidence and prescribing recommendations reflected in clinical practice guidelines often are not adequately put into practice (Feely 1999; Rashidian 2008) are reasons for implementing regulatory measures, including financial policies, targeted at prescribers to improve the quality of prescribing. Policy‐makers’ need for evidence continues to grow, but rigorous evaluations of regulatory measures are sparse.
Description of the intervention
Financial incentives for influencing prescribers' behaviour can be categorised into the following groups: budgetary arrangements at primary care and hospital settings (pharmaceutical budget caps or targets), financial rewards for target behaviours or outcomes (pay for performance interventions) and reduced benefit margins for prescribers based on medicine sales and prescriptions (pharmaceutical reimbursement rate reduction policies).
Budgetary arrangements for pharmaceuticals may be included in global budget decisions, whereby a proportion of a global budget is earmarked for prescribing pharmaceuticals, or they may be enacted as stand‐alone budgetary decisions for prescribing. For example, in the UK, a Primary Care Trust was "responsible for setting a prescribing budget against each practice" within its catchment area, and in Taiwan, global budgets were used to influence prescribers' behaviour in hospitals (Chou 2010). Financial rewards or incentives for target behaviours and outcomes constitute another type of financial incentive that is used with increasing frequency around the world (Giuffrida 2000; Rosenthal 2006; Rowe 2006; Trude 2006). Other interventions, including interventions that target the margin of benefit from medicine sales for dispensing physicians, may impact prescribing behaviours. For example, in 2004, Medicare changed the way it pays for injectable medicines administered in the office, to reduce physicians' margins of financial benefit derived from certain prescriptions (Painter 2005).
Other monetary regulations, such as remuneration for physicians, can also influence prescribing. However, these do not specifically target prescribing and generally are not considered pharmaceutical policies. Restriction of reimbursement for patients might also affect prescribing by physicians (Austvoll‐Dahlgren 2008), as might other pharmaceutical policies such as reference pricing. These policies are not intended as financial incentives for prescribers and are covered in other systematic reviews (Aaserud 2006a; Acosta 2014). Pharmaceutical policies that use financial incentives for prescribers, which are included in this review, are therefore limited to the three categories of interventions explained below.
How the intervention might work
Pharmaceutical budget caps or targets
Budgets are funds allocated by payers to an individual physician or a group of physicians, thereby giving physicians financial responsibility for management of their own budget (Wilton 1998). Budgets therefore encourage economic behaviours and offer incentives for savings. Drug budgets in particular seek to decrease prescribing costs. Budgets vary with respect to the level at which they are set (individual practice or collective budgets), the range of services covered and the intensity of the incentives (rewards or risks).
In general, individual providers or institutions or physician representatives and the payer negotiate a budget, depending on whether the budget is prepared on a practice, group or regional/national level. Payers are represented by a (regional) health authority (e.g. in the UK and Ireland), a social health insurance scheme (e.g. in Germany) or a managed care organisation (e.g. in the USA). Budgets usually are based on previous spending, adjusted to patient mix or a defined target (e.g. average spending on comparable practices; reduction in overall health care spending, as in Italy). Most budgetary interventions were introduced in the early to mid 1990s and have been adapted or abolished over time. Budgets provide incentives to prescribe fewer and less expensive drugs. Physicians can modify drug volume by changing the dosage or duration of treatment. Costs per item can be limited by increasing the use of generics or other less expensive drugs with equivalent effects. Theoretically this approach can slow the uptake of expensive new drugs with marginal benefits.
The intensity of the incentive is modified by several factors, such as the magnitude of the financial risk involved. Incentives can take the form of potential fines (Germany, France) (Mossialos 2005), savings to be used for improvement of medical services as in the UK (Coulter 1993) or Ireland (Walley 2000) or salary bonuses as in Spain or the USA (Antonanzas 2003; Conrad 2004). Incentives seems to be more direct and stronger if applied at an individual level rather than at a group level. Also the effect of incentives may depend on how much the budget level (target) is adapted to provider‐specific circumstances. For instance, in the UK high‐cost patients and in Germany specific drug classes are exempt (Wilton 1998). The amount, type and timing of prescribing information available to budget holders are important for enabling prescribers to react (Schreyögg 2005). Lack of useful information can be an impediment to effective contracting (Wilton 1998). Low perceived financial risk will decrease the strength of the incentive and will vary according to the likelihood that fines are actually executed or whether the results are derived through personal behaviour versus behaviours of a whole group.
Pay for performance interventions
Quality‐based payment systems may take a variety of forms. Most often they are directed at all physician services ‐ not just at prescribing. Targets for these policies include administrative goals, waiting time, patient satisfaction and diagnostic and treatment goals. Prescribing policies include pay for performance and the potential for bonuses or penalties to encourage improvement in prescribing. On the basis of set performance standards, physicians are rewarded or punished for their prescribing (McNamara 2005). Interventions vary greatly in terms of implementation approaches, magnitude of the 'incentives' (e.g. from 2% to 25% of physician total earnings) and whether accompanying interventions are included (O'Malley 2006; Chung 2010a; Serumaga 2011). Pay for performance interventions can include prescribing targets as part of a wider set of performance objectives (e.g. in the UK general practice (Serumaga 2011) and in the Iran rural family physician programme (Takian 2011)) or can be focused on prescribing targets only (Chung 2010a).
Pharmaceutical reimbursement rate reduction
In certain countries (e.g. in East Asia), physicians can directly benefit from prescribing medicines. This is the case when the physician can purchase medicines from wholesalers, prescribe and dispense medicines for patients and then charge payers a higher price (Chu 2008). This practice has been reported in other countries as well, for example, among oncologists in the USA, where 'chemotherapy concessions' were applied (Chu 2008; Chang 2009). Oncologists could profit from prescribing medicines used to treat patients covered under Medicaid. In Taiwan, hospitals have traditionally benefited from using medicines they bought at a lower price from pharmaceutical companies and wholesalers. The tendency has been to transfer part of this benefit to the physicians who contributed to the hospitals' earnings, hence providing a direct financial incentive for overprescribing of medicines with the potential for increasing physician earnings (Chu 2008). Pharmaceutical reimbursement rate reduction policies involve reducing reimbursement rates for physicians, hence reducing the financial benefit they derive from prescribing medicines.
Why it is important to do this review
This review is part of a series of Cochrane reviews of pharmaceutical policies, undertaken to investigate the effects of different categories of pharmaceutical policies on drug and healthcare utilisation, costs and health outcomes. This review focuses on financial policies targeted at prescribers. It updates a previous Cochrane review (Sturm 2007). The conduct of this update was supported by the World Health Organization (WHO) Alliance for Health Policy and Systems Research. The previous version of this Cochrane review included 13 studies of limited quality originating from three high‐income European countries (the UK, Ireland and Germany). No other studies published at that time met the inclusion criteria. Despite limitations, existing evidence suggested that appropriately designed financial incentives may have a positive influence on prescribers' behaviour.
Previously published reviews have focused on individual financial policies, such as fund‐holding and the indicative prescribing scheme in the UK and Ireland (Coulter 1995; Walley 1995; Griffin 1996; Harrison 1996; Schwartz 1996; Gosden 1997; Smith 1998; Garrison 2003) and have included broad reviews of pharmaceutical policies (Soumerai 1993; Bloor 1996; Narine 1997; Armour 2001; Ess 2003; Maynard 2003; Mossialos 2004; Lu 2008; Ostini 2009) and financial incentives (Flodgren 2012). Most of these reviews are not systematic reviews of evidence. Other identified reviews focusing on effects of various financial incentives on general medical practice only occasionally have addressed prescribing or reported drug‐related outcomes (Chaix‐Couturier 2000). Reviews investigating the effects of different remuneration systems for physicians (Bloor 1996; Gosden 1997; Chaix‐Couturier 2000; Giuffrida 2000; Gosden 2001; Maynard 2003) included only one study out of a total of 25 that reported effects on drug utilisation or related costs (excluding immunisation) for renewal of prescriptions. Pay for performance interventions are a relatively new approach, and evaluations are scarce (Giuffrida 2000; Roland 2004; Rosenthal 2004; McNamara 2005; Witter 2012). Although in some countries physicians have gained financial benefits for years from prescribing certain medicines, the impact of reimbursement rate reduction policies on prescribing has not been assessed in previous reviews of pharmaceutical policies.
In recent years, financial incentives have been used more frequently to affect prescriber behaviour, including prescribers in low‐ and middle‐income countries. More robust evaluation studies have assessed such interventions in high‐income countries. This updated review is intended to improve our understanding of interventions and their wanted (and potentially unwanted) consequences. The aims of this review are to support informed decisions about pharmaceutical policies and to guide future evaluations by presenting an up‐to‐date, comprehensive summary of what is known from well‐designed research about the effects on drug use, healthcare utilisation, health outcomes and cost (expenditures) of financial incentives targeted at prescribing.
Objectives
To determine the effects of pharmaceutical policies using financial incentives to influence prescribers' practices on drug use, healthcare utilisation, health outcomes and costs (expenditures).
Methods
Criteria for considering studies for this review
Types of studies
Randomised controlled trials (RCTs), non‐randomised controlled trials (NRCTs), repeated ‐measures (RM) studies, interrupted time series (ITS) analyses and controlled before‐after (CBA) studies.
We used the Cochrane Effective Practice and Organisation of Care (EPOC) definition of RCT, NRCT, CBA and ITS studies (EPOC 2013a). An ITS study is defined as follows: “The study must have a clearly defined time of intervention and must have at least three data points before and three data points after the intervention.” We also considered designs that include a control ITS group. Controlled ITS (CITS) designs are conceptually similar to CBA designs, but the addition of multiple time points before and after the intervention decreases the likelihood of secular change bias.
Types of participants
Healthcare consumers and providers within a large jurisdiction or system of care. Jurisdictions could be regional, national or international. Studies within organisations, such as health maintenance organisations, were included if the organisation was multi‐sited and served a wide population.
Types of interventions
Prescribing policies (financial incentives): policies that intend to affect prescribing by means of financial incentives for prescribers. Included in this category are pharmaceutical budget caps or targets, pay for performance and drug reimbursement rate reductions and other financial policies specifically targeted at prescribing or drug utilisation.
Policies in this review are defined as laws, rules, regulations and financial and administrative orders made or implemented by payers such as national or local governments, non‐government organisations, private or social insurers and insurance‐like organisations.
Types of outcome measures
To be included, a study had to use an objective measure from at least one of the following outcome categories.
Primary outcomes
Drug use (prescribed, dispensed or actually used).
Health outcomes.
Secondary outcomes
Drug costs.
Healthcare utilisation.
Other healthcare costs and policy administration costs.
We used Grades of Recommendation, Assessment, Development and Evaluation (GRADE) worksheets in preparing 'Summary of findings' tables to identify the list of all reported relevant outcomes (within the above four categories of outcomes) (EPOC 2013b). Three review authors (A‐HO, YV and AR) independently assessed the relative importance of each outcome for inclusion in the 'Summary of findings' tables.
Search methods for identification of studies
Electronic searches
We searched the following databases with no language restrictions (Table 3).
1. Databases and websites searched for the first version of this review.
| Databases |
|
| Websites |
|
The Cochrane Central Register of Controlled Trials (CENTRAL) (2014, Issue 12) (including the Cochrane Effective Practice and Organisation of Care (EPOC) Group Specialised Register) (searched 29/01/2015).
MEDLINE In‐Process & Other Non‐Indexed Citations, MEDLINE Daily, MEDLINE and Ovid, OLDMEDLINE, 1946 to present, Ovid SP (searched 29/01/2015).
EMBASE, 1980 to 2015 Week 4, Ovid SP (searched 29/01/2015).
International Network for Rational Use of Drugs (INRUD) Bibliography (searched 29/01/2015).
National Health Service (NHS) Economic Evaluation Database (2014, Issue 4) (searched 29/01/2015).
EconLit, 1969 to present, ProQuest (searched 02/02/2015).
See Appendix 1 for all search strategies run in 2015. Search strategies for the previous version of this review (Sturm 2007) can be found in Appendix 2.
Searching other resources
We also did the following.
Conducted cited reference searches for all included studies in Science Citation Index 1975 to present and Social Sciences Citation Index 1975 to present, Institute for Scientific Information (ISI) Web of Knowledge (searched 10/02/2015).
Screened the reference lists of all relevant reports that we retrieved.
Contacted authors of relevant papers, relevant organisations and authors of discussion lists to identify additional studies, including unpublished and ongoing studies.
Data collection and analysis
Selection of studies
Two review authors independently reviewed all search results, abstracts and reference lists of relevant reports. The full text of potentially relevant reports was retrieved, and two review authors independently assessed the relevance of those studies and the limitations of included studies. One author (A‐HO, YV or HS) extracted data from the included studies in collaboration with one other review author. For all steps in the above process, we resolved disagreements by discussion, if necessary including another review author (AR or ADO).
Data extraction and management
We extracted the following information for each included study:
First author, year of publication, language of publication and study title.
Study design (randomised trial, non‐randomised trial, repeated‐measures study, interrupted time series, controlled before‐after).
Study setting (country, key features of the healthcare system, concurrent pharmaceutical policies).
Characteristics of policies and interventions.
Study duration and period (preintervention, intervention, postintervention).
Characteristics of study participants (consumers, physicians, practices, hospitals, etc.).
Main outcome measures.
Results for main outcome measures.
Sources of data and data collection approaches (routine data, databases, surveys, etc.).
Analytical methods and sample sizes.
We attempted to identify important factors that might be taken into consideration by anyone contemplating implementing any of the policy alternatives, including possible trade‐offs (of expected benefits vs harms and costs), different effects of varying policy conditions and background situations, short‐term versus long‐term effects, limitations of available evidence and other important factors that might affect the translation of available evidence into practice in specific settings. When included studies did not provide detailed information about the implemented policy and interventions, we noted further details of the intervention from excluded studies or from other published literature that gave a more detailed account of the policies and interventions.
Assessment of risk of bias in included studies
At least two review authors (from AR, A‐HO, YV) assessed risk of bias for included studies. We accepted risk of bias assessments of the studies included in the previous version of this review (Sturm 2007). Risk of bias assessments followed the approaches recommended by the EPOC Review Group (GRADE 2004; EPOC 2015; Ramsay 2003) (Appendix 3). Since the time of publication of the previous version of this review, two new criteria had been added to the EPOC risk of bias assessment criteria. Hence two review authors (AR, A‐HO) assessed all previously included studies, and resulting judgements were added to the tables. We recorded potential sources of bias in the included studies and expounded the implication of those biases for reported outcomes.
Assessment of heterogeneity
We noted substantial differences between policies and interventions and the settings of included studies. Even for interventions within a similar category (e.g. budget caps, pay for performance), we observed that the specifications of policies and interventions had major differences, as did measured outcomes. We discerned substantial differences in health system characteristics (e.g. financing mechanisms) that could influence the effects of policies and interventions. Therefore, we did not calculate average effects across studies and did not assess statistical heterogeneity.
Data synthesis
We followed the recommendations of EPOC regarding reanalyses of individual studies and data synthesis. For CBA studies, we reported relative effects. For continuous variables, we reported, when possible, the relative change, adjusted for baseline differences, in outcome measures. For this, we calculated absolute difference‐in‐differences, which we adjusted for the postintervention level in the control group, that is, [(the absolute postintervention difference between intervention and control groups ‐ the absolute preintervention difference between intervention and control groups)/the postintervention level in control groups].
We considered CBA studies for CITS or ITS analyses if adequate data were presented in the paper. If such analyses were conducted, we presented the results as CITS analyses. For CITS, we assessed the time series part of the studies independently from the control part, using the above described criteria for ITS. We assessed the control series part of the study using the CBA criteria above. If the control part had serious limitations, we did not include the study but classified it as an ITS; otherwise we used the control data as a control in the review.
The preferred analysis method for ITS studies was a regression analysis with time trends before and after the intervention, which adjusted for autocorrelation and periodic changes, or ARIMA analysis. We agreed that the results of outcomes should be presented as changes along two dimensions: change in level and change in slope. Change in level is the immediate effect of the policy and is measured as the difference between fitted values for the first postintervention data point (one month after the intervention) minus the predicted outcome one month after the intervention based on the preintervention slope only. We calculated the relative change in level by dividing the change in level by the predicted outcome one month after the intervention based on the preintervention slope only, and then multiplying by 100%.
Change in slope is the change in the trend from preintervention to postintervention that reflects the "long"‐term effect of the intervention. As interpretation of change in slope could be difficult, we chose to calculate and present long‐term effects and relative immediate effects in a similar way. We presented the effects after half a year by determining the difference between the fitted value for the sixth month postintervention data point (half a year after the intervention) and the predicted outcome six months after the intervention based on the preintervention slope only, and then dividing by the predicted outcome six months after the intervention based on the preintervention slope only, and multiplying by 100%. We measured the effects after one year and after two years in a similar way.
Given that policy changes are often announced some months before official implementation, a transition phase is often defined as the six months after the official announcement. If applied, all results excluded data from the transition phase. However, if studies provided only a few data points, if the data itself did not suggest a transition phase and, most important, if study authors did not state a transition phase, we did not apply it. Transition phase was used in two studies included in this review (Harris 1996; Doran 2011).
If papers with ITS design did not provide appropriate analysis or reporting of results, but presented the data points in a scannable graph or in a table, we reanalysed the data using methods described in EPOC 2013c. The following segmented time series regression model was specified: Y(t) = B0 + B1*Pre‐slope + B2*Post‐slope + B3*intervention + e(t) where Y(t) is the outcome in month t. Pre‐slope is a continuous variable indicating time from the start of the study to the last point in the preintervention phase and coded constant thereafter. Post‐slope is coded 0 up to and including the first point post intervention and is coded sequentially from 1 thereafter. Intervention is coded 0 for preintervention time points and 1 for postintervention time points. In this model, B1 estimates the slope of the preintervention data, B2 estimates the slope of the postintervention data and B3 estimates the change in level of outcome as the difference between the estimated first point post intervention and the extrapolated first point post intervention if the preintervention line was continued into the postintervention phase. The difference in slope is calculated by B2 ‐ B1. The error term e(t) was assumed to be first order autoregressive. For CITS studies, we have presented differences between relative changes in the intervention and control groups. We calculated confidence intervals (95%) for all effect measures. If possible, we calculated the effects at three, six, nine, 12 and 24 months after the intervention.
As in the previous version of the review (Sturm 2007), we did not conduct a meta‐analysis, as this was not deemed appropriate. We conducted a structured analysis and presented the findings for each policy. We calculated median effects across policies for similar outcomes when more than two ITS or CITS comparisons were available, and we reported these in the 'Summary of findings' tables. The structured analysis and 'Summary of findings' tables focus mainly on outcomes at 12 months after the intervention.
We used GRADE worksheets to assess the certainty of evidence across studies for each selected outcome. We populated the worksheet for each selected outcome to document study designs of included primary studies; risks of bias of the primary studies; inconsistency, indirectness and imprecision in the findings; and other factors that might influence risks of bias across the included studies for each outcome.We assessed the certainty of evidence for each outcome as high, moderate, low or very low in keeping with GRADE recommendations (EPOC 2013d).
Subgroup analysis and investigation of heterogeneity
We prepared tables for each subcategory of policy interventions and included the following information: study identification, characteristics of the intervention, results of drug use, healthcare utilisation, health outcomes and costs. These tables form the basis for the structured synthesis that we conducted. In Table 4, we described potential mechanisms through which the policies were intended to affect drug use and costs, and we postulated mechanisms for other effects, both intended and unintended. In addition, in Table 5 we briefly listed and described other important policy options for which we included no evaluations.
2. Description of financial incentive policies of the included studies.
| Country | Policy/Time period | Motivation | Setting of budget | Physician incentives | Physician disincentives | Theoretical effects |
| Taiwan | Drug reimbursement rate reduction, starting in 2000 | Reducing prescription costs | Physicians earn a share of the revenue that hospitals gain from selling medicines | Reducing reimbursement rate reduces physicians' tendency to overprescribe | Fincianal incentives from drug sales affect physician prescribing. Removing this incentive will help to rationalise physician prescribing | |
| Taiwan | National Health Insurance Drug Budget Programme, starting in 2002 | Reducing prescription costs | Global budget based on an individual expenditure cap | Maximum expenditure cap | ||
| UK | Pay for performance (quality and outcome framework), starting in 2004 | improving quality of care | NHS committed 1.8 GBP for funding the programme | Up to 25% increase in physician income (maximum of 31,000 GBP) | Direct financial incentives may result in improved quality of care, including prescribing | |
| Sweden | Fixed pharmaceutical budget, 2000 to 2003 | Controlling prescription drug costs | Previous year budget and demographic characteristics of patients | Remaining pharmaceutical budget was given to the health centre and can be used as bonus payment | Health centre had to repay any extra pharmaceutical expenditures | Making the health centres 'residual claimants' (i.e. responsible for deficits or surpluses) will directly affect the physicians prescribing. This may happen via reducing the number of prescriptions, reducing DDD per prescription or selecting cheaper alternative pharmaceuticals |
| Netherlands | Behaviour‐independent financial incentive, 2000 to 2002 | Controlling prescription drug costs | On‐off bonus payment by the insurance company (paid before‐hand, irrespective of physician performance) | The decision to follow the regional formulary was made democratically in the presence of physician representatives and opinion leaders | Ownership of the decision via participation in development of the formulary and the decision to adopt the formulary via the insurance organisation is likely to improve physician performance towards the target behaviour | |
| Germany | Collective drug budget "spending caps" (Health Care Reform Act), 1993 to 2002 (formally abolished in 2001) | Controlling prescription drug costs | Based on previous regional spending. From 1998: regional net budget = gross budget minus co‐payments and rebates from industry nationally set in 1993, then regionally Negotiated between physician associations and statutory health insurances | None (savings will not be available to physicians) | Regional physician associations are responsible for overspending (maximum 5% of total budget). Can decline to pay for excess spending and can request it from individual practice | Reduction in drugs with disputed effect, savings can facilitate use of more expensive drugs, improve quality of prescribing or increase referrals to save (drug budget is independent of other care) |
| Ireland | IDTSS (Indicative Drug Target Savings Scheme), starting in 1993 | Controlling prescription drug costs | Individual practice budget based on previous spending and national average Negotiated by local medical advisor and practice | Savings were divided between GP and health authority | None | Decrease in prescribed drug volume and cost per item; improvement in quality of prescribing |
| UK | Fund‐holding in Great Britain and Scotland: April/1991 to 1997 (announced in 1990) in Wales and Northern Ireland 1993 to 1997 | Controlling prescription drug costs | Based on previous spending of practice adjusted for patient mix and spending of comparators Negotiated by local health authority and practice | Savings can be invested by each fund‐holder to improve services in other budgets, or in the year following the year's drug budget | Responsible for overspending up to a limit of 5000£. Overspending can be covered by other budgets | Decrease in prescribed drug volume and cost per item; improvement in quality of prescribing. Referrals are postponed, as these are also part of a budget |
3. Description of other identified financial incentive policies that did not meet the inclusion criteria.
| Country | Policy | Motivation | Setting of budget | Incentives | Disincentives | Theoretical effects |
| New Zealand | Independent practice associations (IPAs): umbrella organisation of general practitioners (GPs), specialists and other healthcare (HC) providers with different budgets for provided care (1993) | Budgets: to improve quality of care (IPAs: increase power of GPs towards health reforms) | IPA can choose to take a budget for pharmaceutical expenditures. Historical expenditures (changes from fee‐for‐service to Integrated capitation based budgets) Regional health authority (or other payers) and IPA |
Savings can be kept by associations to improve quality of care. Savings can be shifted between budgets | IPA is responsible for overspends, but physicians have refused to take financial responsibility | GPs within association compete for patients |
| USA | Managed care withholdings | Capitation minus, e.g. 20% Primary care group and HMO |
Bonus if practice balance is positive | Only partial withholding is paid in cases of deficit | Keep within the budget | |
| USA | Pharmaceutical capitation | To have health plans control the growth of their own spending by controlling capitation levels | Target drug spending amount for a set of patients (per member per month) based on a base rate, adjusted for case mix; providers negotiate with health pan | Later: Savings will be shared by prescribers | A percentage of the difference between target and actual spending (around 70%) has to be paid by the physician | Prescribe fewer and less expensive drugs, irrespective of the capitation rate |
| UK | Unified budgets for new primary care groups, starting in 1999 | To ensure that accountability of GPs will help solve problems | Budget for hospital care, community health services, prescribing, infrastructure costs; funds allocated by health authority. Compulsory for all GPs | For staff premises and computer costs. GP salary not involved | Increased monitoring needed. As GP budget grows slower than overall budget, incentive to limit spending | |
| Sweden | Regionalisation: responsibility for drug expenditure moved from federal to regional level, starting in 1998 | To increase cost awareness of county councils | Government and county council | Generate savings | 2002 to 2004: Exceeding costs are covered by the government, which compensates county council for up to 75% of overspent costs (ca 9% of budget) | Development of local initiatives promoting economical prescribing (generic prescribing, drug lists. etc.) |
| Italy | Benchmarking 1980; virtual targets ("budget agreements") 1992; guidelines | To contain costs, decrease growth of drug expenditures | Local agreement (local health enterprises responsible for drug budget); GP association and local health enterprises | Regional savings will be distributed in terms of money or other rewards | None applied | Drugs versus overall |
| Spain | Regional target budgets for primary care centres and hospitals, starting in 2000 | To improve efficiency of care | Regional | About 2% of salary is dependent on prescribing targets (Antononaz 2002) | None (national drug budgets are always covered by industry; physicians are paid by salary) | No abuse because of constant monitoring |
| Switzerland | Budget cap plus gate‐keeping | To slow growth of healthcare expenditures | Per capita expenditure caps | Physician manager responsible for keeping the budget within limits by supervising physicians | The insurer is to retain financial responsibility, but penalties would be applied for those exceeding budgets | Efficient provision of care |
| USA/Michigan | Pay for performance 2000 to 2003 | To reduce prescription drug costs | Regional | Small financial incentive of $250 to $500 every 6 months | None | Financial incentive improves targeted behaviours |
| USA/One locality | Physician‐specific pay for performance on top of fee‐for‐service payments, 2005 to 2007 | To improve quality of care | Local | Small financial incentive, maximum of $5000 per year (about 2% of annual salary) | None | Physician designed pay for performance is more likely to improve behaviour than P4Ps designed without the input of physicians |
| UK | Indicative prescribing scheme, 1991 to 1997 | To control prescription drug costs | Based on previous spending practice, negotiated by local medical advisors and statutory health insurances | Savings to be used within health authority and divided by all GPs | None | Decrease in prescribed drug volume and cost per item. Improvement in quality of prescribing |
| USA | Medicare Prescription Drug Improvement and Modernization Act of 2003 | To apply reimbursement rate reduction policy | National | Physicians earn a share of the revenue that hospitals gain by selling medicines | Reducing reimbursement rate reduces physicians' tendency to overprescribe | Fincianal incentives from drug sales affect physician prescribing. Removing this incentive will help to rationalise physician prescribing |
| Literature: New Zealand (Malcolm 1999; Malcolm 2001); USA (Weiner 1990; Jacobson 2006; O'Malley 2006; Rosenthal 2006; Rowe 2006; Trude 2006; Chang 2009; Chung 2010a; Doshi 2010; Elliott 2010; ); UK (Bateman 1996; Whynes 1997b; Ashworth 2004; Klein 2004); Sweden (Calltorp 1996; Calltorp 1999; Lundkvist 2002; Ohlsson 2007; Andersson 2009); Italy (Fattore 1998; Atella 2000; Mapelli 2003); Spain (Lopez Bastida 2000; Antonanzas 2003); Switzerland (Etter 1998) | ||||||
Results
Description of studies
Results of the search
The search in 2015 yielded 8388 records. We excluded 7191 records upon review of the titles. We screened the remaining 1197 records by reviewing abstracts, assessed 56 full‐text papers and included six studies. Thirteen studies were previously included (Sturm 2007), one of which was excluded for this update because outcomes were irrelevant. Studies included in the review now total 18. See Figure 1 for additional details.
1.
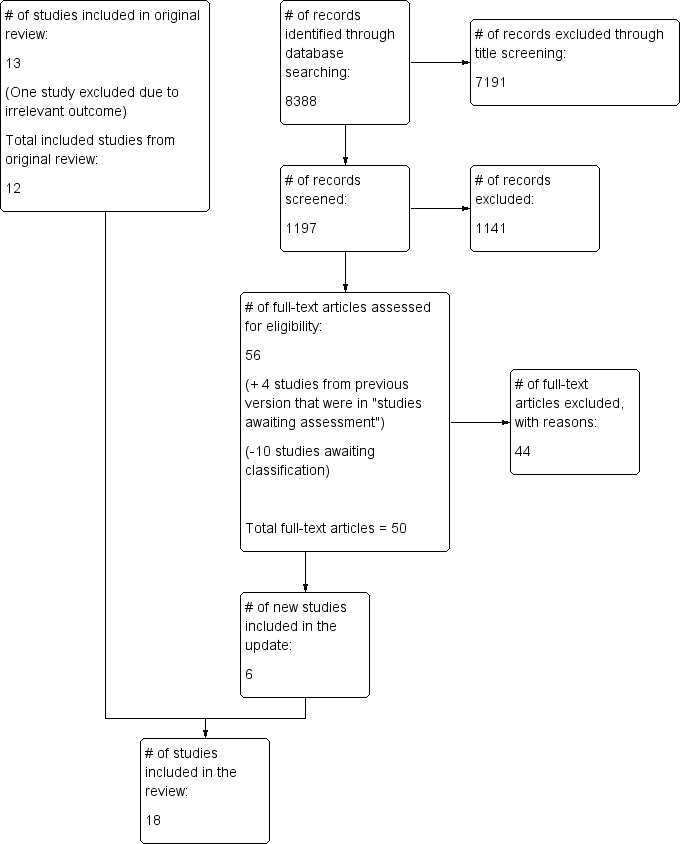
Study flow diagram.
Included studies
In total, we included 18 studies in this review, consisting of studies on pharmaceutical budget, pay for performance and drug reimbursement rate reduction policies. Thirteen studies (16 papers) had been included in the previous version of the review (Sturm 2005), of which one study was excluded from the current review. We excluded the Kammerling 1996 study, as it did not include specific prescribing outcome measures, and because it was difficult to argue that changes in reported outcomes were the result of financial incentives for prescribing.
Nine included studies assessed the effects of British fund‐holding (Burr 1992; Bradlow 1993; Wilson 1995; Harris 1996; Baines 1997c; Corney 1997; Rafferty 1997; Whynes 1997; Wilson 1999), one study analysed the effects of the indicative prescribing scheme in Ireland (Walley 2000) and two studies reported on drug expenditure budgets in Germany (Guether 1995; Schöffski 1997). Three studies were reported in more than one paper (Bradlow 1993; Wilson 1995; Schöffski 1997). The update resulted in the inclusion of six additional studies. Three studies assessed pay for performance and target payments in the UK and the Netherlands (Martens 2007; Doran 2011; Serumaga 2011), two studies assessed different forms of pharmaceutical budgets in Sweden and Taiwan (Granlund 2006; Chou 2008) and one study assessed the effects of changing providers' benefit margin for dispensing of medicines in Taiwan (Chu 2008). None of the included studies were RCTs, CCTs or RM studies. We included three CITS analyses (Wilson 1995; Harris 1996; Rafferty 1997), six ITS studies (Guether 1995; Schöffski 1997; Walley 2000; Chou 2008; Doran 2011; Serumaga 2011) and nine CBA studies (Burr 1992; Bradlow 1993; Baines 1997c; Corney 1997; Whynes 1997; Wilson 1999; Granlund 2006; Martens 2007; Chu 2008; ). See Characteristics of included studies table for further details.
Excluded studies
The Characteristics of excluded studies table provides reasons for exclusion of studies for which it is plausible to expect that a reader would question why the study was not included. The main reason for excluding these studies was the study design (37 studies), for example, lack of a control group (in a before‐after study). Other reasons for exclusion include an intervention that did not provide financial incentives for prescribers (13 studies), confounding (five studies), lack of reporting of a relevant outcome (four studies), lack of reporting of a primary study (three studies) and insufficient data (two studies).
Risk of bias in included studies
See Characteristics of included studies, Table 6, Table 7, Appendix 3, Appendix 4 and Appendix 5.
4. Risk of bias in CBA studies.
| Bias/Study |
Bradlow 1993 |
Burr 1992 |
Whynes 1997 |
Wilson 1999 |
Baines 1997 |
Corney 1997 |
Martens 2007 |
Granlund 2006 |
Chu 2008 |
| Was the allocation sequence adequately generated? | No | No | No | No | No | No | No | No | No |
| Was the allocation adequately concealed? | No | No | No | No | No | No | No | No | No |
| Were baseline outcome measurements similar? | Yes | Yes | Yes | Yes | Yes | Yes | Yes | Yes | Yes |
| Were baseline characteristics similar? | No | No | No | No | No | No | Yes | Yes | No |
| Were incomplete outcome data adequately addressed? | Yes | Yes | Unclear | Unclear | Unclear | No | Yes | Unclear | Yes |
| Was knowledge of the allocated interventions adequately prevented during the study? | Yes | Yes | Yes | Yes | Yes | Yes | Yes | Yes | Unclear |
| Was the study adequately protected against contamination? | Yes | Yes | Yes | Yes | Yes | Yes | Yes | Yes | Yes |
| Was the study free of selective outcome reporting? | Yes | Unclear | Yes | Yes | Unclear | Unclear | Yes | Yes | Yes |
| Was the study free of other risks of bias? | Unclear | Unclear | Unclear | Unclear | Unclear | Unclear | Unclear | Unclear | No |
5. Risk of bias in interrupted time series (ITS) studies.
| Bias/Study |
Walley 2000 |
Gouether 1995 |
Schoffski 1997 |
Harris 1996 |
Wilson 1995 |
Raferty 1997 |
Doran 2011 |
Serumaga 2011 |
Chou 2008 |
| Was the intervention independent of other changes? | No | No | No | No | No | No | Yes | Yes | Unclear |
| Was the shape of the intervention effect prespecified? | Yes | Yes | Yes | Yes | Yes | Yes | Unclear | Yes | No |
| Was the intervention unlikely to affect data collection? | Yes | Yes | Yes | Yes | Yes | Yes | Yes | Yes | Yes |
| Was knowledge of the allocated interventions adequately prevented during the study? | Yes | Yes | Yes | Yes | Yes | Yes | Yes | Yes | Unclear |
| Were incomplete outcome data adequately addressed? | Unclear | Unclear | No | Unclear | Yes | Unclear | No | Unclear | No |
| Was the study free of selective outcome reporting? | Yes | Yes | Yes | Yes | Yes | Yes | Yes | Unclear | Yes |
| Was the study free of other risks of bias? | Unclear | Yes | Unclear | No | No | No | Unclear | Unclear | Unclear |
We assessed all CBA studies as having serious limitations due to marked differences between experimental and control groups (selection bias). More important, it must be noted that for CBA studies that assessed the British fund‐holding policy, intervention group members had voluntarily joined the policy. We assessed three studies (Wilson 1995; Harris 1996; Rafferty 1997) as having some limitations, as they were CBA studies that had been reanalysed as CITS studies.
One ITS study assessed a pharmaceutical budget policy in Ireland (Walley 2000). We rated the quality as having some limitations. We included two ITS studies that evaluated German drug budgets. Drug volume was assessed by one (Guether 1995), and referrals by two (Guether 1995; Schöffski 1997). These findings had some limitations, as data were presented quarterly rather than monthly, time series included too few data points (Guether 1995) or limitations were the result of incomplete data (Schöffski 1997). In Guether 1995, data were reported with a "quasi control group" (prescriptions for privately insured patients not subject to budgets as opposed to socially insured), but investigators found the groups to be too different to be used as reliable comparators; therefore only ITS data of the intervention group were used in the analysis. Two ITS studies assessed the pay for performance policy in the UK (Doran 2011; Serumaga 2011). We determined that Doran 2011 had some limitations, as it provided few data points for analysis. Another ITS study (Chou 2008) assessed a pharmaceutical budget policy in Taiwan and provided quarterly data points; we assessed this study as having some limitations.
Most of the included studies did not provide adequate information about simultaneous confounding interventions that might have been introduced during the study period, or about important economic or other changes that might have affected the findings (e.g. see Healey 1994 as an example of how self selection among fund‐holding practices in the UK might have affected observed outcomes of the policy).
Effects of interventions
Summary of findings for the main comparison. Summary of findings: drug budget policies.
|
People: Physicians/General practitioners/Patients Settings (interventions): Germany (collective drug budget "spending caps"), Ireland (Indicative Drug Target Savings Scheme), Sweden (fixed pharmaceutical budget), Taiwan (National Health Insurance Drug Budget Programme), UK (fund‐holding) Designs: ITS and CITS Comparison: no prescribing policies | |||||
|
Outcomes 12‐month follow‐up |
Impacts ‐ relative changes, Median (range)a |
Number of studies (comparisons) |
Settings |
Certainty of the evidenceb (GRADE)c |
Comments |
| Drug use (item per patient or prescription) | ‐2.8% (‐28.9 to 1.5) | 6 (14) | Germany, Ireland, Taiwand, UK | Low | It is possible that the intervention results in modest improvements (reductions in items per patient). Findings were relatively consistent in different countries despite differences between interventions |
| Drug use (generic percentage) | 15% (‐43.7 to 190.5) | 2 (6) | UK | Very low | |
| Costs per item | ‐25.6% (‐49.2 to 0.6) |
3 (6) | Ireland, UK | Very low | |
| Costs per patient or prescription | ‐2.5% (‐79.7 to 66.8) |
4 (11) | Taiwand, UK | Very low | |
| Total costs | ‐38.9% (‐69.6 to ‐1.8) |
2 (4) | Ireland, UK | Very low | Although the findings from 2 countries are consistent, both studies suffer from too few data points |
| Healthcare utilisation (referral to outpatient specialists) | ‐1.1% (‐15.4 to 13.2) |
2 (2) | Germany | Very low | |
| Health outcomes | ‐ | 0 | ‐ | ‐ | ‐ |
|
aNote: Presented results are medians (ranges) of results of individual studies; no meta‐analyses were performed. bAll included ITS studies suffer from too few data points. | |||||
|
cGRADE Working Group grades of evidence. High: It is very likely that the effect will be close to what was found in the research. Moderate: It is likely that the effect will be close to what was found in the research, but it may be substantially different. Low: It is likely that the effect will be substantially different from what was found in the research, but the research provides an indication of what might be expected. Very low: The anticipated effect is very uncertain, and the research does not provide a reliable indication of what might be expected. | |||||
| dFrom Taiwan, only 1 estimate was used in calculating the median, as 2 available estimates were based on 1 intervention assessed in the study. | |||||
CITS: controlled interrupted time series; ITS: interrupted time series.
Summary of findings 2. Summary of findings: pay for performance policies.
|
People: Physicians/General practitioners/Patients Settings (interventions): UK (pay for performance) Designs: ITS and CITS Comparison: no prescribing policies | |||||
|
Outcomes 12‐month follow‐up |
Impacts ‐ relative changes |
Number of studies (comparisons) |
Setting |
Certainty of the evidence (GRADE)a |
Comments |
| Drug use | Range 2.5 to 2.6 | 1 (2) | UK | Very low | Some negative impact was reported on non‐incentivised non‐prescribing outcomes |
| Costs | ‐ | 0 | ‐ | ‐ | |
| Healthcare utilisation | ‐ | 0 | ‐ | ‐ | |
| Health outcomes | Mean ‐1.49% (95% CI ‐6.32 to 3.34) | 1 (1) | UK | Very low | 1 comparison (percentage of patients with controlled blood pressure) from 1 setting |
|
aGRADE Working Group grades of evidence. High: It is very likely that the effect will be close to what was found in the research. Moderate: It is likely that the effect will be close to what was found in the research, but it may be substantially different. Low: It is likely that the effect will be substantially different from what was found in the research, but the research provides an indication of what might be expected. Very low: The anticipated effect is very uncertain, and the research does not provide a reliable indication of what might be expected. | |||||
We described in Table 4 the settings and policies of the included studies. Here we described in further detail the pharmaceutical policies assessed in the included studies together with the main findings.
Characteristics of pharmaceutical budget policies
Although budgetary policies were applied in at least 10 countries (see Table 5; see also Garrison 2003 and Mossalios 2005 for further examples in Europe), we could include evaluation studies from only five countries (Germany, Ireland, Sweden, Taiwan and the UK).
UK fundholding
Fund‐holding for general practitioners (GPs) in the UK was introduced with the first wave of voluntary practices in the early 1990s. Each year, practices with at least 11,000 registered patients could join the fund‐holding scheme in "waves", until in 1997, healthcare trusts were introduced. With each wave, regulations on requisites for joining practices were relaxed. The aim of fund‐holding was to increase efficiency of care by giving GPs financial control over some of their provided services (Weiner 1990; Glynn 1992; Wilson 1995; Audit Comm. 1996). Besides costs of prescribed drugs, separate budgets covered practice staff and a range of secondary care services such as specialist services and elective surgical services, with the drug budget offering the greatest savings potential (Harris 1996). Overspending in one budget had to be covered by funds from another budget, and savings could be used in other areas of patient care (Coulter 1993). Budgets were set on the basis of previous expenditures and at the discretion of the local health authority medical advisor. Therefore budgets varied substantially from practice to practice (Day 1991). Concurrently all practices, fund‐holders and non‐fund‐holders alike were exposed to practice level feedback on their own performance in comparison with others (benchmarking), as well as to regular visits of independent pharmaceutical advisors from the local health authority. Initiatives to reduce costs of individual prescriptions such as use of limited lists and promotion of generics were launched (Baines 1997c).
Irish indicative drug budget
In 1993 in Ireland, a comparable scheme called the Indicative Drug Targeting Savings Scheme (IDTSS) was introduced (Walley 2000). Individual indicative or hypothetical budgets of GPs covered prescribing and associated costs and were calculated on the basis of previous spending and the national average. Savings were split between the GP and the local health authority for use in the development of services. No penalties were imposed for overspending.
German drug budget
Collective budgets for drug expenditures for physicians in private practice in Germany were in use from 1993 to 2002 with the stated goal to maximise effectiveness by using less costly and more effective drugs. It was expected that although generic use would increase, use of drugs with disputed effects would decrease (Gross 1994; Busse 1996; Schwartz 1996; Schwermann 2003; Schreyögg 2005). Although spending caps were regionally negotiated or nationally set each year and made all physicians in private practice in one region collectively liable, target volumes for each individual practice were only theoretically established. From 2002, budgets were abolished and were replaced by practice level target volumes (negotiated between the physician association and insurers). Parallel to initiation of budgets, reference pricing, changing levels of co‐payment and price cuts for pharmaceuticals were introduced.
Taiwan pharmaceutical budget
Before 2002, Taiwan's National Health Insurance paid providers on a fee‐for‐service basis, and patients were free to choose among providers. Concerns surrounded increases in costs and subsequent increases in insurance premiums. The global budget was implemented by hospitals in 2002, and it involved an expenditure cap. The cap was determined before each fiscal year. As a result, if providers delivered more services, their profit would be reduced. The global budget was later expanded to include hospital‐specific targets such as prescription caps (Chou 2008).
Sweden pharmaceutical budget
Since 1998, the county councils in Sweden have been responsible for pharmaceutical costs not covered by patient co‐payments. Hence they have been investigating routes to contain pharmaceutical costs. The approach involved a local county council's policy of imposing a fixed pharmaceutical budget on the health centres, which were expected to cover any pharmaceutical budget deficits and were allowed to keep any surplus generated each fiscal year (Granlund 2006).
Effects of pharmaceutical budget policies
Drug use
Twelve studies (six ITS or CITS studies and six CBA studies) assessed the effects of pharmaceutical budget interventions on drug use in five countries (Table 8).
6. Effect of drug budgetary policies on drug use.
| Intervention | Outcome | Study ID | Setting | Type of Study | |||||
| UK fund ‐holding | Items per patient | Adjusted absolute change | Adjusted relative change 3 months | Adjusted relative change 6 months | Adjusted relative change 12 months | Adjusted relative change 24 months | |||
| Burr 1992 | Wave 1 | CBA | 18 | ‐ | ‐ | 0.8 | ‐ | ||
| Bradlow 1993 | Wave 1 | CBA | 40 | ‐ | ‐ | 1.8 | ‐ | ||
| Bradlow 1993 | Wave 1 | CBA | ‐ | ‐ | ‐ | ‐ | 3.6**/**** | ||
| Wilson 1999 | Wave 3/4 | CBA | ‐ | ‐ | ‐ | ‐ | 39.2*** | ||
| Whynes 1997 | Wave 4 | CBA | ‐ | ‐ | ‐ | ‐1.2 | ‐ | ||
| Items per patient | Absolute level effect (95% CI) | Relative change 3 months (95% CI) | Relative change 6 months (95% CI) | Relative change 12 months (95% CI) | Relative change 24 months (95% CI) | ||||
| Rafferty 1997 | Wave 1 | CITS | ‐63.6 (‐249.3 to 122.1) | ‐2.5 (‐9.8 to 4.9) | ‐1 (‐8.8 to 6.8) | ‐2.8 (‐11.5 to 5.9) | 0.2 (‐10.3 to 10.7) | ||
| Harris 1996 | Wave 1 | CITS | 0.4 (‐1.1 to 1.8) | 0.4 (‐1.2 to 2) | 0.7 (‐1.3 to 2.7) | 1.4 (‐1.5 to 4.2) | 2.6 (‐2.1 to 7.2) | ||
| Wilson 1995 | Wave 1 | CITS | 1.4 (‐6.6 to 9.4) | 1.9 (‐9.3 to 13.1) | ‐4.1 (4.3 to ‐4) | ‐10.2 (‐10.4 to ‐10) | ‐ | ||
| Rafferty 1997 | Wave 2 | CITS | ‐43.6 (‐257 to 169.8) | ‐1.6 (‐9.2 to 6) | ‐2.4 (‐10.3 to 5.5) | ‐3.6 (‐12.1 to 4.8) | ‐4.2 (‐13.7 to 5.4) | ||
| Rafferty 1997 | Wave 3 | CITS | ‐44.3 (‐280.1 to 191.4) | ‐1.4 (‐9.9 to 7) | 1.5 (‐7.2 to 10.1) | 1.5 (‐7.5 to 10.5) | ‐ | ||
| Wilson 1995 | Wave 2 | CITS | 2.7 (‐9.5 to 14.9) | 7.1 (‐25.1 to 39.2) | ‐15.8 (‐16.1 to ‐15.5) | ‐14.5 (‐15.2 to ‐13.9) | ‐ | ||
| Wilson 1995 | Wave 3 | CITS | 4.8 (‐4.8 to 14.4) | 16.8 (‐17.1 to 50.8) | ‐21.3 (‐21.6 to ‐20.9) | ‐28.9 (‐29.4 to ‐28.3) | ‐ | ||
| Harris 1996 | Wave 2 | CITS | ‐0.5 (‐1.3 to 0.3) | ‐0.5 (‐1.3 to 0.3) | ‐0.4 (‐1.3 to 0.5) | ‐0.3 (‐1.4 to 0.8) | ‐0.1 (‐1.7 to 1.5) | ||
| Harris 1996 | Wave 3 | CITS | 0.0 (‐0.7 to 0.7) | 0.0 (‐0.8 to 0.8) | 0.0 (‐0.8 to 0.9) | 0.2 (‐0.7 to 1.2) | 0.4 (‐0.7 to 1.6) | ||
| Harris 1996 | Wave 4 | CITS | 0.3 (‐0.4 to 1) | 0.3 (‐0.4 to 1.1) | 0.1 (‐0.6 to 0.9) | ‐0.4 (‐1.2 to 0.5) | ‐ | ||
| Harris 1996 | Wave 5 | CITS | ‐0.2 (‐1 to 0.5) | ‐0.2 (‐1 to 0.5) | ‐0.2 (‐1 to 0.6) | ‐ | ‐ | ||
| Generic percentage | Adjusted absolute change | Adjusted relative change 3 months | Adjusted relative change 6 months | Adjusted relative change 12 months | Adjusted relative change 24 months | ||||
| Bradlow 1993 | Wave 1 | CBA | 4.1 | ‐ | ‐ | 8.8 | ‐ | ||
| Bradlow 1993 | Wave 1 | CBA | ‐ | ‐ | ‐ | ‐ | 17.2**/**** | ||
| Baines 1997 | Waves 1 to 3, Lincolns | CBA | ‐ | ‐ | ‐ | ‐ | 10.7** | ||
| Baines 1997 | Waves 1 to 3, Devon | CBA | ‐ | ‐ | ‐ | ‐ | 9.5** | ||
| Whynes 1997 | Wave 4 | CBA | 3.5 | ‐ | ‐ | ‐ | ‐ | ||
| Wilson 1999* | Wave 3/4 | CBA | ‐ | ‐ | ‐ | ‐ | 4*** | ||
| Generic percentage | Absolute level effect (95% CI) | Relative change 3 months (95% CI) | Relative change 6 months (95% CI) | Relative change 12 months (95% CI) | Relative change 24 months (95% CI) | ||||
| Rafferty 1997 | Wave 1 | CITS | 2.8 (1.5 to 4.1) | 10.8 (5.6 to 16) | 12.7 (7.1 to 18.2) | 15.8 (9.4 to 22.2) | 23 (15 to 31) | ||
| Wilson 1995 | Wave 1 | CITS | 1.7 (0.8 to 2.7) | 345.7 (151.8 to 539.6) | 342.7 (341.1 to 344.4) | 190.5 (189 to 192) | ‐ | ||
| Rafferty 1997 | Wave 2 | CITS | 1.3 (‐0.2 to 2.9) | 5.1 (‐0.9 to 11.1) | 5.9 (‐0.4 to 12.2) | 8.5 (1.6 to 15.5) | 13.6 (5.4 to 21.7) | ||
| Rafferty 1997 | Wave 3 | CITS | 0.5 (‐1 to 1.9) | 1.8 (‐3.9 to 7.4) | 5.7 (‐0.1 to 11.5) | 14.2 (8.1 to 20.4) | ‐ | ||
| Wilson 1995 | Wave 2 | CITS | 1.0 (‐0.1 to 2.1) | 45.4 (‐2.4 to 93.2) | 66.5 (66.1 to 66.8) | 68.1 (67.6 to 68.7) | ‐ | ||
| Wilson 1995 | Wave 3 | CITS | 1.9 (0.8 to 3) | 35.5 (15.1 to 55.9) | ‐12.2 (‐12.4 to ‐12.1) | ‐43.7 (‐43.5 to ‐44.0) | ‐ | ||
| All antiulcer drugs (DDD) | Adjusted absolute change | Adjusted relative change 3 months | Adjusted relative change 6 months | Adjusted relative change 12 months | Adjusted relative change 24 months | ||||
| Wilson 1999 | Wave 3/4 | CBA | ‐ | ‐ | ‐ | ‐ | ‐6.7*** | ||
| Percentage PPI of all antiulcer drugs (DDD) | Adjusted absolute change | Adjusted relative change 3 months | Adjusted relative change 6 months | Adjusted relative change 12 months | Adjusted relative change 24 months | ||||
| Wilson 1999 | Wave 3/4 | CBA | ‐ | ‐ | ‐ | ‐ | ‐7.9*** | ||
| All antidepressant drugs (DDD) | Adjusted absolute change | Adjusted relative change 3 months | Adjusted relative change 6 months | Adjusted relative change 12 months | Adjusted relative change 24 months | ||||
| Wilson 1999 | Wave 3/4 | CBA | ‐ | ‐ | ‐ | ‐ | ‐7.9*** | ||
| Percentage SSRIs of all antidepressant drugs (DDD) | Adjusted absolute change | Adjusted relative change 3 months | Adjusted relative change 6 months | Adjusted relative change 12 months | Adjusted relative change 24 months | ||||
| Wilson 1999 | Wave 3/4 | CBA | ‐ | ‐ | ‐ | ‐ | ‐0.8*** | ||
| Ireland indicative drug budgets | Items per patient | Absolute level effect (95% CI) | Relative change 3 months (95% CI) | Relative change 6 months (95% CI) | Relative change 12 months (95% CI) | Relative change 24 months (95% CI) | |||
| Walley 2000 | IDTSS | ITS | ‐0.8 (‐1.4 to ‐0.2) |
‐ | ‐ | ‐8.2 (‐14.4 to ‐2.0) |
‐10.1 (‐17.5 to ‐2.7) |
||
| German drug budget | Items per patient | Absolute level effect (95% CI) | Relative change 3 months (95% CI) | Relative change 6 months (95% CI) | Relative change 12 months (95% CI) | Relative change 24 months (95% CI) | |||
| Guether 1995 | Social insurance | ITS | ‐34,552 (‐99,896 to 30,791) | ‐11.2 (‐32.3 to 10.0) | ‐12.1 (‐37.8 to 13.7) | ‐13.4 (‐48.9 to 22.1) | ‐ | ||
| Taiwan National Health Insurance (NHI) Drug Budget Programme | Items per prescription | Absolute level effect (95% CI) | Relative change 3 months (95% CI) | Relative change 6 months (95% CI) | Relative change 12 months (95% CI) | Relative change 24 months (95% CI) | |||
| Chou 2008 (for hypertension) |
NHI | ITS | 0.000 (‐0.001 to 0.014) | ‐0.01 (‐0.05 to 0.03)º | ‐ 0.01 (‐0.06 to 0.03) º | ‐0.01 (‐0.06 to 0.04) | ‐0.01 (‐0.08 to 0.06) | ||
| Chou 2008 (for diabetes) | NHI | ITS | ‐0.01 (‐0.02 to ‐0.005) | ‐0.02 (‐0.04 to 0.04) º º | ‐0.01 (‐0.05 to 0.03) º º | ‐0.02 (‐0.05 to 0.03) | ‐0.06 (‐0.13 to 0.006) | ||
| Sweden fixed budgets for pharmaceutical expenditures | Prescription per patient | Adjusted absolute change | Adjusted relative change 3 months | Adjusted relative change 6 months | Adjusted relative change 12 months | Adjusted relative change 24 months | |||
| Granlund 2006 | Sweden, Burtrask | CBA | ‐0.03 | ‐ | ‐ | ‐ | ‐0.05 º º º | ||
| Granlund 2006 | Sweden, Morobacke | CBA | 0.39 | ‐ | ‐ | 0.70 | ‐ | ||
| DDDs per prescription | Adjusted absolute change | Adjusted relative change 3 months | Adjusted relative change 6 months | Adjusted relative change 12 months | Adjusted relative change 24 months | ||||
| Granlund 2006 | Sweden, Burtrask | CBA | ‐2.35 | ‐ | ‐ | ‐ | ‐0.055 º º º | ||
| Granlund 2006 | Sweden, Morobacke | CBA | 2.12 | ‐ | ‐ | 0.05 | ‐ | ||
| *Median. **3‐year f/u. ***Combined wave 4: 1‐year f/u; wave 3: 2‐year f/u. ****Data from Stewart‐Brown 1995. º Data were available for 4 months after the intervention. º º Data were available for 8 months after the intervention. º º º Data were available for 20 months after the intervention. CBA: controlled before‐after; CITS: controlled interrupted time series; DDD: defined daily doses; IDTSS: Indicative Drug Target Savings Scheme; ITS: interrupted time series. | |||||||||
Drug use per patient or prescription
Seven studies reported effects of different waves of British fund‐holding in the UK (Burr 1992; Bradlow 1993; Wilson 1995; Harris 1996; Rafferty 1997; Whynes 1997; Wilson 1999). In CITS studies (median effect at 12 months ‐1.5%, range ‐28.9% to +1.5%) and in CBA studies (median effect at 12 months 0.8%, range ‐1.2% to +1.8%), a relative reduction in prescribed drugs among fund‐holders compared with controls was observed. The effect seemed to decrease with later waves of fund‐holding. One ITS study of the Irish Indicative Drug Target Savings Scheme observed a relative reduction in the number of prescribed items over follow‐up periods of one year (‐8.2%) and two years (‐10.1%) (Walley 2000). Another ITS study of the German drug budget (Guether 1995) observed that the overall number of prescriptions decreased from ‐11.2% at three months to ‐13.4% at 12 months. A further ITS study assessed the effects of the Taiwan National Health Insurance drug budget programme (Chou 2008), and found negligible reductions in drug use. Similarly, a CBA study of Sweden fixed budgets for pharmaceutical expenditures observed small reductions or increases in overall prescriptions (Granlund 2006).
Findings of six ITS and CITS studies suggest that pharmaceutical budgets might result in a modest reduction in overall drug use (median relative change ‐2.8%), although the effect is uncertain, given the limitations of the included studies (Table 1).
Generic percentage
Six studies reported on the effects of UK fund‐holding on generic prescribing. The effect on generic drug use was most consistent across waves and follow‐up periods: All results reported in the studies almost uniformly showed a greater increase in use of generic drugs among fund‐holders. CITS studies suggest a median of +15.0% (range ‐43.7% to 190.5%) at 12 months and +18.3% (13.6% to 23.0%) at 24 months (Rafferty 1997; Wilson 1995). Effects of CBA studies ranged between 4.0% and 17.2% (median 10.1%) at 24 months (Bradlow 1993; Baines 1997c; Wilson 1999).
Drug cost
Twelve studies (five ITS or CITS studies and seven CBA studies) assessed the effects of pharmaceutical budget interventions on drug expenditures in four countries (Table 9).
7. Effect of drug budgetary policies on drug expenditures.
| Intervention | Outcome | Study ID | Setting | Type of study | |||||
| UK fund‐holding | Costs per item | Adjusted absolute change | Adjusted relative change 3 months | Adjusted relative change 6 months | Adjusted relative change 12 months | Adjusted relative change 24 months | |||
| Bradlow 1993 | Wave 1 | CBA | ‐0.5 | ‐ | ‐ | ‐6.3 | |||
| Bradlow 1993 | Wave 1 | CBA | ‐ | ‐ | ‐ | ‐ | ‐5.2*/*** | ||
| Rafferty 1997 | Wave 3 | CBA | ‐0.5 | ‐ | ‐ | ‐5.3 | n.a. | ||
| Wilson 1999 | Wave 3/4 | CBA | ‐ | ‐ | ‐ | ‐ | ‐2.8** | ||
| Costs per item | Absolute level effect (95% CI) | Relative change 3 months (95% CI) | Relative change 6 months (95% CI) | Relative change 12 months (95% CI) | Relative change 24 months (95% CI) | ||||
| Rafferty 1997 | Wave 1 | CITS | ‐0.4 (‐0.8 to 0) | ‐4.9 (‐10.1 to 0.4) | ‐5.8 (‐11,3 to ‐0,3) | ‐7 (‐13 to ‐1) | ‐9.2 (‐16.1 to ‐2.3) | ||
| Wilson 1995 | Wave 1 | CITS | ‐0.2 (‐0.3 to ‐0.1) | ‐31.4 (‐50 to ‐13.1) | ‐41.6 (‐41.8 to ‐41.4) | ‐47.8 (‐48.2 to ‐47.5) | ‐ | ||
| Rafferty 1997 | Wave 2 | CITS | ‐0.3 (‐0.8 to 0.2) | ‐3.5 (‐9.2 to 2.2) | ‐4.2 (‐10.1 to 1.6) | ‐6.2 (‐12.4 to 0) | ‐9.8 (‐16.7 to ‐3) | ||
| Wilson 1995 | Wave 2 | CITS | ‐0.2 (‐0.4 to ‐0) | ‐36.9 (‐71.1 to ‐2.7) | ‐45.1 (‐45.5 to ‐44.7) | ‐49.2 (‐49.9 to 48.5) | ‐ | ||
| Wilson 1995 | Wave 3 | CITS | ‐0.3 (‐0.5 to ‐0.1) | ‐99.6 (‐157.4 to ‐41.8) | ‐85.3 (‐86 to ‐84.6) | ‐44.3 (‐45.7 to 42.9) | ‐ | ||
| Costs per item (PPIs) | Adjusted relative change 24 months | Adjusted absolute change | Adjusted relative change 3 months | Adjusted relative change 6 months | Adjusted relative change 12 months | Adjusted relative change 24 months | |||
| Wilson 1999 | Wave 3/4 | CBA | ‐ | ‐ | ‐ | ‐ | ‐1** | ||
| Costs per item (SSRIs) | Adjusted relative change 24 months | Adjusted absolute change | Adjusted relative change 3 months | Adjusted relative change 6 months | Adjusted relative change 12 months | Adjusted relative change 24 months | |||
| Wilson 1999 | Wave 3/4 | CBA | ‐ | ‐ | ‐ | ‐1.9 | ‐2.7** | ||
| Costs per patient | Adjusted relative change 24 months | Adjusted absolute change | Adjusted relative change 3 months | Adjusted relative change 6 months | Adjusted relative change 12 months | Adjusted relative change 24 months | |||
| Burr 1992 | Wave 1 | CBA | ‐0.6 | ‐ | ‐ | ‐4.5 | ‐ | ||
| Bradlow 1993 | Wave 1 | CBA | ‐0.8 | ‐ | ‐ | ‐4.6 | ‐ | ||
| Bradlow 1993 | Wave 1 | CBA | ‐1.1 | ‐ | ‐ | ‐6.2 | 0.4*/*** | ||
| Baines 1997 | Wave 1‐3, Lincolns | CBA | ‐ | ‐ | ‐ | ‐ | ‐18.5* | ||
| Baines 1997 | Wave 1‐3, Devon | CBA | ‐ | ‐ | ‐ | ‐ | ‐16.4* | ||
| Whynes 1997 | Wave 4 | CBA | ‐0.7 | ‐ | ‐ | ‐ | ‐ | ||
| Corney 1997 | Wave 2 | CBA | 0.2 | ‐ | ‐ | 0.5 | ‐4.8 | ||
| Costs per patient | Absolute level effect (95% CI) | Relative change 3 months (95% CI) | Relative change 6 months (95% CI) | Relative change 12 months (95% CI) | Relative change 24 months (95% CI) | ||||
| Rafferty 1997 | Wave 1 | CITS | ‐922.7 (‐2045.8 to 200.4) | ‐4.9 (‐10.8 to 1.1) | ‐4 (‐10.2 to 2.3) | ‐7.3 (‐14.2 to ‐0.4) | ‐9.1 (‐17.1 to ‐1.1) | ||
| Wilson 1995 | Wave 1 | CITS | ‐0 (‐0.1 to 0.1) | ‐6 (‐26.5 to 14.6) | 6.7 (6.5 to 6.9) | 1 (0.6 to 1.3) | ‐ | ||
| Harris 1996 | Wave 1 | CITS | ‐1.2 (‐3 to 0.7) | ‐1.2 (‐3.1 to 0.7) | ‐0.8 (‐3.3 to 1.7) | 0.1 (‐4 to 4.2) | 2 (‐5.9 to 10) | ||
| Rafferty 1997 | Wave 2 | CITS | ‐566.6 (‐1594.6 to 461.4) | ‐2.6 (‐7.3 to 2) | ‐3.4 (‐8.2 to 1.4) | ‐6.7 (‐11.7 to ‐1.6) | ‐11 (‐16.5 to ‐5.5) | ||
| Rafferty 1997 | Wave 3 | CITS | ‐192.6 (‐1482.6 to 1097.5) | ‐0.6 (‐6 to 4.9) | ‐2.3 (‐7.9 to 3.3) | ‐5.6 (‐11.3 to 0.2) | ‐ | ||
| Wilson 1995 | Wave 2 | CITS | ‐0.1 (‐0.2 to ‐0) | ‐166.8 (‐306.9 to ‐26.5) | 128.6 (127.9 to 129.4) | 66.8 (65.6 to 67.9) | ‐ | ||
| Wilson 1995 | Wave 3 | CITS | ‐0 (‐0.1 to 0.1) | ‐1.2 (‐42.4 to 39.9) | ‐61.5 (‐61.8 to ‐61.2) | ‐79.7 (‐80.2 to ‐79.3) | ‐ | ||
| Harris 1996 | Wave 2 | CITS | ‐2.9 (‐4.1 to ‐1.7) | ‐2.9 (‐4.1 to ‐1.7) | ‐2.8 (‐4.1 to ‐1.4) | ‐2.5 (‐4.1 to ‐0.9) | ‐2 (‐4.3 to 0.3) | ||
| Harris 1996 | Wave 3 | CITS | ‐0.6 (‐2 to 0.7) | ‐0.6 (‐2 to 0.7) | ‐0.6 (‐2 to 0.9) | ‐0.5 (‐2.3 to 1.4) | ‐0.3 (‐3.4 to 2.8) | ||
| Harris 1996 | Wave 4 | CITS | ‐1.5 (‐2.9 to 0) | ‐1.5 (‐3 to 0) | ‐1.9 (‐3.4 to ‐0.5) | ‐2.8 (‐4.5 to ‐1.2) | ‐ | ||
| Harris 1996 | Wave 5 | CITS | ‐1.2 (‐2.3 to ‐0) | ‐1.2 (‐2.4 to ‐0) | ‐2.1 (‐3.1 to ‐1) | ‐ | ‐ | ||
| Costs per patient (antiulcer drugs) | Adjusted absolute change | Adjusted relative change 3 months | Adjusted relative change 6 months | Adjusted relative change 12 months | Adjusted relative change 24 months | ||||
| Wilson 1999 | Wave 3/4 | CBA | ‐ | ‐ | ‐ | ‐ | ‐10.6** | ||
| Costs per patient (antidepressants) | Adjusted absolute change | Adjusted relative change 3 months | Adjusted relative change 6 months | Adjusted relative change 12 months | Adjusted relative change 24 months | ||||
| Wilson 1999 | Wave 3/4 | CBA | ‐ | ‐ | ‐ | ‐ | ‐1.9** | ||
| Total prescribing costs | Absolute level effect (95% CI) | Relative change 3 months (95% CI) | Relative change 6 months (95% CI) | Relative change 12 months (95% CI) | Relative change 24 months (95% CI) | ||||
| Harris 1996 | Wave 2 | CITS | ‐1.4 (‐3.6 to 0.9) | 37.6 (‐24.1 to 99.3) | 13.4 (‐57.2 to 84.1) | ‐27.3 (‐109.4 to 54.9) | ‐89.6 (‐183.6 to 4.4) | ||
| Harris 1996 | Wave 3 | CITS | 1 (‐1.5 to 3.4) | ‐18.8 (‐65.6 to 28.4) | ‐35.9 (‐87.6 to 15.8) | ‐69.6 (‐127.4 to ‐11.9) | ‐97 (‐160.7 to ‐33.3) | ||
| Harris 1996 | Wave 4 | CITS | ‐0.3 (‐3.7 to 3) | 10.3 (‐90.6 to 111.2 ) | ‐14.2 (‐121.6 to 93.3) | ‐50.6 (‐166.2 to 65.1) | ‐ | ||
| Harris 1996 | Wave 5 | CITS | ‐0.9 (‐3 to 1.2) | 38.7 (‐50.5 to 127.9) | 21.2 (‐63.9 to 106.2) | ‐ | ‐ | ||
| Ireland Indicative drug budgets | Costs per item | Absolute level effect (95% CI) | Relative change 3 months (95% CI) | Relative change 6 months (95% CI) | Relative change 12 months (95% CI) | Relative change 24 months (95% CI) | |||
| Walley 2000 | IDTSS | ITS | 0.1 (‐2.5 to 2.8) | ‐ | ‐ | 0.6 (‐10.1 to 11.7) | 1.2 (‐12.9 to 15.3) | ||
| Total prescribing costs | Absolute level effect (95% CI) | Relative change 3 months (95% CI) | Relative change 6 months (95% CI) | Relative change 12 months (95% CI) | Relative change 24 months (95% CI) | ||||
| Walley 2000 | IDTSS | ITS | ‐5.2 (‐10 to ‐0.4) | ‐ | ‐ | ‐18.0 (‐34.6 to ‐1.4) | ‐21.7 (‐41.7 to ‐1.8) | ||
| Sweden fixed budgets for pharmaceutical expenditures | Costs per prescription | Adjusted absolute change | Adjusted relative change 3 months | Adjusted relative change 6 months | Adjusted relative change 12 months | Adjusted relative change 24 months | |||
| Granlund 2006 | Sweden, Burtrask | CBA | 23.19 | ‐ | ‐ | ‐ | 0.14**** | ||
| Granlund 2006 | Sweden, Morobacke | CBA | ‐3.8 | ‐ | ‐ | ‐0.022 | ‐ | ||
| Costs per DDD | Adjusted absolute change | Adjusted relative change 3 months | Adjusted relative change 6 months | Adjusted relative change 12 months | Adjusted relative change 24 months | ||||
| Granlund 2006 | Sweden, Burtrask | CBA | 0.39 | ‐ | ‐ | ‐ | 0.06**** | ||
| Granlund 2006 | Sweden, Morobacke | CBA | ‐0.05 | ‐ | ‐ | ‐0.007 | ‐ | ||
| Taiwan National Health Insurance Drug Budget Programme | Costs per prescription | Absolute level effect (95% CI) | Relative change 3 months (95% CI) | Relative change 6 months (95% CI) | Relative change 12 months (95% CI) | Relative change 24 months (95% CI) | |||
| Chou 2008 | NHI; for hypertension | ITS | 0.005 (‐0.005 to 0.01) | 0.001 (‐0.05 to 0.05) | ‐0.004 (‐0. 05 to 0.061) | 0.01 (‐0.05 to 0.07) | 0.02 (‐0.05 to 0.1) | ||
| Chou 2008 | NHI; for diabetes | ITS | 0.00 (‐0.007 to 0.005) | 0.01 (‐0.02 to 0.05) | 0.01 (‐0.02 to 0.06) | 0.01 (‐0.03 to 0.06) | 0.01 (‐0.04 to 0.08) | ||
| *3‐year f/u. **Combined wave 4: 1‐year f/u; wave 3: 2‐year f/u. ***Data from Stewart‐Brown 1995. ****Data were available for 20 months after the intervention. Costs of drugs dispensed from UK PACT data. If not otherwise noted, price year not specified in the paper. All Rafferty outcomes: difference in mean (costs per item results for year 3 were not re‐analysable); all Harris outcomes: percentage of non‐fund‐holders; all Wilson outcomes: differences in median. If not otherwise noted, price year not specified in the paper. CBA: controlled before‐after; CITS: controlled interrupted time series; IDTSS: Indicative Drug Target Savings Scheme; ITS: interrupted time series; PPI: proton pump inhibitors; SSRI: selective serotonin reuptake inhibitor. | |||||||||
Drug cost per item
Mean costs for dispensed drugs per item in UK fund‐holding were reported in three CBA (Bradlow 1993; Rafferty 1997; Wilson 1999) and two CITS analyses (Wilson 1995; Rafferty 1997). All measured outcomes suggested that the expenditure levels of fund‐holders relative to expected levels dropped more after intervention than those of non‐fund‐holders. Relative changes in levels of fund‐holders compared with controls for the two CITS studies ranged from ‐49.2% to ‐6.2% at one‐year follow‐up (Wilson 1995; Rafferty 1997) and most often showed a slight increase for longer follow‐up periods. Relative effects in CBA studies reporting results at one‐year follow‐up (Bradlow 1993; Rafferty 1997) ranged from ‐6.3% to ‐5.3%. One ITS study evaluated the effects of the Irish indicative drug budget policy (Walley 2000) and reported a slight increase in costs per item at 12 months (relative change in level 0.6%).
Findings of three ITS and CITS studies from two countries (Wilson 1995; Rafferty 1997; Walley 2000) suggest that pharmaceutical budgets might result in a possible reduction in cost per drug item (median relative change ‐25.6%), although the effect is uncertain, given the limitations of the included studies (Table 1).
Drug cost per patient or prescription
Almost all available effects on costs per patient across different waves and follow‐up periods of UK fund‐holding (reported in eight CBA and three CITS studies) consistently showed a bigger relative reduction in expenditure levels among fund‐holders. Relative level changes of fund‐holders compared with controls for CITS studies ranged from ‐79.7% to 66.8%, with a median of ‐2.8% at one‐year follow‐up (Wilson 1995; Harris 1996; Rafferty 1997). Effects most often increased over time. The effects appeared somewhat smaller in later waves. CBA results from the same studies were consistent with these findings, with a median of ‐4.6% and a range between ‐6.2% and 0.5% after 12 months (Burr 1992; Bradlow 1993; Corney 1997). Studies from Sweden and Taiwan reported slight changes in costs per patient at 12‐month follow‐up. A CBA study of Sweden fixed budgets for pharmaceutical expenditures described an adjusted relative change of ‐0.02 (Granlund 2006). An ITS study of the Taiwan National Health Insurance drug budget programme reported a relative change of 0.01 (Chou 2008).
Findings of four ITS and CITS studies from two countries (Wilson 1995; Harris 1996; Rafferty 1997; Chou 2008) suggest that a modest decrease in drug expenditures per patient was possible (median relative change ‐2.5%), although the effect is uncertain, given the limitations of the included studies (Table 1).
Total cost
One CITS study reported changes in total prescribing costs in UK fund‐holding (Harris 1996) and described reductions in prescribing costs for most follow‐up periods (range at 12‐month follow‐up ‐69.6% to ‐27.3%). One ITS study evaluated the effects of Irish indicative drug budget policy on overall prescribing costs at 12 months and observed an important reduction of ‐18.0% (Walley 2000). Findings of two ITS and CITS studies from two countries suggest that pharmaceutical budgets might result in a possible reduction in total drug expenditures (median relative change, ‐38.9%), although the effect is uncertain, given the limitations of the included studies (Table 1).
Healthcare utilisation and health outcomes
No study reported effects on health outcomes (Table 10). Two ITS studies assessed German drug budget policies (Guether 1995; Schöffski 1997) for effects on healthcare utilisation. One study (Schöffski 1997) reported results on referrals to hospitals and observed a 13.3% increase at three months and at 12 months. Rates of referral of socially insured patients to outpatient specialists were reported in both studies (Guether 1995; Schöffski 1997) and were inconclusive (median relative change ‐1.1% at 12 months; Table 1).
8. Effect of drug budgetary policies on healthcare utilisation.
| Intervention | Outcome | Study ID | Setting | Type of study | Absolute level effect (95% CI) | Relative change 3 months (95% CI) | Relative change 6 months (95% CI) | Relative change 12 months (95% CI) | Relative change 24 months (95% CI) |
| German drug budget | Referral to outpatient specialists | ||||||||
| Guether 1995 | Social insurance | interrupted time series (ITS) | 1543 (‐5095.6 to 8181.7) | 3.4 (‐11.3 to 18.1) | ‐3.5 (‐21.9 to 14.9) | ‐15.4 (‐40.3 to 9.5) | ‐ | ||
| Schoffski 1997 | Social insurance | ITS | 7.5 (‐2 to 17) | 22.8 (‐6 to 51.6) | 8.4 (‐25 to 41.8) | 13.2 (‐59.3 to 85.7) | ‐ | ||
| Referral to hospitals | |||||||||
| Schoffski 1997 | Social insurance | ITS | 0.1 (0 to 0.2) | 13.3 (1.2 to 25.5) | 10.8 (‐3.1 to 24.7) | 13.3 (‐16.6 to 43.2) | ‐ | ||
Characteristics of pay for performance policies
Pay for performance policy of the Netherlands
In 2001, a local insurance company introduced financial incentives for physicians to reduce prescribing costs and improve prescribing outcomes derived by adhering to a one‐page formulary. The incentive was behaviour independent and was given to general practitioners beforehand. All general practitioners working in the intervention areas agreed to participate in the scheme (Martens 2007).
UK pay for performance policy
In 2004, a quality and outcomes framework was introduced in the UK with the aim of improving the quality of general practice services. It included 136 quality indicators, including prescribing indicators, and provided an important financial incentive (up to 25% of a physician's earnings) for general practitioners (Doran 2011; Serumaga 2011). Joining the framework was compulsory for all practicing general practitioners in the UK.
Effects of pay for performance policies
One CBA and two ITS studies assessed the effects of pay for performance policies on relevant outcomes in two countries (Table 11).
9. Effect of pay for performance policies on drug use and health outcomes.
| Intervention | Outcome | Study ID | Setting | Type of study | Adjusted absolute change | Adjusted relative change 3 months | Adjusted relative change 6 months | Adjusted relative change 12 months | Adjusted relative change 24 months |
| Drug use | |||||||||
| Financial incentive for prescribing according to local guidelines | Prescription per patient | ||||||||
| Chinolones | Martens 2007 | The Netherlands | CBA | ‐0.1 | ‐0.02* | ‐ | ‐0.13 | ‐ | |
| Nitrofurantoin | Martens 2007 | The Netherlands | CBA | 0 | 0** | ‐ | 0.037 | ‐ | |
| Trimethoprim | Martens 2007 | The Netherlands | CBA | 0.3 | 0.10** | ‐ | ‐0.03 | ‐ | |
| Amoxicilin plus clavulanic acid drugs (long‐term, short‐term) | Martens 2007 | The Netherlands | CBA | ‐0.6 | ‐0.19** | ‐ | ‐0.12 | ‐ | |
| Amoxicillin | Martens 2007 | The Netherlands | CBA | ‐1.8 | ‐0.20* | ‐ | ‐0.03 | ‐ | |
| Doxycycline | Martens 2007 | The Netherlands | CBA | ‐0.7 | ‐0.16** | ‐ | ‐0.12 | ‐ | |
| Mupirocin | Martens 2007 | The Netherlands | CBA | 0.5 | 0.41** | ‐ | 0 | ‐ | |
| Recommended gastric drugs | Martens 2007 | The Netherlands | CBA | 1.7 | 0.18* | ‐ | 0.27 | ‐ | |
| Neutrally advised gastric drugs (short‐term, long‐term) | Martens 2007 | The Netherlands | CBA | 0.4 | 0.01* | ‐ | ‐0.02 | ‐ | |
| Newly introduced drugs (short‐term, long‐term) | Martens 2007 | The Netherlands | CBA | 0.1 | 0.01* | ‐ | ‐0.12 | ‐ | |
| Implementation of Quality and Outcomes Framework | Drug use ‐ percentage of patients with coronary heart disease treated with a β‐blocker (incentivised outcome) | ||||||||
| Doran 2011 | UK | ITS | 2.91 (2.75 to 3.65) | ‐ | ‐ | 2.61 (0.09 to 5.14) | 0.96 (‐2.15 to 4.09) | ||
| Drug use ‐ percentage of patients with coronary heart disease and left ventricular dysfunction treated with current ACE inhibitors (incentivised outcome) | |||||||||
| Doran 2011 | UK | ITS | ‐1.31 (‐2.91 to 0.31) | ‐ | ‐ | 2.5 (‐1.35 to 6.35) | 1.20 (‐3.56 to 5.96) | ||
| Health outcomes | |||||||||
| Financial incentive based on the proportions of patients achieving certain quality indicators | Percentage of patients with controlled blood pressure | ||||||||
| Serumaga 2011 | UK | ITS | ‐0.61 (‐0.33 to 0.21) | ‐0.931 (‐3.82 to 1.96) | ‐1.12 (‐4.6 to 2.35) | ‐1.49 (‐6.32 to 3.34) | ‐2.21 (‐10.08 to 5.65) | ||
| *Mean. **Median. CBA: controlled before‐after; ITS: interrupted time series. | |||||||||
Drug use
One CBA study in the Netherlands assessed the effects on prescriber performance of financial incentives for prescribing according to local guidelines (Martens 2007). Findings suggest a modest and temporary effect on prescribing of different target drugs, with adjusted relative changes that varied from ‐0.13 to 0.27. One ITS study assessed the effects on prescribing outcomes of the UK national pay for performance policy intended to improve quality of care (Doran 2011). This study reported modest improvements in five relevant prescribing outcomes, which consisted of prescribing outcomes that were not covered by the 'pay for performance' policy.
Health outcomes
One ITS study of moderate to high quality assessed effects of the UK pay for performance policy in improving health outcomes (Serumaga 2011). This study observed no clear improvements in the percentage of patients with controlled blood pressure at 12‐month follow‐up (relative change ‐1.49%, range ‐6.32 to 3.34) (Table 2).
Characteristics of reimbursement rate reduction policies
Taiwan's reimbursement rate reduction policies
Hospitals in Taiwan may reimburse the National Health Insurance for drugs prescribed for their patients at a much higher price than the acquisition prices. Hospitals also tend to increase physicians' payments linked to the extra earnings they obtained from prescribed medicines. This policy, which was introduced in 2000, involves two aspects: reduced agreed upon prices for many medicines, and the requirement for hospitals to report drug acquisition prices. This policy could affect both hospital revenues and physician potential earnings based on medicine prescribing (Chu 2008).
Effects of drug reimbursement reduction policies
Although the policy has been used in different countries (Table 5), only one study met the inclusion criteria (Table 12). One CBA study assessed the effects of this policy on drug costs and items per prescription in Taiwan (Chu 2008). Investigators observed a very modest adjusted relative change of 0.01 in drug costs per patient and of 0.03 drug items prescribed per prescription.
10. Effect of drug reimbursement rate reduction policies on drug use and expenditures.
| Intervention | Outcome | Study ID | Setting | Type of study | Adjusted absolute change | Adjusted relative change 3 months | Adjusted relative change 6 months | Adjusted relative change 12 months | Adjusted relative change 24 months |
| Drug reimbursement rate reduction | Costs per prescription (hypertension) | ||||||||
| Chu 2008 | Taiwan | controlled before‐after (CBA) | 0.012 | 0.008 | ‐ | ‐ | ‐ | ||
| Items per prescription (hypertension) | |||||||||
| Chu 2008 | Taiwan | CBA | 0.49 | 0.028 | ‐ | ‐ | ‐ | ||
Discussion
Summary of main results
Financial incentive prescribing policies are applied in various countries (see Table 5). However, studies that met the inclusion criteria for this review came from only six high‐income countries and evaluated eight different programmes that used financial incentive policies. We identified studies that assessed budgetary policies, pay for performance policies and reimbursement rate reduction policies targeting prescribers' behaviour.
Table 1 and Table 2 provide summaries of the main findings from more robust ITS and CITS studies. Table 8 (effect of budgetary policies on drug use), Table 9 (effect of budgetary policies on cost), Table 10 (effect of budgetary policies on healthcare utilisation), Table 11 (effects of pay for performance policies) and Table 12 (effects of drug reimbursement reduction) provide further details. As in the previous version of this review, evidence on the effects of budgetary policies is strongest, although the certainty of evidence for these policies is low or very low. On the basis of studies from four countries, budgetary policies may result in a reduction in drug use. Studies from two countries indicate that budgetary policies might also result in a reduction in prescribing costs, but the certainty of this evidence is very low. For all other outcome measures and other financial incentive policies, the certainty of the evidence is very low, or no evidence is available from the studies included in this review.
Overall the current version of the review provides wider coverage of financial incentive policies than was provided in the previous version of the review (Sturm 2007). In the previous version, included studies originated from three high‐income countries and evaluated budgetary policies only. Still, in this update, limited research evidence was available to assess the effects of financial incentive policies, and none of the included studies originated from a middle‐ or low‐income country.
Pharmaceutical budgets
Pharmaceutical budgets can apply to individual doctors or practices (as in UK fund‐holding, the Irish indicative drug budget and Swedish health centre pharmaceutical budgets), or collectively to areas and regions (as in Germany pharmaceutical budgets) or at a national level. Pharmaceutical budgets that apply collectively to large areas are less likely to act as financial incentives for prescribers, unless they transfer part of the responsibility for budgets to individual prescribers. The focus of studies included in this review has been on pharmaceutical budgets that can act as financial incentives for prescribers (i.e. when budgets apply to individual doctors or practices, or when regional budgets are used to provide financial incentives for doctors to remain within budgets). These incentives include rewards when pharmaceutical expenses remain within the budget or penalties when expenses exceed real or indicative budgets.
Findings suggest that pharmaceutical budgets might result in a modest reduction in drug use and an increase in the generic percentage of drug use, although the effects are uncertain, given the limitations of the included studies. Also wide variations in observed effects on drug expenditures per patient suggest that other confounding factors might moderate potential policy effects. The studies were more likely to suggest reductions in total prescribing costs, probably via reductions in cost per drug item. Whether such reductions are the result of physicians' decision making or policy level decisions regarding formularies or medicine pricing needs to be assessed in future studies.
Reductions in pharmaceutical costs (e.g. as a result of pharmaceutical budgets for primary care) may encourage cost shifting to other services or settings (e.g. referral to secondary care) (Croxson 2001). Such potential effects of pharmaceutical budgets were not clearly supported by the evidence included in our review. Evidence from this review does not clarify effects of pharmaceutical budgets on quality of care or health outcomes. Assessing effects on quality of care is more difficult than measuring effects on drug expenditure or use. Although the explicit objectives of pharmaceutical budget policies often involved controlling pharmaceutical expenditures, it was a major oversight that none of the included studies reported effects on health outcomes or quality of care.
Pay for performance policies
Pay for performance policies to improve prescribing behaviour in the UK and the Netherlands met our inclusion criteria. In the Netherlands, the policy involved encouraging prescribing based on clinical practice guidelines (Martens 2007). Although the policy had been mutually agreed upon by local physicians, an approach that is likely to improve the acceptability of the policy (Trude 2006), the pay for performance incentive resulted in only modest and temporary effects (Martens 2007).
One ITS study assessed the effects of UK national pay for performance policy in improving quality of care (Doran 2011). This study showed only modest improvements in prescribing outcomes with no substantial differences between improvements observed for prescribing outcomes that were incentivised under the pay for performance policy versus outcomes that were not incentivised. Another ITS study (Serumaga 2011) observed no improvements in the percentage of patients with controlled blood pressure at 12 months after introduction of the pay for performance policy in the UK. This study had a methodological advantage over other included ITS studies, as it included monthly collected data in the analyses. Our findings from included studies were also supported by the findings of studies that did not meet our inclusion criteria (Campbell 2007; Campbell 2009).
Despite expectations (Roland 2004; Mossalios 2005), the UK quality and outcomes framework pay for performance policy did not result in major improvements in prescribing or health outcomes. As a result, review findings did not provide a favourable picture for the effects of pay for performance.
The size of pay for performance may affect its effectiveness, although it has been suggested that even small financial rewards can have a strong influence on prescribers' behaviour (Ashworth 2004). Studies in the USA that did not meet the inclusion criteria reported little change in prescribing outcomes (O'Malley 2006; Chung 2010a; Chung 2010b) when they offered small incentives of about 2% of physician earnings (Table 5). It was also observed that it did not make much difference whether a small financial incentive was offered as one annual bonus payment or as monthly payments (Chung 2010b). Contrary to these experiences, the UK pay for performance policy involved a 25% rise in earning potential. Lack of substantial improvement in outcomes in the UK might be linked to a better baseline performance before implementation of the policy (Doran 2011; Serumaga 2011). It might be argued that lack of effect from pay for performance in the Netherlands was due to the nature of the incentive, as it was behaviour independent (i.e. physicians received the small incentive up front) (Martens 2007). Well‐designed studies, preferably randomised trials, of pay for performance policies are needed, especially because many policy‐makers and international organisations promote pay for performance policies for improved quality of care (Rosenthal 2004) in settings including low‐income and middle‐income countries (Eichler 2009).
Reimbursement rate reduction policies
For many years, certain specialist physicians in the USA gained financial benefits from dispensing expensive medicines under Medicare Part B plans. Physicians purchased medicines from wholesalers, prescribed them for patients and were reimbursed by Medicare at a higher rate (Jacobson 2006; Doshi 2010). This provided direct financial incentives for physicians to prescribe certain medicines. In 2003, the Medicare Prescription Drug, Improvement, and Modernization Act substantially reduced physician financial incentives for such prescriptions. A similar financial incentive is available in many other countries where physicians can dispense (usually a limited list of) medicines or equipment. Still few studies have assessed the effects of policies aimed at reducing such financial incentives, and only one study met our inclusion criteria. The included study in Taiwan demonstrated small changes in prescribing after implementation of the policy (Chu 2008). Non‐included studies from the USA suggest that the effects of the policy in that country on prescribing certain expensive chemotherapy medicines might have been substantial (Jacobson 2006; Chang 2009; Doshi 2010; Elliott 2010).
As Mossalios 2005 researchers have argued, from the third party payer point of view, financial incentive policies for prescribers offer advantages over other restrictive policies such as withdrawing reimbursement for certain medicines. With financial incentives, payers give doctors the opportunity to use their decision‐making powers to stay in line with the objectives of the payer or policy‐maker. Such decisions are less likely to be criticised by patients or doctors, and can be balanced by quality of care concerns of doctors (Mossalios 2005). Hence it is important to improve our understanding of the effects of such policies. Although our review provides a picture of available evidence on effects of different policies, our findings are subject to substantial uncertainty concerning the transferability of results to other settings.
Overall completeness and applicability of evidence
Investigators in the included studies did not pay enough attention to potential side effects of the policies. Only two studies from one country assessed the effects of pharmaceutical budget policies on referrals to other healthcare settings (Guether 1995; Schöffski 1997). Previous assessments suggest that the technical details of how a budget is established and how it is implemented may result in important consequences not intended by the policy (Delnoij 2000; Schwermann 2003). Also we were not able to identify any evidence to assess the applicability of the review findings to disadvantaged groups. Still the policies considered here might have side effects that disproportionately affect disadvantaged groups (Schwermann 2003). For example, pharmaceutical budget policies, if conducted in low‐resource settings without due attention to population needs, may result in reduced access to medicines. Additionally in cases of implementation of such budgets at the level of individual physicians, the policy may impact patients from different socioeconomic groups in different ways.
Disadvantaged populations might be at greater risk of adverse effects, if any, of all financial incentive policies for prescribers. Such concerns have not been adequately assessed in the literature and warrant further attention. Pay for performance might increase inequities or could decrease them, depending on the design of the policy. Non‐targeted outcomes and behaviours might be negatively affected by pay for performance (Doran 2011). A recent systematic review of pay for performance policies in health care (not limited to pharmaceutical policies) found no randomised controlled trials that assessed equity outcomes (Van Herck 2010). Still review authors found no evidence of negative effects of pay for performance on equitable access to health care.
As noted above, different policy designs and context characteristics may affect the effectiveness and outcomes of financial incentive policies. Given the expected lack of evidence to elaborate on these modifiers, we did not plan to conduct any subgroup analyses within policies of interest in this review. Still findings of previous studies and evidence that we gathered from the included studies provide some general guidance on the factors that must be considered in the design of financial incentive policies, which should be assessed in future research (Table 13).
11. Potential modifying factors of the effectiveness and outcomes of financial incentive policies for prescribers.
| Financial incentive policy | Pharmaceutical budgets | Pay for performance |
| Potential modifying factors | Formula for calculation of the budget (e.g. link to patient needs, link to past pharmaceutical expenditures …) Level of application of the budget (healthcare system, health settings, organisation or individual prescribers) |
Size of the incentive (absolute size, proportional to total revenue of the prescriber) Nature of the incentive (positive financial incentive vs negative financial incentive) Level of application of the incentive (individual prescriber vs group or organisation) Target outcomes for incentives (and as compared with outcomes not covered by the incentive) Target group of pay for performance (targeting specific groups or whole population) |
Certainty of the evidence
Comparability of presented results, even from within one country, is limited for the following reasons: (1) Studies from one country might use different units (e.g. per prescribing unit or per patient, median or mean); (2) prescribing volume was measured most often in dispensed items per patient, where a change in the true volume (e.g. shorter prescriptions, lower dosages) cannot be detected; and (3) policies evolve and change over time in countries, hence different evaluative studies conducted in different years or in different regions of a country might be assessing different versions of a policy.
None of the included studies were randomised trials. Hence for all included policies, selection bias may occur, especially when policies are implemented on a voluntary basis or on the basis of presumed 'readiness' for policy implementation (Moon 2002). Risk of selection bias for all included CBA study results might lead to overestimation of the effects (Baines 1996).
When possible, CBA studies were reanalysed as CITS studies. Although the effect sizes cannot be directly compared, consistency of the direction of effect over time strengthens the evidence. Most ITS studies also suffered from limitations, as they included few data points in the analyses.
Agreements and disagreements with other studies or reviews
Evidence from this review is largely consistent with common interpretations of the effects of pharmaceutical budget policies in the UK and Germany. Although drug costs continued to grow, the budget policies seemed to be effective in containing increases in drug cost, sometimes resulting in an immediate short‐lived reduction in total pharmaceutical costs (Wilson 1995; Bloor 1996; Narine 1997; Ess 2003; Schwermann 2003; Walley 2004; Mannion 2005; Walley 2005). This effect seems to result in part from switching to generics or other less expensive drugs (Bloor 1996; Gosden 1997; Narine 1997; Ess 2003; Walley 2004), and in part from decreased prescribing volume (Gosden 1997; Narine 1997; Rietveld 2002; Walley 2004). Other national policies such as price cuts or co‐payments also might have contributed to the effects (Walley 2004), although these policies were not used in the UK. Effects might decrease over time (Bloor 1996; Rietveld 2002), but the evidence provided in this review does not support this.
Our findings on the effects of pay for performance pharmaceutical policies reflect ongoing and current debates and disagreements on the effects of pay for performance policies on different outcomes (Oxman 2009; Van Herck 2010; Witter 2012; Eijkenaar 2013). A recent systematic review of pay for performance studies concluded that despite all the positive coverage, the evidence of effect is limited and such policies on non‐incentivised provision of care may be associated with side effects (Eijkenaar 2013).
Authors' conclusions
Implications for practice.
Although financial incentives are considered to be an important element of strategies to change prescribing patterns, limited studies on budgetary policies, pay for performance and reimbursement rate reduction policies from six countries met our inclusion criteria. The certainty of the evidence is low, very low or lacking for all types of financial incentives for prescribers. Drug budgets may decrease drug use (low‐certainty evidence) and might decrease drug costs (very low‐certainty evidence). Effects of other policies, including pay for performance policies, on improving quality of care and health outcomes are uncertain. Administration costs and overall healthcare costs were not reported.
Implications for research.
Our review found few well‐designed evaluations of pharmaceutical prescribing policies. Although we performed an extensive literature search, we are aware that additional studies could be available in the grey literature, such as working papers or internal government reports that we have not identified.
In contrast to budgetary policies elsewhere, British fund‐holding has been relatively extensively evaluated, albeit with important limitations. Since the time of the previous version of this review (Sturm 2007), no newly published studies of budgetary policies in the UK or Germany have met our inclusion criteria. Given that in these countries, as well as elsewhere, new pharmaceutical budget policies have been examined, the need for further research is ongoing. We included no randomised trials. However studies that were performed well, including trials and ITS studies, could be applied to evaluate drug policy interventions if planned in advance, and could reduce the risk of bias.
Evaluations in most included studies focused on relatively short‐term outcomes. Longer‐term analyses would provide important supplementary evidence, but risk for bias related to other confounding interventions are increased with the length of the observation period.
Because pharmaceutical policies have uncertain effects and might cause harms as well as benefits, proper evaluation of these policies is important. Evaluations should be planned before the policies are introduced and should be a routine part of the policy process. Future studies should consider the impact of these policies on health outcomes and on drug use, as well as on overall healthcare expenditures, in addition to drug expenditures. Only one included study assessed a health outcome (Serumaga 2011).
None of the included studies originated from a low‐income or middle‐income country. As use of pharmaceuticals increases in low‐income and middle‐income countries, it is increasingly important that resources are made available for evaluative studies of pharmaceutical policies in these countries.
What's new
| Date | Event | Description |
|---|---|---|
| 21 April 2015 | New citation required but conclusions have not changed | We included 6 new studies in this update and excluded 1 previously included study. The total included studies in the review is now 18. |
| 30 January 2015 | New search has been performed | This is the first update of the original review. We conducted a new search and updated other content. |
History
Review first published: Issue 3, 2007
| Date | Event | Description |
|---|---|---|
| 6 September 2011 | Amended | Minor change to plain language summary |
| 18 March 2009 | Amended | Correction to typographical error |
| 12 November 2008 | Amended | Minor changes |
| 30 July 2008 | Amended | Converted to new review format |
| 14 May 2007 | New citation required and conclusions have changed | Substantive amendments |
Acknowledgements
We gratefully acknowledge the following.
H Sturm, A Austvoll‐Dahlgren, M Aaserud, AD Oxman, C Ramsay, Å Vernby and JP Kösters, for conducting the first version of this systematic review.
Jan Odgaard‐Jensen, for providing invaluable statistical advice and support, and detailed comments.
Marit Johansen and John Eyers, for conducting the literature searches, and Marit Johansen, for helping to retrieve papers.
The following primary paper authors who kindly responded to our queries and questions: A James O’Malley, Michal Prokeš, Rajesh Shinghal, Mary E. Deily, Hsien‐Ming Lien, Hsuan‐Lein Chu, and P Pechlivanoglou.
Maryam Bigdeli, for providing helpful comments on the conduct of the review.
Vera Luiza Lucia, for reading a paper published in the Portuguese language.
The Alliance for Health Policy and Systems Research secretariat, for funding the study and providing continuous support.
The EPOC Norwegian satellite editorial team, especially Elizabeth Paulsen, for continuous support; and Claire Glenton, for useful comments and preparation of the Plain Language Summary.
Appendices
Appendix 1. All search strategies (run 2015)
CENTRAL
| ID | Search | Hits |
| #1 | MeSH descriptor: [Physician's Practice Patterns] this term only | 1095 |
| #2 | MeSH descriptor: [Group Practice] this term only | 39 |
| #3 | MeSH descriptor: [Institutional Practice] this term only | 3 |
| #4 | MeSH descriptor: [Partnership Practice] this term only | 3 |
| #5 | MeSH descriptor: [Private Practice] this term only | 84 |
| #6 | MeSH descriptor: [Family Practice] this term only | 2130 |
| #7 | MeSH descriptor: [Physicians] this term only | 613 |
| #8 | MeSH descriptor: [Physicians, Family] this term only | 465 |
| #9 | MeSH descriptor: [Physicians, Primary Care] this term only | 62 |
| #10 | MeSH descriptor: [Professional Practice] this term only | 122 |
| #11 | MeSH descriptor: [Nurses] this term only | 330 |
| #12 | MeSH descriptor: [Nurse Clinicians] this term only | 182 |
| #13 | MeSH descriptor: [Nurse Practitioners] this term only | 309 |
| #14 | MeSH descriptor: [Pharmacists] explode all trees | 443 |
| #15 | MeSH descriptor: [Pharmacies] this term only | 78 |
| #16 | MeSH descriptor: [Pharmacy] this term only | 16 |
| #17 | MeSH descriptor: [Hospitals] this term only | 339 |
| #18 | (physician* or GP or "gps" or doctor* or prescriber* or professional next pract* or group next pract* or institutional next pract* or partnership next pract* or family next pract* or general next pract* or office next pract* or private next pract* or primary next pract* or nurse or nurses or pharmacist* or pharmacies or pharmacy or hospital or hospitals):ti,ab | 76128 |
| #19 | #1 or #2 or #3 or #4 or #5 or #6 or #7 or #8 or #9 or #10 or #11 or #12 or #13 or #14 or #15 or #16 or #17 or #18 | 77177 |
| #20 | MeSH descriptor: [Drug Information Services] this term only | 46 |
| #21 | MeSH descriptor: [Pharmacists] this term only | 443 |
| #22 | MeSH descriptor: [Community Pharmacy Services] this term only | 208 |
| #23 | MeSH descriptor: [Reminder Systems] this term only | 609 |
| #24 | MeSH descriptor: [Feedback] this term only | 967 |
| #25 | MeSH descriptor: [Education, Continuing] this term only | 93 |
| #26 | MeSH descriptor: [Education, Medical, Continuing] this term only | 630 |
| #27 | MeSH descriptor: [Education, Nursing, Continuing] this term only | 248 |
| #28 | MeSH descriptor: [Education, Pharmacy, Continuing] this term only | 26 |
| #29 | MeSH descriptor: [Guidelines as Topic] this term only | 308 |
| #30 | MeSH descriptor: [Practice Guidelines as Topic] this term only | 1759 |
| #31 | MeSH descriptor: [Guideline Adherence] this term only | 737 |
| #32 | MeSH descriptor: [Budgets] this term only | 63 |
| #33 | MeSH descriptor: [Contract Services] this term only | 13 |
| #34 | MeSH descriptor: [Motivation] this term only | 3093 |
| #35 | MeSH descriptor: [Physician Incentive Plans] this term only | 13 |
| #36 | MeSH descriptor: [Capitation Fee] this term only | 30 |
| #37 | MeSH descriptor: [Reimbursement, Incentive] this term only | 62 |
| #38 | MeSH descriptor: [Income] this term only | 230 |
| #39 | MeSH descriptor: [Salaries and Fringe Benefits] this term only | 49 |
| #40 | MeSH descriptor: [Benchmarking] this term only | 98 |
| #41 | MeSH descriptor: [Drug Monitoring] this term only | 1107 |
| #42 | MeSH descriptor: [Adverse Drug Reaction Reporting Systems] this term only | 109 |
| #43 | MeSH descriptor: [Product Surveillance, Postmarketing] this term only | 98 |
| #44 | ("drug information" or reminder* or feedback or "continuing education" or capitation or salaries or salary or income* or wage or wages or fringe next benefit* or benchmarking or bench next marking or outreach or visit or visits or letter or letters or mail or mails or telephon* or "phone" or "phoning" or academic next detailing or group next detailing or fundhold* or fund next hold* or prescrib* next scheme* or prescrip* next scheme*):ti,ab | 38496 |
| #45 | guideline* near/1 (disseminat* or implement* or compliance or adherence or distribut*):ti,ab | 341 |
| #46 | (drug or drugs or pharmaceutic* or prescrib* or prescrip*) near/1 budget*:ti,ab | 15 |
| #47 | incentive* near/1 (plan or plans or money* or financ* or payment* or reimburs*):ti,ab | 308 |
| #48 | (review or report* or monitor* or surveillance or evaluat*) near/1 ("drug use" or "drug utilization" or "drug utilisation" or prescrib* or prescrip*):ti,ab | 150 |
| #49 | #20 or #21 or #22 or #23 or #24 or #25 or #26 or #27 or #28 or #29 or #30 or #31 or #32 or #33 or #34 or #35 or #36 or #37 or #38 or #39 or #40 or #41 or #42 or #43 or #44 or #45 or #46 or #47 or #48 | 45945 |
| #50 | MeSH descriptor: [Drug Prescriptions] this term only | 465 |
| #51 | MeSH descriptor: [Drug Utilization] this term only | 396 |
| #52 | MeSH descriptor: [Drug Utilization Review] this term only | 122 |
| #53 | (prescrib* or prescrip*) near/2 (attitude or variation* or behavior or behaviour or pattern* or practice* or habit or habits or accurate or trend or trends or cost or costs or effect* or change or changes or shift* or rational or reduce reduction or improv* or influenc* or expenditure* or rate or rates or data):ti,ab | 1257 |
| #54 | ("drug use" or "drug utilization" or "drug utilisation"):ti,ab | 1952 |
| #55 | #50 or #51 or #52 or #53 or #54 | 3761 |
| #56 | #19 and #49 and #55 in Trials | 631 |
NHSEED
| ID | Search | Hits |
| #1 | MeSH descriptor: [Physician's Practice Patterns] this term only | 1095 |
| #2 | MeSH descriptor: [Group Practice] this term only | 39 |
| #3 | MeSH descriptor: [Institutional Practice] this term only | 3 |
| #4 | MeSH descriptor: [Partnership Practice] this term only | 3 |
| #5 | MeSH descriptor: [Private Practice] this term only | 84 |
| #6 | MeSH descriptor: [Family Practice] this term only | 2130 |
| #7 | MeSH descriptor: [Physicians] this term only | 613 |
| #8 | MeSH descriptor: [Physicians, Family] this term only | 465 |
| #9 | MeSH descriptor: [Physicians, Primary Care] this term only | 62 |
| #10 | MeSH descriptor: [Professional Practice] this term only | 122 |
| #11 | MeSH descriptor: [Nurses] this term only | 330 |
| #12 | MeSH descriptor: [Nurse Clinicians] this term only | 182 |
| #13 | MeSH descriptor: [Nurse Practitioners] this term only | 309 |
| #14 | MeSH descriptor: [Pharmacists] explode all trees | 443 |
| #15 | MeSH descriptor: [Pharmacies] this term only | 78 |
| #16 | MeSH descriptor: [Pharmacy] this term only | 16 |
| #17 | MeSH descriptor: [Hospitals] this term only | 339 |
| #18 | (physician* or GP or "gps" or doctor* or prescriber* or professional next pract* or group next pract* or institutional next pract* or partnership next pract* or family next pract* or general next pract* or office next pract* or private next pract* or primary next pract* or nurse or nurses or pharmacist* or pharmacies or pharmacy or hospital or hospitals) | 207696 |
| #19 | #1 or #2 or #3 or #4 or #5 or #6 or #7 or #8 or #9 or #10 or #11 or #12 or #13 or #14 or #15 or #16 or #17 or #18 | 207696 |
| #20 | MeSH descriptor: [Drug Information Services] this term only | 46 |
| #21 | MeSH descriptor: [Pharmacists] this term only | 443 |
| #22 | MeSH descriptor: [Community Pharmacy Services] this term only | 208 |
| #23 | MeSH descriptor: [Reminder Systems] this term only | 609 |
| #24 | MeSH descriptor: [Feedback] this term only | 967 |
| #25 | MeSH descriptor: [Education, Continuing] this term only | 93 |
| #26 | MeSH descriptor: [Education, Medical, Continuing] this term only | 630 |
| #27 | MeSH descriptor: [Education, Nursing, Continuing] this term only | 248 |
| #28 | MeSH descriptor: [Education, Pharmacy, Continuing] this term only | 26 |
| #29 | MeSH descriptor: [Guidelines as Topic] this term only | 308 |
| #30 | MeSH descriptor: [Practice Guidelines as Topic] this term only | 1759 |
| #31 | MeSH descriptor: [Guideline Adherence] this term only | 737 |
| #32 | MeSH descriptor: [Budgets] this term only | 63 |
| #33 | MeSH descriptor: [Contract Services] this term only | 13 |
| #34 | MeSH descriptor: [Motivation] this term only | 3093 |
| #35 | MeSH descriptor: [Physician Incentive Plans] this term only | 13 |
| #36 | MeSH descriptor: [Capitation Fee] this term only | 30 |
| #37 | MeSH descriptor: [Reimbursement, Incentive] this term only | 62 |
| #38 | MeSH descriptor: [Income] this term only | 230 |
| #39 | MeSH descriptor: [Salaries and Fringe Benefits] this term only | 49 |
| #40 | MeSH descriptor: [Benchmarking] this term only | 98 |
| #41 | MeSH descriptor: [Drug Monitoring] this term only | 1107 |
| #42 | MeSH descriptor: [Adverse Drug Reaction Reporting Systems] this term only | 109 |
| #43 | MeSH descriptor: [Product Surveillance, Postmarketing] this term only | 98 |
| #44 | ("drug information" or reminder* or feedback or "continuing education" or capitation or salaries or salary or income* or wage or wages or fringe next benefit* or benchmarking or bench next marking or outreach or visit or visits or letter or letters or mail or mails or telephon* or "phone" or "phoning" or academic next detailing or group next detailing or fundhold* or fund next hold* or prescrib* next scheme* or prescrip* next scheme*) | 115956 |
| #45 | guideline* near/1 (disseminat* or implement* or compliance or adherence or distribut*) | 1147 |
| #46 | (drug or drugs or pharmaceutic* or prescrib* or prescrip*) near/1 budget* | 30 |
| #47 | incentive* near/1 (plan or plans or money* or financ* or payment* or reimburs*) | 461 |
| #48 | (review or report* or monitor* or surveillance or evaluat*) near/1 ("drug use" or "drug utilization" or "drug utilisation" or prescrib* or prescrip*) | 383 |
| #49 | #20 or #21 or #22 or #23 or #24 or #25 or #26 or #27 or #28 or #29 or #30 or #31 or #32 or #33 or #34 or #35 or #36 or #37 or #38 or #39 or #40 or #41 or #42 or #43 or #44 or #45 or #46 or #47 or #48 | 122420 |
| #50 | MeSH descriptor: [Drug Prescriptions] this term only | 465 |
| #51 | MeSH descriptor: [Drug Utilization] this term only | 396 |
| #52 | MeSH descriptor: [Drug Utilization Review] this term only | 122 |
| #53 | (prescrib* or prescrip*) near/2 (attitude or variation* or behavior or behaviour or pattern* or practice* or habit or habits or accurate or trend or trends or cost or costs or effect* or change or changes or shift* or rational or reduce reduction or improv* or influenc* or expenditure* or rate or rates or data) | 1781 |
| #54 | ("drug use" or "drug utilization" or "drug utilisation") | 4065 |
| #55 | #50 or #51 or #52 or #53 or #54 | 5773 |
| #56 | #19 and #49 and #55 in Economic Evaluations | 223 |
MEDLINE, Ovid SP
| # | Searches | Results |
| 1 | *Physician's Practice Patterns/ | 25568 |
| 2 | *Group Practice/ | 5359 |
| 3 | *Institutional Practice/ | 548 |
| 4 | *Partnership Practice/ | 589 |
| 5 | *Private Practice/ | 3572 |
| 6 | *Family Practice/ | 37643 |
| 7 | *Physicians/ | 41449 |
| 8 | *Physicians, Family/ | 9765 |
| 9 | *Physicians, Primary Care/ | 998 |
| 10 | *Professional Practice/ | 7835 |
| 11 | *Nurses/ | 22020 |
| 12 | *Nurse Clinicians/ | 5521 |
| 13 | *Nurse Practitioners/ | 10913 |
| 14 | *Pharmacists/ | 7324 |
| 15 | *Pharmacies/ | 2678 |
| 16 | *Pharmacy/ | 7168 |
| 17 | *Hospitals/ | 33359 |
| 18 | (physician$ or GP? or doctor? or prescriber? or professional pract* or group pract* or institutional pract* or partnership pract* or family pract* or general pract* or office pract* or private pract* or primary pract* or nurse or nurses).tw. | 653098 |
| 19 | (pharmacist? or pharmacies or pharmacy).tw. | 43679 |
| 20 | hospital?.tw. | 762207 |
| 21 | or/1‐20 | 1424970 |
| 22 | *Drug Information Services/ | 2315 |
| 23 | *Community Pharmacy Services/ | 2285 |
| 24 | *Reminder Systems/ | 1355 |
| 25 | *Feedback/ | 4796 |
| 26 | *Education, Continuing/ | 3217 |
| 27 | *Education, Medical, Continuing/ | 12484 |
| 28 | *Education, Nursing, Continuing/ | 12373 |
| 29 | *Education, Pharmacy, Continuing/ | 447 |
| 30 | *Guidelines as Topic/ | 8220 |
| 31 | *Practice Guidelines as Topic/ | 27646 |
| 32 | *Guideline Adherence/ | 9988 |
| 33 | *Budgets/ | 3905 |
| 34 | *Contract Services/ | 5529 |
| 35 | *Motivation/ | 19524 |
| 36 | *Physician Incentive Plans/ | 1250 |
| 37 | *Capitation Fee/ | 1987 |
| 38 | *Reimbursement, Incentive/ | 1970 |
| 39 | *Income/ | 6515 |
| 40 | *"Salaries and Fringe Benefits"/ | 6805 |
| 41 | *Benchmarking/ | 4213 |
| 42 | *Drug Monitoring/ | 5064 |
| 43 | *Adverse Drug Reaction Reporting Systems/ | 3119 |
| 44 | *Product Surveillance, Postmarketing/ | 2654 |
| 45 | drug information.tw. | 2620 |
| 46 | reminder?.tw. | 7406 |
| 47 | feedback.tw. | 86642 |
| 48 | (continuing adj1 education).tw. | 10530 |
| 49 | (guideline? adj1 (disseminat* or implement* or compliance or adherence or distribut*)).tw. | 2534 |
| 50 | ((drug? or pharmaceutic* or prescrib* or prescrip*) adj1 budget?).tw. | 285 |
| 51 | (incentive? adj1 (plan? or money* or financ* or payment? or reimburs*)).tw. | 3294 |
| 52 | capitation.tw. | 2247 |
| 53 | (salaries or salary or income? or wage or wages or fringe benefit?).tw. | 73762 |
| 54 | (benchmarking or bench marking).tw. | 4015 |
| 55 | ((review or report* or monitor* or surveillance or evaluat*) adj1 (drug use? or drug utilization or drug utilisation or prescrib* or prescrip*)).tw. | 1930 |
| 56 | outreach.tw. | 8281 |
| 57 | visit?.tw. | 110185 |
| 58 | (letter? or mail?).tw. | 80884 |
| 59 | (telephon* or phone or phoning).tw. | 52135 |
| 60 | ((academic or group) adj1 detailing).tw. | 357 |
| 61 | (fundhold* or fund hold*).tw. | 429 |
| 62 | ((prescrib* or prescrip*) adj1 scheme?).tw. | 51 |
| 63 | or/22‐62 | 536617 |
| 64 | *Drug Prescriptions/ | 12792 |
| 65 | *Drug Utilization/ | 5752 |
| 66 | *"Drug Utilization Review"/ | 1780 |
| 67 | ((prescrib* or prescrip*) adj2 (attitude or variation? or behavior or behaviour or pattern? or practice? or habit? or accurate or trend? or cost? or effect* or change? or shift* or rational or reduc* or improv* or influenc* or expenditure? or rate? or data)).tw. | 16016 |
| 68 | (drug use? or drug utilization or drug utilisation).tw. | 36804 |
| 69 | or/64‐68 | 65348 |
| 70 | random$.tw. | 738650 |
| 71 | multicenter study.pt. | 177607 |
| 72 | randomized controlled trial.pt. | 382639 |
| 73 | controlled clinical trial.pt. | 88504 |
| 74 | clinical trial.pt. | 488404 |
| 75 | intervention studies/ | 7175 |
| 76 | experiment$.tw. | 1491236 |
| 77 | (time adj series).tw. | 16766 |
| 78 | (pre test or pretest or (posttest or post test)).tw. | 16741 |
| 79 | random allocation/ | 81767 |
| 80 | impact.tw. | 527216 |
| 81 | control*.tw. | 2687048 |
| 82 | intervention?.tw. | 549968 |
| 83 | chang*.tw. | 2239496 |
| 84 | evaluation studies/ | 198985 |
| 85 | evaluat*.tw. | 2291066 |
| 86 | effect?.tw. | 3950017 |
| 87 | comparative studies/ | 1684725 |
| 88 | compar*.tw. | 3684936 |
| 89 | Non‐Randomized Controlled Trials as Topic/ | 8 |
| 90 | Interrupted Time Series Analysis/ | 10 |
| 91 | Controlled Before‐After Studies/ | 20 |
| 92 | or/70‐91 | 11101193 |
| 93 | editorial.pt. | 367122 |
| 94 | comment.pt. | 607484 |
| 95 | or/93‐94 | 859199 |
| 96 | animals/ | 5364245 |
| 97 | humans/ | 13645983 |
| 98 | 96 not (96 and 97) | 3883013 |
| 99 | 95 or 98 | 4709197 |
| 100 | 92 not 99 | 8497522 |
| 101 | 21 and 63 and 69 and 100 | 4418 |
| 102 | (201210* or 201211* or 201212* or 2013* or 2014* or 2015*).ed,ep,yr. | 2879170 |
| 103 | 101 and 102 | 758 |
EMBASE, Ovid SP
| # | Searches | Results |
| 1 | Clinical Practice/ | 177478 |
| 2 | General Practice/ | 68317 |
| 3 | Medical Practice/ | 76094 |
| 4 | Private Practice/ | 11215 |
| 5 | Professional Practice/ | 50325 |
| 6 | Group Practice/ | 8045 |
| 7 | General Practitioner/ | 62743 |
| 8 | Physician/ | 189628 |
| 9 | Nurse/ | 79073 |
| 10 | Nurse Practitioner/ | 18163 |
| 11 | Pharmacist/ | 49418 |
| 12 | Pharmacy/ | 55645 |
| 13 | Hospital Pharmacy/ | 12486 |
| 14 | Clinical Pharmacy/ | 6403 |
| 15 | Hospital/ | 278315 |
| 16 | (physician$ or GP? or doctor? or prescriber? or professional pract* or group pract* or institutional pract* or partnership pract* or family pract* or general pract* or office pract* or private pract* or primary pract* or nurse or nurses).tw. | 796622 |
| 17 | (pharmacist? or pharmacies or pharmacy).tw. | 85844 |
| 18 | hospital?.tw. | 1023242 |
| 19 | or/1‐18 | 2166281 |
| 20 | *Drug Information/ | 7168 |
| 21 | *Reminder System/ | 749 |
| 22 | *Feedback System/ | 9978 |
| 23 | *Continuing Education/ | 8383 |
| 24 | *Medical Education/ | 95718 |
| 25 | *Education/ | 48676 |
| 26 | *Nursing Education/ | 54320 |
| 27 | *Practice guideline/ | 38300 |
| 28 | *Budget/ | 4671 |
| 29 | *Motivation/ | 19299 |
| 30 | *Capitation Fee/ | 1644 |
| 31 | *Medical Fee/ | 4229 |
| 32 | *Income/ | 6147 |
| 33 | *Physician Income/ | 382 |
| 34 | *Salary/ | 547 |
| 35 | *Drug Monitoring/ | 16974 |
| 36 | *Postmarketing surveillance/ | 1573 |
| 37 | *Drug Surveillance Program/ | 9341 |
| 38 | drug information.tw. | 4287 |
| 39 | reminder?.tw. | 10023 |
| 40 | feedback.tw. | 98828 |
| 41 | (continuing adj1 education).tw. | 12183 |
| 42 | (guideline? adj1 (disseminat* or implement* or compliance or adherence or distribut*)).tw. | 3528 |
| 43 | ((drug? or pharmaceutic* or prescrib* or prescrip*) adj1 budget?).tw. | 455 |
| 44 | (incentive? adj1 (plan? or money* or financ* or payment? or reimburs*)).tw. | 3787 |
| 45 | capitation.tw. | 2385 |
| 46 | (salaries or salary or income? or wage or wages or fringe benefit?).tw. | 83247 |
| 47 | (benchmarking or bench marking).tw. | 5142 |
| 48 | ((review or report* or monitor* or surveillance or evaluat*) adj1 (drug use? or drug utilization or drug utilisation or prescrib* or prescrip*)).tw. | 2854 |
| 49 | outreach.tw. | 10391 |
| 50 | visit?.tw. | 157665 |
| 51 | (letter? or mail?).tw. | 151925 |
| 52 | (telephon* or phone or phoning).tw. | 69704 |
| 53 | ((academic or group) adj1 detailing).tw. | 463 |
| 54 | (fundhold* or fund hold*).tw. | 518 |
| 55 | ((prescrib* or prescrip*) adj1 scheme?).tw. | 70 |
| 56 | or/20‐55 | 860810 |
| 57 | *Prescription/ | 24569 |
| 58 | *"Drug Use"/ | 12342 |
| 59 | *Drug Utilization/ | 4395 |
| 60 | ((prescrib* or prescrip*) adj2 (attitude or variation? or behavior or behaviour or pattern? or practice? or habit? or accurate or trend? or cost? or effect* or change? or shift* or rational or reduc* or improv* or influenc* or expenditure? or rate? or data)).tw. | 23584 |
| 61 | (drug use? or drug utilization or drug utilisation).tw. | 47416 |
| 62 | or/57‐61 | 97429 |
| 63 | randomized controlled trial/ | 356342 |
| 64 | time series analysis/ | 14784 |
| 65 | random$.tw. | 923916 |
| 66 | experiment*.tw. | 1555371 |
| 67 | (time adj series).tw. | 18724 |
| 68 | (pre test or pretest or post test or posttest).tw. | 21759 |
| 69 | impact.tw. | 708271 |
| 70 | control*.tw. | 3198418 |
| 71 | intervention?.tw. | 705702 |
| 72 | chang*.tw. | 2557152 |
| 73 | evaluat*.tw. | 2935804 |
| 74 | effect?.tw. | 4444256 |
| 75 | compar*.tw. | 4442940 |
| 76 | or/63‐75 | 12126117 |
| 77 | editorial.pt. | 459038 |
| 78 | nonhuman/ | 4432890 |
| 79 | or/77‐78 | 4857801 |
| 80 | 19 and 56 and 62 and 76 | 6719 |
| 81 | 80 not 79 | 6628 |
| 82 | limit 81 to embase | 5631 |
| 83 | (201210* or 201211* or 201212* or 2013* or 2014* or 2015*).dd,yr. | 3136633 |
| 84 | 82 and 83 | 1519 |
International Network for Rational Use of Drugs (INRUD)
(Search field: All Non‐Indexed Text Files)
Two individual search strategies
1. {prescribing behavior} or {prescribing behaviour} or {prescribing habit} or {prescribing pattern } or {prescribing practice} or {change in prescri} or {changes in prescri} or {shift in prescri} AND {randomis} or {randomiz} or {randomly} or {intervention} or {control} or {group} or {before and after} or {pretest} or {posttest} or {pre test} or {post test} or {quasiexperiment} or {quasi experiment} or {evaluat} or {effect} or {impact} or {time series} or {time point} or {repeated measur}
2. {prescriber} or {financ} or {econom} or {pay} or {monetary} AND {incentive} AND {randomis} or {randomiz} or {randomly} or {intervention} or {control} or {group} or {before and after} or {pretest} or {posttest} or {pre test} or {post test} or {quasiexperiment} or {quasi experiment} or {evaluat} or {effect} or {impact} or {time series} or {time point} or {repeated measur}
EconLit, ProQuest
ALL(prescrib* or prescrip*) NEAR/2 ALL(attitude* or variation* or behavior or behaviour or pattern or patterns or practice* or habit or habits or accurate or trend or trends or cost or costs or effect* or change* or shift* or rational* or reduc* or improve* or influenc* or expenditure* or rate or rates or data or "drug use" or "drug utilization" or "drug utilisation") and ALL(randomised or randomized or randomly or trial or intervention or interventions or controlled or "control group" or "control groups" or "before and after" or "pre and post" or pretest or "pre test" or posttest or "post test" or quasiexperiment* or "quasi experiment" or "quasi experiments" or "quasi experimental" or evaluat* or effect or effects or impact* or "time series" or "time point" or "time points" or "repeated measure" or "repeated measures" or "repeated measurement" or "repeated measurements")
Science Citation Index an Social Sciences Citation Index, ISI Web of Knowledge
Citation search for included studies: Baines 1997c, Bradlow 1993, Burr 1992, Chou 2008, Chu 2008, Corney 1997,Doran 2011, Granlund 2006, Guether 1995, Harris 1996, Martens 2007, Rafferty 1997, Schöffski 1997, Serumaga 2011, Walley 2000, Whynes 1997, Wilson 1995, Wilson 1999.
Appendix 2. All search strategies used in the previous version of the review
| MEDLINE Ovid search strategy uses both medical subject heading (MeSH) terms and text words |
| 1. *Physician's Practice Patterns/ 2. *Group Practice/ 3. *Institutional Practice/ 4. *Partnership Practice/ 5. *Private Practice/ 6. *Family Practice/ 7. *Physicians/ 8. *Physicians, Family/ 9. *Professional Practice/ 10. *Nurses/ 11. *Nurse Clinicians/ 12. *Nurse Practitioners/ 13. *Pharmacists/ 14. *Pharmacies/ 15. *Pharmacy/ 16. *Hospitals/ 17. (physician$ or GP? or doctor? or prescriber? or group pract$ or institutional pract$ or partnership pract$ or family pract$ or general pract$ or office pract$ or private pract$ or primary pract$ or nurse or nurses).tw. 18. (pharmacist? or pharmacies or pharmacy).tw. 19. hospital?.tw. 20. or/1‐19 21. *Drug Information Services/ 22. *Pharmacists/ 23. *Community Pharmacy Services/ 24. *Reminder Systems/ 25. *Feedback/ 26. *Education, Continuing/ 27. *Education, Medical, Continuing/ 28. *Education, Nursing, Continuing/ 29. *Education, Pharmacy, Continuing/ 30. *Guidelines/ 31. *Practice Guidelines/ 32. *Guideline Adherence/ 33. *Budgets/ 34. *Motivation/ 35. *Physician Incentive Plans/ 36. *Capitation Fee/ 37. *Reimbursement, Incentive/ 38. *Income/ 39. *"Salaries and Fringe Benefits"/ 40. *Benchmarking/ 41. *Drug Monitoring/ 42. *Adverse Drug Reaction Reporting Systems/ 43. *Product Surveillance, Postmarketing/ 44. drug information.tw. 45. pharmacist?.tw. 46. reminder?.tw. 47. feedback.tw. 48. (continuing adj1 education).tw. 49. (guideline? adj1 (disseminat$ or implement$ or compliance or adherence or distribut$)).tw. 50. ((drug? or pharmaceutic$ or prescrib$ or prescrip$) adj1 budget?).tw. 51. (incentive? adj1 (plan? or money$ or financ$ or payment? or reimburs$)).tw. 52. capitation.tw. 53. (salaries or salary or income? or wages or fringe benefit?).tw. 54. benchmarking.tw. 55. ((review or report$ or monitor$ or surveillance or evaluat$) adj1 (drug use? or drug utilization or drug utilisation or prescrib$ or prescrip$)).tw. 56. outreach.tw. 57. visit?.tw. 58. (letter? or mail$).tw. 59. (telephon$ or phon$).tw. 60. ((academic or group) adj1 detailing).tw. 61. fundhold$.tw. 62. ((prescrib$ or prescrip$) adj1 scheme?).tw. 63. or/21‐62 64. *Prescriptions, Drug/ 65. *Drug Utilization/ 66. *"Drug Utilization Review"/ 67. ((prescrib$ or prescrip$) adj2 (attitude or variation? or behavior or behaviour or pattern? or practice? or habit? or accurate or trend? or cost? or effect? or change? or shift$ or rational or reduc$ or improv$ or influenc$ or expenditure? or rate? or data)).tw. 68. (drug use? or drug utilizarion or drug utilisation).tw. 69. or/64‐68 70. random$.tw. 71. multicenter study.pt. 72. randomized controlled trial.pt. 73. controlled clinical trial.pt. 74. clinical trial.pt. 75. intervention studies/ 76. experiment$.tw. 77. (time adj series).tw. 78. (pre test or pretest or (posttest or post test)).tw. 79. random allocation/ 80. impact.tw. 81. intervention?.tw. 82. chang$.tw. 83. evaluation studies/ 84. evaluat$.tw. 85. effect?.tw. 86. comparative studies/ 87. compar$.tw. 88. or/70‐87 89. editorial.pt. 90. letter.pt. 91. comment.pt. 92. or/89‐91 93. animals/ 94. humans/ 95. 93 not 94 96. 92 or 95 97. 20 and 63 and 69 and 88 98. 97 not 96 |
| EMBASE Ovid |
| Search fields: A combination of EMTAGS and text words 1. Clinical Practice/ 2. General Practice/ 3. Medical Practice/ 4. Private Practice/ 5. Professional Practice/ 6. Group Practice/ 7. General Practitioner/ 8. Physician/ 9. Nurse/ 10. Nurse Practitioner/ 11. Pharmacist/ 12. Pharmacy/ 13. Hospital Pharmacy/ 14. Clinical Pharmacy/ 15. Hospital/ 16. (physician$ or GP? or doctor? or prescriber? or group pract$ or institutional pract$ or partnership pract$ or family pract$ or general pract$ or office pract$ or private pract$ or primary pract$ or nurse or nurses).tw. 17. (pharmacist? or pharmacies or pharmacy).tw. 18. hospital?.tw. 19. or/1‐18 20. *Drug Information/ 21. *Pharmacist/ 22. *Reminder System/ 23. *Feedback System/ 24. *Continuing Education/ 25. *Medical Education/ 26. *Education/ 27. *Nursing Education/ 28. *Practice guideline/ 29. *Budget/ 30. *Motivation/ 31. *Capitation Fee/ 32. *Medical Fee/ 33. *Income/ 34. *Physician Income/ 35. *Salary/ 36. *Drug Monitoring/ 37. *Postmarketing surveillance/ 38. *Drug Surveillance Program/ 39. drug information.tw. 40. pharmacist?.tw. 41. reminder?.tw. 42. feedback.tw. 43. (continuing adj1 education).tw. 44. (guideline? adj1 (disseminat$ or implement$ or compliance or adherence or distribut$)).tw. 45. ((drug? or pharmaceutic$ or prescrib$ or prescrip$) adj1 budget?).tw. 46. (incentive? adj1 (plan? or money$ or financ$ or payment? or reimburs$)).tw. 47. capitation.tw. 48. (salaries or salary or income? or wages or fringe benefit?).tw. 49. benchmarking.tw. 50. ((review or report$ or monitor$ or surveillance or evaluat$) adj1 (drug use? or drug utilization or drug utilisation or prescrib$ or prescrip$)).tw. 51. outreach.tw. 52. visit?.tw. 53. (letter? or mail$).tw. 54. (telephon$ or phon$).tw. 55. ((academic or group) adj1 detailing).tw. 56. fundhold$.tw. 57. ((prescrib$ or prescrip$) adj1 scheme?).tw. 58. or/20‐57 59. *Prescription/ 60. *"Drug Use"/ 61. *Drug Utilization/ 62. ((prescrib$ or prescrip$) adj2 (attitude or variation? or behavior or behaviour or pattern? or practice? or habit? or accurate or trend? or cost? or effect? or change? or shift$ or rational or reduc$ or improv$ or influenc$ or expenditure? or rate? or data)).tw. 63. (drug use? or drug utilization or drug utilisation).tw. 64. or/59‐63 65. randomized controlled trial/ 66. random$.tw. 67. experiment$.tw. 68. (time adj series).tw. 69. (pre test or pretest or post test or posttest).tw. 70. impact.tw. 71. intervention?.tw. 72. chang$.tw. 73. evaluat$.tw. 74. effect$.tw. 75. compar$.tw. 76. or/65‐75 77. letter.pt. 78. editorial.pt. 79. nonhuman/ 80. or/77‐79 81. 19 and 58 and 64 and 76 82. 81 not 80 |
| Effective Practice and Organisation of Care Group Register, Idealist Database |
| Searched terms anywhere in text drug [or] drugs [or] pharmaceutic* [or] medicines [or] medicat* [or] prescrip* [or] prescrib* |
| CENTRAL, the Cochrane Central Register of Controlled Trials, Ovid |
| Search fields: A combination of MeSH terms and text words 1. (regulat$ or requirement? or restrict$ or monitor$ or control$).tw. 2. (legislation? or law? or act? or policy or policies or politics or reform$ or system? or plan$ or program$ or strateg$).tw. or Policy Making/ or Legislation, Drug/ or Public Policy/ or Health Policy/ or Politics/ or Health Care Reform/ 3. (drug or drugs or pharmaceutic$ or medicines or medicament? or medicat$).tw. or exp Pharmaceutical Preparation/ or Drug Utilization/ 4. (drug or drugs or pharmaceutic$ or medicines or medicament? or medicat$).tw. or exp Pharmaceutical Preparation/ or Drug Industry/ or Drug Utilization/ 5. (drug or drugs or pharmaceutic$ or medicines or medicament? or medicat$).tw. or exp Pharmaceutical Preparation/ or Prescriptions, Drug/ or Drug Utilization/ 6. Drug Approval/ or (approv$ adj3 (drug or drugs or pharmaceutic$ or medicines or medicament? or medicat$)).tw. 7. Licensure/ and 4 8. Drug Labeling/ 9. ((licens$ or registrat$ or label$) adj3 (drug or drugs or pharmaceutic$ or medicines or medicament? or medicat$)).tw. 10. (6 or 7 or 8 or 9) and (1 or 2) 11. Classification/ and 3 and 2 12. ((classify$ or classification?) adj3 (drug or drugs or pharmaceutic$ or medicines or medicament? or medicat$)).tw. and 2 13. 11 or 12 14. 10 or 13 15. Patents/ and 4 16. (patent? adj3 (drug or drugs or pharmaceutic$ or medicines or medicament? or medicat$)).tw. 17. ((profit$ adj3 (control$ or reduc$ or regulat$ or fix$ or restrict$)) and (drug or drugs or pharmaceutic$ or medicines or medicament? or medicat$)).tw. 18. (15 or 16 or 17) and (1 or 2) 19. (Marketing/ or Marketing of Health Services/ or Advertising/) and 4 20. ((advert$ or promot$ or market$) adj3 (drug or drugs or pharmaceutic$ or medicines or medicament? or medicat$)).tw. 21. (19 or 20) and (1 or 2) 22. (Insurance, Hospitalization/ or Insurance, health, reimbursement/ or Reimbursement Mechanisms/ or Reimbursement, disproportionate share/ or Reimbursement, incentive/) and 5 23. Insurance, pharmaceutical services/ 24. ((reimburse$ or insur$ or (third party adj1 pay$) or benefit plan?) adj3 (drug or drugs or pharmaceutic$ or pharmacy or pharmacies or medicines or medicament? or medicat$)).tw. 25. (22 or 23 or 24) and (1 or 2) 26. Formularies/ and 5 27. Formularies, Hospital/ and 3 28. ((formulary or formularies or positive list? or negative list?) adj3 (drug or drugs or pharmaceutic$ or medicines or medicament? or medicat$ or hospital?)).tw. 29. (26 or 27 or 28) and (1 or 2) 30. Drugs, Essential/ 31. (essential adj3 (drug? or pharmaceutic$ or medicine? or medicament?)).tw. 32. ((drug? or pharmaceutic$ or medicine? or medicament?) adj3 list?).tw. 33. 31 and 32 34. 30 or 33 35. ((pre‐authori#ation? or preauthori#ation? or prior authori#ation?) adj3 (drug or drugs or pharmaceutic$ or medicines or medicament? or medicat$)).tw. 36. Reminder Systems/ and 5 and 2 37. (reminder? adj3 (drug or drugs or pharmaceutic$ or medicines or medicament? or medicat$)).tw. and 2 38. Prescriptions, Drug/ 39. (continu$ adj3 education).tw. 40. Education, Continuing/ 41. Education, Pharmacy, Continuing/ 42. (improv$ or incentive?).tw. 43. 39 or 40 or 41 or 42 44. 38 and 43 and (1 or 2) 45. (((prescrib$ or prescription?) adj3 (drug or drugs or pharmaceutic$ or medicines or medicament? or medicat$)) and ((continu$ adj1 education) or (improv$ or incentive?))).tw. and (1 or 2) 46. (Guidelines/ or Practice Guidelines/ or Guideline Adherence/) and 2 and 5 47. (((guideline? or recommendation?) adj3 (drug or drugs or pharmaceutic$ or medicines or medicament? or medicat$)) and (disseminat$ or implement$ or complian$ or adherence)).tw. and 2 48. 46 or 47 49. (((generic$ adj3 prescrib$) or (generic$ adj3 prescription?)) adj3 (drug or drugs or pharmaceutic$ or medicines or medicament? or medicat$)).tw. 50. ((local$ or global$) adj3 budget$).tw. 51. (budget$ adj3 (general pract$ or GP? or physician? or doctor?)).tw. 52. 50 and 51 53. (fundhold$ adj3 (general pract$ or GP? or physician? or doctor?)).tw. 54. 52 or 53 55. 54 and 3 56. "Pharmacy and Therapeutics Committee"/ and 2 and 5 57. ((drug? or formulary or pharmac$) adj3 committee?).tw. and 2 58. 56 or 57 59. (Drug Monitoring/ or Adverse Drug Reaction Reporting Systems/ or (safe$ adj1 (drug or drugs or pharmaceutic$ or medicines or medicament? or medicat$)).tw.) and 2 60. Product Surveillance, Postmarketing/ and 3 and 2 61. 59 or 60 62. 36 or 37 or 44 or 45 or 48 or 49 or 55 or 58 or 61 63. (Cost Control/ or Cost Savings/) and 5 and 2 64. ((control$ or containment or curtailment or reduc$ or save or saving) adj3 cost?).tw. 65. (cost? adj3 (drug or drugs or pharmaceutic$ or medicines or medicament? or medicat$)).tw. 66. 64 and 65 and 2 67. ((control$ or reduc$ or cut$ or regulat$ or negotiat$ or fix$) adj3 (price? or pricing)).tw. 68. ((price? or pricing) adj3 (drug or drugs or pharmaceutic$ or medicines or medicament? or medicat$)).tw. 69. 67 and 68 and 2 70. (reference$ adj3 (price? or pricing)).tw. 71. ((price? or pricing) adj3 (drug or drugs or pharmaceutic$ or medicines or medicament? or medicat$)).tw. 72. 70 and 71 73. (index$ adj3 (price? or pricing)).tw. 74. ((price? or pricing) adj3 (drug or drugs or pharmaceutic$ or medicines or medicament? or medicat$)).tw. 75. 73 and 74 76. (maxim$ adj3 (price? or pricing)).tw. 77. ((price? or pricing) adj3 (drug or drugs or pharmaceutic$ or medicines or medicament? or medicat$)).tw. 78. 76 and 77 79. (cost? effect$ adj3 (price? or pricing)).tw. 80. ((price? or pricing) adj3 (drug or drugs or pharmaceutic$ or medicines or medicament? or medicat$)).tw. 81. 79 and 80 82. (reimbursement contract? adj3 (drug or drugs or pharmaceutic$ or medicines or medicament? or medicat$)).tw. 83. (Drug Cost/ or Economics, Pharmaceutical/) and (1 or 2) 84. (Purchasing, Hospital/ or Group, Purchasing/) and 3 85. (purchas$ adj3 (group? or join$ or hospital? or shared)).tw. 86. ((group? or join$ or hospital? or shared) adj3 (drug or drugs or pharmaceutic$ or medicines or medicament? or medicat$)).tw. 87. 85 and 86 and 2 88. (procurement$ adj3 (drug or drugs or pharmaceutic$ or medicines or medicament? or medicat$)).tw. and 2 89. (rebate? adj3 (drug or drugs or pharmaceutic$ or medicines or medicament? or medicat$)).tw. and 2 90. 63 or 66 or 69 or 72 or 75 or 78 or 81 or 82 or 83 or 84 or 87 or 88 or 89 91. Marketing/ or Marketing of Health Services/ or Advertising/ or Licensure/ or Drug Labeling/ 92. Pharmacies/ or Pharmacists/ or (pharmacy or pharmacies or pharmacist? or retailer? or wholesaler? or supplier? or dispens$).tw. 93. 91 and 92 and 3 and (1 or 2) 94. (advert$ or promot$ or market$).tw. 95. Pharmacies/ or Pharmacists/ or (pharmacy or pharmacies or pharmacist? or retailer? or wholesaler? or supplier? or dispens$).tw. 96. 94 and 95 and 3 and (1 or 2) 97. 93 or 96 98. ((control$ or reduc$ or regulat$ or fix$ or restrict$) adj3 profit?).tw. 99. (profit? adj3 (drug or drugs or pharmaceutic$ or medicines or medicament? or medicat$)).tw. 100. Pharmacies/ or Pharmacists/ or (pharmacy or pharmacies or pharmacist? or retailer? or wholesaler? or supplier? or dispens$).tw. 101. 98 and 99 and 100 102. (generic$ adj3 substitut$).tw. 103. (substitut$ adj3 (drug or drugs or pharmaceutic$ or medicines or medicament? or medicat$)).tw. 104. 102 and 103 105. (licens$ adj3 (pharmacy or pharmacies)).tw. 106. (((supply or supplies or distribut$ or sale$) adj3 (drug or drugs or pharmaceutic$ or medicines or medicament$ or medicat$)) and (pharmacy or pharmacies or retailer? or wholesaler? or supplier? or dispens$)).tw. and (1 or 2) 107. 97 or 101 or 104 or 105 or 106 108. Cost Sharing/ and 5 109. (cost? adj3 (sharing or share)).tw. 110. ((sharing or share) adj3 (drug or drugs or pharmaceutic$ or medicines or medicament? or medicat$)).tw. 111. 109 and 110 112. (out of pocket? adj3 pay$).tw. 113. (pay$ adj3 (drug or drugs or pharmaceutic$ or medicines or medicament? or medicat$)).tw. 114. 112 and 113 115. ((copay$ or co pay$) adj3 (drug or drugs or pharmaceutic$ or medicines or medicament? or medicat$)).tw. 116. ((prescrib$ or prescription? or pharmaceutic$ or pharmacy or pharmacies or dispens$) adj3 (charg$ or fee?)).tw. 117. ((charg$ or fee?) adj3 (drug or drugs or pharmaceutic$ or medicines or medicament? or medicat$)).tw. 118. 116 and 117 119. ((prescrib$ or prescription?) adj3 (limit$ or cap$)).tw. 120. ((limit$ or cap$) adj3 (drug or drugs or pharmaceutic$ or medicines or medicament? or medicat$)).tw. 121. 119 and 120 122. ((coinsurance or deductible?) adj3 (drug or drugs or pharmaceutic$ or medicines or medicament$ or medicat$)).tw. 123. "Deductibles and Coinsurance"/ and 5 124. Fees, Pharmaceutical/ 125. Prescription Fees/ 126. Capitation Fee/ and 5 127. 108 or 111 or 114 or 115 or 118 or 121 or 122 or 123 or 124 or 125 or 126 128. Drug Information Services/ and (patient? or consumer?).tw. and 2 129. Drug Labeling/ and (patient? or consumer?).tw. and 2 130. Patient Education/ and 3 and (1 or 2) 131. ((educat$ or inform$) adj3 (patient? or consumer?)).tw. 132. ((patient? or consumer?) adj3 (drug or drugs or pharmaceutic$ or medicines or medicament? or medicat$)).tw. 133. 131 and 132 and (1 or 2) 134. 128 or 129 or 130 or 133 135. 14 or 18 or 21 or 25 or 29 or 34 or 35 or 62 or 90 or 107 or 127 or 134 |
| CSA Worldwide Political Science Abstracts |
| Search field: 'Key Words' KW=(legislation OR law* OR act* OR policy OR policies OR politics OR reform* OR system* OR plan* program* OR strateg* OR regulat* OR requirement* OR restrict* OR monitor* OR control) AND KW=(drug* OR pharmaceutic* OR medicines OR medicament* OR medicat*) AND KW=(random* OR intervention* OR control* OR compar* OR evaluat* OR time OR longitud* OR repeated measure* OR pretest OR posttest OR pre test OR post test OR impact* OR chang* OR effect* OR experiment*) |
| EconLit, WebSPIRS |
| Search filed: 'Terms Anywhere' regulat* or requirement or restrict* or monitor* or control* or legislation or law? or act? or policy or policies or politics or reform* or system? or plan* or program? or strateg*) and (drug? or pharmaceutic* or medicines or medicament? or medicat*) and (random* or intervention? or control* or compar* or evaluat* or time or pretest or posttest or pre test or post test or impact? or chang* or effect? or experiment?) |
| SIGLE, System for Information on Grey Literature in Europe, WebSPIRS |
| Search field: 'Terms Anywhere' (regulat* or requirement or restrict* or monitor* or control* or legislation or law? or act? or policy or policies or politics or reform* or system? or plan* or program? or strateg*) and (drug? or pharmaceutic* or medicines or medicament? or medicat*) and (random* or intervention? or control* or compar* or evaluat* or time or pretest or posttest or pre test or post test or impact? or chang* or effect? or experiment?) |
| INRUD, International Network for Rational Use of Drugs |
| Search field: 'All non‐indexed fields' {drug} or {pharmaceutic} or {medicines} or {medicament} or {medicat} AND {regulat} or {requirement} or {restrict} or {monitor} or {control} or {legislation} or {law} or {act} or {policy} or {policies} or {politics} or {reform} or {system} or {plan} or {program} or {strateg} AND {random} or {intervention} or {control} or {compar} or {evaluat} or {time} or {pretest} or {posttest} or {pre test} or {post test} or {impact} or {chang} or {effect} or {experiment} |
| PAIS International, Public Affairs Information Service, WebSPIRS |
| Search fields: 'Descriptors' or 'Title' or 'Abstract' 1.((explode "Drug‐stores" in DE) or (explode "Pharmacists" in DE) or (explode "Prescriptions" in DE) or (explode "Drugs" in DE) or (explode "Pharmaceutical‐industry" in DE) OR (( ((drug? or pharmaceutic* or medicines or medicament? or medicat*)) in AB ) OR ( ((drug? or pharmaceutic* or medicines or medicament? or medicat*)) in TI ))) AND (( ((random* or intervention? or control* or compar* or evaluat* or time or pretest or posttest or pre test or post test or impact? or chang* or effect? or experiment?)) in AB ) OR ( ((random* or intervention? or control* or compar* or evaluat* or time or pretest or posttest or pre test or post test or impact? or chang* or effect? or experiment?)) in TI )) AND (( ((regulat* or requirement or restrict* or monitor* or control* or legislation or law? or act? or policy or policies or politics or reform* or system? or plan* or program? or strateg*)) in AB ) OR ( ((regulat* or requirement or restrict* or monitor* or control* or legislation or law? or act? or policy or policies or politics or reform* or system? or plan* or program? or strateg*)) in TI )) 2.((narco* or crim* or war? or terror* or weapon? or addict* or abus* or traffic* or illicit*) in AB) OR ((narco* or crim* or war? or terror* or weapon? or addict* or abus* or traffic* or illicit*) in TI) 3. (1 AND 2) NOT 3 |
| International Political Science Abstracts, WebSPIRS |
| Search field: 'Terms Anywhere' (regulat* or requirement or restrict* or monitor* or control* or legislation or law? or act? or policy or policies or politics or reform* or system? or plan* or program? or strateg*) and (drug? or pharmaceutic* or medicines or medicament? or medicat*) and (random* or intervention? or control* or compar* or evaluat* or time or pretest or posttest or pre test or post test or impact? or chang* or effect? or experiment?) |
| NHS EED, National Health Services Economic Evaluation Database, CRD |
| Search fields: A combination of 'Subject Headings' and 'All fields' Search done in 6 separate stages 1.drug‐approval or licensure or drug‐labeling or classification or patents or marketing or marketing‐of‐health‐services or advertising/Subject Headings AND drug or pharmac or medicin or medica or prescri/All fields AND regulat or require or restrict or monitor or control or legislation or law or act or policy or policies or politics or reform or system or plan or program or strateg/All fields 2.insurance‐hospitalization or insurance‐health‐reimbursement or reimbursement‐ mechanisms or reimbursement‐disproportionate‐share or reimbursement‐incentive or insurance‐pharmaceutical‐services/Subject Headings AND drug or pharmac or medicin or medica or prescri/All fields AND regulat or require or restrict or monitor or control or legislation or law or act or policy or policies or politics or reform or system or plan or program or strateg/All fields 3.formularies or formularies‐hospital or drugs‐essential or reminder‐systems or prescriptions‐drug or education‐continuing or education‐pharmacy‐continuing or guidelines or practice‐guidelines or guideline‐adherence/Subject Headings AND drug or pharmac or medicin or medica or prescri/All fields AND regulat or require or restrict or monitor or control or legislation or law or act or policy or policies or politics or reform or system or plan or program or strateg/All fields 4.drug‐monitoring or adverse‐drug‐reaction‐reporting‐systems or product‐surveillance‐postmarketing/Subject Headings AND drug or pharmac or medicin or medica or prescri/All fields AND regulat or require or restrict or monitor or control or legislation or law or act or policy or policies or politics or reform or system or plan or program or strateg/All fields 5.deductibles or coinsurance or fees‐pharmaceutical or prescription‐fees or capitation‐fee or drug‐information‐services or patient‐education /Subject Headings AND drug or pharmac or medicin or medica or prescri/All fields 6.cost‐control or cost savings or drug‐cost or economics‐pharmaceutical or purchasing‐hospital or group‐purchasing or pharmacies or pharmacists or cost‐sharing/Subject Headings AND drug or pharmac or medicin or medica or prescri/All fields AND regulat or require or restrict or monitor or control or legislation or law or act or policy or policies or politics or reform or system or plan or program or strateg/All fields |
| NTIS, National Technical Information Service |
| Search fields: A combination of 'Index Terms' (KT), 'Key Words/Phrases' (no tag) and 'Title' #1. KT=PHARMACEUTICALS OR KT=DRUGS OR KT=MEDICATIONS OR KT= PRESCRIPTION DRUGS OR KT=DRUG #PRESCRIPTIONS #2. REGULAT* OR REQUIR* OR RESTRICT* OR LEGISLAT* OR LAW? OR ACT? OR POLICY OR POLICIES #3. COMPAR* OR EVALUAT* OR EFFECT? #4. NARCO* OR CRIM* OR WAR? OR ADDICT* OR ABUS* OR TRAFFIC* OR ILLICIT* #5. TI=MANUAL? OR TI=CANCER OR TI=REGISTRATION FILE OR TI=RETIRED REGISTRANTS #6. (#1 AND #2 AND #3) NOT #4 #7. #6 NOT #5 |
| IPA, International Pharmaceutical Abstract, WebSPIRS |
| Search fields: A combination of 'Descriptors' and 'Terms Anywhere' 1.((approval*) in DE) or ((licensing) in DE) or ((licensure) in DE) or ((labeling) in DE) or ((classification) in DE) or ((patent*) in DE) or ((marketing) in DE) or ((advertising) in DE) or ((insurance) in DE) or ((reimbursement) in DE) or ((formularies) in DE) or ((formulary) in DE) or ((essential) in DE) or (reminder system*) or ((Education‐pharmaceutical‐continuing) in DE) or ((Education‐continuing) in DE) or ((Hospitals‐pharmacy‐and‐therapeutics‐committee) in DE) or (drug* near1 monitoring) or ((Drugs‐adverse‐reactions‐reports) in DE) or ((Reports‐drugs‐adverse‐reactions) in DE) or ((Costs‐drugs) in DE) or ((Pricing‐drugs) in DE) or ((pharmacoeconomics) in DE) or (reference near2 pric*) or ((Costs‐prescription‐drugs) in DE) or ((purchasing) in DE) or (cost adj sharing) or ((copayment*) in DE) or (deductibles) or (coinsurance) or ((drug information services) in DE) or (patient adj education) (regulat* or restrict* or control* or legislat* or law or laws or act or acts or policy or policies or program or programs) and (control* or compar* or evaluat* or time series or impact* or effect or effects) and ((sc=20) or (sc=22)) 2.(regulat* or restrict* or control* or legislat* or law or laws or act or acts or policy or policies or program or programs) and (control* or compar* or evaluat* or time series or impact* or effect or effects) and ((sc=20) or (sc=22)) 3.(1 and 2) not sc=6 |
| OECD (Organisation for Economic Co‐operation and Development) |
| Searched: Publications & Documents, limited to OECD Publications only drug or drugs or pharmaceutical or pharmaceuticals or medicaments or medicines or prescription or prescriptions or prescribe or prescribing |
| SourceOECD |
| Search fields: 'Title' or 'Abstract' drug or drugs or pharmaceutic* or medicament* or medicines or prescrip*or prescrib* |
| World Bank Documents & Reports |
| Limited to sectors: Health, Nutrition and Population or Hospitals, Secondary & Tertiary or Primary health or Reform and Financing drug or drugs or pharmaceutical or pharmaceuticals or medicament or medicaments or medicines or prescription or prescriptions or prescribe or prescribed or prescribing |
| World Bank e‐Library |
| Search fields: 'Title' or 'Abstract' or 'Keywords' drug or drugs or pharmaceutical or pharmaceuticals or pharmaceutic or pharmaceutics or medicament or medicaments or medicines or prescription or prescriptions or prescribe or prescribed or prescribing |
| WHO (World Health Organization) |
| browsed The Essential Drugs and Medicines web site |
| WHOLIS, the WHO library database |
| Search field: 'Words or phrase' words or phrase "prescrib$ or prescrip$" AND words or phrase "regulat$ or requirement$ or restrict$ or monitor$ or control$ or legislation$ or law? or act or acts or policy or policies or politics or reform$ or system? or plan or plans or planning or program? or strateg$ or incentive$" |
| JOLIS, The Library Network, serving the World Bank Group and IMF |
| Search field: ’Keywords Anywhere’. Search done in two separate stages keywords anywhere “prescrib$ or prescrip$” AND keywords anywhere “drug or drugs or pharmaceutic$ or medica$ or medicines” AND keywords anywhere “regulat$ or requirement$ or restrict$ or monitor$ or control$ or legislation$ or law? or act or acts or policy or policies or politics or reform$ or system? or plan or plans or planning or program? or strateg$ or incentive$” |
| Global Jolis, online catalogue for the World Bank Country Office PIC/Libraries |
| Search field: ’Words or Phrase’. Search done in two separate stages 1. prescrib$ or prescrip$ AND drug or drugs or pharmaceutic$ or medica$ or medicines AND regulat$ or requirement$ or restrict$ or monitor$ or control$ or legislation$ or law? or act or acts or policy or policies or politics 2. prescrib$ or prescrip$ AND drug or drugs or pharmaceutic$ or medica$ or medicines AND reform$ or system? or plan or plans or planning or program? or strateg$ or incentive$ |
Appendix 3. EPOC suggested risk of bias criteria
| Risk of bias for studies with a separate control group (RCTs, NRCTs, CBAs) |
| Nine standard criteria are used for all RCTs, NRCTs and CBAs. Further information can be obtained from the Cochrane Handbook for Systematic Reviews of Interventions section on risk of bias and from the draft methods paper on risk of bias under the EPOC‐specific resources section of the EPOC website. Was the allocation sequence adequately generated? Score: “low risk” if a random component in the sequence generation process is described (e.g. referring to a random number table). Score “high risk” when a non‐random method is used (e.g. performed by date of admission). NRCTs and CBA studies should be scored “high risk”. Score “unclear risk” if not specified in the paper. Was the allocation adequately concealed? Score “low risk” if the unit of allocation was by institution, team or professional and allocation was performed on all units at the start of the study; or if the unit of allocation was by patient or episode of care, and some form of centralised randomisation scheme, an on‐site computer system or sealed opaque envelopes were used. CBA studies should be scored “high risk”. Score “unclear risk” if not specified in the paper. Were baseline outcome measurements similar?1,2 Score “Low risk” if performance or patient outcomes were measured prior to the intervention, and no important differences were present across study groups. In RCTs, score “Low risk” if imbalanced but appropriate adjusted analysis was performed (e.g. Analysis of covariance). Score “High risk” if important differences were present and not adjusted for in analysis. If RCTs have no baseline measure of outcome, score “Unclear risk”. Were baseline characteristics similar? Score “Low risk” if baseline characteristics of the study and control providers are reported and similar. Score “Unclear risk” if it is not clear in the paper (e.g. characteristics are mentioned in text but no data were presented). Score “High risk” if there is no report of characteristics in text or tables or if there are differences between control and intervention providers. Note that in some cases imbalance in patient characteristics may be due to recruitment bias whereby the provider was responsible for recruiting patients into the trial. Were incomplete outcome data adequately addressed?1 Score “low risk” if missing outcome measures were unlikely to bias the results (e.g. the proportion of missing data was similar in the intervention and control groups, or the proportion of missing data was less than the effect size, i.e. unlikely to overturn the study result). Score “high risk” if missing outcome data were likely to bias the results. Score “unclear risk” if not specified in the paper (do not assume 100% follow‐up unless stated explicitly). Was knowledge of the allocated interventions adequately prevented during the study?1 Score “low risk” if study authors state explicitly that the primary outcome variables were assessed blindly, or if the outcomes are objective (e.g. length of hospital stay). Primary outcomes are those variables that correspond to the primary hypothesis or question as defined by study authors. Score “high risk” if the outcomes were not assessed blindly. Score “unclear risk” if this is not specified in the paper. Was the study adequately protected against contamination? Score “low risk” if allocation was by community, institution or practice, and it is unlikely that the control group received the intervention. Score “high risk” if it is likely that the control group received the intervention (e.g. if patients rather than professionals were randomly assigned). Score “unclear risk” if professionals were allocated within a clinic or practice, and it is possible that communication between intervention and control professionals could have occurred (e.g. physicians within practices were allocated to intervention or control). Was the study free of selective outcome reporting? Score “low risk” if no evidence suggests that outcomes were selectively reported (e.g. all relevant outcomes in the Methods section are reported in the Results section). Score “high risk” if some important outcomes are subsequently omitted from the results. Score “unclear risk” if not specified in the paper. Was the study free of other risks of bias? Score “low risk” if no evidence suggests other risks of bias. _________________ 1If some primary outcomes were imbalanced at baseline, assessed blindly or affected by missing data and others were not, each primary outcome can be scored separately. 2If “unclear” or “no”, but sufficient data are provided in the paper for an adjusted analysis (e.g. baseline adjustment analysis, intention‐to‐treat analysis), the criteria should be rescored to “yes”. |
| Risk of bias for interrupted time series (ITS) studies |
| Seven standard criteria are used for all ITS studies. Further information can be obtained from theCochrane Handbook on Systematic Reviews of Interventions section on risk of bias and from the draft methods paper on risk of bias under the EPOC specific resources section of the EPOC website. Note: If the ITS study has ignored secular (trend) changes and performed a simple t‐test of before versus after intervention periods without further justification, the study should not be included in the review unless reanalysis is possible. Was the intervention independent of other changes? Score “low risk” if compelling arguments indicate that the intervention occurred independently of other changes over time, and that the outcome was not influenced by other confounding variables/historic events during the study period. If events/variables were identified, note what they are. Score “high risk” if it is reported that the intervention was not independent of other changes in time. Was the shape of the intervention effect prespecified? Score ”low risk” if point of analysis is the point of intervention OR a rational explanation for the shape of the intervention effect was given by the study author(s). When appropriate, this should include an explanation if the point of analysis is NOT the point of intervention; score “high risk” if it is clear that the condition above is not met. Was the intervention unlikely to affect data collection? Score “low risk” if it is reported that the intervention itself was unlikely to affect data collection (e.g. sources and methods of data collection were the same before and after the intervention); score “high risk” if the intervention itself was likely to affect data collection (e.g. any change in source or method of data collection reported). Was knowledge of the allocated interventions adequately prevented during the study?*** Score “low risk” if study authors state explicitly that the primary outcome variables were assessed blindly, or if the outcomes are objective (e.g. length of hospital stay). Primary outcomes are those variables that correspond to the primary hypothesis or question as defined by study authors. Score “high risk” if the outcomes were not assessed blindly. Score “unclear risk” if this is not specified in the paper. Were incomplete outcome data adequately addressed?*** Score “low risk” if missing outcome measures were unlikely to bias the results (e.g. the proportion of missing data was similar in the before‐ and after‐intervention periods, or if the proportion of missing data was less than the effect size (i.e. unlikely to overturn the study result). Score “high risk” if missing outcome data were likely to bias the results. Score “unclear risk” if this was not specified in the paper. (Do not assume 100% follow‐up unless this was stated explicitly.) Was the study free of selective outcome reporting? Score “low risk” if no evidence suggests that outcomes were selectively reported (e.g. all relevant outcomes in the Methods section were reported in the Results section). Score “high risk” if some important outcomes are subsequently omitted from the results. Score “unclear risk” if this was not specified in the paper. Was the study free of other risks of bias? Score “low risk” if no evidence suggests other risks of bias (e.g. should consider if seasonality is an issue, i.e. if January to June constitutes the preintervention period, and July to December the post, could the “seasons’ have caused a spurious effect?). ***If some primary outcomes were assessed blindly or were affected by missing data and others were not, each primary outcome can be scored separately. |
Appendix 4. PRISMA checklist
| Section/Topic | # | Checklist item | Reported in the review |
| TITLE | |||
| Title | 1 | Identify the report as a systematic review, meta‐analysis or both | Yes * |
| ABSTRACT | |||
| Structured summary | 2 | Provide a structured summary including, as applicable, the following: background; objectives; data sources; study eligibility criteria, participants and interventions; study appraisal and synthesis methods; results; limitations; conclusions and implications of key findings; systematic review registration number | Yes |
| INTRODUCTION | |||
| Rationale | 3 | Describe the rationale for the review in the context of what is already known | Yes |
| Objectives | 4 | Provide an explicit statement of questions being addressed with reference to participants, interventions, comparisons, outcomes and study design (PICOS) | Yes |
| METHODS | |||
| Protocol and registration | 5 | Indicate whether a review protocol exists, if and where it can be accessed (e.g. Web address); if available, provide registration information including registration number | Yes |
| Eligibility criteria | 6 | Specify study characteristics (e.g. PICOS, length of follow‐up) and report characteristics (e.g. years considered, language, publication status) used as criteria for eligibility, giving rationale | Yes |
| Information sources | 7 | Describe all information sources (e.g. databases with dates of coverage, contact with study authors to identify additional studies) in the search and the date last searched | Table 3 |
| Search | 8 | Present full electronic search strategy for at least 1 database, including any limits used, such that it could be repeated | Appendices 1‐21 |
| Study selection | 9 | State the process for selecting studies (i.e., screening, eligibility, included in systematic review, and, if applicable, included in the meta‐analysis) | Yes |
| Data collection process | 10 | Describe method of data extraction from reports (e.g. piloted forms, independently, in duplicate) and any processes for obtaining and confirming data from investigators | Yes |
| Data items | 11 | List and define all variables for which data were sought (e.g. PICOS, funding sources) and any assumptions and simplifications made | Yes |
| Risk of bias in individual studies | 12 | Describe methods used in assessing risk of bias of individual studies (including specification of whether this was done at the study or outcome level), and how this information is to be used in any data synthesis | Yes |
| Summary measures | 13 | State the principal summary measures (e.g. risk ratio, difference in means) | Yes (median values) |
| Synthesis of results | 14 | Describe the methods of handling data and combining results of studies, if done, including measures of consistency (e.g. I2), for each meta‐analysis | Yes |
| Section/Topic | # | Checklist item | Reported on page # |
| Risk of bias across studies | 15 | Specify any assessment of risk of bias that may affect the cumulative evidence (e.g. publication bias, selective reporting within studies) | Yes |
| Additional analyses | 16 | Describe methods of additional analyses (e.g. sensitivity or subgroup analyses, meta‐regression), if done, indicating which were prespecified | Yes |
| RESULTS | |||
| Study selection | 17 | Give numbers of studies screened, assessed for eligibility and included in the review, with reasons for exclusions at each stage, ideally with a flow diagram | Yes. In the text ‐ also "Characteristics of excluded studies" |
| Study characteristics | 18 | For each study, present characteristics for which data were extracted (e.g. study size, PICOS, follow‐up period) and provide the citations | Yes |
| Risk of bias within studies | 19 | Present data on risk of bias of each study and, if available, any outcome level assessment (see item 12) | Additional Tables 3, 4; Appendices 4, 5 |
| Results of individual studies | 20 | For all outcomes considered (benefits or harms), present, for each study, the following: (a) simple summary data for each intervention group, and (b) effect estimates and confidence intervals, ideally with a forest plot | Tables of "Characteristics of included studies" |
| Synthesis of results | 21 | Present results of each meta‐analysis done, including confidence intervals and measures of consistency | N/A |
| Risk of bias across studies | 22 | Present results of any assessment of risk of bias across studies (see Item 15) | Summary of findings tables |
| Additional analysis | 23 | Give results of additional analyses, if done (e.g. sensitivity or subgroup analyses, meta‐regression [see Item 16]) | Tables 6 to 10 |
| DISCUSSION | |||
| Summary of evidence | 24 | Summarise the main findings including strength of the evidence for each main outcome; consider their relevance to key groups (e.g. healthcare providers, users and policy makers) | Yes |
| Limitations | 25 | Discuss limitations at study and outcome levels (e.g. risk of bias) and at review level (e.g. incomplete retrieval of identified research, reporting bias) | Yes |
| Conclusions | 26 | Provide a general interpretation of the results in the context of other evidence, and implications for future research | Yes |
| FUNDING | |||
| Funding | 27 | Describe sources of funding for the systematic review and other support (e.g. supply of data); the role of funders for the systematic review | Yes |
* The "Yes" indicates that the relevant information can be found under the subheading in the RevMan file, as it was not possible to identify page numbers within the RevMan file
Appendix 5. Abbreviations
| CBA | Controlled before‐and‐after |
| CCT | Controlled clinical trial |
| CI | Confidence interval |
| CITS | Controlled interrupted time series |
| CRM | Controlled repeated measures |
| DDD | defined daily doses |
| DMP | Disease management programme |
| EPOC | Effective Practice and Organisation of Care |
| FH | Fund‐holding (fund‐holders) |
| H2RA | Histamine‐2 receptor antagonist |
| GP | General practitioner |
| Item | Defined as each preparation on the prescription |
| ITS | Interrupted time series |
| IDTSS | Indicative Drug Target Savings Scheme (Ireland) |
| NIC | Net ingredient costs |
| OECD | Organisation for Economic Co‐operation and Development |
| PACT | Prescribing analysis and cost (data used in British fund‐holding) |
| PPI | Proton pump inhibitors |
| PU | Prescribing unit; allows for demographic differences between practices. Patients younger than age 65 are counted as a single prescribing unit, and those aged 65 and over count as three. Astro PU in addition corrects for age, sex and temporary residency |
| RCT | Randomised controlled trial |
| RM | Repeated measures |
| RR | Risk ratio (intervention vs control group) |
| RR (adj) | Risk ratio (adjusted for preintervention differences) = RR after intervention/RR before intervention |
| SPR | Standard prescribing ratio |
| SSRI | Selective serotonin reuptake inhibitors |
| WHO | World Health Organization |
Characteristics of studies
Characteristics of included studies [ordered by study ID]
Baines 1997c.
| Methods | CBA Serious limitations | |
| Participants | Setting: UK, Lincolnshire and Devon Fund‐holders (FH) (1st to 3rd wave) Lincolnshire: 19 Devon: 22 Non‐FH: Linc: 86/Devon: 106 Unit: practice | |
| Interventions | UK, NHS fund‐holding | |
| Outcomes | Drug use (generics) Costs (per patient) |
|
| Notes | Only long‐term effects were reported in the analysis, as data for waves 1 to 3 have been aggregated by the authors | |
| Risk of bias | ||
| Bias | Authors' judgement | Support for judgement |
| Random sequence generation (selection bias) | High risk | Random allocation was not used |
| Allocation concealment (selection bias) | High risk | This is a CBA study without adequate allocation concealment |
| Baseline outcome measurements | High risk | Prescribing costs were measured as net ingredient costs per patient before the intervention among fund‐holders and non‐fund‐holders in Lincolnshire and Devon. Results show a difference between the non‐fund‐holding group and other groups in prescribing per patient during 1990 to 1991 (before the intervention) |
| Baseline characteristics | High risk | Fund‐holders and non‐fund‐holders in Lincolnshire and Devon were compared, and no matching process was done |
| Incomplete outcome data (attrition bias) All outcomes | Unclear risk | No discussion was provided in the text about missing data |
| Knowledge of the allocated interventions adequately prevented during the study | Unclear risk | Study authors did not identify whether outcomes were assessed blindly |
| Protection against contamination | Low risk | Control groups consisted of non‐fund‐holders before the introduction of fund‐holding; no possibility of contamination |
| Selective outcome reporting (reporting bias) | Unclear risk | Missing data were not mentioned in the article |
| Other risks of bias | Unclear risk | It is not clear whether the study was free of other risks of bias |
Bradlow 1993.
| Methods | CBA Serious limitations | |
| Participants | Setting: UK, Oxford FH (1st wave): 5 Non‐FH: 7 Unit: practice | |
| Interventions | UK, NHS fund‐holding | |
| Outcomes | Drug use (items, generics
Costs (per patient, per item) Cost: total net cost per 1000 PU, mean cost per item, net cost per 1000 PU, mean cost per item |
|
| Notes | Dispensing group was excluded from the analysis as it was not comparable with the control group | |
| Risk of bias | ||
| Bias | Authors' judgement | Support for judgement |
| Random sequence generation (selection bias) | High risk | Random allocation was not used |
| Allocation concealment (selection bias) | High risk | This was a CBA study without adequate allocation concealment |
| Baseline outcome measurements | Low risk | In both intervention and control groups, the number of items prescribed and the cost per item prescribed were measured before the intervention, and no important differences were noted across groups |
| Baseline characteristics | Unclear risk | Baseline characteristics of fund‐holding and non‐fund‐holding practices were not similar, and no matching was mentioned in the paper |
| Incomplete outcome data (attrition bias) All outcomes | Low risk | No important missing data were reported |
| Knowledge of the allocated interventions adequately prevented during the study | Unclear risk | It is not clear whether primary outcomes were assessed blindly |
| Protection against contamination | Low risk | Reforms affected only the intervention group |
| Selective outcome reporting (reporting bias) | Low risk | All related outcome data were reported |
| Other risks of bias | Unclear risk | It is not clear whether the study was free of other risks of bias |
Burr 1992.
| Methods | CBA Serious limitations | |
| Participants | Setting: UK, Mid‐Glamorgon FH (1st wave): 4 Non‐FH: 4 Unit: practices | |
| Interventions | UK, NHS fund‐holding | |
| Outcomes | Drug use (items) Costs (per patient) | |
| Notes | ||
| Risk of bias | ||
| Bias | Authors' judgement | Support for judgement |
| Random sequence generation (selection bias) | High risk | Random allocation was not used |
| Allocation concealment (selection bias) | High risk | This was a CBA study without adequate allocation concealment |
| Baseline outcome measurements | Low risk | Costs per 1000 patients were measured in both intervention and control groups. No important differences between outcomes were noted among fund‐holder and general practitioner groups before the intervention |
| Baseline characteristics | Unclear risk | No data were reported in the article about fund‐holder and GP characteristics before the intervention |
| Incomplete outcome data (attrition bias) All outcomes | Unclear risk | This was not specified in the article |
| Knowledge of the allocated interventions adequately prevented during the study | Low risk | Primary outcomes were assessed blindly |
| Protection against contamination | Low risk | The policy affected only the intervention group |
| Selective outcome reporting (reporting bias) | Unclear risk | This was not specified in the paper |
| Other risks of bias | Unclear risk | It was not clear whether the study was free of other risks of bias |
Chou 2008.
| Methods | ITS | |
| Participants | Setting: Taiwan, Taipei area 213,570 hypertensive patients (5,937,581 visits) plus 83,985 patients with diabetes (2,613,843 visits) All patients from 26 hospitals in the Taipei area in Thilanl, then hypertensive and diabetic patients, were included in the study. Hypertensive patients group: 108,142 male (average age 63.5 ± 13.5 years), 105,426 female (64.5 ± 12.2 years). Diabetic patients group: 42,272 male (61.8 ± 13.2 years) and 41,713 female (64.0 ± 12.1 years). Time series data included 8 points before and 12 points after the intervention |
|
| Interventions | Global budget, based on an ”individual expenditure cap”. Medical providers will find that the more services they provide, the less net profit they make. Later, the NHI will negotiate an individual expenditure cap with each hospital. Consequently, each hospital will maximise its net profit under the predetermined allowance | |
| Outcomes | Drug use (items per prescription) Costs (per prescription) | |
| Notes | ||
| Risk of bias | ||
| Bias | Authors' judgement | Support for judgement |
| Intervention independent of other changes (ITS) | Unclear risk | National Health Insurance (NHI) global budget (GB) programme will be associated with other effective changes during the study period |
| Shape of the intervention effect pre‐specified (ITS) | High risk | The point of analysis is not the point of intervention |
| Intervention unlikely to affect data collection (ITS) | Low risk | Data collection method was the same before and after the intervention |
| Knowledge of the allocated interventions adequately prevented during the study (ITS) | Unclear risk | It was not mentioned whether main outcomes were assessed blindly |
| Incomplete outcome data adequately addressed (ITS) | High risk | No information was provided about the effects of missing outcome data on results |
| Selective outcome reporting (ITS) | Low risk | Prescription trends of the before‐GB and after‐GB periods for patients with hypertension and diabetes mellitus and costs were clearly reported |
| Other risks of bias (ITS) | Unclear risk | Claims data were constructed principally for reimbursement purposes. As a result, financial incentives influenced the patient's diagnosis included in the medical claims. This fact could change our average cost per patient, but not the total costs |
Chu 2008.
| Methods | CBA | |
| Participants | Setting: Taiwan, Taipei area Case group: patients with hypertension aged 65 and older in hospitals that implemented physician fee programmes Control group: hospitals that did not implement physician fee programmes |
|
| Interventions | For drug reimbursement, with about 20,000 drug items in the list. Healthcare organisations (e.g. hospitals) purchased prescription drugs from pharmaceutical companies and received reimbursements from the BNHI based on predetermined rates. This aimed first to equalise profits among different drugs, then to reduce overall drug profits within the health industry | |
| Outcomes | Drug use (items per prescription) Costs (per prescription) |
|
| Notes | 8 points before and 12 points after the intervention with 1‐ to 3‐month interval between January 2002 and December 2007 | |
| Risk of bias | ||
| Bias | Authors' judgement | Support for judgement |
| Random sequence generation (selection bias) | High risk | Random allocation was not used |
| Allocation concealment (selection bias) | High risk | This was a CBA study without adequate allocation concealment |
| Baseline outcome measurements | Low risk | Drug costs and numbers of prescriptions were measured in 1999 to 2000 before the drug reimbursement rate reduction policy was applied in hospitals with and without physician fee programmes. However this was not mentioned exactly in the text. Data delivered in tables showed small differences in baseline data between the 2 groups |
| Baseline characteristics | Unclear risk | Characteristics were not reported in text or in tables, and evidence did not show whether differences between controls and hospitals were apparent in physician fee programmes |
| Incomplete outcome data (attrition bias) All outcomes | Low risk | Incomplete outcome data were addressed adequately in the paper |
| Knowledge of the allocated interventions adequately prevented during the study | Unclear risk | Study authors did not specify whether drug costs and other outcomes were assessed blindly |
| Protection against contamination | Low risk | In the control group, hospitals had no physician fee programme and prescribing happened with no drug reimbursement rate reduction policy |
| Selective outcome reporting (reporting bias) | Low risk | Prescribing rates and drug costs were reported adequately |
| Other risks of bias | High risk | Physicians could prescribe only drugs listed on their hospital formulary. Hospitals may affect physicians’ prescribing behaviour through drug purchase practices. Therefore, changes in drug items in the formulary may fall beyond the control of most physicians |
Corney 1997.
| Methods | CBA Serious limitations | |
| Participants | Setting: UK, South Thames region FH (2nd wave): 4 Non‐FH: 4 Unit: practice | |
| Interventions | UK, NHS fund‐holding | |
| Outcomes | Costs (per patient) | |
| Notes | 1st wave experimental group was excluded because no baseline information was provided | |
| Risk of bias | ||
| Bias | Authors' judgement | Support for judgement |
| Random sequence generation (selection bias) | High risk | Random allocation was not used |
| Allocation concealment (selection bias) | High risk | This was a CBA study without adequate allocation concealment |
| Baseline outcome measurements | Low risk | Same baseline outcomes were collected from both fund‐holding and non‐fund‐holding groups before the intervention (same questionnaires, costs per prescribing unit, ...). With costs per prescribing unit under consideration, costs of first‐wave fund‐holders were lower than those of non‐fund‐holders, and this differential remained unchanged over the 4 years of the study |
| Baseline characteristics | High risk | Fund‐holder and non‐fund‐holder groups with different characteristics were compared |
| Incomplete outcome data (attrition bias) All outcomes | Low risk | Missing data were addressed in the Results section |
| Knowledge of the allocated interventions adequately prevented during the study | Unclear risk | Study authors did not specify in the paper whether outcomes were assessed blindly |
| Protection against contamination | Low risk | It is not likely that non‐fund‐holders as the control group received the intervention before and after the fund‐holding scheme |
| Selective outcome reporting (reporting bias) | Unclear risk | It was not specified in the paper whether any evidence suggests that outcomes were selectively reported |
| Other risks of bias | Unclear risk | Not clearly free from other bias |
Doran 2011.
| Methods | ITS | |
| Participants | Setting: UK 653,500 patients from 148 practices that provided data to the GPRD continuously between January 2000 and December 2007 |
|
| Interventions | The quality and outcomes framework, introduced in 2004, links up 25% of UK family practitioner income to performance on 76 clinical quality indicators and 70 indicators related to organisation of care and patient experience. Of the clinical indicators, 10 related to maintaining disease registers, 56 to processes of care (including prescribing) and 10 to intermediate outcomes (such as controlling blood pressure). In 2007, each point earned the practice £125 (€141; $202), adjusted for patient population size and disease prevalence. A maximum of 1000 points was available, equating to £31,000 per physician | |
| Outcomes | Drug use (percentage of patients receiving the recommended incentivised medicines) | |
| Notes | 3 points before and 3 points after the intervention with annual interval between January 2000 and December 2007 | |
| Risk of bias | ||
| Bias | Authors' judgement | Support for judgement |
| Intervention independent of other changes (ITS) | Low risk | Achievement rates as an outcome were affected only by intervention (quality and outcomes frameworks); the role of other changes did not seem to be substantial |
| Shape of the intervention effect pre‐specified (ITS) | Unclear risk | It was not clear whether the point of intervention and the point of analysis were similar |
| Intervention unlikely to affect data collection (ITS) | Low risk | Both before‐intervention and after‐intervention data were collected from the General Practice Research Database (GPRD) |
| Knowledge of the allocated interventions adequately prevented during the study (ITS) | Low risk | Analyses were performed blindly |
| Incomplete outcome data adequately addressed (ITS) | High risk | Missing outcome data were likely to bias the results |
| Selective outcome reporting (ITS) | Low risk | No evidence of selective data reporting was found; all related data were reported |
| Other risks of bias (ITS) | Unclear risk | Changes in case mix over time might have affected achievement rates, particularly if changes in case finding activity occurred under the incentive scheme |
Granlund 2006.
| Methods | CBA | |
| Participants | Setting: Sweden, Väster botten Case group: 2 health centres, health centres located in Väster botten (those of Burträsk and Moröbacke), obtained fixed budgets Control group: other health centres, health centres that had a target Budgets |
|
| Interventions | In 2001, the 2 health centres were given fixed budgets for pharmaceutical expenditures, giving them an incentive to decrease expenditures, as they were allowed to keep any surplus (and were forced to repay any deficit) generated during the year | |
| Outcomes | Drug use (prescription per patient, DDD per prescription) Costs (per prescription, per DDD) |
|
| Notes | ||
| Risk of bias | ||
| Bias | Authors' judgement | Support for judgement |
| Random sequence generation (selection bias) | High risk | Random allocation was not used |
| Allocation concealment (selection bias) | High risk | This was a CBA study without adequate allocation concealment |
| Baseline outcome measurements | Low risk | Prescription patterns including prices and quantities at treatment health centres (average price per defined daily dose and average number of DDDs per prescription) were measured before implementation of a fixed budget. However this was not mentioned exactly in the text. Data were delivered in tables showing small differences in baseline data between the 2 groups |
| Baseline characteristics | Low risk | Matching with control group at both health centres was done |
| Incomplete outcome data (attrition bias) All outcomes | Low risk | 6% of observations with missing data were excluded |
| Knowledge of the allocated interventions adequately prevented during the study | Unclear risk | No blind assessments were reported |
| Protection against contamination | Low risk | Both Burtrask and Morobacke health centres were assessed before fixed budgets were introduced |
| Selective outcome reporting (reporting bias) | Low risk | All data about prescribing quality and quantity were reported in the paper |
| Other risks of bias | Unclear risk | Other risk of bias was possible |
Guether 1995.
| Methods | ITS Some limitations | |
| Participants | Setting: West Germany Statutory health insurance General practitioners: 82 Unit: GPs. 4 observations before the intervention and 4 observations after the intervention | |
| Interventions | German drug budget | |
| Outcomes | Drug use (prescriptions) Health‐care utilisation (referrals) | |
| Notes | ||
| Risk of bias | ||
| Bias | Authors' judgement | Support for judgement |
| Intervention independent of other changes (ITS) | High risk | Several policies introduced simultaneously (for example reference pricing and copayments) |
| Shape of the intervention effect pre‐specified (ITS) | Low risk | Similar point of intervention and analysis. |
| Intervention unlikely to affect data collection (ITS) | Low risk | Routine data sources of similar origins were used |
| Knowledge of the allocated interventions adequately prevented during the study (ITS) | Low risk | Unlike to affect the analysis in this study |
| Incomplete outcome data adequately addressed (ITS) | Unclear risk | Few data points might have affected the analyses |
| Selective outcome reporting (ITS) | Low risk | No evidence of selective outcome reporting was observed |
| Other risks of bias (ITS) | Low risk | No evidence of other risks of biases affecting the results. |
Harris 1996.
| Methods | CITS Serious/some limitations | |
| Participants | Setting: UK, England
All general practices
Unit: practice Unit: practice 4 observations before and 20 observations after the intervention |
|
| Interventions | UK, NHS fund‐holding | |
| Outcomes | Drug use (items) Costs (per patient) |
|
| Notes | 1 year before and 5 years after the intervention, with annual interval between April 1990 and March 1996 | |
| Risk of bias | ||
| Bias | Authors' judgement | Support for judgement |
| Intervention independent of other changes (ITS) | High risk | Interventions did not occur independently. Thus other changes would affect outcomes |
| Shape of the intervention effect pre‐specified (ITS) | Low risk | The intervention point seemed similar to the analysis point |
| Intervention unlikely to affect data collection (ITS) | Low risk | In before‐intervention and after‐intervention periods, methods of data collection were the same (Prescription Pricing Authority) |
| Knowledge of the allocated interventions adequately prevented during the study (ITS) | Low risk | Primary outcome variables were assessed blindly |
| Incomplete outcome data adequately addressed (ITS) | Unclear risk | No data were available to show the incomplete outcome data |
| Selective outcome reporting (ITS) | Low risk | Relative outcome results were adequately reported |
| Other risks of bias (ITS) | High risk | It is possible that fund‐holding practices gave their patients private prescriptions more often than did non‐fund‐holders when the cost to the patient was lower than the prescription charge. Non‐fund‐holding practices as comparators may differ in many ways from fund‐holding practices and have undergone different kinds of changes over the 6 years |
Martens 2007.
| Methods | CBA | |
| Participants | Setting: south of Netherland, District Health Authority, in South West England
Case group: 119 GPs in the intervention region (south of the Netherlands) received a financial incentive Control group: 118 GPs in a control region (no financial incentive) Both groups were equally familiar with existing national evidence‐based guidelines on antibiotics and gastric drugs and were equally exposed to medical education offered nationwide |
|
| Interventions | A financial incentive was provided for prescribing according to local guidelines on specific drugs or drug categories. The financial incentive consisted of a 1‐off bonus (target payment), which was performance independent and was given to all GPs. In return for this financial incentive, GPs should adhere to relevant prescription guidelines abstracted in a 1‐page printed formulary that was developed by a multi‐disciplinary committee | |
| Outcomes | Drug use (prescription per (1000) patient) | |
| Notes | ||
| Risk of bias | ||
| Bias | Authors' judgement | Support for judgement |
| Random sequence generation (selection bias) | High risk | Random allocation was not used |
| Allocation concealment (selection bias) | High risk | This was a CBA study without adequate allocation concealment |
| Baseline outcome measurements | Low risk | Same outcomes were measured before intervention in both control and intervention groups (number of prescriptions per 1000 patients per GP). However this was not mentioned exactly in the text. Data that were presented in tables show small differences in baseline data between the 2 groups |
| Baseline characteristics | Low risk | Participants in control and intervention groups were GPs in 2 regions of the Netherlands, and were members of the Dutch Society of General Practitioners. Therefore, it can be assumed that both groups were adequately similar |
| Incomplete outcome data (attrition bias) All outcomes | Low risk | It was mentioned that if any data were missing, they were equally distributed over intervention and control groups, so this had no effect on the results |
| Knowledge of the allocated interventions adequately prevented during the study | Unclear risk | It was not mentioned whether data were assessed blindly |
| Protection against contamination | Low risk | The contrast between groups consisted of receiving the financial incentive and being aware of the performance being checked |
| Selective outcome reporting (reporting bias) | Low risk | All related data were reported |
| Other risks of bias | Unclear risk | Not clearly free of other risks of bias |
Rafferty 1997.
| Methods | CITS Serious/some limitations | |
| Participants | Setting: UK, Northern Ireland Fund‐holding (1st wave): 23 Fund‐holding (2nd wave): 34 Fund‐holding (3rd wave): 9 Non‐fund‐holding: all in Northern Ireland Unit: practice | |
| Interventions | UK, NHS fund‐holding | |
| Outcomes | Drug use (prescriptions, generics) Costs (per patient, per item) | |
| Notes | 4 points before and 3 points after the intervention with annual interval between April 1989 and March 1996 | |
| Risk of bias | ||
| Bias | Authors' judgement | Support for judgement |
| Intervention independent of other changes (ITS) | High risk | Outcomes such as prescribing patterns seem be affected by changes over time |
| Shape of the intervention effect pre‐specified (ITS) | Low risk | The shape of the intervention effect was defined clearly by study authors |
| Intervention unlikely to affect data collection (ITS) | Low risk | In all periods of the study, data were collected from the database built from data downloaded from the Central Services Agency, whose system was designed for reimbursing pharmacists |
| Knowledge of the allocated interventions adequately prevented during the study (ITS) | Low risk | Analysis of primary outcome measures was done blindly |
| Incomplete outcome data adequately addressed (ITS) | Unclear risk | No evidence showed whether missing data affected the results |
| Selective outcome reporting (ITS) | Low risk | All related outcome measures were reported in the Results |
| Other risks of bias (ITS) | High risk | The study will contain other risks of bias |
Schöffski 1997.
| Methods | ITS Some limitations | |
| Participants | Setting: Germany, Statutory Sickness funds 309 to 382 practices Unit: practice | |
| Interventions | German drug budget | |
| Outcomes | Healthcare utilisation (referral rate, hospitalisation) | |
| Notes | 12 points before and 12 points after the intervention with 1‐month interval between January 1992 and December 1993 | |
| Risk of bias | ||
| Bias | Authors' judgement | Support for judgement |
| Intervention independent of other changes (ITS) | High risk | Results and outcomes were influenced by other confounding factors, not only by drug budgets. |
| Shape of the intervention effect pre‐specified (ITS) | Low risk | The point of intervention and the point of analysis were similar |
| Intervention unlikely to affect data collection (ITS) | Low risk | The same data bank was used for data gathering before and after drug budget implementation |
| Knowledge of the allocated interventions adequately prevented during the study (ITS) | Low risk | Primary outcomes: Numbers of referrals and hospital admissions were assessed blindly |
| Incomplete outcome data adequately addressed (ITS) | High risk | Missing outcome data were not clearly addressed |
| Selective outcome reporting (ITS) | Low risk | Outcomes in the methods were similar to outcomes reported in the Results |
| Other risks of bias (ITS) | Unclear risk | The referral system was changed in 1994 to 1995 by introducing a credit card‐like voucher called "Chip Card", which changed referral registration and behaviour again. As the result of missing data and fluctuations in the data bank, only physicians for whom complete data were available for both corresponding months in 1992 and 1993 were included. This means that the data bank was reduced to matched pairs for each month, covering between 309 and 382 physicians |
Serumaga 2011.
| Methods | ITS | |
| Participants | Setting: United Kingdom, 4 countries of the United Kingdom (England, Scotland, Wales and Northern Ireland) 470,725 patients with a diagnosis of hypertension during the observation period (January 2000 to July 2007) |
|
| Interventions | In April 2004, a large‐scale pay for performance policy was applied in the 4 countries of the United Kingdom (England, Scotland, Wales and Northern Ireland). On the basis of the proportions of patients achieving certain quality indicators, general practitioners could receive payments as high as 25% of their total income. 136 quality indicators such as prescribing outcomes were included | |
| Outcomes | Health outcomes (percentage of patients with controlled blood pressure) | |
| Notes | 26 points before and 37 points after the intervention with 1‐month interval between January 2000 and June 2007 | |
| Risk of bias | ||
| Bias | Authors' judgement | Support for judgement |
| Intervention independent of other changes (ITS) | High risk | Outcomes would be influenced by various confounding factors during the years, not only pay for performance |
| Shape of the intervention effect pre‐specified (ITS) | Low risk | Point of intervention and point of analysis were the same |
| Intervention unlikely to affect data collection (ITS) | Low risk | The intervention itself was not likely to affect data collection |
| Knowledge of the allocated interventions adequately prevented during the study (ITS) | Low risk | Primary outcomes were objective: systolic and diastolic blood pressures over time, rates of blood pressure monitoring, blood pressure control |
| Incomplete outcome data adequately addressed (ITS) | Unclear risk | Missing outcome data were not mentioned by study authors in the article |
| Selective outcome reporting (ITS) | Low risk | Related outcomes were reported clearly after analysis |
| Other risks of bias (ITS) | Unclear risk | Interventions were implemented in all 4 UK countries and had no suitable comparison group. Therefore researchers were not able to follow similar populations for which these interventions were not implemented |
Walley 2000.
| Methods | ITS Some limitations | |
| Participants | Setting: Ireland, Eastern Health Board cohort of 223 general practitioners Unit: GPs | |
| Interventions | Ireland Indicative Drug Targeting Savings Scheme (IDTSS) | |
| Outcomes | Drug use (items) Costs (per item, per patient) | |
| Notes | Cohorts merged, 3 points before and 3 points after the intervention with annual interval between 1990 and 1995 | |
| Risk of bias | ||
| Bias | Authors' judgement | Support for judgement |
| Intervention independent of other changes (ITS) | High risk | The Indicative Drug Target Savings Scheme (IDTSS) was not the only factor that influenced outcomes. Several factors affected the results |
| Shape of the intervention effect pre‐specified (ITS) | Low risk | The shape of the intervention effect was defined clearly by the study authors |
| Intervention unlikely to affect data collection (ITS) | Low risk | Methods of data gathering and resources were the same before and after the intervention |
| Knowledge of the allocated interventions adequately prevented during the study (ITS) | Low risk | Outcomes were not objective, but the primary outcome variables were assessed blindly |
| Incomplete outcome data adequately addressed (ITS) | Unclear risk | It was not clear whether all missing outcomes measures were similar before and after intervention periods, and this was unlikely to bias the results |
| Selective outcome reporting (ITS) | Low risk | All relative outcomes were reported in the Results section |
| Other risks of bias (ITS) | Unclear risk | More effects than interventions should have influenced reported outcomes. It was not mentioned whether all prescribers were blind to the intervention |
Whynes 1997.
| Methods | CBA Serious limitations | |
| Participants | Setting: UK, Lincolnshire FH (4th wave): 23 Non‐FH: 63 Unit: practice | |
| Interventions | UK, NHS fund‐holding | |
| Outcomes | Drug use (items, generics) Costs (per patient) | |
| Notes | Waves 1 to 3 (aggregated) were not included in the analysis because no adequate baseline/intervention period was included | |
| Risk of bias | ||
| Bias | Authors' judgement | Support for judgement |
| Random sequence generation (selection bias) | High risk | Random allocation was not used |
| Allocation concealment (selection bias) | High risk | This was a CBA study without adequate allocation concealment |
| Baseline outcome measurements | Low risk | In both control and intervention groups, costs per patient were assessed at the baseline period. No important differences in outcome measurements were noted before the fund‐holding scheme |
| Baseline characteristics | Unclear risk | No report described baseline characteristics in text or in tables or indicated whether differences between fund‐holders and non‐fund‐holders affected the results |
| Incomplete outcome data (attrition bias) All outcomes | Unclear risk | This was not mentioned in the text |
| Knowledge of the allocated interventions adequately prevented during the study | Unclear risk | No data were provided to clarify whether primary outcome variables were assessed blindly |
| Protection against contamination | Low risk | Control group did not receive the intervention policy |
| Selective outcome reporting (reporting bias) | Low risk | All prescribing data were reported |
| Other risks of bias | Unclear risk | It was not clear whether the study was affected by other risks of bias |
Wilson 1995.
| Methods | CITS Serious/some limitations | |
| Participants | Setting: UK, North West Regional Health Authority Fund‐holding (1st wave): 20 Fund‐holding (2nd wave): 31 Fund‐holding (3rd wave): 49 Non‐fund‐holding: 312 Unit: practice | |
| Interventions | UK, NHS fund‐holding | |
| Outcomes | Drug use (items, generics) Costs (per patient, per item) | |
| Notes | 12 points before and 12 points after the intervention with a 1‐month interval between April 1990 and March 1994. For each wave, two years of data were provided (i.e. 24 data points) Wave 1: 90 to 92; wave 2: 91 to 93; wave 3: 92 to 94 |
|
| Risk of bias | ||
| Bias | Authors' judgement | Support for judgement |
| Intervention independent of other changes (ITS) | High risk | Outcomes were influenced by other variables during study periods |
| Shape of the intervention effect pre‐specified (ITS) | Low risk | The point of analysis and the point of intervention were similar |
| Intervention unlikely to affect data collection (ITS) | Low risk | The prescribing analysis and cost (PACT) data were used before and after the intervention |
| Knowledge of the allocated interventions adequately prevented during the study (ITS) | Low risk | Primary outcomes were assessed blindly |
| Incomplete outcome data adequately addressed (ITS) | Low risk | Missing outcome data in full text were addressed and seem to have not affected the results |
| Selective outcome reporting (ITS) | Low risk | All outcomes were given in the Methods and were reported in the Results |
| Other risks of bias (ITS) | High risk | Such incentives focused on cost rather than on cost‐effectiveness. Improvements in cost containment must not be made to the detriment of prescribing quality ‐ a point emphasised by local prescribing advisors |
Wilson 1999.
| Methods | CBA Serious limitations | |
| Participants | Setting: UK 5 health authorities in NW region | |
| Interventions | UK, NHS fund‐holding | |
| Outcomes | Drug use (DDD, drug subgroups) Costs (per patient, per DDD) | |
| Notes | ||
| Risk of bias | ||
| Bias | Authors' judgement | Support for judgement |
| Random sequence generation (selection bias) | High risk | Random allocation was not used |
| Allocation concealment (selection bias) | High risk | This was a CBA study without adequate allocation concealment |
| Baseline outcome measurements | Low risk | Prescribing patterns were measured before the intervention. No important differences in outcomes were noted before the intervention |
| Baseline characteristics | Low risk | The third and fourth waves of fund‐holding practices were compared with those of matched non‐fund‐holding practices; no differences were found |
| Incomplete outcome data (attrition bias) All outcomes | Unclear risk | No obvious data about missing outcomes can be found |
| Knowledge of the allocated interventions adequately prevented during the study | Unclear risk | It is not specified whether outcomes were assessed blindly |
| Protection against contamination | Low risk | Non‐fund‐holders were clear of the intervention |
| Selective outcome reporting (reporting bias) | Low risk | All prescribing data such as costs, volume and… were adequately reported |
| Other risks of bias | Unclear risk | The matching process could not account for all possible confounders and may even have introduced some confounders |
CBA: controlled before‐after; CITS: controlled interrupted time series; DDD: defined daily doses; FH: fund‐holding; GB: global budget; GP: general practitioner; GPRD: General Practice Research Database; IDTSS: Ireland Indicative Drug Targeting Savings Scheme; ITS: interrupted time series; NHS: National Health Service; PACT: prescribing analysis and cost; PU: prescribing unit.
Characteristics of excluded studies [ordered by study ID]
| Study | Reason for exclusion |
|---|---|
| Andersson 2009 | Uncontrolled after ‐only study |
| Ashworth 2004 | Uncontrolled after ‐only study |
| Bain 1993 | After‐only study without control group |
| Baines 1997 | Cross‐sectional |
| Baines 1997b | No baseline data |
| Bateman 1996 | Observational study/ No control group |
| Bergström 2007 | Qualitative case study |
| Bhargava 2010 | No relevant intervention |
| Bhatti 2007 | No relevant intervention |
| Black 2009 | No relevant intervention |
| Bryant 2005 | Type of study (descriptive) and type of intervention (no explicit financial incentive for prescribers) |
| Campbell 2007 | Uncontolled before‐after study; too few data points |
| Campbell 2009 | Uncontolled before‐after study; too few data points |
| Chang 2009 | Uncontolled before‐after study |
| Chen 2008 | No appropriate control group |
| Chernew 2000 | No baseline/ No control group |
| Chou 2010 | Before‐after study without a "no intervention" control group; not enough data for re‐analysis as an ITS study |
| Chu 2008b | No appropriate control group |
| Chu 2010 | No relevant intervention |
| Chung 2010a | No baseline data |
| Chung 2010b | Before‐after study without "no intervention" control group |
| Coulter 1993 | No adequate control group |
| Curttis 2003 | Not a primary study |
| Danzon 1997 | Multiple interventions measured simultaneously; effects of drug budgets cannot be extracted separately |
| Delmar 2006 | Not a primary study |
| Doshi 2010 | Not enough available data |
| Dusheiko 2003 | No relevant outcome |
| Edgar 1999 | No baseline data |
| Elhayany 2001 | No relevant intervention |
| Elliott 2010 | Uncontrolled before‐after study |
| Etter 1998 | 2 interventions at the same time not possible with outcomes of the budget cap intervention |
| Fear 1994 | Evaluated only a pre‐fund‐holding pilot project with no real incentives |
| Hespanhol 2005 | No relevant intervention |
| Hoffman 2010 | Uncontrolled before‐after study |
| Hoopmann 1995 | Cross‐sectional |
| Houghton 1998 | Some providers had received the intervention at baseline, before the study started |
| Howie 1995 | Evaluates a "shadow fund‐holding" project, pre‐fund‐holding; overlaps with the start of real fund‐holding |
| Jacobson 2006 | Before‐only study |
| Jünger 2000 | Uncontrolled before‐after study |
| Kaestner 2012 | No relevant intervention |
| Kammerling 1996 | No relevant outcome |
| Landon 2007 | No relevant intervention |
| Lee 2007 | No relevant outcome |
| Li 2008 | No relevant intervention |
| Ling 2008 | Uncontrolled before‐after study |
| Liu 2009 | No relevant intervention |
| Malcolm 1999 | Uncontrolled before‐after study |
| Malcolm 2001 | Uncontrolled before‐after study |
| Maxwell 1993 | Evaluates a "shadow fund‐holding" project, pre‐fund‐holding; overlaps with the start of real fund‐holding |
| Maynard 2010 | Not a primary study |
| Millet 2007 | Uncontrolled before‐after study |
| Mossalios 2005 | Not a primary study |
| Newton 1993 | After‐only study without control group |
| O'Malley 2006 | Not enough data; financial pay for performance incentive is supported by a pharmacist detailing programme |
| Ohlsson 2007 | After‐only study |
| Peabody 2011 | No relevant outcome |
| Prokes 2009 | No relevant intervention |
| Sakshaug 2007 | No relevant intervention |
| Schmidt 2006 | No control group and no time series data |
| Schreyögg 2004 | Inappropriate selection of time series design to assess effect, as the time series was strongly influenced by historical events (Germany reunification) |
| Schreyögg 2005 | Inappropriate selection of time series design to assess effect, as the time series was strongly influenced by historical events (Germany reunification) |
| Trifirio 2008 | Uncontrolled before‐after study |
| Whynes 1995 | Innappropriate selection of research design; intervention groups are at different stages of fund‐holding |
| Whynes 1997b | After‐only study without control group |
| Zhang 2012 | No relevant intervention |
ITS: Interrupted time series
Characteristics of studies awaiting assessment [ordered by study ID]
Chang 2013.
| Methods | Not yet assessed |
| Participants | |
| Interventions | |
| Outcomes | |
| Notes |
Harrison 2014.
| Methods | Not yet assessed |
| Participants | |
| Interventions | |
| Outcomes | |
| Notes |
Kontopantelis 2013.
| Methods | Not yet assessed |
| Participants | |
| Interventions | |
| Outcomes | |
| Notes |
Kristensen 2014.
| Methods | Not yet assessed |
| Participants | |
| Interventions | |
| Outcomes | |
| Notes |
Li 2014.
| Methods | Not yet assessed |
| Participants | |
| Interventions | |
| Outcomes | |
| Notes |
MacBride‐Stewart 2008.
| Methods | Not yet assessed |
| Participants | |
| Interventions | |
| Outcomes | |
| Notes |
Naomh Gallagher 2012.
| Methods | Not yet assessed |
| Participants | |
| Interventions | |
| Outcomes | |
| Notes |
Park 2014.
| Methods | Not yet assessed |
| Participants | |
| Interventions | |
| Outcomes | |
| Notes |
Sun 2014.
| Methods | Not yet assessed |
| Participants | |
| Interventions | |
| Outcomes | |
| Notes |
Zhang 2014.
| Methods | Not yet assessed |
| Participants | |
| Interventions | |
| Outcomes | |
| Notes |
Differences between protocol and review
The protocol had identified two distinctive groups of financial incentive policies (budgetary and pay for performance), and had considered other policies without specifying them. As a result of the updated searches, we identified a third group of financial incentive policies as reimbursement rate reduction policies that have been used in some countries.
Contributions of authors
For this version of the review: AR prepared the plans for the update with contributions from ADO and HS. A‐HO and YV conducted the initial screenings. YV, A‐HO and AR assessed the abstracts and full texts for inclusion. HS and ADO contributed in assessing some papers. YV, A‐HO and AR extracted data. A‐HO and AR conducted the CBA and ITS analyses. AR conducted final data synthesis and wrote the manuscript with contributions from A‐HO. All review authors read, commented on and approved the final manuscript.
Sources of support
Internal sources
Norwegian Knowledge Centre for the Health Services, Norway.
Tehran University of Medical Sciences, Iran.
External sources
-
Alliance for Health Policy and Systems Research, WHO, Switzerland.
The Alliance funded the conduct of the update of this systematic review.
Declarations of interest
AR has conducted short consultancies on health financing for the World Health Organization (WHO), Ministries of Health and social health insurance organisations in a few countries that included consideration of pharmaceutical policies. HS was supported by the Dutch Health Care Insurance Board (CVZ).
New search for studies and content updated (no change to conclusions)
References
References to studies included in this review
Baines 1997c {published data only}
- Baines DL, Brigham P, Phillips DR, Tolley KH, Whynes DK. GP fundholding and prescribing in UK general practice: evidence from two rural, English Family health Services Authorities. Public Health 1997;111:321‐5. [4531] [PubMed] [Google Scholar]
Bradlow 1993 {published data only}
- Bradlow J, Coulter A. Effect of fundholding and indicative prescribing schemes on general practitioners prescribing cost. BMJ 1993;307(6913):1186‐89. [DOI] [PMC free article] [PubMed] [Google Scholar]
- Stewart‐ Brown S, Surender K. Bradlow J. Coulter A. Doll H. The effects of fundholding in general practice on prescribing habits three years after the introduction of the scheme. BMJ 1995;311:1543‐7. [DOI] [PMC free article] [PubMed] [Google Scholar]
Burr 1992 {published data only}
- Burr AJ, Walker R, Stent SJ. Impact of fundholding on general practice prescribing patterns. The Pharmaceutical Journal 1992;249:R8. [Google Scholar]
Chou 2008 {published data only}
- Chou CC, Hu KY, Wu NR, Cheng YH, Loh CH, Yeh MK. Changes in drug prescription utilization for diabetic and hypertensive outpatients after initiation of the National Health Insurance’s Global Budget Program in Taiwan. Medical Science Monitor 2008;14(5):PH33‐9. [PubMed] [Google Scholar]
Chu 2008 {published data only}
- Chu HL, Liu SZ, Romeis JC. Changes in prescribing behaviors after implementing drug reimbursement rate reduction policy in Taiwan: implications for the Medicare system. Journal of Health Care Finance 2008;34(3):45‐54. [PubMed] [Google Scholar]
Corney 1997 {published data only}
- Corney RH, Kerrison S. Fundholding in the South Thames region. British Journal of General Practice 1997;47(422):553‐6. [PMC free article] [PubMed] [Google Scholar]
Doran 2011 {published data only}
- Doran T, Kontopantelis E, Valderas JM, Campbell S, Roland M, Salisbury C, et al. Effect of financial incentives on incentivised and non‐incentivised clinical activities: longitudinal analysis of data from the UK Quality and Outcomes Framework. British Medical Journal 2011;342:d3590. [DOI] [PMC free article] [PubMed] [Google Scholar]
Granlund 2006 {published data only}
- Granlund D, Rudholm N, Wikström M. Fixed bud gets as a cost containment measure for pharmaceuticals. The European Journal of Health Economics 2006;7(1):35‐45. [DOI] [PubMed] [Google Scholar]
Guether 1995 {published data only}
- Guether B. Effects of German health legislation on the prescriptions of GPs [Auswirkungen des GSG auf das Verordnungsverhalten niedergelassener Aerzte]. Gesundheitswesen 1995;57:185‐91. [PubMed] [Google Scholar]
Harris 1996 {published data only}
- Harris CM, Scrivener G. Fundholders' prescribing cost: the first five years. BMJ 1996;313:1531‐4. [DOI] [PMC free article] [PubMed] [Google Scholar]
Martens 2007 {published data only}
- Martens JD, Werkhoven MJ, Severens JL, Winkens RA. Effects of a behaviour independent financial incentive on prescribing behaviour of general practitioners. Journal of Evaluation in Clinical Practice 2007;13(3):369‐73. [DOI] [PubMed] [Google Scholar]
Rafferty 1997 {published data only}
- Rafferty T. Wilson‐ Davis K, McGavock H. How has fundholding in Northern Ireland affected prescribing patterns? A longitudinal study. BMJ 1997;315:166‐70. [DOI] [PMC free article] [PubMed] [Google Scholar]
Schöffski 1997 {published data only}
- Schöffski O. Consequences of implementing a drug budget for office‐based physicians in Germany. Pharmaeconomics 1996;10 Suppl. 2:37‐47. [DOI] [PubMed] [Google Scholar]
Serumaga 2011 {published data only}
- Serumaga B, Ross‐Degnan D, Avery AJ, Elliott RA, Majumdar SR, Zhang F, et al. Effect of pay for performance on the management and outcomes of hypertension in the United Kingdom:interrupted time series study. British Medical Journal 2011;342:d108. [DOI] [PMC free article] [PubMed] [Google Scholar]
Walley 2000 {published data only}
- Walley T, Murphy M, Codd M, Johnston Z, Quirke T. Effects of monetary incentive on primary care prescribing in Ireland: changes in prescribing patterns in one health board 1990‐1995. Pharmacoepidemiology and Drug Safety 2000;9:591‐8. [DOI] [PubMed] [Google Scholar]
Whynes 1997 {published data only}
- Whynes DK, Baines DL, Tolley KH. GP fundholding and the costs of prescribing: further results. Journal of Public Health Medicine 1997;19(1):18‐22. [DOI] [PubMed] [Google Scholar]
Wilson 1995 {published data only}
- Wilson RP, Buchan I, Walley T. Alterations in prescribing by general practitioner fundholders: an observational study. BMJ 1995;311(7016):1347‐50. [DOI] [PMC free article] [PubMed] [Google Scholar]
- Wilson RP, Hatcher J, Barton S, Walley T. General practice fundholders' prescribing savings in one region of the United Kingdom. Health Policy 1997;42:29‐37. [DOI] [PubMed] [Google Scholar]
- Wilson RP, Hatcher J, Barton S, Walley T. Influences of practice characteristics on prescribing in fundholding and non‐fundholding general practices: an observational study. BMJ 1996;313:595‐9. [DOI] [PMC free article] [PubMed] [Google Scholar]
Wilson 1999 {published data only}
- Wilson RPH, Hatcher J, Barton S, Walley T. Therapeutic substitution and therapeutic conservatism as cost‐containment strategies in primary care: a study of fundholders and non‐fundholders. British Journal of General Practice 1999;443:431‐5. [PMC free article] [PubMed] [Google Scholar]
References to studies excluded from this review
Andersson 2009 {published data only}
- Andersson K, Carlsten A, Hedenrud T. Prescribing behaviour after the introduction of decentralized drug budgets: is there an association with employer and type of care facility?. Scandinavian Journal of Primary Health Care 2009;27:117‐22. [DOI] [PMC free article] [PubMed] [Google Scholar]
Ashworth 2004 {published data only}
- Ashworth M, Lea R, Gray H, Rowlands G, Gravelle H, Majeed A. How are primary care organizations using financial incentives to influence prescribing?. Journal of Public Health 2004;26(1):48‐51. [DOI] [PubMed] [Google Scholar]
Bain 1993 {published data only}
- Bain J. Budget holding in Calverton: one year on. BMJ 1992;304(6832):971‐3. [DOI] [PMC free article] [PubMed] [Google Scholar]
- Bain J. The New NHS: the second year. Budget holding: here to stay?. BMJ 1993;306(6886):1185‐8. [DOI] [PMC free article] [PubMed] [Google Scholar]
Baines 1997 {published data only}
- Baines DL, Whynes DK, Tolley KH. General practitioner fundholding and prescribing expenditure control. Evidence from a rural English health authority. Pharmacoeconomics 1997;11(4):350‐8. [13861] [DOI] [PubMed] [Google Scholar]
Baines 1997b {published data only}
- Baines DL, Brigham P, Phillips DR, Tolley KH, Whynes DK. GP fundholding and prescribing in UK general practice: evidence from two rural English family health authorities. Public Health 1997;111(5):321‐5. [PubMed] [Google Scholar]
Bateman 1996 {published data only}
- Bateman DN, Campbell M, Donaldson LJ, Roberts SJ, Smith JM. A prescribing incentive scheme for non‐fundholding general practices: an observational study. BMJ 1996;313:535‐8. [DOI] [PMC free article] [PubMed] [Google Scholar]
Bergström 2007 {published data only}
- Bergström G, Karlberg I. Decentralized responsibility for costs of outpatient prescription pharmaceuticals in Sweden. Assessment of models for decentralized financing of subsidies from a management perspective. Health Policy 2007;81(2‐3):358‐67. [DOI] [PubMed] [Google Scholar]
Bhargava 2010 {published data only}
- Bhargava V, Greg ME, Shields MC. Addition of generic medication vouchers to a pharmacist academic detailing program: effects on the generic dispensing ratio in a physician‐hospital organization. Journal of Managed Care Pharmacy 2010;16(6):384‐92. [DOI] [PMC free article] [PubMed] [Google Scholar]
Bhatti 2007 {published data only}
- Bhatti TA, Einarson TH, Austin Z, Grootendorst P. The impact of financial incentives on pharmacist dispensing habits: evidence from the British Columbia Product Incentive Plan. Journal of Pharmaceutical Finance, Economics and Policy 2007;16(4):35. [Google Scholar]
Black 2009 {published data only}
- Blak BT, Mullins CD, Shaya FT, Simoni‐Wastila L, Cooke CE, Weir MR. Prescribing trends and drug budget impact of the ARBs in the UK. Value Health 2009;12(2):302‐8. [DOI] [PubMed] [Google Scholar]
Bryant 2005 {published data only}
- Bryant J, Prohmmo A. Payment mechanisms and prescriptions in four Thai hospitals. Health Policy 2005;73(2):160‐71. [DOI] [PubMed] [Google Scholar]
Campbell 2007 {published data only}
- Campbell S, Reeves D, Kontopantelis E, Sibbald B, Roland M. Quality of primary care in England with the introduction of pay for performance. New England Journal of Medicine 2007;357(2):181‐90. [DOI] [PubMed] [Google Scholar]
Campbell 2009 {published data only}
- Campbell S, Reeves D, Kontopantelis E, Sibbald B, Roland M. Effects of pay‐for‐performance on the quality of primary care in England. New England Journal of Medicine 2009;361(4):368‐78. [DOI] [PubMed] [Google Scholar]
Chang 2009 {published data only}
- Chang SL, Liao JC, Shinghal R. Decreasing use of luteinizing hormone‐releasing hormone agonists in the United States is Independent of Reimbursement Changes: a Medicare and Veterans Health Administration claims analysis. Journal of Urology 2009;182:255‐61. [DOI] [PubMed] [Google Scholar]
Chen 2008 {published data only}
- Chen CL, Chen L, Yang WC. The influences of Taiwan's generic grouping price policy on drug prices and expenditures: evidence from analysing the consumption of the three most‐used classes of cardiovascular drugs. BMC Public Health 2008;8:118. [DOI: 10.1186/1471-2458-8-118.] [DOI] [PMC free article] [PubMed] [Google Scholar]
Chernew 2000 {published data only}
- Chernew M, Cowen ME, Kirking DM, Smith DG, Valenstein P, Fendrick AM. Pharmaceutical cost growth under capitation: a case study. Health Affairs 2000;19(6):266‐76. [DOI] [PubMed] [Google Scholar]
Chou 2010 {published data only}
- Chou SY, Deily ME, Lien HM, Zhang JH. Global budgets and provider incentives: hospitals' drug expenditures in Taiwan. Advances in Health Economics and Health Services Research 2010;22:103‐22. [DOI] [PubMed] [Google Scholar]
Chu 2008b {published data only}
- Chu HL, Liu SZ, Romeis JC. The effects of physicians' financial incentives on the effectiveness of Taiwan's outpatient drug copayment policy. Drug Information Journal 2008;42:493‐502. [Google Scholar]
Chu 2010 {published data only}
- Chu HL, Liu SZ, Romeis JC. Do drug price adjustment policies work? The impact of physician financial incentive plans on the implementation of drug cost containment mechanisms. Drug Information Journal 2010;44:189‐98. [Google Scholar]
Chung 2010a {published data only}
- Chung S, Palaniappan LP, Trujillo LM, Rubin HR, Luft HS. Effect of physician‐specific pay‐for‐performance incentives in a large group practice. The American Journal of Managed Care 2010;16(2):e35‐42. [PubMed] [Google Scholar]
Chung 2010b {published data only}
- Chung S, Palaniappan L, Wong E, Rubin H, Luft H. Does the frequency of pay‐for‐performance payment matter? Experience from a randomized trial. Health Services Research 2010;45(2):553‐64. [DOI] [PMC free article] [PubMed] [Google Scholar]
Coulter 1993 {published data only}
- Coulter A, Bradlow J. Effect of NHS reforms on general practitioners' referral patterns. BMJ 1993;306:433‐7. [DOI] [PMC free article] [PubMed] [Google Scholar]
- Surender R. Prospective study of trends in referral patterns in fundholding and non‐fundholding practices in the Oxford region, 1990‐4. BMJ 1995;311:1205‐8. [DOI] [PMC free article] [PubMed] [Google Scholar]
Curttis 2003 {published data only}
- Curtiss FR. Effects of physician report cards, knowledge of drug prices, and financial incentives in prescription drug costs. Journal of Managed Care Pharmacy 2003;9(4):368‐71. [DOI] [PMC free article] [PubMed] [Google Scholar]
Danzon 1997 {published data only}
- Danzon PM, Liu H. Reference pricing and physician drug budgets: the German experience in controlling pharmaceutical expenditures. Philadelphia, PA: Wharton School Working Paper, University of Philadelphia, 1997.
Delmar 2006 {published data only}
- Delmar C. Improving prescribing practices in primary care. A randomised trial and economic analysis of a multicomponent intervention showed small, but important, gains. PLoS Medicine 2006;3(6):e229. [DOI] [PMC free article] [PubMed] [Google Scholar]
Doshi 2010 {published data only}
- Doshi JA, Li P, Puig A. Impact of the Medicare Modernization Act of 2003 on utilization and spending for Medicare part B‐covered biologics in rheumatoid arthritis. Arthritis Care Research (Hoboken) 2010;62(3):354‐61. [DOI] [PMC free article] [PubMed] [Google Scholar]
Dusheiko 2003 {published data only}
- Dusheiko M, Gravelle H, Jacobs R, Smith PC. The effects of budgets on doctor behaviour: evidence from a natural experiment. York, UK: University of York Discussion Paper,. York, UK: University of York, 2003.
Edgar 1999 {published data only}
- Edgar S, Girvin B. Effects of hospital‐led prescribing on the cardiovascular budget of a fundholding general practice. The Pharmaceutical Journal 1999;263:292‐4. [Google Scholar]
Elhayany 2001 {published data only}
- Elhayany A, Regev S, Sherf M, Reuveni H, Shvartzman P. Effects of a fundholding discontinuation. An Israeli Health Maintenance Organization Natural Experiment 2001;19:223‐6. [DOI] [PubMed] [Google Scholar]
Elliott 2010 {published data only}
- Elliott SP, Jarosek SL, Wilt TJ, Virnig BA. Reduction in physician reimbursement and use of hormone therapy in prostate cancer. Journal of the National Cancer Institute 2010;102(24):1826‐34. [DOI] [PMC free article] [PubMed] [Google Scholar]
Etter 1998 {published data only}
- Etter J‐F, Perneger TV. Health care expenditures after introduction of a gatekeeper and a global budget in a Swiss health insurance plan. Journal of Epidemiology and Community Health 1997;52(6):370‐4. [DOI] [PMC free article] [PubMed] [Google Scholar]
Fear 1994 {published data only}
- Fear CF, Cattell HR. Fund‐holding general practices and old age psychiatry. Psychiatric Bulletin 1994;18:263‐5. [Google Scholar]
Hespanhol 2005 {published data only}
- Hespanhol A, Sousa Pinto A. The payment model in Sao Joao Health Center ‐ "Tubo de Ensaio". Arquivos De Medicina 2005;19(3):113‐20. [Google Scholar]
Hoffman 2010 {published data only}
- Hoffmann F, Windt R, Glaeske G. Implementation of "aut idem" before and after introduction of rebate contracts [Umsetzung der Aut‐idem‐Regelung vor und nachEinführung der Rabattverträge]. Deutsch Medizinische Wochenschrift 2010;135:739‐44. [DOI] [PubMed] [Google Scholar]
Hoopmann 1995 {published data only}
- Hoopmann M, Schwartz FW, Weber J. Effects of the German 1993 health reform law upon primary care practitioners individual performance: results form an empirical study in sentinel practices. Journal of Epidemiology and Community Health 1995;49:33‐6. [DOI] [PMC free article] [PubMed] [Google Scholar]
Houghton 1998 {published data only}
- Houghton G, Gilthorpe MS. Variations in general practice prescribing: a multilevel model approach to determine the impact of characteristics, including fundholding and training status. Journal of Clinical Effectiveness 1998;3(2):75‐9. [Google Scholar]
Howie 1995 {published data only}
- Howie JGR, Heaney DJ, Maxwell M. General practice fund‐holding: shadow project ‐ an evaluation. Edinburgh, Scotland: The Department of General Practice, University of Edinburgh,. Edinburgh: The Department of General Practice, University of Edinburgh, 1995.
Jacobson 2006 {published data only}
- Jacobson M, O'Malley AJ, Earle CC, Pakes J, Gaccione P, Newhouse JP. Does reimbursement influence chemotherapy treatment for cancer patients?. Health Affairs 2006;25(2):437‐43. [DOI] [PubMed] [Google Scholar]
Jünger 2000 {published data only}
- Jünger C, Rathmann W, Giani G. Prescribing practices of general practitioners and internists in the treatment of diabetic patients: influence of drug budgeting [Primaeraerztliches Verordnungsverhalten bei der Diabetestherapie: Einfluss der Arzneimittelbudgetierung]. Deutsch Medizinische Wochenschrift 2000;125:103‐9. [DOI] [PubMed] [Google Scholar]
- Jünger C, Rathmann W, Giani G. Prescription drug use of primary care physicians in Germany among diabetic and nondiabetic patients [Primaeraerztliche Arzneimittelverordnungen bei Diabetikern und Nichtdiabetikern: Einfluss der Arzneimittelbudgetierung]. Gesundheitswesen 1999;61:607‐13. [PubMed] [Google Scholar]
Kaestner 2012 {published data only}
- Kaestner R, Khan N. Medicare Part D and its effect on the use of prescription drugs and use of other health care services of the elderly. Journal of Policy Analysis and Management 2012;31(2):253‐79. [Google Scholar]
Kammerling 1996 {published data only}
- Kammerling R. Kinnear A. The extent of the two tier service for fundholders. BMJ 1996;312:1399‐401. [DOI] [PMC free article] [PubMed] [Google Scholar]
Landon 2007 {published data only}
- Landon BE, Rosenthal MB, Normand SL, Spettell C, Lessler A, Underwood HR, et al. Incentive formularies and changes in prescription drug spending. American Journal of Managed Care 2007;13(6 Pt 2):360‐9. [PubMed] [Google Scholar]
Lee 2007 {published data only}
- Lee YC, Huang KH, Huang YT. Adverse pharmaceutical payment incentives and providers' behaviour: the emergence of GP‐owned gateway pharmacies in Taiwan. Health Policy and Planing 2007;22(6):427‐35. [DOI] [PubMed] [Google Scholar]
Li 2008 {published data only}
- Li L, Chen Y, Yao L, Li Y. Evaluation of the effects of implementing the policy "Without Added Profit" to sale drug in community health service institutions of Chengdu. Chinese Journal of New Drugs 2008;17(21):1820‐2. [Google Scholar]
Ling 2008 {published data only}
- Ling DC, Berndt ER, Frank RG. Economic incentives and contracts: the use of psychotropic medications. Contemporary Economic Policy 2008;1:49‐72. [Google Scholar]
Liu 2009 {published data only}
- Liu YM, Yang YH, Hsieh CR. Financial incentives and physicians' prescription decisions on the choice between brand‐name and generic drugs: evidence from Taiwan. Journal of Health Economics 2009;28(2):341‐9. [DOI] [PubMed] [Google Scholar]
Malcolm 1999 {published data only}
- Malcolm L, Wright L, Seers M, Guthrie J. An evaluation of pharmaceutical management and budget holding in Pegasus Medical Group. New Zealand Medical Journal 1999;112(1087):162‐4. [PubMed] [Google Scholar]
Malcolm 2001 {published data only}
- Malcolm L, Barry M, MacLean I. Pharmaceutical management in ProCare Health Limited. New Zealand Medical Journal 2001;114(1134):283‐6. [PubMed] [Google Scholar]
Maxwell 1993 {published data only}
- Howie JGR, Heaney DJ, Maxwell M. General practice fund‐holding: shadow project ‐ an evaluation. Edinburgh, Scotland: The Department of General Practice, University of Edinburgh, 1995.
- Maxwell M, Heaney D, Howie JGR, Noble S. General practice fundholding: observations on prescribing patterns and cost using the defined daily dose method. BMJ 1993;307(6913):1190‐4. [DOI] [PMC free article] [PubMed] [Google Scholar]
Maynard 2010 {published data only}
- Maynard A, Bloor K. Will financial incentives and penalties improve hospital care?. British Medical Journal 2010;340:c88. [DOI] [PubMed] [Google Scholar]
Millet 2007 {published data only}
- Millett C, Gray J, Saxena S, Netuveli G, Khunti K, Majeed A. Ethnic disparities in diabetes management and pay‐for‐performance in the UK: the Wandsworth Prospective Diabetes Study. PLOS Medicine 2007;4(6):191. [DOI] [PMC free article] [PubMed] [Google Scholar]
Mossalios 2005 {published data only}
- Mossialos E, Walley T, Rudisill C. Provider incentives and prescribing behavior in Europe. Expert Review on Pharmacoeconomics and Outcomes Research 2005;5(1):81‐93. [DOI] [PubMed] [Google Scholar]
Newton 1993 {published data only}
- Newton J, Fraser M, Robinson J, Wainwright D. Fundholding in the northern region: the first year. BMJ 1993;306:375‐8. [DOI] [PMC free article] [PubMed] [Google Scholar]
O'Malley 2006 {published data only}
- O'Malley AJ, Frank RG, Kaddis A, Rothenberg BM, McNeil BJ. Impact of alternative interventions on changes in generic dispensing rates. Health Services Research 2006;41(5):1876‐94. [DOI] [PMC free article] [PubMed] [Google Scholar]
Ohlsson 2007 {published data only}
- Ohlsson H, Merlo J. Understanding the effects of a decentralized budget on physicians' compliance with guidelines for statin prescription – a multilevel methodological approach. BMC Health Services Research 2007;7:68. [DOI] [PMC free article] [PubMed] [Google Scholar]
Peabody 2011 {published data only}
- Peabody J, Shimkhada R, Quimbo S, Florentino J, Bacate M, McCulloch CE, et al. Financial incentives and measurement improved physicians' quality of care in the Philippines. Health Affairs (Millwood) 2011;30(6):1217. [DOI] [PubMed] [Google Scholar]
Prokes 2009 {published data only}
- Prokes M, Suchopar J. Effect of drug budgets on drug prescription in Czech Republic in 2006. Klinicka Farmakologie a Farmacie 2009;23(2):90‐6. [Google Scholar]
Sakshaug 2007 {published data only}
- Sakshaug S, Furu K, Karlstad Ø, Rønning M, Skurtveit S. Switching statins in Norway after new reimbursement policy – a nationwide prescription study. British Journal of Clinical Pharmacology 2007;64(4):476‐81. [DOI] [PMC free article] [PubMed] [Google Scholar]
Schmidt 2006 {published data only}
- Schmidt K. Incentives for especially cost effective prescribing. The physician protects his budget, the patient saves co‐pay. MMW Fortschritte dir medizin 2006;148(44):57‐9. [PubMed] [Google Scholar]
Schreyögg 2004 {unpublished data only}
- Schreyögg J. Physician Prescribing Budgets in Germany: Effects on Prescribing Behaviour. Berlin, Germany: Department of Health Care Management, Faculty of Economics and Management, Berlin University of Technology, 2005.
Schreyögg 2005 {published data only}
- Schreyögg J, Busse R. Physician drug budgets in Germany: effects on prescription behaviour. Journal of Pharmaceutical Finance 2005;14(3):77‐95. [Google Scholar]
Trifirio 2008 {published data only}
- Trifirò G, Alacqua M, Corrao S, Moretti S, Tari DU, Galdo M, et al. UVEC Group. Lipid‐lowering drug use in Italian primary care: effects of reimbursement criteria revision. European Journal of Clinical Pharmacology 2008;64(6):619‐25. [DOI] [PubMed] [Google Scholar]
Whynes 1995 {published data only}
- Whynes DK, Baines DL, Tolley KH. GP fundholding and the cost of prescribing. Journal of Public Health Medicine 1995;17:323‐9. [PubMed] [Google Scholar]
Whynes 1997b {published data only}
- Wilson RP, Hatcher J, Barton S, Walley T. General practice fundholders' prescribing savings in one region of the United Kingdom, 1991‐1994. Health Policy 1997;42:29‐37. [DOI] [PubMed] [Google Scholar]
Zhang 2012 {published data only}
- Zhang Y, Baik SH, Zhou L, Reynolds CF, Lave JR. Effects of Medicare Part D coverage gap on medication and medical treatment among elderly beneficiaries with depression. Archives of General Psychiatry 2012;69(7):672‐9. [DOI] [PMC free article] [PubMed] [Google Scholar]
References to studies awaiting assessment
Chang 2013 {published data only}
- Chang J, Freed GL, Prosser LA, Patel I, Erickson SR, Bagozzi RP, Balkrishnan R. Associations between physician financial incentives and the prescribing of anti‐asthmatic medications in children in US outpatient settings. Journal of Child Health Care. 2013;17(2):125‐37. [DOI] [PubMed] [Google Scholar]
Harrison 2014 {published data only}
- Harrison MJ, Dusheiko M, Sutton M, Gravelle H, Doran T, Roland M. Effect of a national primary care pay for performance scheme on emergency hospital admissions for ambulatory care sensitive conditions: controlled longitudinal study. BMJ. 2014;349:g6423. [DOI] [PMC free article] [PubMed] [Google Scholar]
Kontopantelis 2013 {published data only}
- Kontopantelis E, Reeves D, Valderas JM, Campbell S, Doran T. Recorded quality of primary care for patients with diabetes in England before and after the introduction of a financial incentive scheme: a longitudinal observational study. BMJ Quality and Safety 2013;22(1):53‐64. [DOI] [PubMed] [Google Scholar]
Kristensen 2014 {published data only}
- Kristensen SR, Meacock R, Turner AJ, Boaden R, McDonald R, Roland M, et al. Long‐term effect of hospital pay for performance on mortality in England. New England Journal of Medicine 2014;371(6):540‐8. [DOI] [PubMed] [Google Scholar]
Li 2014 {published data only}
- Li J, Hurley J, DeCicca P, Buckley G. Physician response to pay‐for‐performance: evidence from a natural experiment. Health Economics 2014;23(8):962‐78. [DOI] [PubMed] [Google Scholar]
MacBride‐Stewart 2008 {published data only}
- MacBride‐Stewart SP, Elton R, Walley T. Do quality incentives change prescribing patterns in primary care? An observational study in Scotland. Family Practice 2008;25(1):27‐32. [DOI] [PubMed] [Google Scholar]
Naomh Gallagher 2012 {published data only}
- Naomh Gallagher N. Type 2 diabetes and cardiovascular drug therapy on the island of Ireland: do financial incentives change prescribing behaviour?. European Journal of Preventive Cardiology 2012;1:S20. [Google Scholar]
Park 2014 {published data only}
- Park S, et al. Differential effects of two pharmaceutical cost containment policies on outpatient prescription drug expenditures in Korea. Value in Health 2014;17(3):A14. [Google Scholar]
Sun 2014 {published data only}
- Sun X, Liu X, Sun Q, Yip W, Wagstaff A, Meng Q. The impact of a pay‐for‐performance scheme on prescription quality in rural China: an impact evaluation. Policy Research Working Paper Series 2014;6892:No 750. [Google Scholar]
Zhang 2014 {published data only}
- Zhang JH, Chou SY, Deily ME, Lien HM. Hospital ownership and drug utilization under a global budget: a quantile regression analysis. International Health 2014;6(1):62‐9. [DOI] [PubMed] [Google Scholar]
Additional references
Aaserud 2006a
- Aaserud M, Dahlgren AT, Sturm H, Koesters JP, Hill S, Furberg CD, et al. Pharmaceutical policies: effects on rational drug use. Cochrane Database of Systematic Reviews 2006, Issue 2. [DOI: 10.1002/14651858.CD004397.pub2] [DOI] [Google Scholar]
Acosta 2014
- Acosta A, Ciapponi A, Aaserud M, Vietto V, Austvoll‐Dahlgren A, Kösters JP, et al. Pharmaceutical policies: effects of reference pricing, other pricing, and purchasing policies. Cochrane Database of Systematic Reviews 2014, Issue 10. [DOI: 10.1002/14651858.CD005979.pub2] [DOI] [PMC free article] [PubMed] [Google Scholar]
Antonanzas 2003
- Antonanzas F. Challenges to achieving value in drug spending in a decentralized country: the Spanish case. Value in Health 2003;6:52‐63. [DOI] [PubMed] [Google Scholar]
Armour 2001
- Armour BS, Pitts MM, Maclean R, Cangialose C, Kishel M, Imai H, Etchason J. The effect of explicit financial incentives on physician behavior. Archives of Internal Medicine 2001;161(10):1261‐6. [DOI] [PubMed] [Google Scholar]
Atella 2000
- Atella V. Drug cost containment policies in Italy: are they really effective in the long‐run? The case of minimum reference price. Health Policy 2000;50(3):197‐218. [DOI] [PubMed] [Google Scholar]
Audit Comm. 1996
- Audit Commission. What the Doctor Ordered: A Study of GP Fundholders in England and Wales. London: HMSO, 1996.
Austvoll‐Dahlgren 2008
- Austvoll‐Dahlgren A, Aaserud M, Vist G, Ramsay C, Oxman AD, Sturm H, et al. Pharmaceutical policies: effects of cap and co‐payment on rational drug use. Cochrane Database of Systematic Reviews 2008;CD007017:doi: 10.1002/14651858.CD007017. [DOI] [PubMed] [Google Scholar]
Baines 1996
- Baines DL, Whynes DK. Selection bias in GP fundholding. Health Economics 1996;5:129‐40. [DOI] [PubMed] [Google Scholar]
Bigdeli 2013
- Bigdeli M, Jacobs B, Tomson G, Laing R, Ghaffar A, Dujardin B, et al. Access to medicines from a health system perspective. Health Policy Plan 2013;28(7):692‐704. doi:10.1093/heapol/czs108. [DOI] [PMC free article] [PubMed] [Google Scholar]
Bloor 1996
- Bloor K, Freemantle N. Fortnightly review: lessons from international experience in controlling pharmaceutical expenditure II: influencing doctors. BMJ 1996;312(7045):1525‐7. [DOI] [PMC free article] [PubMed] [Google Scholar]
Busse 1996
- Busse R, Howorth C. Fixed budgets in the pharmaceutical sector in Germany: effects on costs and quality. In: Schwartz FW, Glennerster H, Saltman RB, Busse R editor(s). Fixing Health Budgets: Experience from Europe and North America. New York: John Wiley and Sons, 1996:93‐108. [Google Scholar]
Calltorp 1996
- Calltorp J. Swedish experience with regional budgets. Fixing Health Budgets. New York: John Wiley and Sons, 1996:155‐64. [Google Scholar]
Calltorp 1999
- Calltorp J. Priority setting in health policy in Sweden and a comparison with Norway. Health Policy 1999;50:1‐22. [DOI] [PubMed] [Google Scholar]
Campbell 2013
- Campbell D, Chui M. Pharmerging Shake‐up: New Imperatives in a Re‐defined World. Norwalk, CT: IMS Health, 2013. [Google Scholar]
Chaix‐Couturier 2000
- Chaix‐Couturier C, Durand‐Zaleski I, Jolly D, Durieux P. Effects of financial incentives on medical practice: results from a systematic review of the literature and methodological issues. International Journal of Quality Health Care 2000;12(2):133‐42. [DOI] [PubMed] [Google Scholar]
Conrad 2004
- Conrad DA, Christianson JB. Penetrating the "black box": financial incentives for enhancing the quality of physician services. Medical Care Research and Review 2004;61(3):37‐68. [DOI] [PubMed] [Google Scholar]
Coulter 1995
- Coulter A. Evaluating general practice fundholding in the United Kingdom. European Journal of Public Health 1995;5:233‐9. [Google Scholar]
Croxson 2001
- Croxson B, Propper C, Perkins A. Do doctors respond to financial incentives? UK family doctors and the GP fundholder scheme. Journal of Public Economics 2001;79:375‐98. [Google Scholar]
Day 1991
- Day P, Klein R. Variations in budgets of fundholding practices. BMJ 1991;303(6795):168‐70. [DOI] [PMC free article] [PubMed] [Google Scholar]
Delnoij 2000
- Delnoij D, Brenner G. Importing budget systems from other countries: what can we learn from the German drug budget and the British GP fundholding?. Health Policy 2000;52(3):157‐69. [DOI] [PubMed] [Google Scholar]
Doloresco 2011
- Doloresco F, Fominaya C, Schumock GT, Vermeulen LC, Matusiak L, Hunkler RJ, et al. Projecting future drug expenditures: 2011. American Journal of Health‐System Pharmacy 2011;68(10):921‐32. [DOI] [PubMed] [Google Scholar]
Eichler 2009
- Eichler R, Levine R. Performance Incentives for Global Health: Potential and Pitfalls. Washington, DC: Center for Global Development, 2009. [Google Scholar]
Eijkenaar 2013
- Eijkenaar F, Emmert M, Scheppach M, Schoffski O. Effects of pay for performance in health care: a systematic review of systematic reviews. Health Policy 2013;110:115‐30. [DOI] [PubMed] [Google Scholar]
Emmerick 2013
- Emmerick IC, Oliveira MA, Luiza VL, Azeredo TB, Bigdeli M. Access to medicines in Latin America and the Caribbean (LAC): a scoping study. BMJ Open 2013;3(5):pii: e002224. doi: 10.1136/bmjopen‐2012‐002224.. [DOI] [PMC free article] [PubMed] [Google Scholar]
EPOC 2013a
- Effective Practice, Organisation of Care (EPOC). What study designs should be included in an EPOC review and what should they be called?. EPOC Resources for Review Authors. Oslo: Norwegian Knowledge Centre for the Health Services 2013. Available at: http://epocoslo.cochrane.org/epoc‐specific‐resources‐review‐authors.
EPOC 2013b
- Effective Practice, Organisation of Care (EPOC). What outcomes should be reported in EPOC reviews?. EPOC Resources for review authors. Oslo: Norwegian Knowledge Centre for the Health Services 2013. Available at: http://epocoslo.cochrane.org/epoc‐specific‐resources‐review‐authors.
EPOC 2013c
- Effective Practice, Organisation of Care (EPOC). Interrupted time series (ITS) analyses. EPOC Resources for review authors. Oslo: Norwegian Knowledge Centre for the Health Services 2013. Available at: http://epocoslo.cochrane.org/epoc‐specific‐resources‐review‐authors.
EPOC 2013d
- Effective Practice, Organisation of Care (EPOC). EPOC worksheets for preparing a Summary of Findings (SoF) table using GRADE. EPOC Resources for Review Authors. Oslo: Norwegian Knowledge Centre for the Health Services 2013. Available at: http://epocoslo.cochrane.org/epoc‐specific‐resources‐review‐authors.
EPOC 2015
- Effective Practice, Organisation of Care (EPOC). Suggested risk of bias criteria for EPOC reviews. EPOC Resources for review authors. Oslo: Norwegian Knowledge Centre for the Health Services 2015. Available at: http://epocoslo.cochrane.org/epoc‐specific‐resources‐review‐authors.
Ess 2003
- Ess SM, Schneeweiss S, Szucs TD. European healthcare policies for controlling drug expenditure. Pharmacoeconomics 2003;21(2):89‐103. [DOI] [PubMed] [Google Scholar]
Fattore 1998
- Fattore G, Jommi C. The new pharmaceutical policy in Italy. Health Policy 1998;46(1):21‐41. [DOI] [PubMed] [Google Scholar]
Feely 1999
- Feely J. The therapeutic gap ‐ compliance with medication and guidelines. Atherosclerosis 1999;147(Suppl 1):31‐7. [DOI] [PubMed] [Google Scholar]
Garrison 2003
- Garrison L, Towse A. The drug budget silo mentality in Europe: an overview. Value in Health 2003;6:1‐9. [DOI] [PubMed] [Google Scholar]
Giuffrida 2000
- Giuffrida A, Gosden T, Forland F, Kristiansen IS, Sergison M, Leese B, et al. Target payments in primary care: effects on professional practice and health care outcomes. Cochrane Database of Systematic Reviews 2000, Issue 4. [DOI: 10.1002/14651858.CD000531] [DOI] [PMC free article] [PubMed] [Google Scholar]
Glynn 1992
- Glynn J, Murphy M, Perkins D. GP practice budgets: an evaluation of the financial risks and rewards. Financial Accountability and Management 1992;8:149‐61. [Google Scholar]
Gosden 1997
- Gosden T, Torgerson DJ. The effect of fundholding on prescribing and referral costs: a review of the evidence. Health Policy 1997;40(2):103‐14. [DOI] [PubMed] [Google Scholar]
Gosden 2001
- Gosden T, Forland F, Kristiansen IS, Sutton M, Leese B, Giuffrida A, et al. Impact of payment method on behaviour of primary care physicians: a systematic review. Health Services Research and Policy 2001;6(1):44‐55. [DOI] [PubMed] [Google Scholar]
GRADE 2004
- The GRADE Working Group. Grading quality of evidence and strength of recommendations. BMJ 2004;328(7454):1490‐4. [DOI] [PMC free article] [PubMed] [Google Scholar]
Griffin 1996
- Griffin JP. An historical survey of UK government measures to control the NHS medicines expenditure from 1948 to 1996. Pharmacoeconomics 1996;10(3):210‐24. [DOI] [PubMed] [Google Scholar]
Gross 1994
- Gross DJ, Ratner J, Perez J, Glavin SL. International pharmaceutical spending controls: France, Germany, Sweden, and the United Kingdom. Health Care Financing Review 1994;15(3):127‐40. [PMC free article] [PubMed] [Google Scholar]
Harrison 1996
- Harrison S, Choudhry N. General practice fundholding in the UK National Health Service: evidence to date. Journal of Public Health Policy 1996;17(3):331‐46. [PubMed] [Google Scholar]
Healey 1994
- Healey AT. Do prospective fundholders inflate their prescribing costs? A study of the Grampian fundholding and non‐fundholding practices. Health Bulletin 1994;52(4):282‐4. [Google Scholar]
Klein 2004
- Klein R. Britain's National Health Service revisited. New England Journal of Medicine 2004;350(9):937‐42. [DOI] [PubMed] [Google Scholar]
Lopez Bastida 2000
- Lopez Bastida J, Mossialos E. Pharmaceutical expenditure in Spain: cost and control. International Journal of Health Services 2000;30(3):597‐616. [DOI] [PubMed] [Google Scholar]
Lu 2008
- Lu CY, Ross‐Degnan D, Soumerai SB, Pearson SA. Interventions designed to improve the quality and efficiency of medication use in managed care: a critical review of the literature ‐ 2001‐2007. BMC Health Services Research 2008;8(75):doi:10.1186/1472‐6963‐8‐75. [DOI] [PMC free article] [PubMed] [Google Scholar]
Lu 2011
- Lu Y, Hernandez P, Abegunde D, Edejer T. The world medicines situation 2011; medicine expenditure. WHO/EMP/MIE 2011; Vol. 2.6.
Lundkvist 2002
- Lundkvist J. Pricing and reimbursement of drugs in Sweden. European Journal of Health Economics 2002;3(1):66‐70. [DOI] [PubMed] [Google Scholar]
Mannion 2005
- Mannion R. Practice based commissioning: a summary of the evidence. Health Policy 2005;11:1‐4. [Google Scholar]
Mapelli 2003
- Mapelli V, Lucioni C. Spending on pharmaceuticals in Italy: macro constraints with local autonomy. Value in Health 2003;6:31‐45. [DOI] [PubMed] [Google Scholar]
Maynard 2003
- Maynard A, Bloor K. Dilemmas In regulation of the market for pharmaceuticals. Health Affairs 2003;22(3):31‐41. [DOI] [PubMed] [Google Scholar]
McNamara 2005
- McNamara P. Quality‐based payment: six case examples. International Journal of Quality Health Care 2005;17(4):357‐62. [DOI] [PubMed] [Google Scholar]
Moon 2002
- Moon G, Mohan J, Twigg L, McGrath K, Pollock A. Catching waves: the historical geography of the general practice fundholding initiative in England and Wales. Social Sciences Medicine 2002;55(12):2201‐13. [DOI] [PubMed] [Google Scholar]
Mossialos 2004
- Mossialos E, Mrazek M, Walley T. Regulating Pharmaceuticals in Europe: Striving for Efficiency, Equity and Quality. Buckingham, Open University Press, 2004. [Google Scholar]
Mossialos 2005
- Mossialos E, Oliver A. An overview of pharmaceutical policy in four countries: France, Germany, the Netherlands and the United Kingdom. International Journal of Health Planning and Management 2004;20:291‐306. [DOI] [PubMed] [Google Scholar]
Narine 1997
- Narine L, Senathirajah M. Pharmaceutical Cost Containment Policies: Intended and Unintended Impacts. Toronto, Ontario: University of Toronto Department of Health Administration Report 1997:68‐74.
Okunade 2006
- Okunade AA, Suraratdecha C. The pervasiveness of pharmaceutical expenditure inertia in the OECD countries. Social Sciences Medicine 2006;63(1):225‐38. [DOI] [PubMed] [Google Scholar]
Ostini 2009
- Ostini R, Hegney D, Jackson C, Williamson M, Mackson JM, Gurman K, et al. Systematic review of interventions to improve prescribing. Annals of Pharmacotherapy 2009;43(3):502‐13. [DOI] [PubMed] [Google Scholar]
Oxman 2009
- Oxman AD, Fretheim A. Can paying for results help to achieve the Millennium Development Goals? Overview of the effectiveness of results‐based financing. Journal of Evidence‐Based Medicine 2009;2:70‐83. [DOI] [PubMed] [Google Scholar]
Painter 2005
- Painter MR. Reimbursement issues with hormonal therapies for prostate cancer. Reviews on Urology 2005;7 Suppl 5:S44‐7. [PMC free article] [PubMed] [Google Scholar]
Ramsay 2003
- Ramsay CR, Matowe L, Grilli R, Grimshaw JM, Thomas RE. Interrupted time series design in health technology assessment: lessons from two systematic reviews of behavior change strategies. International Journal of Technology Assessment in Health Care 2003;19(4):612‐23. [DOI] [PubMed] [Google Scholar]
Rashidian 2008
- Rashidian A. Falling on stony ground? A qualitative study of implementation of clinical guidelines' prescribing recommendations in primary care. Health Policy 2008;85(2):148‐61. [DOI] [PubMed] [Google Scholar]
Rashidian 2013
- Rashidian A, Jahanmehr N, Jabbour S, Zaidi S, Soleymani F, Bigdeli M. Bibliographic analysis of research publications on access to and use of medicines in low‐income and middle‐income countries in the Eastern Mediterranean Region: identifying the research gaps. BMJ Open 2013;3(10):e003332. doi: 10.1136/bmjopen‐2013‐003332. [DOI] [PMC free article] [PubMed] [Google Scholar]
Reinhardt 2002
- Reinhardt U, Hussey P, Anderson G. Cross‐national comparisons of health systems using OECD data. Health Affairs 2002;21(3):169‐81. [DOI] [PubMed] [Google Scholar]
Rietveld 2002
- Rietveld AdH, Haaijer‐Ruskamp FM. Policy options for cost containment of pharmaceuticals. International Journal of Risk & Safety in Medicine 2002;15:29‐54. [Google Scholar]
Roland 2004
- Roland M. Linking physicians' pay to the quality of care ‐ a major experiment in the United Kingdom. New England Journal of Medicine 2004;351(14):1448‐54. [DOI] [PubMed] [Google Scholar]
Rosenthal 2004
- Rosenthal M, Fernandopulle R, Song H, Landon B. Paying for quality: providers' incentives for quality improvement. Health Affairs 2004;23(2):127‐41. [DOI] [PubMed] [Google Scholar]
Rosenthal 2006
- Rosenthal MB, Landon BE, Normand SL, Frank RG, Epstein AM. Pay for performance in commercial HMOs. New England Journal of Medicine 2006;355:1895‐902. [DOI] [PubMed] [Google Scholar]
Rowe 2006
- Rowe JW. Pay‐for‐performance and accountability: related themes in improving health care. Annals of Internal Medicine 2006;145:695‐9. [DOI] [PubMed] [Google Scholar]
Sarayani 2014
- Sarayani A, Rashidian A, Gholami K. Low utilisation of diabetes medicines in Iran, despite their affordability (2000–2012): a time‐series and benchmarking study. BMJ Open 2014;4:e005859 doi:10.1136/bmjopen‐2014‐005859. [DOI] [PMC free article] [PubMed] [Google Scholar]
Schwartz 1996
- Schwartz FW, Busse R. Fixed budgets in the ambulatory care sector: the German experience. Fixing Health Budgets: Experience from Europe and North America. New York: John Wiley & Sons, 1996:93‐108. [Google Scholar]
Schwermann 2003
- Schwermann T, Greiner W, Schulenburg JM. Using disease management and market reforms to address the adverse economic effects of drug budgets and price and reimbursement regulations in Germany. Value in Health 2003;6 Suppl:S20‐S30. [DOI] [PubMed] [Google Scholar]
Smith 1998
- Smith RD, Wilton P. General practice fundholding: progress to date. Britiah Journal of General Practice 1998;48(430):1253‐7. [PMC free article] [PubMed] [Google Scholar]
Soumerai 1993
- Soumerai SB, Avorn J, Taylor WC, Wessels M, Maher D, Hawley SL. Improving choice of prescribed antibiotics through concurrent reminders in an educational order form. Medical Care 1993;31(6):552‐8. [DOI] [PubMed] [Google Scholar]
Steinbrook 2007
- Steinbrook R. Closing the affordability gap for drugs in low‐income countries. New England Journal of Medicine 2007;357(20):1996‐9. [DOI] [PubMed] [Google Scholar]
Stewart‐Brown 1995
- Stewart‐Brown S, Surender R, Bradlow J, Coulter A, Doll H. The effects of fundholding in general practice on prescribing habits three years after introduction of the scheme. BMJ 1995;311:1543‐7. [DOI] [PMC free article] [PubMed] [Google Scholar]
Sturm 2005
- Sturm HB, Gilst WH, Swedberg K, Hobbs FD, Haaijer‐Ruskamp FM. Heart failure guidelines and prescribing in primary care across Europe. BMC Health Services Research 2005;5:57. [DOI] [PMC free article] [PubMed] [Google Scholar]
Takian 2011
- Takian A, Rashidian A, Kabir MJ. Expediency and coincidence in re‐engineering a health system: an interpretive approach to formation of family medicine in Iran. Health Policy Plan 2011;26(2):163‐73. [DOI] [PubMed] [Google Scholar]
Trude 2006
- Trude S, Au M, Christianson JB. Health plan pay for performance strategies. American Journal of Managed Care 2006;12:537‐42. [PubMed] [Google Scholar]
Van Herck 2010
- Herck P, Smedt D, Annemans L, Remmen R, Rosenthal MB, Sermeus W. Systematic review: effects, design choices, and context of pay‐for‐performance in health care. BMC Health Services Research 2010;10:247 doi:10.1186/1472‐6963‐10‐247. [DOI] [PMC free article] [PubMed] [Google Scholar]
Walley 1995
- Walley T, Wilson R, Bligh J. Current prescribing in primary care in the UK. Effects of the indicative prescribing scheme and GP fundholding. Pharmacoeconomics 1995;7(4):320‐31. [DOI] [PubMed] [Google Scholar]
Walley 2004
- Walley T, Mossialos E. Financial incentives and prescribing. Regulating Pharmaceuticals in Europe: Striving for Efficiency, Equity and Quality. Buckinghamshire, UK: Open University Press, 2004:177‐95. [Google Scholar]
Walley 2005
- Walley T, Mrazek M, Mossialos E. Regulating pharmaceutical markets: improving efficiency and controlling costs in the UK. International Journal of Health Planning and Management 2005;20(4):375‐98. [DOI: 10.1002/hpm.820] [DOI] [PubMed] [Google Scholar]
Weiner 1990
- Weiner J, Ferriss D. GP Budget Holding in the UK: Lessons from America. London, UK: King's Fund, 1990. [Google Scholar]
Wilton 1998
- Wilton P, Smith RD. Primary care reform: a three country comparison of 'budget holding'. Health Policy 1998;44(2):149‐66. [DOI] [PubMed] [Google Scholar]
Witter 2012
- Witter S, Fretheim A, Kessy FL, Lindahl AK. Paying for performance to improve the delivery of health interventions in low‐ and middle‐income countries. Cochrane Database of Systematic Reviews 2012;Issue 2:Art. No.:CD007899. DOI: 10.1002/14651858.CD007899.pub2. [DOI] [PubMed] [Google Scholar]
Zaidi 2013
- Zaidi S, Bigdeli M, Aleem N, Rashidian A. Access to essential medicines in Pakistan: policy and health systems research concerns. PLoS One 2013;8(5):e63515. doi: 10.1371/journal.pone.0063515. [DOI] [PMC free article] [PubMed] [Google Scholar]
References to other published versions of this review
Sturm 2007
- Sturm H, Austvoll‐Dahlgren A, Aaserud M, Oxman AD, Ramsay C, Vernby A, et al. Pharmaceutical policies: effects of financial incentives for prescribers. Cochrane Database of Systematic Reviews 2007, Issue 3. [DOI: 10.1002/14651858.CD006731] [DOI] [PubMed] [Google Scholar]