

Abstract
Background:
Metabolic disorders such as obesity and diabetes can cause dysfunction of endothelial cells (ECs) and vascular rarefaction in adipose tissues. However, the modulatory role of ECs in adipose tissue function is not fully understood. Other than VEGF-VEGFR-mediated angiogenic signaling, little is known about the EC-derived signals in adipose tissue regulation. We previously identified Argonaute 1 (AGO1; a key component of microRNA-induced silencing complex) as a crucial regulator in hypoxia-induced angiogenesis. In this study, we intend to determine the AGO1-mediated EC transcriptome, the functional importance of AGO1-regulated endothelial function in vivo, and the relevance to adipose tissue function and obesity.
Methods:
We generated and subjected mice with EC-AGO1 deletion (EC-AGO1-KO) and their wild-type littermates (WT) to a fast-food-mimicking, high-fat high-sucrose diet and profiled the metabolic phenotypes. We employed crosslinking immunoprecipitation (iCLIP)- and RNA-sequencing to identify the AGO1-mediated mechanisms underlying the observed metabolic phenotype of EC-AGO1-KO. We further leveraged cell cultures and mouse models to validate the functional importance of the identified molecular pathway, for which the translational relevance was explored using human endothelium isolated from healthy and obese/Type 2 diabetic donors.
Results:
We identified an anti-obesity phenotype of EC-AGO1-KO, evident by lower body weight and body fat, improved insulin sensitivity, and enhanced energy expenditure. At the organ level, we observed the most significant phenotype in the subcutaneous and brown adipose tissues of KO mice, with greater vascularity and enhanced browning and thermogenesis. Mechanistically, EC-AGO1 suppression results in inhibition of thrombospondin-1 (THBS1/TSP1), an anti-angiogenic and pro-inflammatory cytokine that promotes insulin resistance. In EC-AGO1-KO mice, overexpression of TSP1 substantially attenuated the beneficial phenotype. In human endothelium isolated from obese and/or type 2 diabetic donors, AGO1 and THBS1 are expressed at higher levels than the healthy controls, supporting a pathological role of this pathway.
Conclusions:
Our study suggests a novel mechanism by which ECs, through AGO1-TSP1 pathway, control vascularization and function of adipose tissues, insulin sensitivity, and whole-body metabolic state.
Keywords: AGO1, TSP1/THBS1, angiogenesis, endothelial cells, adipose tissue, insulin resistance, obesity
Introduction
Obesity is the most common cause of insulin resistance, which drives type 2 diabetes mellitus (T2DM) and poses an epidemic threat to public health1. In obesity, adipocytes undergo dramatic expansion, which can lead to imbalanced adipokines, chronic inflammation, and tissue fibrosis2, 3. Such adipose tissue remodeling is often accompanied by a loss of capillaries in adipose tissue, which limits the delivery of oxygen, nutrients, and signaling molecules, thereby contributing to adipocyte dysfunction and insulin resistance4, 5.
Lining the inner layer of blood vessel walls, endothelial cells (ECs) are essential for the delivery of oxygen and nutrients as well as the removal of waste products in various tissues and organs. Once regarded a passive barrier, ECs have emerged to be gatekeepers that dynamically respond to metabolic changes and elicit physiological or pathophysiological adaptations in various tissues and organs6. This paradigm is supported by earlier studies, which showed that asymmetric dimethylarginine (ADMA), an endogenous inhibitor of nitric oxide (NO) and anti-angiogenic agent, is elevated in diabetes mellitus and that its reduction improves insulin resistance7,8. Further evidence from mouse models with genetic perturbation in ECs corroborated the crucial role of ECs in maintaining metabolic homeostasis. For example, deletion of apelin receptor in ECs results in impaired glucose utilization and excess tissue fatty acid accumulation9. More recently, EC-specific deletion of sirtuin 1 (SIRT1), an anti-aging molecule, has been shown to decrease capillary density and muscle endurance, whereas overexpressing SIRT1 restores the microvasculature and exercise capacity of old mice10.
In mouse adipose tissues, deletion of vascular endothelial growth factor A (VEGFA) can reduce vascular density and induce adipose hypoxia, inflammation, and metabolic defects on a high-fat diet, whereas induction of VEGFA leads to increased adipose vasculature and reduced hypoxia11. Moreover, deletion of endothelial vascular endothelial growth factor receptor 2 (VEGFR2) inhibits subcutaneous white adipose tissue (SAT) browning, whereas deletion of endothelial VEGFR1 promotes white adipose tissue (WAT) browning to improve metabolic dysfunction12, 13. Much of these effects have been ascribed to the angiogenic function of microvascular ECs; hence modulation of angiogenic signaling has been proposed as a promising strategy to ameliorate adipose tissue dysfunction in obesity and insulin resistance11, 14–16. In addition to angiogenesis-enhanced adipose tissue perfusion, ECs can also regulate adipocyte metabolism and function through paracrine factors13, 17, 18. A recent study discovered that ECs and adipocytes exchange proteins and lipids through small extracellular vesicles (sEV), which is regulated by changes in nutrient states19. These studies highlight a crucial role of microvascular ECs in the regulation of adipose tissue functions and emphasize the importance to elucidate the underlying molecular and cellular mechanisms.
Argonaute (AGO1) proteins are key components of the microRNA (miR)-induced silencing complex (miRISC)20. We previously identified AGO1 to be an essential regulator in the endothelial response to hypoxia, and AGO1 suppression by hypoxia AGO1 results in de-suppression of VEGFA and in turn contributes to hypoxia-induced angiogenesis21. These findings prompted us to pursue the molecular mechanisms underlying the AGO1-regulated angiogenesis and the importance of AGO1-regulated EC function at a whole-body level. To this end, we generated mice with endothelial-specific AGO1 knockout (EC-AGO1-KO).
When challenged with an obesity-inducing high-fat high-sucrose (HFHS) diet, EC-AGO1-KO mice displayed significantly less body weight gain, lower fat mass, and improved insulin sensitivity and energy metabolism. Furthermore, EC-AGO1-KO mice showed higher vascular density in the SAT and brown adipose tissues (BAT), as well as enhanced browning in SAT and thermogenesis in BAT. At the molecular level, we identified a signaling axis linking endothelial AGO1, thrombospondin-1 (TSP1, a potent anti-angiogenic and pro-inflammatory cytokine encoded by THBS1 gene22), and adipocyte browning. Finally, data collected from intima isolated from individuals with insulin resistance (i.e., obesity and T2DM) further support the translational relevance of the identified molecular mechanism.
Methods
All sequencing data have been made publicly available at the Gene Expression Omnibus (GEO, accession number GSE136912). Other data supporting the findings of this study are available from the corresponding author upon reasonable request. Please also refer to Supplemental Methods.
Study approval
All animal experiments conducted have been approved by the Institutional Animal Care and Use Committees at City of Hope and University of California San Diego. Human tissue studies were conducted on deidentified specimens obtained from the Southern California Islet Cell Resource Center at City of Hope. The research consents for the use of postmortem human tissues were obtained from the donors’ next of kin and ethical approval for this study was granted by the Institutional Review Board of City of Hope (IRB #01046). Obesity was defined as a body mass index (BMI) of 30 or greater and T2DM was identified based on diagnosis in the donors’ medical records as well as the percentage of glycated hemoglobin A1c (HbA1c) of 6.5% or higher.
Mouse model
VE-Cadherin-Cre (B6.FVB-Tg [Cdh5-cre]7 Mlia/J) and AGO1-flox mice with C57BL6 background (Ago1tm1.1Tara/J) were purchased from the Jackson Laboratory and bred at City of Hope to generate AGO1 EC-deficient (EC-AGO1-KO) mice. EC-AGO1-KO and their WT littermates from the same breeders were housed in the same cages until subjected to metabolic phenotyping and tissue collection.
Mice (male and female) were randomized to receive irradiated high-fat high-sucrose diet (HFHS diet, D12266B, Research Diets Inc, 17% kcal protein, 32% kcal fat, 51% kcal carbohydrate) starting at 8 weeks old for 16 weeks. Mice under chow diet (D12489B, Research Diets Inc, 16.4% kcal protein, 70.8 % kcal carbohydrate, 4.6 % kcal fat) were kept under the same diet for the same duration. The diet-induced obesity model was performed with 5 batches of animals, each with 6–8 mice per genotype. Body weight was measured at the initiation of HFHS diet and subsequently every other week. Various phenotyping was performed as described in the Supplemental Methods. At the endpoints, mice were euthanized with CO2 inhalation. Posterior subcutaneous fat pads were collected as SAT and lymph nodes were removed. The interscapular fat was isolated as BAT and epididymal adipose tissue as the WAT.
Isolation of murine ECs and human intima from mesenteric arteries
Murine lung ECs were isolated as previously described23 with modifications. Briefly, dissected lungs underwent treatment with Type I collagenase (Worthington Biochemical). Similarly, murine SAT ECs were isolated with a digestion buffer containing collagenase D and dispase II (Roche). Sorting was done with anti-CD31-conjugated magnetic beads and MACS columns (Miltenyi Biotec). The intimal RNA was isolated from human mesenteric artery by flushing once the inner lumen with TRIzol following an established method24.
Statistics
Statistical analyses for data other than high-throughput sequencing (see Supplemental Methods) were performed using SPSS and GraphPad Prism. Two-group comparisons were performed using two-sided Student’s t tests. In all places that involved multiple hypothesis testing, Bonferroni-corrected P values were reported and those < 0.05 were considered statistically significant. In places not involving multiple hypothesis testing, P values < 0.05 were considered statistically significant.
Results
Generation and baseline characterization of EC-AGO1-KO mice
We generated EC-specific AGO1-deficient mice (EC-AGO1-knockout/KO) by crossing mice expressing Cre recombinase under the control of VE-cadherin promoter (VE-cad/CDH5-Cre)25 with those carrying loxP sites flanking Exons 13–16 of the AGO1 gene (AGO1fl/fl) (Figure 1A). This AGO1fl/fl line, when crossed with conditional Cre, led to elimination of AGO1 in the targeted tissues26. The successful targeting of EC-AGO1 was verified at DNA (Figure 1B), messenger RNA (mRNA) and protein levels (Figure 1, C and D and Figure IA in the Supplement). Of note, the expression of other AGOs (i.e., AGO2, AGO3 and AGO4) in ECs and that of AGO1 in non-EC tissues were not affected (Figure 1C and Figure I in the Supplement). From baseline characterization, we did not observe any overt phenotype of EC-AGO1-KO mice in viability, fertility, breeding, or development, which was expected based on previous reports showing the generally normal phenotype of global AGO1/3 double-null mice27. Under normal chow, EC-AGO1-KO had similar body weight, organ weight, and levels of fasting blood glucose as their wild-type (WT) littermates (Figure 1E, dashed blue vs. dashed pink lines; and Figure II in the Supplement).
Figure 1. Generation and phenotyping of EC-specific AGO1-KO mice.
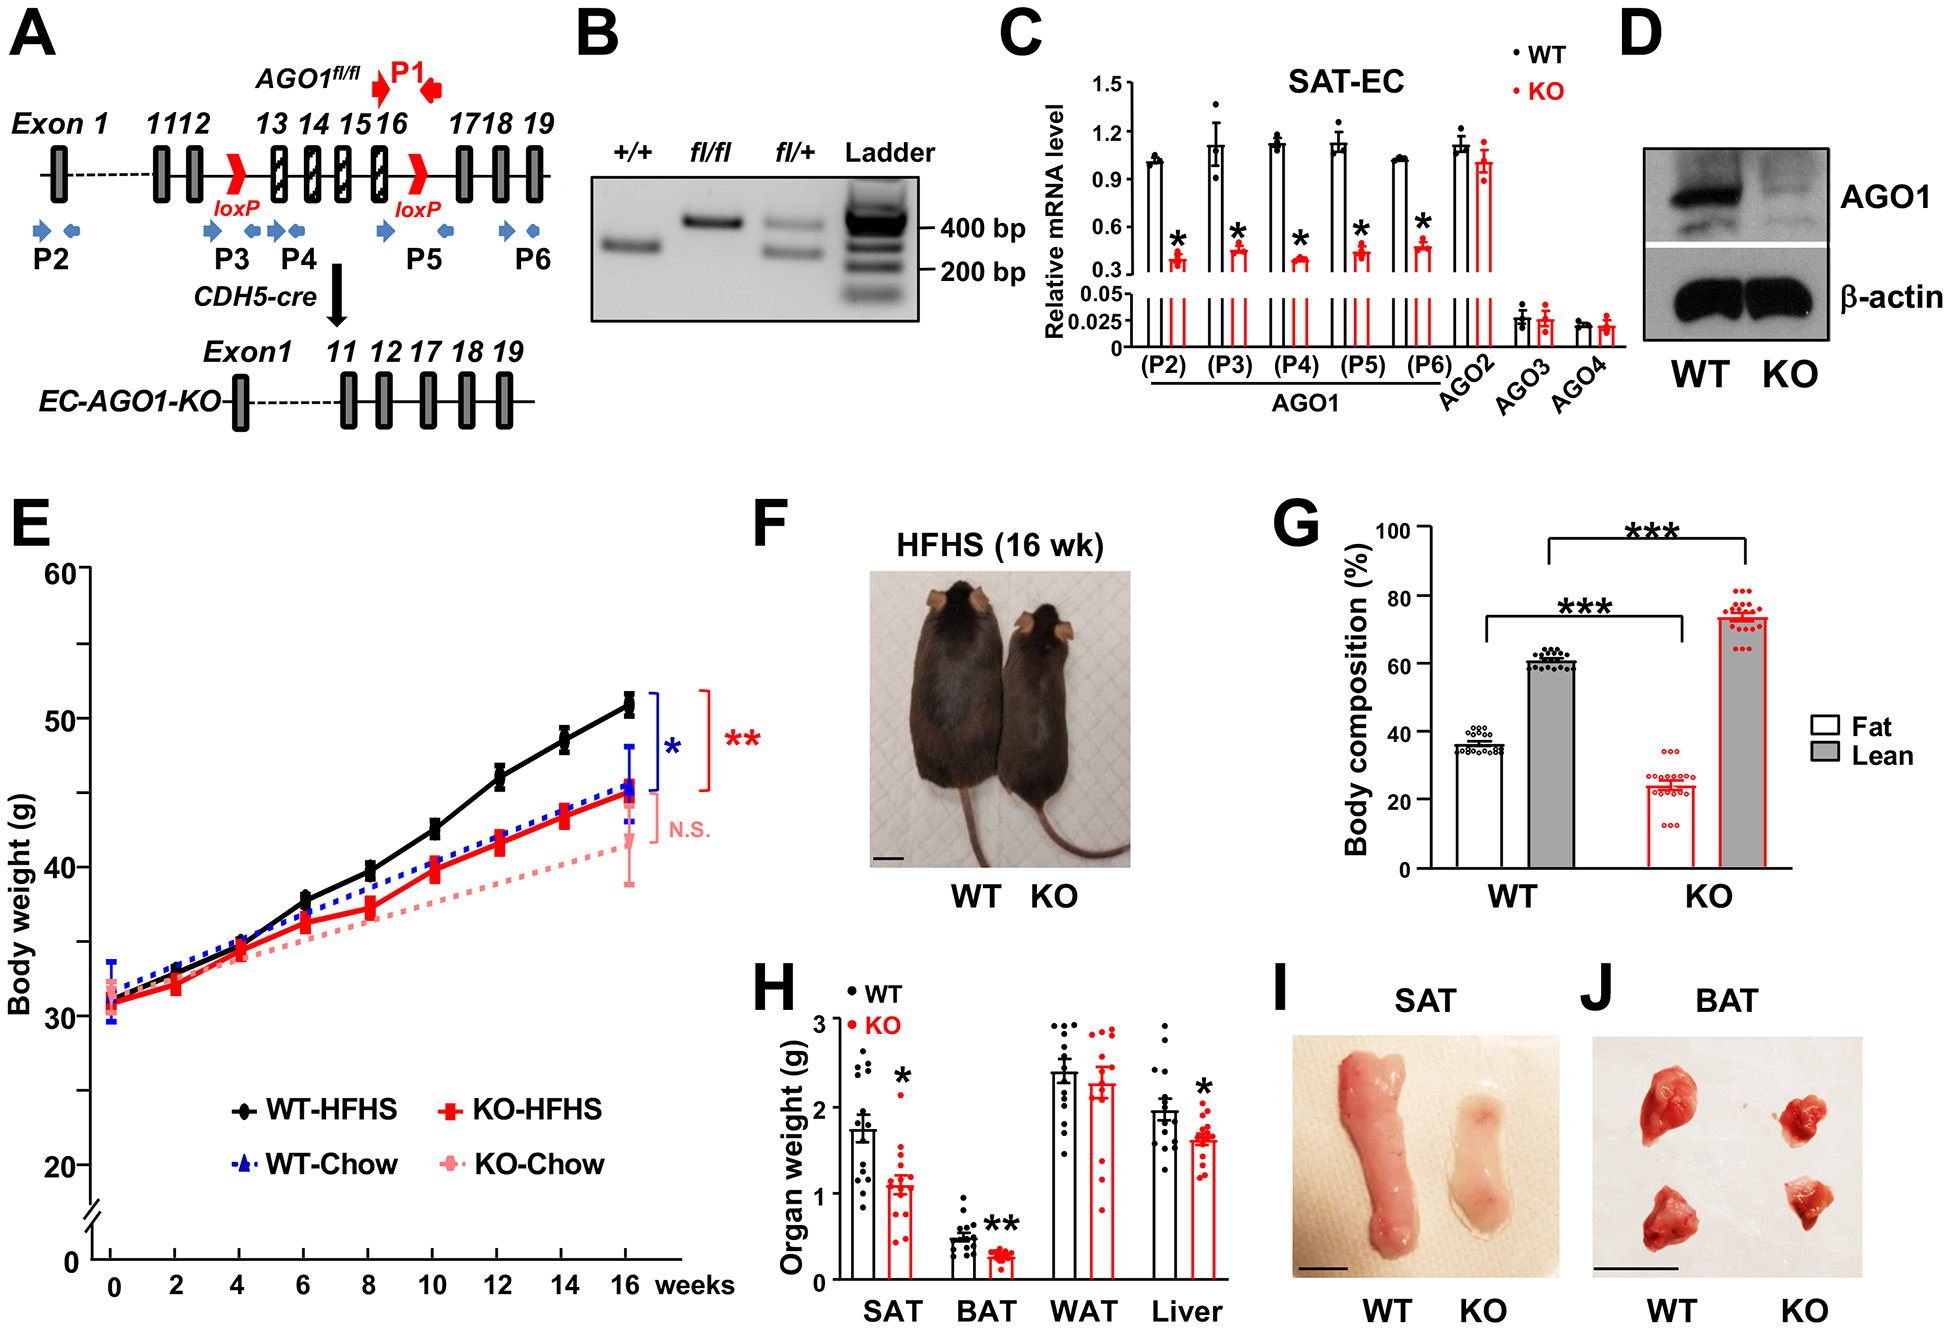
(A) Targeting strategy to create EC-AGO1-KO mice. Red arrows indicate the location of primers used for genotyping (P1) (in B). Blue arrows indicate primers used for qPCR (P2-P6) (in C). (B) PCR-based genotyping of WT, heterozygous, and homozygous KO for the floxed-AGO1 allele(s). (C) qPCR was performed with lysates collected from SAT microvascular EC isolated from 24-week-old male mice. ECs from 3 mice were pooled into one sample in each of the three experiments. (D) Immunoblotting was performed with lysates from microvascular ECs isolated from lungs of 8-week-old male mice. (E-J) Male WT and KO mice were kept on chow or HFHS diet for 16 weeks (y-axis) starting at 8 weeks old. (E) Body weight comparison between indicated groups (n=20 mice/group). Note that dashed blue (WT-Chow) vs dashed pink (KO-Chow) has no significant difference (N.S.), solid black (WT-HFHS) vs dashed blue (WT-Chow) show significant difference (*P < 0.05), and solid black (WT-HFHS) vs solid red (KO-HFHS) also show significant difference (**P < 0.005). (F-J) Representative picture of whole body (in F), body composition measured by Echo MRI, with lean and fat mass plotted as percentage of body weight (in G), weight of multiple organs (in H), and representative images of SAT and BAT obtained from HFHS diet-fed WT and EC-AGO1-KO littermates (I and J) (n=15 mice/group). Scale bars = 1 cm. Data are presented as mean ± SEM. *P < 0.05, ** P < 0.005, *** P < 0.0005 derived from Student’s t tests in (E, G, and H) and *Bonferroni-corrected P < 0.05 in (C).
EC-AGO1-KO mice are protected from high-fat high-sucrose (HFHS) diet-induced obesity and insulin resistance
We used a HFHS diet, which mimics a fast-food diet in humans, to induce obesity, insulin resistance, and pre-T2DM in mice. Consistent with previous reports28, we observed that WT mice fed a HFHS diet exhibited significantly more weight gain (Figure 1E, solid black vs. dashed blue lines), with attendant increase in body fat mass and decrease in lean mass as well as higher fasting glucose levels compared to the chow-fed animals (Figure III, A–C in the Supplement).
Compared to the WT littermates, EC-AGO1-KO mice on the HFHS diet gained significantly less weight over time (i.e., 6 weeks from starting the HFHS diet through 16 weeks) (Figure 1E, solid black vs. solid red lines, Figure 1F, and Figure IV in the Supplement). Notably, by 24 weeks of age, the KO under HFHS diet had comparable weight to their chow-fed WT littermates (Figure 1E, solid red vs. dashed blue lines), suggesting the resistance of KO to HFHS diet-induced weight gain. The significant difference in body weight was attendant with a substantial decrease in body fat mass and increase in lean mass in the KO mice (Figure 1G). We then measured the organ weight potentially contributing to the difference in body fat. While epididymal WAT weights did not differ significantly, SAT and BAT, the adipose depots with significant contribution to thermogenesis and energy expenditure, exhibited the most significant difference, with respectively 34% and 48% decrease in KO, as compared to the WT littermates (Figure 1, H–J). Liver also showed a significant weight decrease, but to a much lesser extent (17%) (Figure 1H).
Attendant with the body weight and fat decrease, insulin sensitivity was improved in EC-AGO1-KO mice, evident by significantly lower fasting glucose levels and improved responses to glucose and insulin (Figure 2, A and B). Of note, the insulin levels were similar between the KO and WT (Figure V in the Supplement), excluding the possibility of hyperinsulinemia in the KO mice. Consistent with the difference in adipose tissue weight, phosphorylation levels of AKT and AMPK, hallmarks of insulin sensitivity, were significantly higher in the SAT and BAT from EC-AGO1-KO mice, despite the negligible to no difference in WAT (Figure 2, C and D).
Figure 2. Improved insulin sensitivity and increased energy expenditure in EC-AGO1-KO mice under HFHS diet.
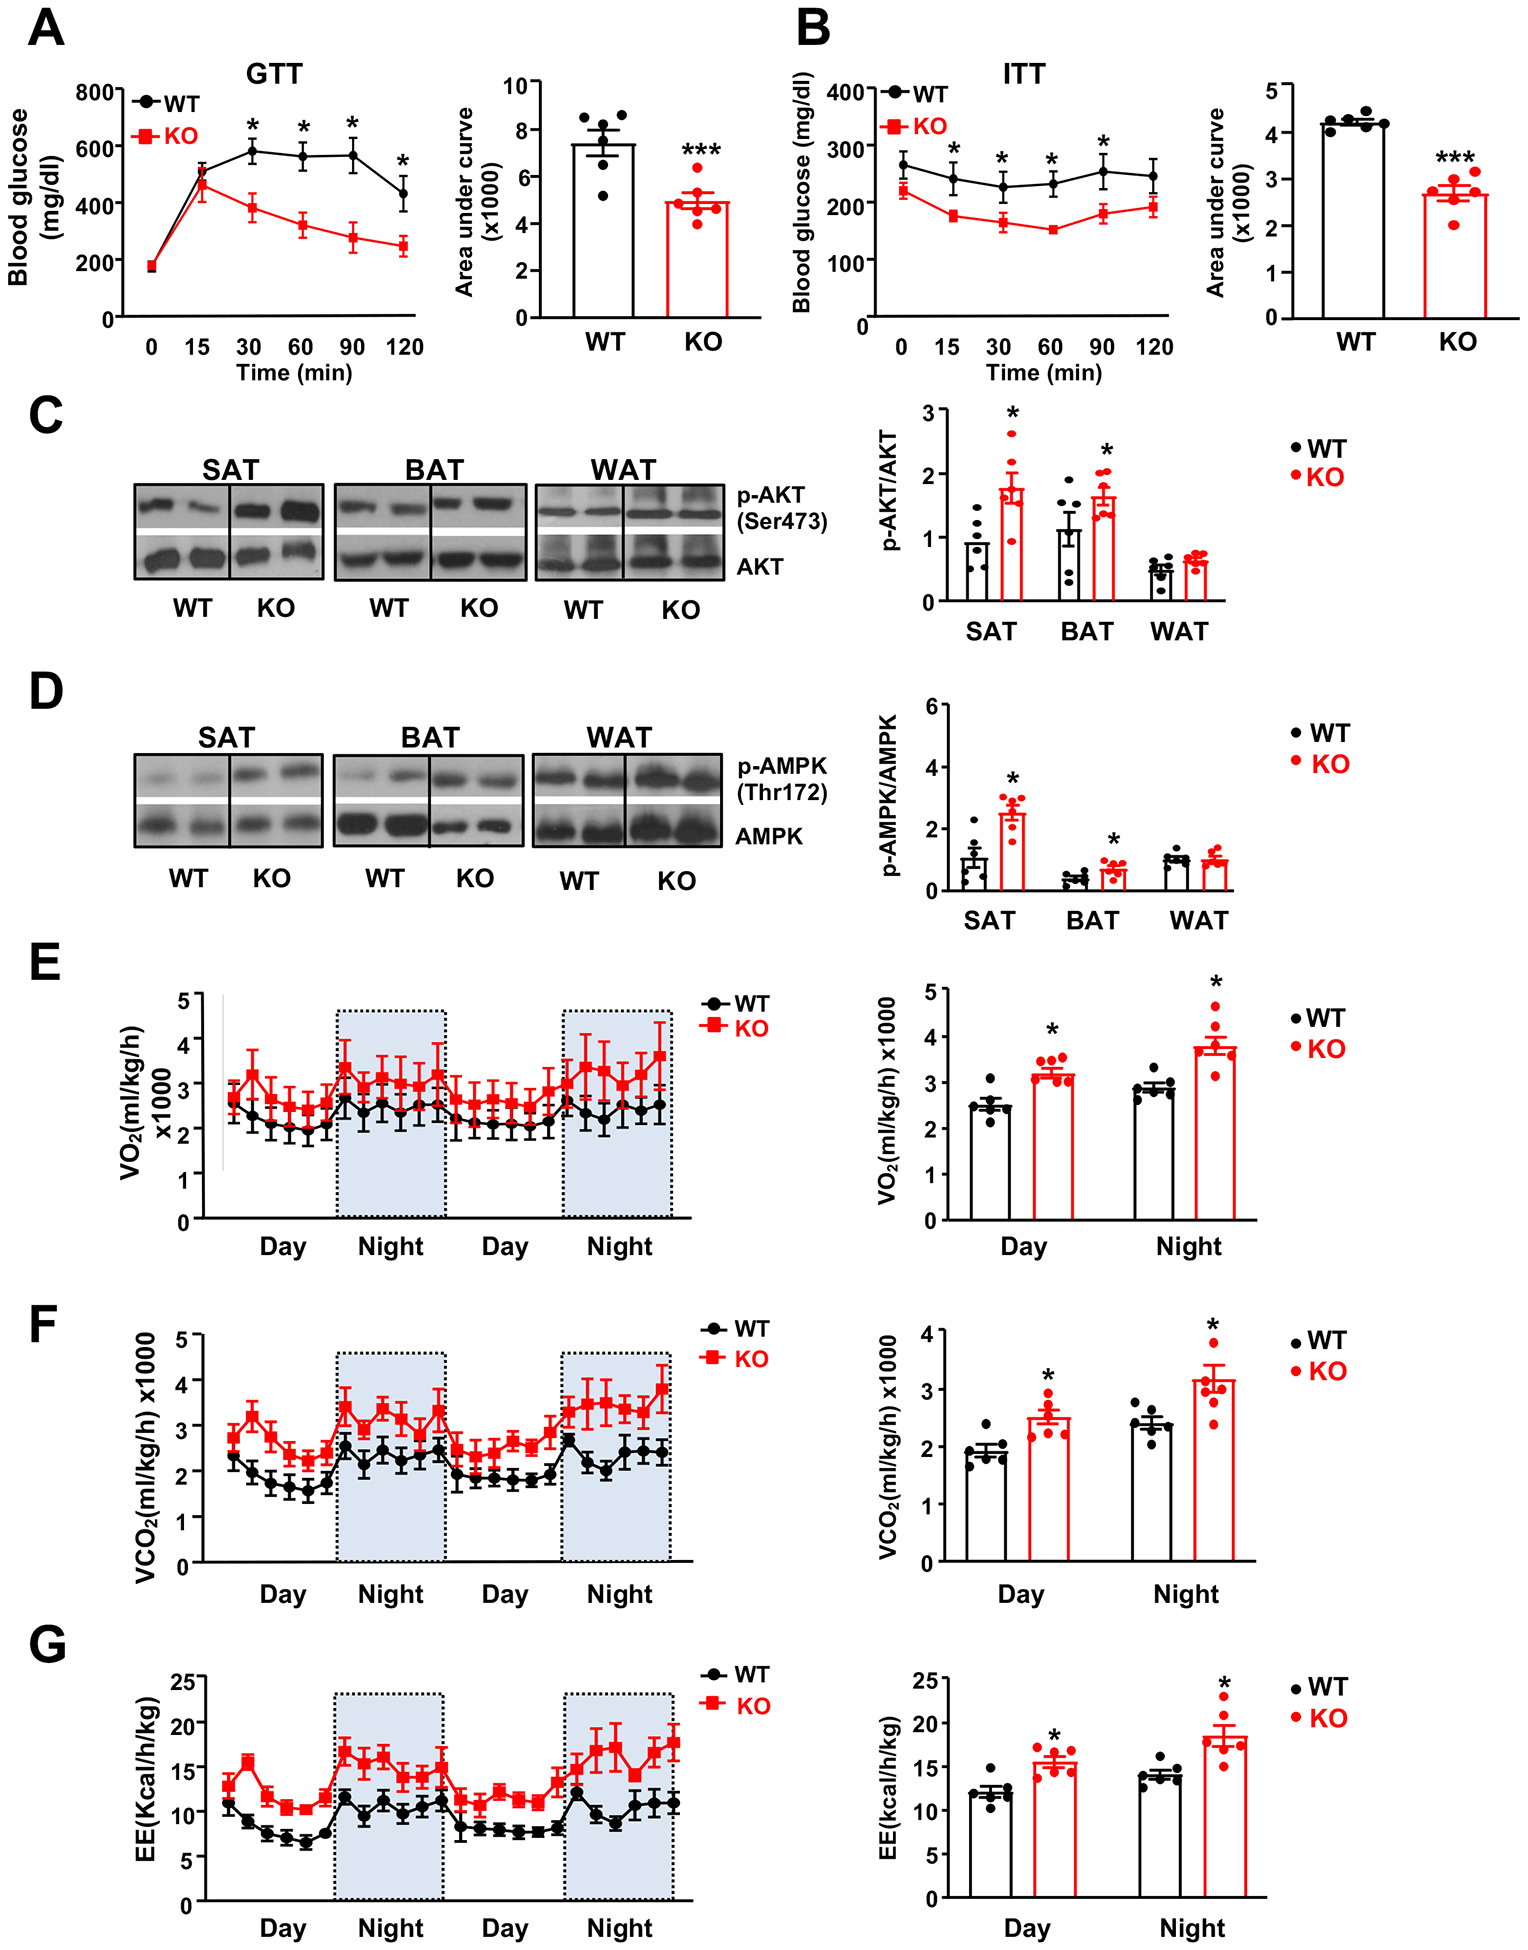
Male EC-AGO1-KO mice and their WT littermates were fed HFHS diet for 16 weeks starting at 8 weeks old (n=6 mice/group). (A, B) Glucose tolerance test (GTT) and insulin tolerance test (ITT). (C, D) Immunoblotting analysis of p-AKT (Ser473) and p-AMPK (Thr172) in adipose tissues. (E-G) Whole body oxygen consumption rate (in E), carbon dioxide production date (in F), and energy expenditure (in G) normalized to body weight. Data are presented as mean ± SEM. *P < 0.05, *** P < 0.0005.
Next, we investigated the underlying mechanism(s) that may explain the improved metabolic phenotype observed in the HFHS-fed EC-AGO1-KO mice. This phenotype was unlikely due to lower food or water intake, or higher locomotor activity, all of which were comparable between the KO and WT littermates (Figure VI, A–C in the Supplement). Using indirect calorimetry, we detected higher rates of VO2 consumption, VCO2 production, and energy expenditure (EE) in the AGO1-EC-KO mice during both the light and dark cycles (Figure 2, E–G), although the respiratory exchange ratio (RER; VCO2/VO2) was similar to that in the WT littermates (Figure VID in the Supplement). Of note, after normalization to lean mass, EC-AGO1-KO mice still displayed significantly higher O2 consumption, CO2 production, and EE on a HFHS diet (Figure VI, E–G in the Supplement). These data demonstrate that EC-AGO1-KO mice have higher catabolic rates and are resistant to diet-induced obesity.
EC-AGO1 deficiency promotes adipose tissue browning and vascularization
The anti-obesity phenotype of EC-AGO1-KO mice, specifically, the reduced adiposity in SAT and BAT, prompted us to investigate the underlying molecular and cellular mechanisms. Compared to WT mice, SAT from EC-AGO1-KO mice exhibited a browning phenotype, evident by a decrease in the size and increase in the density of adipocytes, many of which contained multilocular lipid droplets (Figure 3, A and B), indicative of higher mitochondrial activity. In line with these histological changes, the protein level of uncoupling protein 1 (UCP1), a hallmark of adipose browning28, as well as the portion of UCP1+ cells were higher in the SAT of EC-AGO1-KO mice (Figure 3C). At the transcriptional level, several hallmark genes governing browning and thermogenesis, including peroxisome proliferator-activated receptor gamma coactivator 1-alpha (PGC1α), its known downstream UCP1, and cell death activator CIDE-A (Cidea)29, 30 were also increased (Figure 3D). RNA-seq profiling of the SAT transcriptome revealed that more genes involved in browning and thermogenesis were upregulated in the EC-AGO1-KO (Figure 3G). Furthermore, genes involved in pathways promoting energy consumption and insulin sensitivity e.g. lipolysis and mitochondrial biogenesis and function, were upregulated, whereas those positively involved in lipogenesis, inflammation, and fibrosis were downregulated (Figure 3G).
Figure 3. AGO1-EC-KO mice show higher browning activity and vascularization in SAT and BAT.
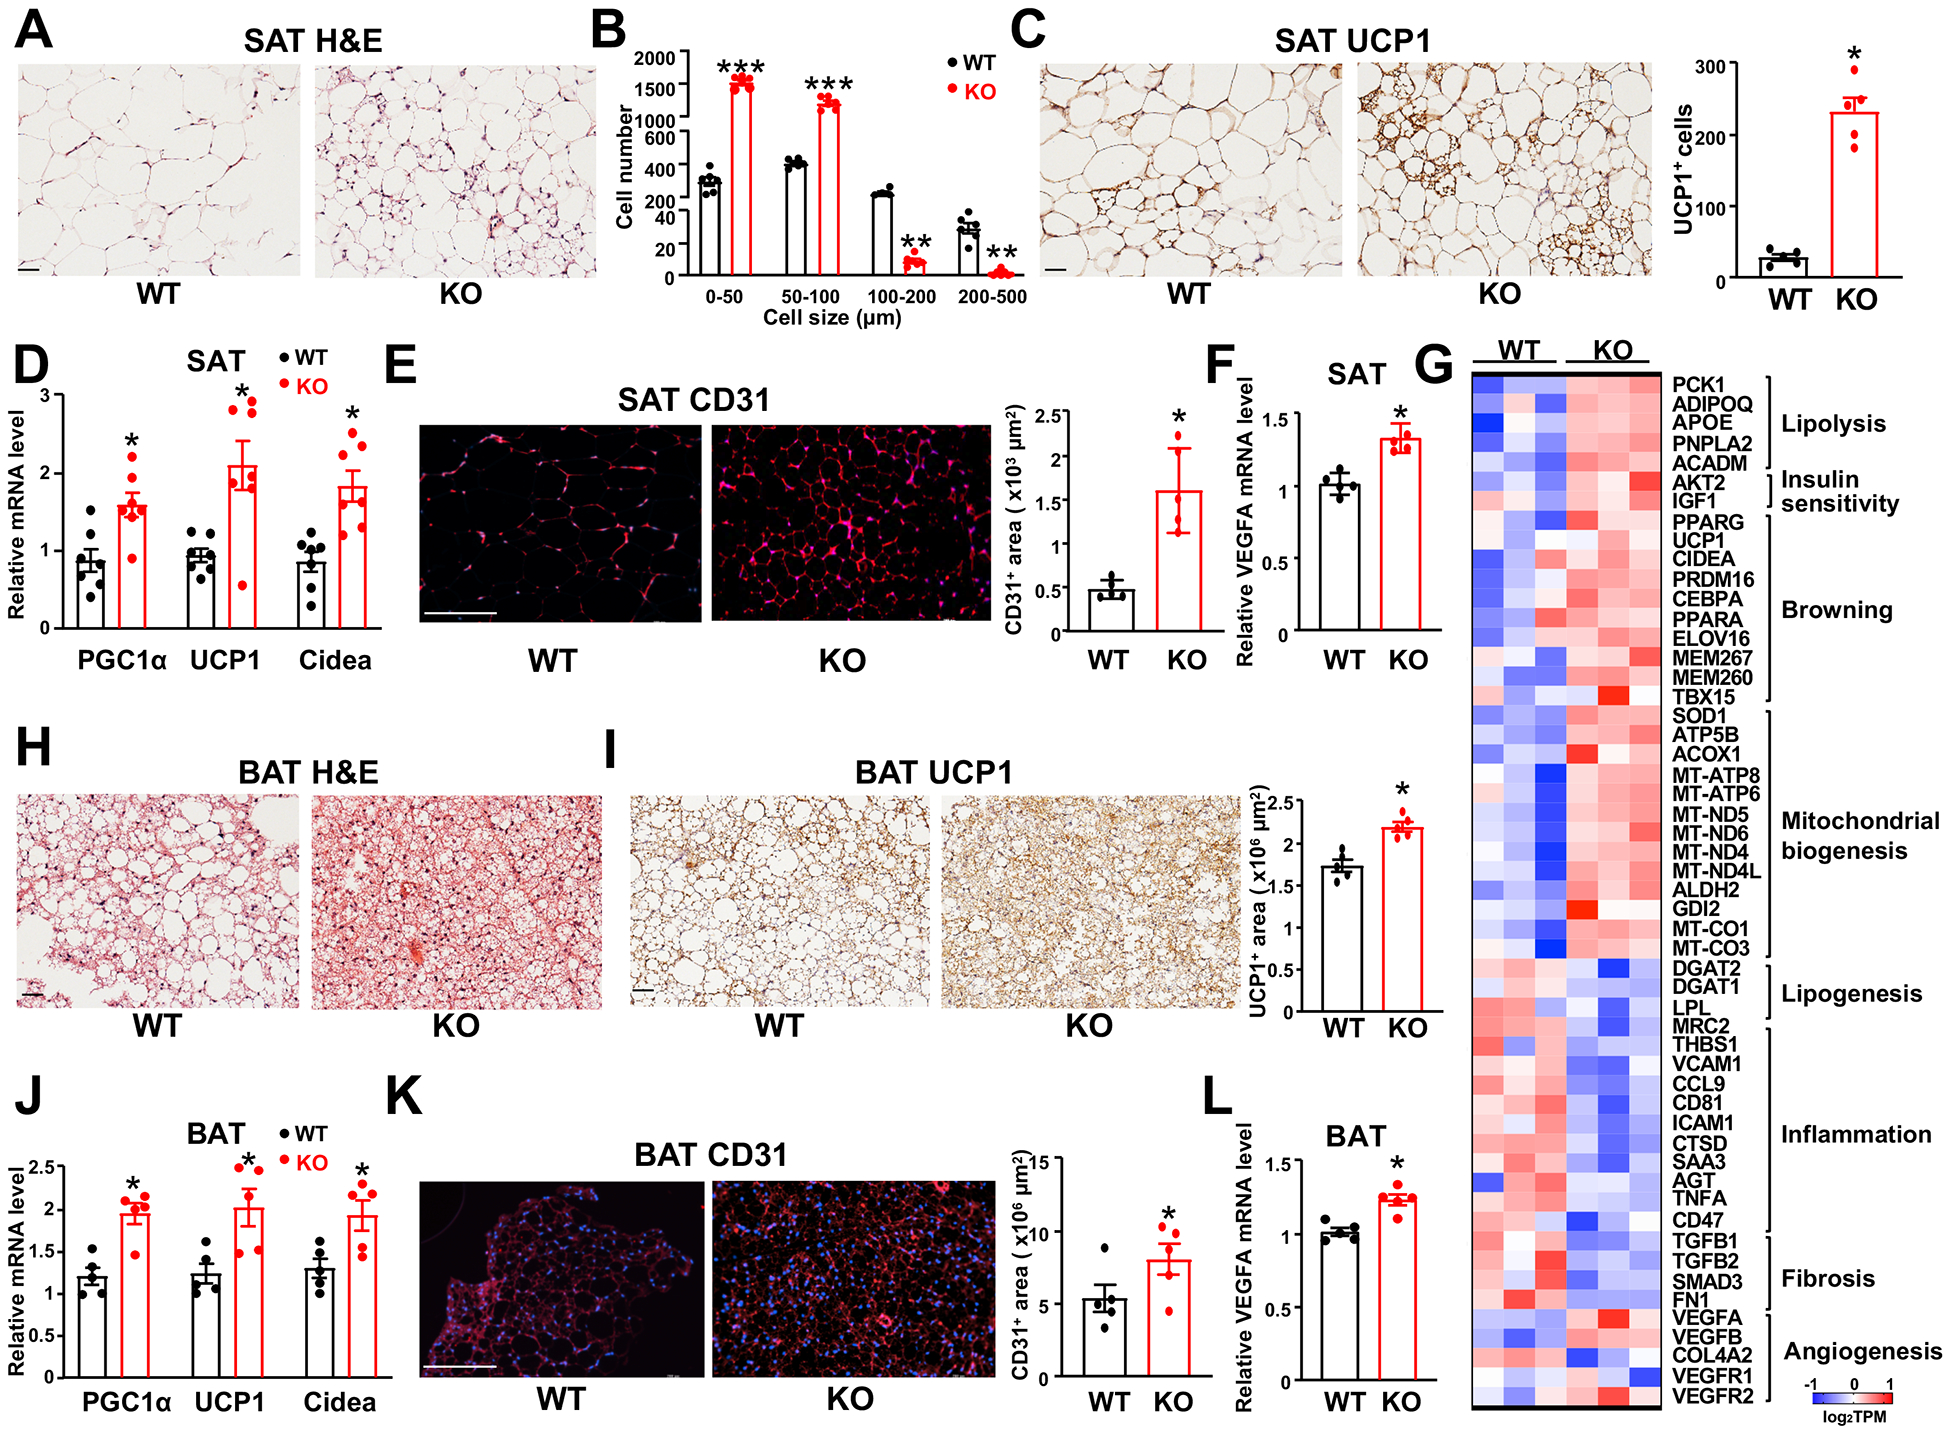
Mice were fed HFHS diet as in Figure 2. (A) Representative images of HE staining of SAT (n=6 mice/group). (B) Quantification of sizes and numbers of adipocytes (n=6 mice/group). (C) Immunohistochemical (IHC) staining of UCP1 in SAT (n=5 mice/group). (D) qPCR analysis of mRNA levels of genes as indicated in SAT (n=7 mice/group). (E) Immunofluorescent (IF) staining of CD31 in SAT (n=5 mice/group). (F) qPCR detection of VEGFA mRNA level in SAT (n=5 mice/group). (G) Heat map showing SAT gene expression profiled by RNA-seq plotted with log2TPM (n=3 mice/group). (H-L) HE staining (in H), UCP1 IHC (in I), qPCR analysis (in J and L), and CD31 IF (in K) in BAT (n=5 mice/group). Scale bars = 50 μm in (A), (C), (H), and (I); scale bars in (E and K) = 200 μm. Data are presented as mean ± SEM. *P < 0.05, ** P < 0.005, *** P < 0.0005 in (B, C, E, F, I, K, and L) and *Bonferroni-corrected P < 0.05 in (D and J).
To link EC-specific AGO1 deficiency to the dramatic change in SAT, we proposed the enhanced angiogenesis and vascularization to be a likely mechanism5, 12, 13, 31. Indeed, CD31 staining of microvascular ECs in SAT was significantly increased in the SAT isolated from EC-AGO1-KO (Figure 3E), consistent with a pro-angiogenic gene program as revealed by RNA-seq (Figure 3G). As one of the best-characterized pro-angiogenic factors, the expression level of the VEGFA was significantly increased, albeit moderately (Figure 3F). Notably, similar changes at the molecular, cellular, and tissue levels were also observed in the BAT, suggesting that EC-AGO1-suppression promoted the angiogenesis and thermogenic function of BAT (Figure 3, H–L).
AGO1 mediates THBS1/TSP1 targeting in microvascular EC
To elucidate the molecular mechanisms underlying the enhanced vascularization and browning of SAT observed in EC-AGO1-KO mice, we performed individual nucleotide resolution crosslinking-immunoprecipitation sequencing (iCLIP-seq)32 to unambiguously profile the genome-wide AGO1-associated RNA transcripts (i.e. AGO1-targetome) in HMVECs under normoxia and moderate hypoxia (2% O2), which is known to suppress AGO1 and promote angiogenesis21 (Figure VIIA in the Supplement). We then correlated these data with the corresponding transcriptome profiles of the HMVECs subjected to hypoxia following a time course, i.e., for 12, 24, and 48 hours using RNA-seq.
iCLIP-seq revealed that AGO1-associated transcripts align to diverse genomic regions, with substantial portions targeting the 3’ untranslated region (UTR) (Figure VIIB in the Supplement), in line with the previous reports that AGO1 mainly participates in miRNA-mediated gene silencing, predominantly through 3’UTR targeting20, 33. The intersection of RNA-seq and iCLIP-seq profiles (focusing on the 3’UTR reads) identified two gene groups of interest: 1) 169 genes of which 3’UTR binding to AGO1 was increased but mRNA expression was downregulated by hypoxia (suggesting an AGO1-mediated suppression) and 2) 160 genes of which 3’UTR binding to AGO1 was decreased but mRNA expression was upregulated by hypoxia (suggesting AGO1-mediated de-suppression) (Figure 4A). Pathway enrichment analysis indicated the involvement of these genes in multiple pathways related to endothelial response to hypoxia, with angiogenesis as a top enriched pathway (Figure 4, B and C). As AGO1-mediated de-suppression is indirect and was previously examined by us21, we focused on AGO1-mediated suppression mechanisms in the current study.
Figure 4. AGO1 mediates THBS1 targeting and suppression in hypoxic ECs.
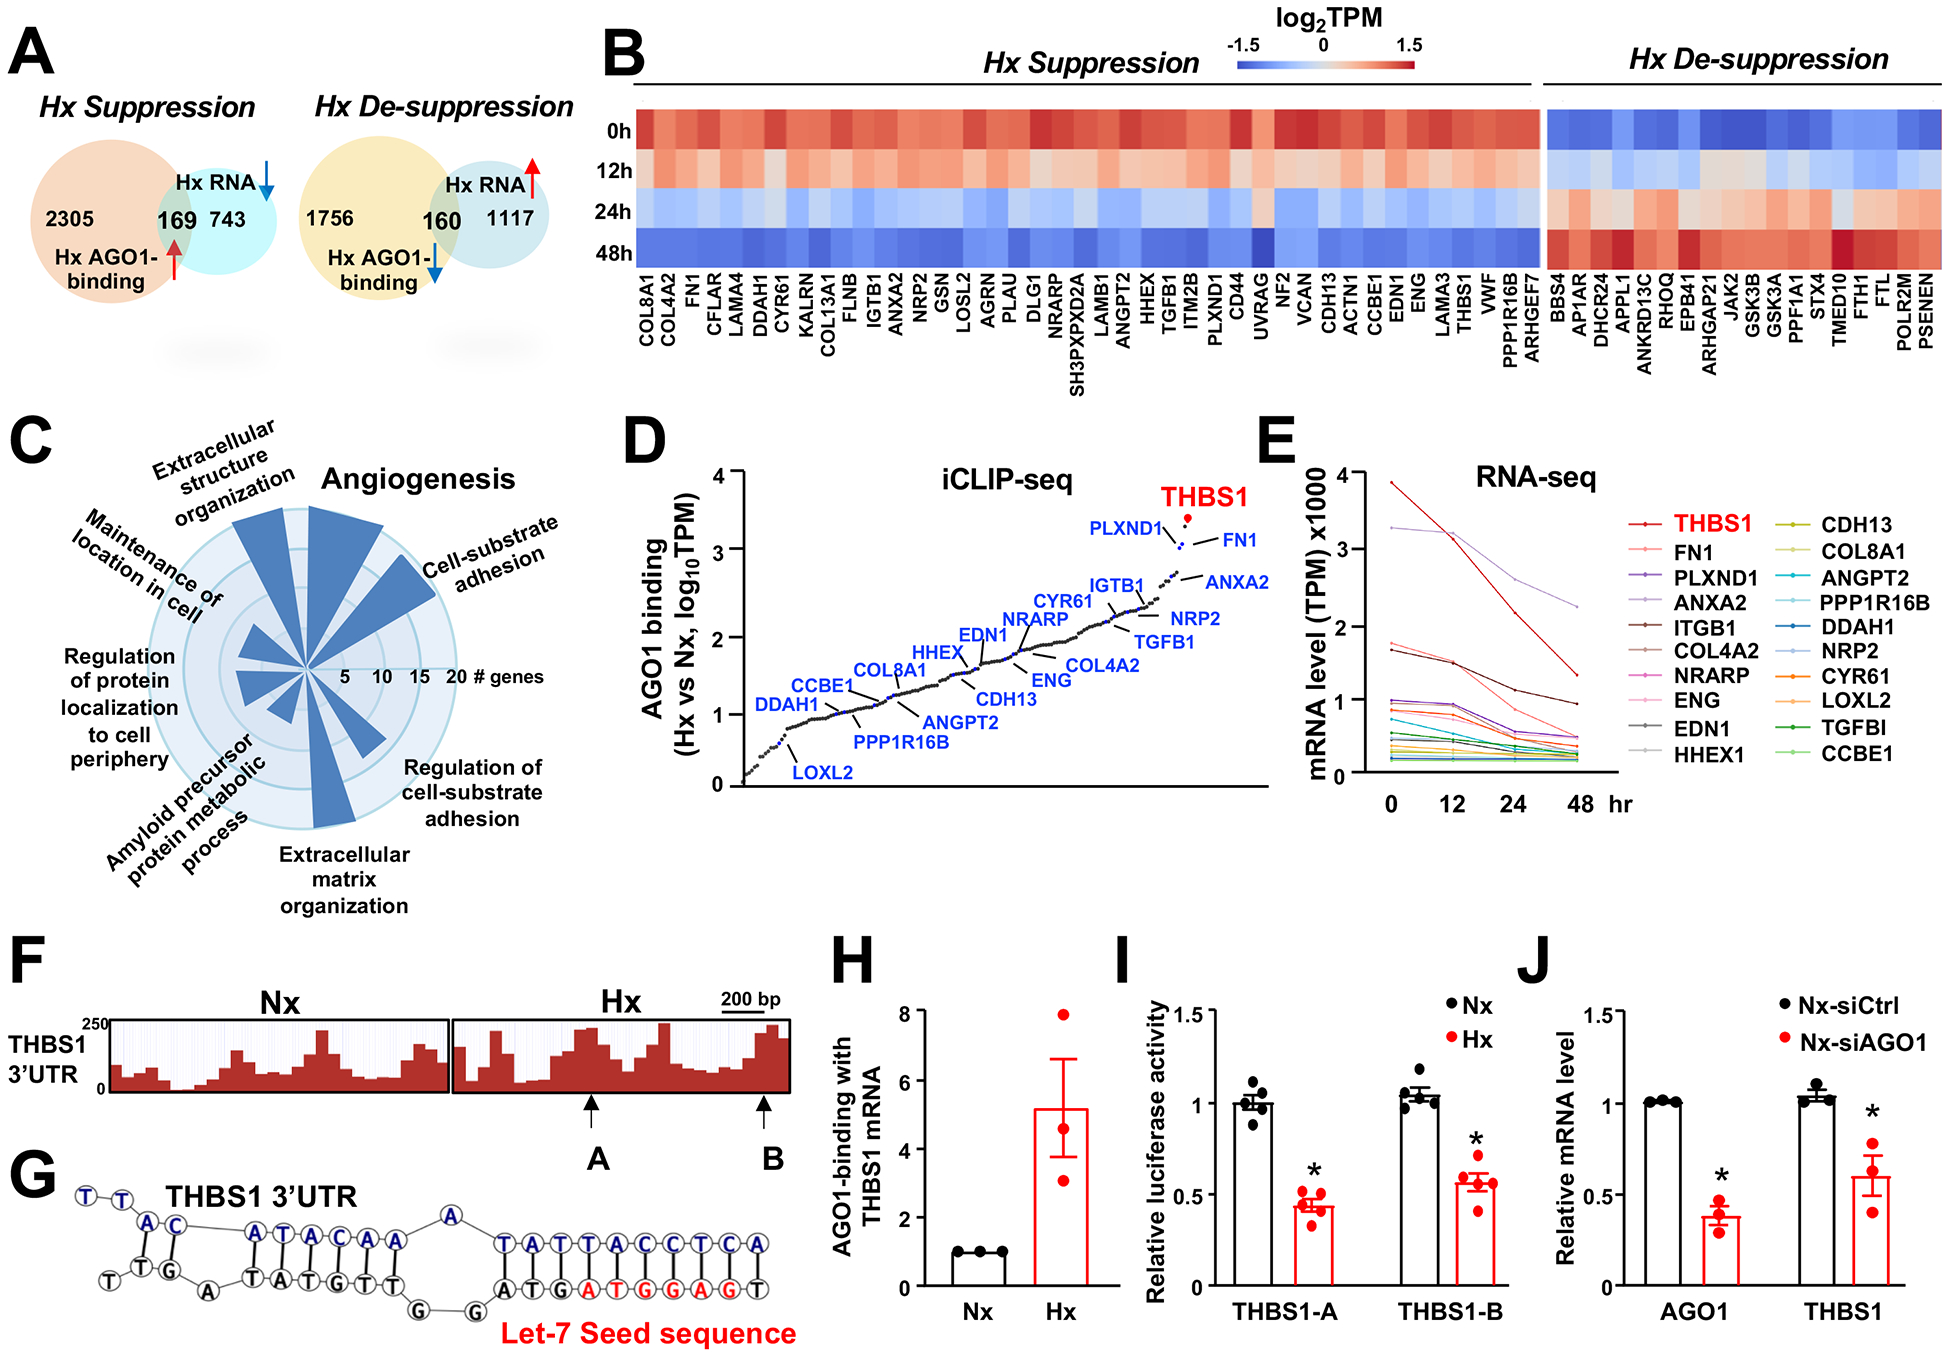
(A-G) Human microvascular endothelial cells (HMVECs) in biological duplicates were subjected to normoxia (Nx, 21% O2; time 0) or hypoxia (Hx, 2% O2) for 12, 24, and 48 hour (hr). RNA-seq was performed for all time points and iCLIP-seq was performed for time 0 and 24 hr treatment. (A) Bioinformatics approach to identify genes that are differentially regulated by hypoxia with significant changes in AGO1 binding, including 169 “hypoxia-suppressed” and 160 “hypoxia-desuppressed”. (B) Heatmap showing the mRNA expression of genes in significantly enriched angiogenesis pathways. (C) A polar bar plot showing the number of genes in each of the significantly enriched GO terms. (D) Changes of 3’UTR-AGO1 binding in hypoxia vs. normoxia for 169 hypoxia-suppressed genes, quantified by log10 absolute change in CLIP-seq reads, with 20 genes involved in angiogenesis pathways indicated. (E) Line plots of the hypoxia-suppressed mRNA expression of 20 genes involved in angiogenesis based on TPM from times-series RNA-seq. (F) Illustration of CLIP-seq reads aligned to 3’UTR of THBS1 under normoxia and hypoxia. Arrows indicate the regions of 3’UTR cloned in luciferase reporter constructs used (in I). (G) Chimeric reads revealing Let-7-THBS1 3’UTR targeting. (H) Quantification of THBS1 mRNA bound to AGO1 under normoxia and hypoxia in HMVECs (n=3). (I) Bovine aortic ECs were transfected with luciferase reporter constructs containing 3’UTR from THBS1 then subjected to normoxia and hypoxia for 24 h (n=5). (J) HMVECs were transfected with scramble (siCtrl) or AGO1 siRNA (20 nM). mRNA levels of AGO1 and THBS1 were quantified by qPCR (n=3). Data are presented as mean ± SEM. *P in (J) and Bonferroni-corrected P in (I) < 0.05.
To prioritize candidates for AGO1-targeted gene suppression, we developed a ranking strategy based upon the following criteria: 1) hypoxia suppression of gene expression (with >50% reduction) and 2) hypoxia-induced increase in AGO1 binding to the 3’ UTR. Following this strategy, THBS1 (gene encoding TSP1 protein) was ranked as the top candidate (Figure 4, D and E). Specifically, the 3’UTR of THBS1 mRNA is strongly enriched in AGO1 complex by hypoxia (Figure 4, D and F) and its mRNA expression followed a time-dependent decrease by hypoxia (Figure 4E). Of note, iCLIP-seq also generates chimeric reads, which are results of intermolecular ligation between proximally situated miRNAs and mRNA during the library preparation. These reads, although at a relatively small portion, provide direct evidence for miRNA-mRNA targeting34. Analysis of these reads further revealed the hypoxia-enriched direct targeting of THBS1 3’UTR by Let-7 (Figure 4G), which is in line with our previous identification of Let-7 to be hypoxia-inducible and AGO1-bound miRNAs in ECs21 and another report demonstrating THBS1 as a Let-7 target with multiple target sites in its 3’UTR34.
To validate the results from high-throughput profiling, AGO1-iCLIP followed by qPCR confirmed the strong enrichment of THBS1 mRNA in the AGO1 complex in HMVECs under hypoxia (Figure 4H). Luciferase assays, using reporter constructs containing the hypoxia-enriched AGO1-binding sites in THBS1 3’UTR (Figure 4G, Figure VIIC in the Supplement), corroborated that hypoxia suppressed THBS1 expression through targeting its 3’UTR (Figure 4I). We queried whether AGO1 silencing, mimicking hypoxia suppression of AGO121, would lead to downregulation of THBS1 mRNA. As expected, when we knocked down AGO1 in ECs, THBS1 mRNA level was significantly decreased (Figure 4J). Collectively, results in Figure 4 suggest that hypoxia, by promoting AGO1-mediated targeting of THBS1 at the 3’UTR, downregulates the expression of TSP1; such an effect could be mimicked by AGO1 suppression, which given the potent anti-angiogenic effect of TSP122, may explain the increased angiogenesis in EC-AGO1-KO.
THBS1/TSP1 is suppressed in the SAT of EC-AGO1-KO
Next, we investigated whether the AGO1-mediated suppression of THBS1/TSP1 is operative in vivo. Compared to the WT mice, EC-AGO1-KO expressed significantly lower levels of THBS1/TSP1 in both SAT and BAT, at mRNA and protein levels (Figure 5, A and B and Figure VIII, A and B in the Supplement), consistent with RNA-seq data (Figure 3G). Of note, this decrease was absent in WAT, which did not show significant phenotypic difference (Figure VIIID in the Supplement). Furthermore, co-staining of TSP1 and CD31 in SAT suggests that TSP1 was mainly expressed in CD31-positive areas (Figure 5C and Figure VIII, C in the Supplement). Consistently, in microvascular ECs isolated from SAT, THBS1/TSP1 levels were significantly decreased in the EC-AGO1-KO (Figure 5, D and E). In addition, although expressed at much lower abundance than in ECs, TSP1 protein levels were also decreased in the adipocytes isolated from EC-AGO1-KO (Figure IX in the Supplement).
Figure 5. EC-AGO1-KO mice have decreased expression of TSP1 and associated changes in adipose tissues and ECs.
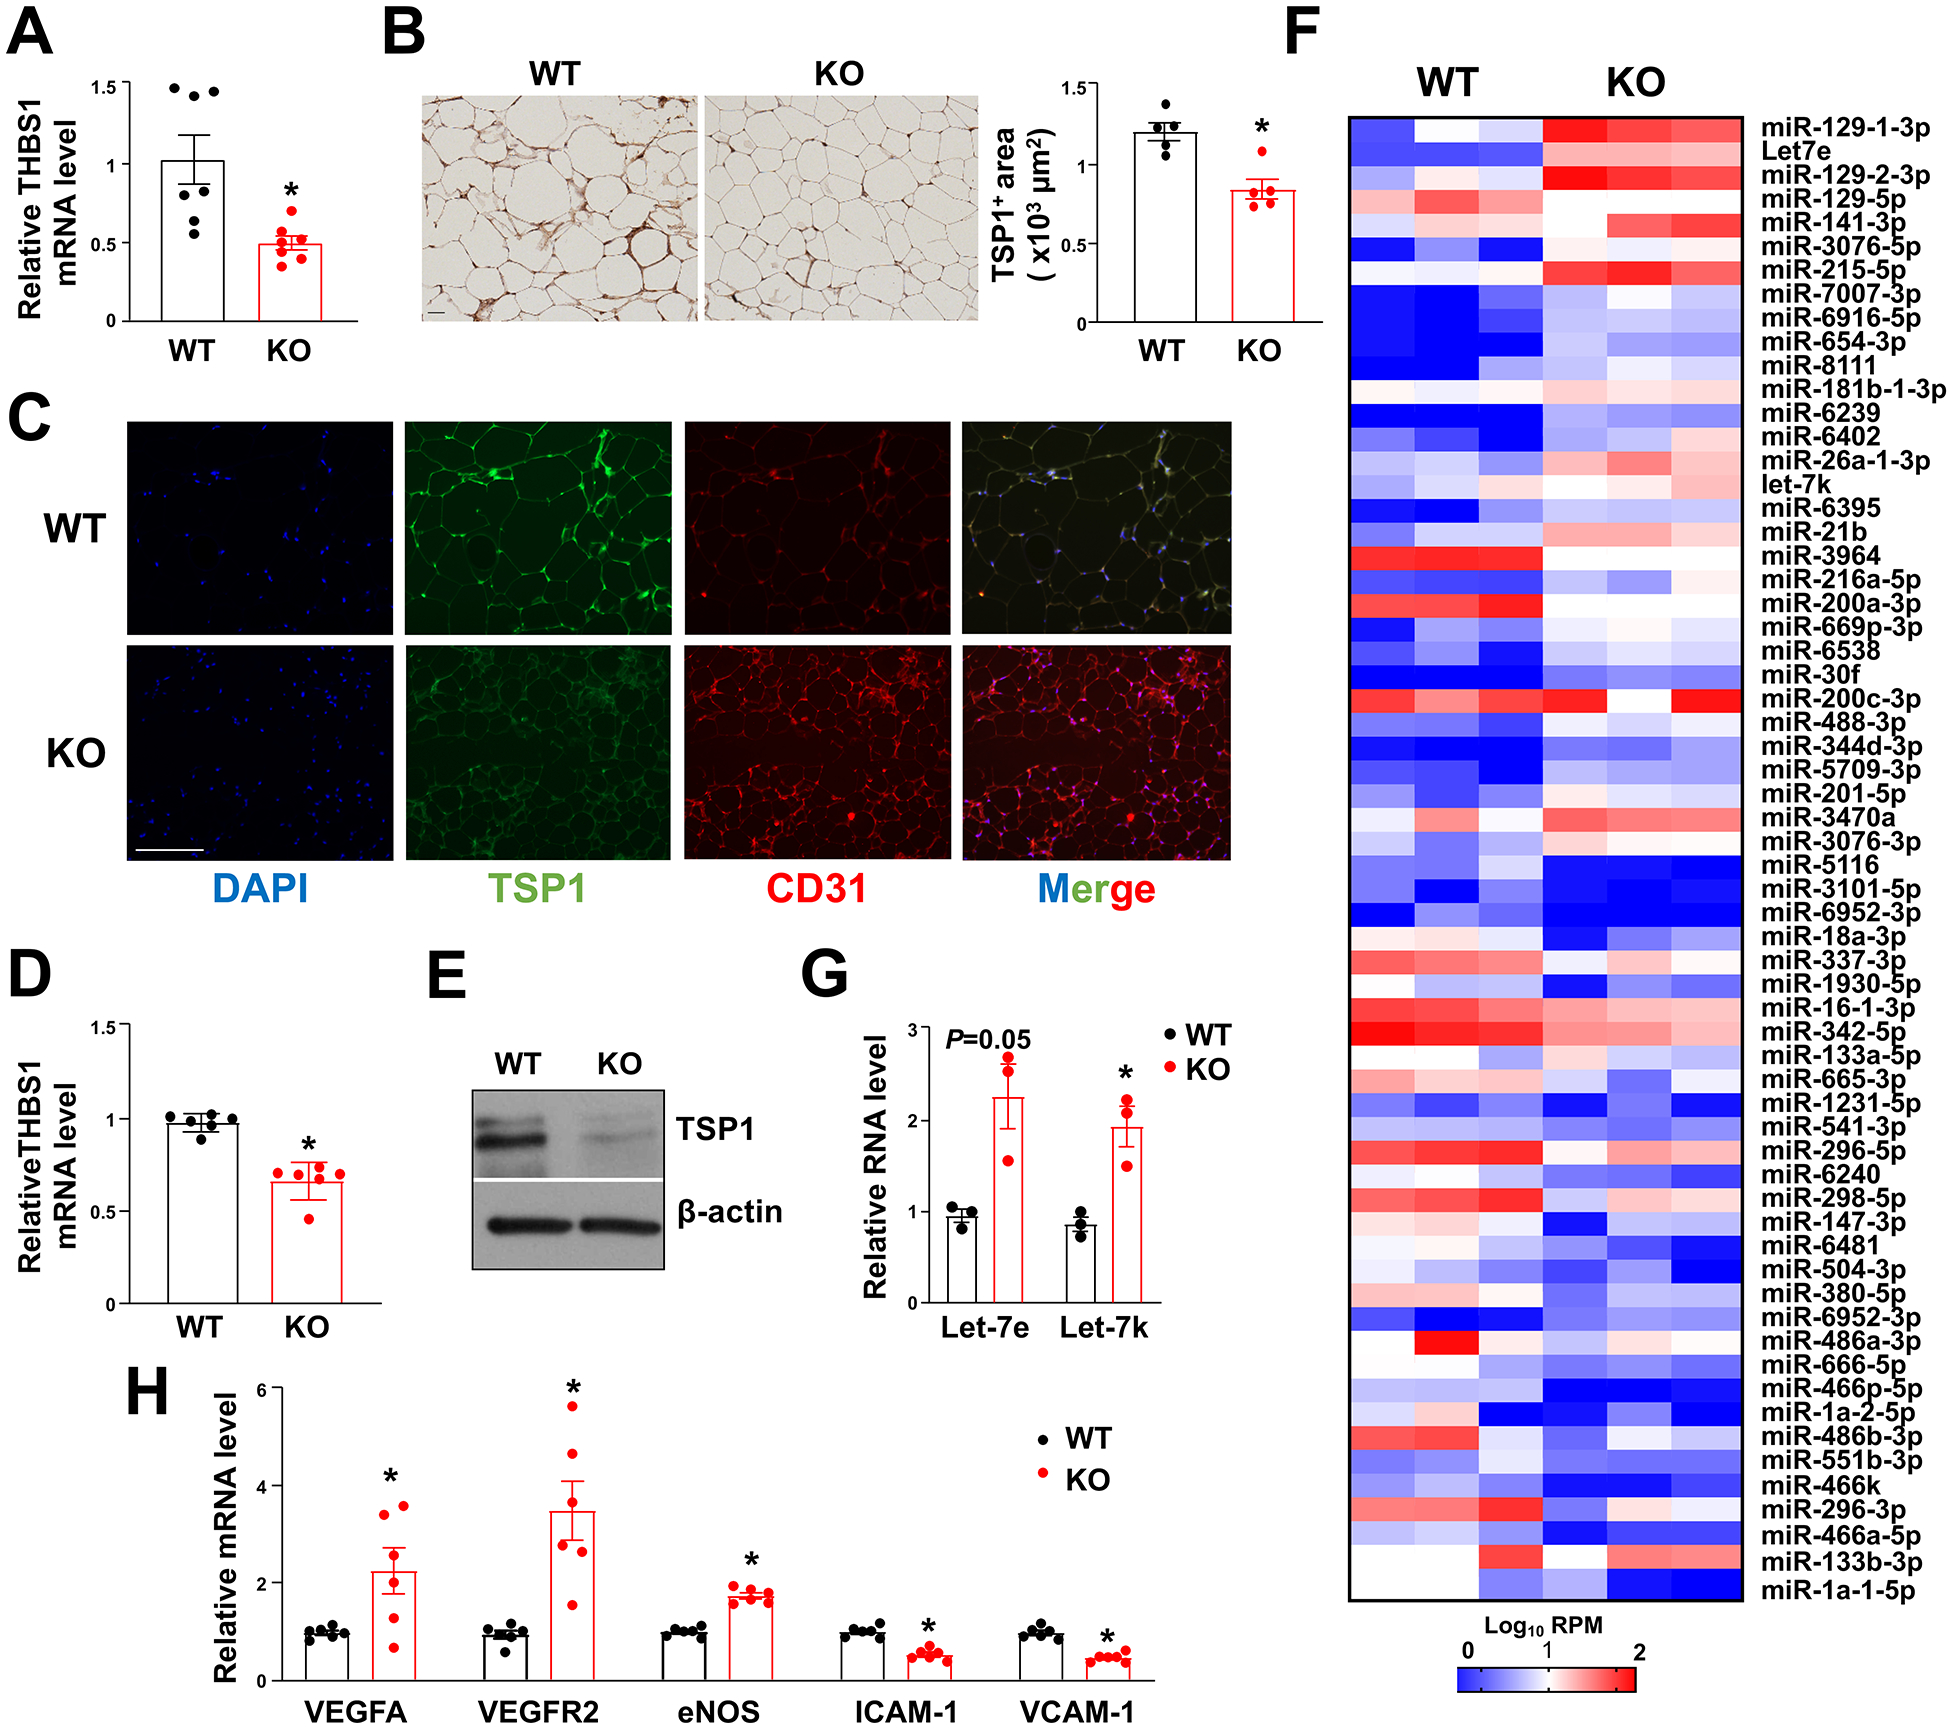
Mice were fed HFHS diet as in Figure 2. (A) qPCR analysis of THBS1 mRNA expression levels in SAT (n=7 mice/group). (B) Immunohistochemistry of TSP1 in SAT (n=5 mice/group). Scale bar = 50 μm. (C) Co-IF of TSP1 and CD31 in SAT (representative of n=5 mice/group). Scale bar = 50 μm. (D, E) TSP1 mRNA and protein expression levels in microvascular ECs isolated from SAT from HFHS diet-fed WT and EC-AGO1-KO mice (n=6 mice/group). (F) Heat map showing miRNA levels in SAT profiled by small RNA-seq (n=3 mice/group). (G) Taqman miRNA qPCR for Let-7e and −7k levels in ECs isolated from SAT (n=3 mice/group). (H) qPCR analysis of indicated mRNA in EC isolated from SAT (n=6 mice/group). Data are presented as means ± SEM. *P in (A, B, and D) or Bonferroni-corrected P in (G and H) < 0.05.
To correlate with the difference in SAT gene expression, we also profiled miRNA in SAT using small RNA-seq (Figure 5F). Despite the extensive changes in miRNAs due to EC-AGO1-KO, many changes were not statistically significant. We validated the levels of two exemplary Let-7 members (i.e., Let-7e and Let-7k), which were revealed by iCLIP-seq to target THBS1 (Figure 4, D–I). In line with the trendy increase in SAT from EC-AGO1-KO revealed by small RNA-seq, Let-7e and −7k were also increased in the ECs isolated from these SATs (Figure 5G), suggesting Let-7-targeting of THBS1 in ECs as a mechanism underlying the suppression of TSP1 in EC-AGO1-KO.
The regulatory role of TSP1 has been implicated in various pathways in ECs, including angiogenesis, NO signaling, and response to oxidative and inflammatory stress22, 35, 36. We hence examined the expression of several marker genes for endothelial function. Whereas the key regulators promoting angiogenesis, i.e., VEGFA, VEGFR2 and hallmark molecule for EC function, i.e., endothelial NO synthase (eNOS) were increased, the pro-inflammatory genes known to be regulated by eNOS, i.e. vascular cell adhesion molecule 1 (VCAM-1) and intercellular adhesion molecule 1 (ICAM-1) were decreased in ECs from SAT of KO mice, suggesting improved microvascular EC function in these animals (Figure 5H).
Suppression of THBS1/TSP1 mediates the effect of AGO1 deficiency to improve adipose function
To determine whether suppression of THBS1/TSP1 can explain, at least in part the metabolic effect of EC-AGO1-KO, we ectopically expressed mouse TSP1 protein using adenovirus (Ad-TSP1) in the SAT of EC-AGO1-KO mice subject to HFHS diet (Figure 6A). The efficiency of the adenovirus in overexpressing TSP1 was verified in human embryonic kidney (HEK)-293 cells (Figure X, A and B in the Supplement), and the viral expression in the SAT was confirmed by the positive signal of GFP, flow cytometry of TSP1+ cells (>90%), and the strongly induced THBS1 mRNA level (Figure 6, B–D). Compared to mice receiving control virus, mice administered with Ad-TSP1 expressed significantly lower levels of browning markers, i.e., PGC1α, and its downstream UCP1 and Cidea in the SAT (Figure 6D).
Figure 6. Ectopic expression of TSP1 abolishes the effect of EC-AGO1-KO in SAT browning.
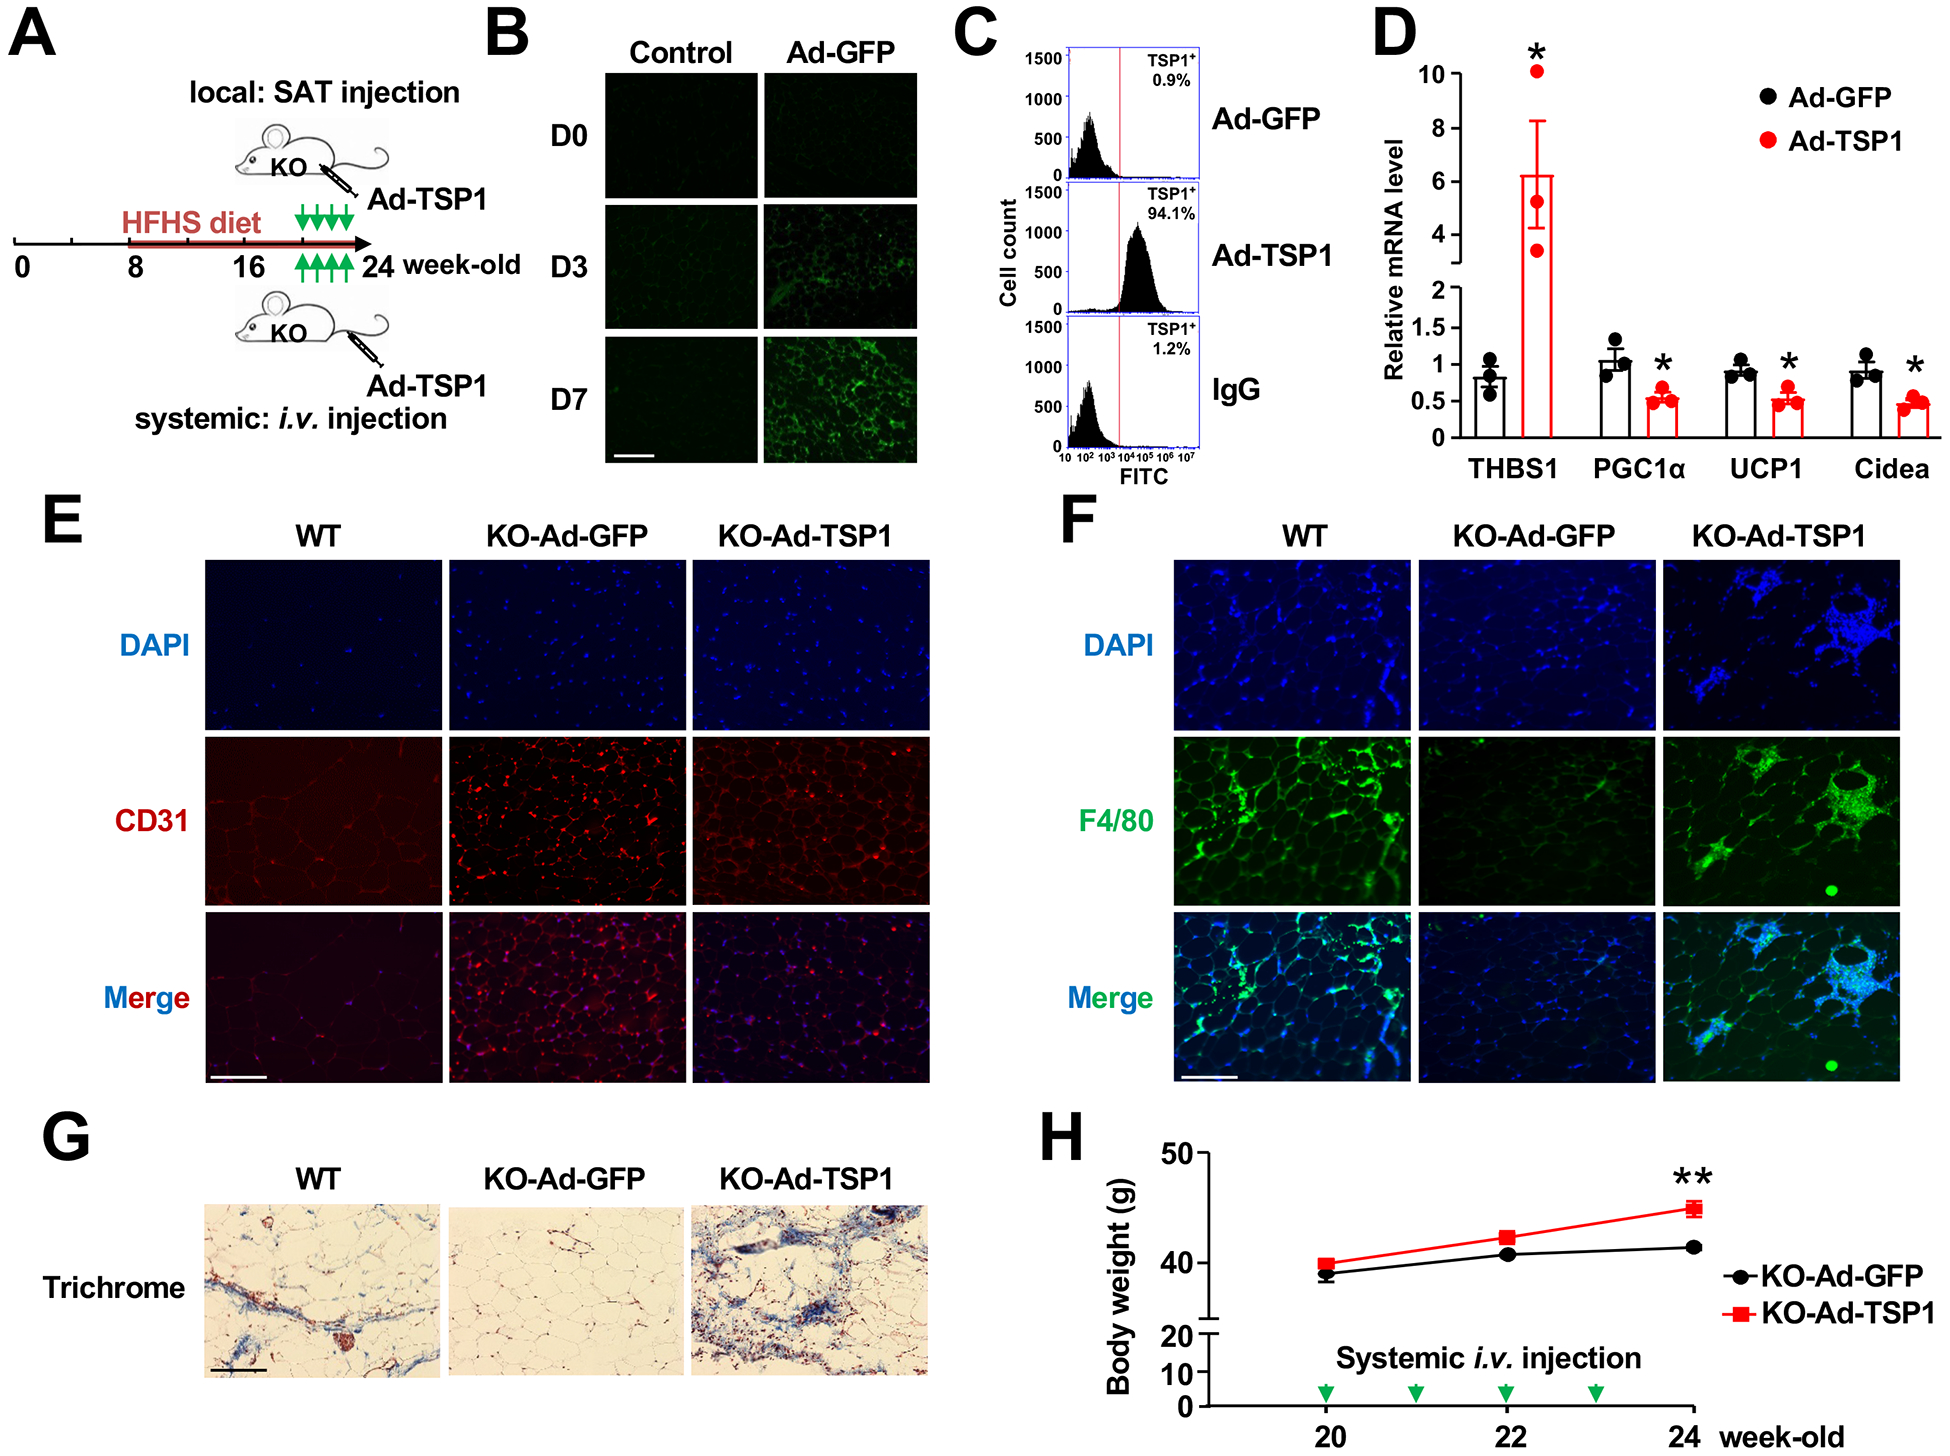
(A) Experimental design of adenoviral injection of TSP1 into EC-AGO1-KO mice under HFHS diet. (B) IF showing positive GFP signal at Day 3 and 7 in SAT after local adenoviral injection. Scale bar = 50 μm. (C) Flow cytometry quantification of TSP1-positive cells after 7 days of local adenoviral injection, with IgG as an isotype control. (D) qPCR for indicated gene expression levels in SAT. (E-G) IF of CD31 (E) and F4/80 (F) and Masson’s Trichrome staining (G) in SAT from wild-type or EC-AGO1-KO littermates after local delivery of Ad-GFP or Ad-TSP1. Scale bars = 50 μm. (H) Body weight measurements in EC-AGO1-KO mice receiving systemic administration of Ad-GFP or Ad-TSP1. n=3 mice/group. Data are presented as mean ± SEM. *Bonferroni-corrected P in (D) < 0.05 and ** P < 0.005 in (H).
We also tested the effect of TSP1 overexpression at the tissue level, specifically in regard to angiogenesis, inflammation, and fibrosis, pathways affected by EC-AGO1-KO (Figure 3G). Compared to wild-type littermates, EC-AGO1-KO mice have increased vascularization (evident by CD31 staining), and decreased macrophage infiltration (reflected by F4/80 staining) and tissue fibrosis (revealed by Masson’s Trichrome staining) in SAT. However, local injection of Ad-TSP1 to SAT for 4 weeks substantially attenuated or abolished these changes without affecting body weight (Figure 6, E–G and Figure XC in the Supplement). Interestingly, systemic administration of Ad-TSP1 for 4 weeks resulted in a significant body weight gain in the EC-AGO1-KO mice, despite the relatively low number of mice used (Figure 6H).
Evidence from human vessels supports AGO1 regulation of THBS1 in ECs
Finally, we queried whether the AGO1 regulation of THBS1 in ECs is relevant to human obesity and T2DM, which are associated with insulin resistance. We assessed the AGO1 and THBS1 mRNA levels in intima isolated from mesenteric arteries from age-matched healthy donors (n=15) or donors with obesity and/or T2DM (n=17) (see Table 1 and Figure XI in the Supplement for patient characteristics). Compared with those in the healthy individuals, mRNA levels of both AGO1 and THBS1 were higher in the intima from obese or T2DM donors (Figure 7A). Furthermore, the levels of AGO1 and THBS1 mRNA were significantly and positively correlated in the donor-derived intima samples (Figure 7B). These data suggest that an AGO1-THBS1 regulatory pathway also exists in the human endothelium and is more active under conditions with insulin resistance, e.g. obesity and T2DM.
Table 1.
Characteristics of human donors
| Variable | Healthy | Obese/T2D | |||
|---|---|---|---|---|---|
| Sex | Male | Female | Male | Female | |
| Number | 13 | 2 | 10 | 7 | |
| Age (year) | 38.7±4.1 | 46.0±17.0 | 46.6±3.7 | 43.7±5.1 | |
| BMI (kg/m2) | 24.5±0.8 | 26.2±2.1 | 36.4±1.7 | 34.7±2.3 | |
| HbA1c (%) | 5.4±0.1 | 5.0±0.7 | 6.3±0.4 | 7.0±0.8 | |
Age, BMI, and HbA1c levels are represented as mean ± SEM.
Figure 7. AGO1-THBS1 in intima isolated from human vessels and a working model.
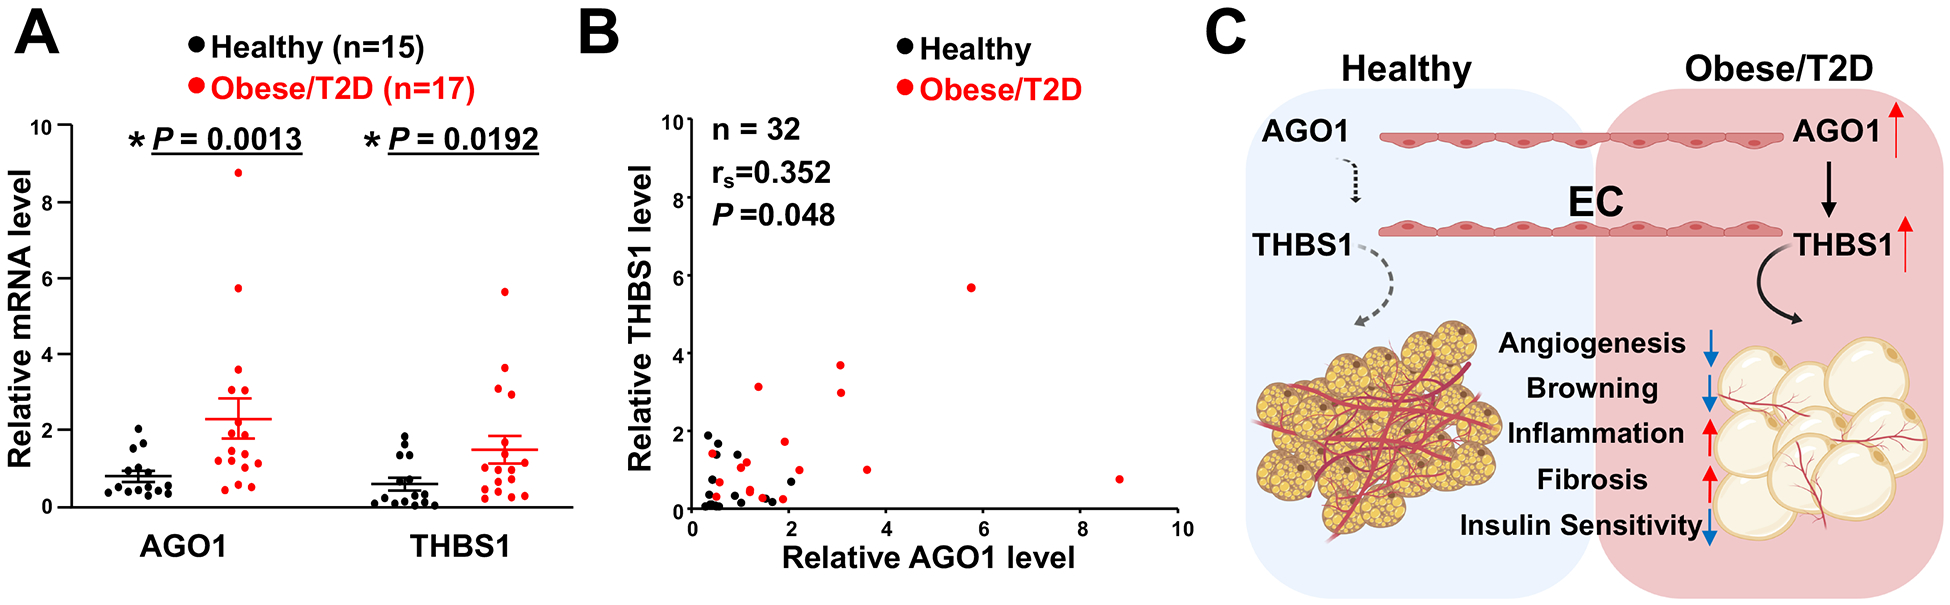
(A) qPCR analysis of AGO1 and THBS1 mRNA levels in the intima isolated from human mesenteric arteries. Data are presented as mean ± SEM in scatter plots. Indicated P values based on Student’s t tests between the healthy donors and obese/T2D donors. (B) Spearman’s correlation of mRNA levels of AGO1 and THBS1 in the intima from human donors. (C) Schematic illustration of EC-AGO1-THBS1-regulated adipose tissue function and metabolic homeostasis. Under obese condition, induction of AGO1-THBS1/TSP1 pathway in ECs may suppress angiogenesis, reduce vascularization, and promote insulin resistance of adipose tissues. The induction of THBS1 can also contribute to inflammation and fibrosis. Together with impaired insulin sensitivity, these changes contribute to the metabolic disorders such as obesity and T2D.
Discussion
Blood vessels play an instrumental role in modulating adipose tissue functions, which is central to obesity-induced insulin resistance and chronic inflammation. Targeting adipose vasculature, especially angiogenesis, has been proposed as a promising approach to the treatment of obesity and metabolic disorders. We demonstrated that deficiency of endothelial AGO1 leads to an anti-obesity phenotype in mice subjected to HFHS diet-induced obesity. The EC-AGO1-KO mice have increased insulin sensitivity and enhanced vascularization and browning in the adipose tissues. To delineate the underlying mechanisms, we identified the suppression of THBS1/TSP1, a potent angiogenic inhibitor and pro-inflammatory adipokine that promotes insulin resistance and adipose inflammation22, 36–38, as a primary mechanism. Supplementation of TSP1 protein in EC-AGO1-KO substantially suppresses the vascularization and browning while promoting inflammation and fibrosis in SAT. Collectively, our findings suggest a novel mechanism by which EC-AGO1-THBS1/TSP regulates adipose tissue function and metabolism (Figure 7C).
Although diverse biological pathways regulated by TSP1, including anti-angiogenesis, pro-inflammation, and pro-fibrosis have been identified22, 36, 37, its modulation of adipocyte browning has not been addressed. We propose the effect of TSP1 in SAT to be primarily mediated through a non-cell-autonomous, anti-angiogenic mechanism, evident by its inhibitory effect on vascularization (Figure 6E). Additionally, TSP1 may also regulate adipocytes through a cell-autonomous mechanism of TSP1 in adipocytes given that adipocytes also express TSP1 (despite at much lower abundance than ECs) and its receptors CD36 and CD47 (Figure XII in the Supplement)39–41. Moreover, treating murine brown adipocytes with recombinant TSP1 protein indeed caused a profound decrease in the browning markers (Figure XIII in the Supplement).
The phenotypes of EC-AGO1-KO resemble those reported for global THBS1-KO mice, which exhibit reduced obesity-associated inflammation and insulin resistance in adipose tissues42, suggesting a negative role of THBS1/TSP1 in adipose tissue function. A more recent study has shown that deletion of TSP1 in myeloid/macrophages, but not adipocytes, reduced inflammation and improved insulin sensitivity, without affecting the development of diet-induced obesity43. However, the contribution of THBS1/TSP1 derived from ECs, a large cellular source of TSP144 in this regulation has not been addressed. In microvascular ECs isolated from murine SAT and HMVECs, we found that THBS1 mRNA is highly expressed (Figure XIV in the Supplement and Figure 4). Furthermore, compared to the healthy donors, those with insulin resistance expressed a higher level of AGO1 and THBS1 in the intima isolated from mesenteric arteries (Figure 7A). Given that VE-cadherin Cre-driven AGO1 deletion mainly occurs in ECs25, the reduction of AGO1-regulated TSP1 in ECs would be a major contributor to the improved SAT function of these mice.
Other factors may also contribute to the dramatic phenotypes observed in EC-AGO1-KO mice. For example, miRNAs could account for some of these noted changes. A number of miRNAs have been identified to play regulatory roles in diabetes and obesity45–47. Pertinent to adipose tissue, some of these miRNAs, such as miR-181b and miR-30 have been shown to promote EC function, insulin sensitivity, or the browning activity48–50. Interestingly, miR-181b and miR-30 were also increased in EC-AGO1-KO SAT (Figure 5G). In particular, miR-181b, which has been shown to promote the EC function in adipose tissue and thus improve glucose homeostasis and insulin sensitivity50 is also increased in the SAT-ECs from EC-AGO1-KO mice (Figure XV in the Supplement), suggesting its potential contribution to the observed phenotype. We identified Let-7e and −7k, which target and suppress THBS1/TSP1 expression34, to be increased in ECs and SAT of EC-AGO1-KO mice (Figure 5, F and G). Moreover, circulating Let-7e and 7k are also increased in the EC-AGO1-KO mice (Figure XVI in the Supplement), suggesting that EC-AGO1-deletion may alter circulating miRNAs derived from ECs. Together, these data suggest that EC-derived Let-7 miRNAs may also play a role in the EC-regulation of adipose tissue function. Future studies are warranted to further characterize the role of EC-derived miRNA in the functional regulation of adipose biology.
We focused on SAT and BAT in the current study, as they demonstrate the most significant changes in the organ weight and insulin sensitivity (Figures 1 and 2). The profound effect of EC-AGO1-KO in these adipose tissues is in line with the recent report suggesting adipocytes as primary target cells for EC-derived sEVs19. The lack of obvious difference in WAT could be due to distinct microenvironment, metabolic demand, and degree of vascularization. Whereas VEGFA is induced in SAT, BAT, and WAT in the EC-AGO1-KO mice (Figure 3, F and L, and Figure VIII in the Supplement), THBS1 is decreased in SAT and BAT but not WAT (Figure 5, A and B and Figure VIIID in the Supplement). On another hand, we found increased VEGFA and decreased THBS1 in the EC-AGO1-KO liver (Figure XVII in the Supplement), suggesting that AGO1-THBS1 may also operate in the liver and contribute to the improved insulin sensitivity and reduced fat accumulation (Figure XVIII in the Supplement). In contrast, we did not observe significant difference in other highly vascularized organs including skeletal muscles, pancreata, kidneys, lungs, and hearts under the current experimental setting (Figure XIX and Table II in the Supplement). Collectively, our data, in conjunction with existing studies12, 19, suggests a tissue-specific crosstalk between ECs and the surrounding cells.
The effect of EC-AGO1-KO is also context-dependent. When placed under normal chow, EC-AGO1-KO mice did not exhibit any significant differences than the WT (Figure 1E, Figure II in the Supplement). Moreover, the responses of chow-fed KO mice and WT littermates to thermoneutrality or cold exposure did not significantly differ with consistent patterns (Figure XX in the Supplement). However, when challenged with HFHS diet, EC-AGO1-KO mice exhibited a striking lean phenotype compared to their co-habited WT littermates (Figure 1, E–J). Given the similar phenotypes including body and organ weight, fasting glucose levels, and adipose tissue histology observed with female mice (Figure IV in the Supplement), the effect of AGO1 is unlikely to be gender-specific. In support of the obesity-associated phenotypic difference in EC-AGO1-KO, we found that AGO1 expression is increased in the aorta from WT mice challenged by HFHS diet (Figure IIID in the Supplement), as well as in the intima from human donors with obesity and/or diabetes (Figure 7). These findings suggest a role of AGO1 in promoting endothelial dysfunction associated with insulin resistance and metabolic disorders.
To explain the decrease of TSP1 in the EC-AGO1-KO animals, we considered that the AGO-mediated miRISC function depends on the availability of AGO proteins, miRNAs, and the mRNA targeted by miRNAs. Thus, two major factors contributing to TSP1 suppression in EC-AGO1-KO mice are: 1) AGO proteins. AGO1 and AGO2 are the major AGOs in ECs22. The decreased AGO1 would increase the loading of THBS1 mRNA to AGO2, which has higher catalytic efficiency than AGO121. 2) miRNAs. Let-7 members (e.g. Let-7e and −7k) are increased in ECs isolated from EC-AGO1-KO mice as compared to their WT littermates (Figure 5G). Based on the previous study34 and our current data (Figure 4, F and G), Let-7 would guide miRISC to target THBS1 mRNA. Taken together, under AGO1 suppression, the increased binding of THBS1 mRNA by AGO2, which is guided by miRNAs (e.g. Let-7 members) that target THBS1, would lead to increased suppression of THBS1. Indeed, in EC from AGO1-KO mice, THBS1 mRNA binding to AGO2 is significantly increased (Figure XXI in the Supplement). As a consequence of such enhanced targeting, THBS1 mRNA is decreased by hypoxia, or AGO1 knockdown or knockout, as we observed in vitro and in vivo (Figures 4 and 5).
Taken together, we demonstrate that the inhibition of EC-AGO1-THBS1 signaling confers a protective metabolic phenotype in mice challenged with HFHS diet. Results from human samples support the activation of this signaling in the endothelium under obese and T2DM conditions (Figure 7, A and B). In these insulin resistant conditions, ECs are typically impaired as one of the earliest events, with compromised angiogenesis, decreased eNOS-derived NO, and inflammatory response6. Given that EC-AGO1 deficiency leads to suppression of THBS1, VCAM-1, and ICAM-1 and induction of VEGFA and eNOS (Figure 5H), targeting endothelial AGO1 may exert pleiotropic effects, i.e. not only to attenuate obesity and increase insulin sensitivity, but also to ameliorate endothelial dysfunction and vascular complications. By elucidating the role of EC-AGO1 in modulation of adipose tissue function and whole-body metabolism, our study suggests a potential new therapeutic strategy to improve vascular and adipose dysfunction in patients with obesity and T2DM.
Finally, our study has limitations: First, due to the limited number and complex characteristics of donor samples, we combined data from donors with obesity and T2DM to explore the relevance of AGO1-THBS1/TSP1 pathway in the context of insulin resistance. Future studies with increased number of patients would allow us to examine this pathway separately in obesity and T2DM. Second, due to tissue availability, we used the intima isolated from mesenteric arteries to examine AGO1-THBS1 expression in the human endothelium. Future investigation using microvascular ECs from adipose tissue is warranted to confirm our current findings.
Supplementary Material
Clinical Perspective.
What is new?
A new mouse model with genetic deletion of AGO1 in the endothelium is useful to investigate the importance of endothelial regulation of adipose tissue function.
In mice fed high-fat high-sucrose diet, suppression of endothelial AGO1 promotes adipose tissue browning and leads to an anti-obesity phenotype.
EC-AGO1-TSP1 pathway is induced in the endothelium from human donors with insulin resistance.
AGO1-TSP1 is an important signaling pathway underlying the active EC-adipocyte communication and EC-modulation of adipose tissue function.
What are the clinical implications?
Endothelial dysfunction per se can cause metabolic dysregulation, rendering targeting dysfunctional endothelium a potential therapeutic strategy to counteract obesity and metabolic disorders.
Amelioration of endothelial dysfunction in metabolic syndrome can lead to dual benefits in metabolic and cardiovascular outcomes, highlighting the importance of treating diabetes with effective regimens not only in reducing hyperglycemia but also in restoring endothelial function.
Given the promise of pro-angiogenic approach to restore tissue perfusion in obesity, suppressing the endogenously activated anti-angiogenic and pro-inflammatory signals, e.g. AGO1-TSP1 pathway, may provide an emerging strategy to expand the therapeutic repertoire for type 2 diabetes and related complications.
Acknowledgments
The authors would like to thank Dr. Jiandie Lin at University of Michigan, Ann Arbor for the generous gift of pre-brown adipocytes; Drs. Qiong (Annabel) Wang, Wendong Huang, Debbie Thurmond, Mark Boldin, and Canlan Sun at City of Hope and Drs. Shu Chien and John Y-J. Shyy at University of California San Diego for their discussions and valuable insights; Dr. Jeffrey Isenberg, Mr. Thomas Sokolich, and Ms. Aleysha T. Chen at City of Hope for their excellent editing and proofreading; Drs. Lizhao Feng, Anying Song, Lixia Xu, Cheng-Hsueh Wu, Eryun Zhang, and Yun-Ting Wang at City of Hope for their technical assistance; and Drs. Ismail Al-Abdullah and Meirigeng Qi of the islet transplantation team at City of Hope for isolation of human tissues.
X.T., Y.M., R.N., and Z.C. conceived the research; X.T., Y.M., Y.L, K.S., Z.C. Z.Q., and F.L., Y.G., C.H.L., and C.Y.H. designed and performed experiments and analyzed data; K.L.P., P.F., K.V.K.-J, G.W.Y., R.N., S.Z., and Z.C. supervised experiments and interpreted results; X.T., Y.M., K.S., and Z.C. wrote the manuscript, G.W.Y., S.Z., and Z.C. obtained funding for this study.
Sources of Funding
This study was in part funded by grants from the National Institutes of Health (NIH) (R00 122368 and R01 145170 to Z.C; HG004659 and HG009889 to G.W.Y; DP1HD087990 to S.Z.), Ella Fitzgerald Foundation (Z.C.), and Center for Cancer and Aging (Z.C.) at City of Hope. Research reported in this publication included work performed in the Analytical Cytometry and Pathology Cores supported by the National Cancer Institute of the National Institutes of Health under award number P30CA033572 as well as the Comprehensive Metabolic Phenotyping Core at the City of Hope.
Non-standard Abbreviations and Acronyms
- Ad-TSP1
Adenovirus TSP1
- ADMA
Asymmetric dimethylarginine
- AGO1
Argonaute
- BAT
Brown adipose tissues
- BMI
Body mass index
- Cidea
Cell death activator CIDE-A
- ECs
Endothelial cells
- EE
Energy expenditure
- eNOS
Endothelial NO synthase
- GEO
Gene Expression Omnibus
- HbA1c
Glycated hemoglobin A1c
- HEK
Human embryonic kidney
- HFHS
High-fat high-sucrose
- IACUC
Institutional Animal Care and Use Committee
- ICAM-1
Intercellular adhesion molecule 1
- iCLIP-seq
Individual nucleotide resolution crosslinking-immunoprecipitation sequencing
- IF
Immunofluorescence
- IRB
Institutional Review Board
- KO
Knockout
- miRISC
microRNA (miR)-induced silencing complex
- mRNA
messenger RNA
- NO
Nitric oxide
- PGC1α
Proliferator-activated receptor gamma coactivator 1-alpha
- RER
Respiratory exchange ratio
- SAT
Subcutaneous adipose tissue
- sEV
Small extracellular vesicles
- SIRT1
Sirtuin 1
- T2DM
Type 2 diabetes mellitus
- THBS1/TSP1
Thrombospondin
- UCP1
Uncoupling protein 1
- UTR
Untranslated region
- VCAM-1
Vascular cell adhesion molecule 1
- VEGF
Vascular endothelial growth factor
- VEGFR
Vascular endothelial growth factor receptor
- WAT
White adipose tissue
- WT
Wild-type
Footnotes
Disclosures:
S.Z. is a cofounder and a board member of Genemo, Inc.
Supplemental Materials
Supplemental Methods
Supplemental Tables I and II
Supplemental Figures I-XXI
References 51–61
References
- 1.Kahn SE, Hull RL and Utzschneider KM. Mechanisms linking obesity to insulin resistance and type 2 diabetes. Nature. 2006;444:840–846. [DOI] [PubMed] [Google Scholar]
- 2.Fuster JJ, Ouchi N, Gokce N and Walsh K. Obesity-Induced Changes in Adipose Tissue Microenvironment and Their Impact on Cardiovascular Disease. Circ Res. 2016;118:1786–1807. [DOI] [PMC free article] [PubMed] [Google Scholar]
- 3.Sun K, Kusminski CM and Scherer PE. Adipose tissue remodeling and obesity. J Clin Invest. 2011;121:2094–2101. [DOI] [PMC free article] [PubMed] [Google Scholar]
- 4.Gealekman O, Guseva N, Hartigan C, Apotheker S, Gorgoglione M, Gurav K, Tran KV, Straubhaar J, Nicoloro S, Czech MP, et al. Depot-specific differences and insufficient subcutaneous adipose tissue angiogenesis in human obesity. Circulation. 2011;123:186–194. [DOI] [PMC free article] [PubMed] [Google Scholar]
- 5.Shimizu I, Aprahamian T, Kikuchi R, Shimizu A, Papanicolaou KN, MacLauchlan S, Maruyama S and Walsh K. Vascular rarefaction mediates whitening of brown fat in obesity. J Clin Invest. 2014;124:2099–2112. [DOI] [PMC free article] [PubMed] [Google Scholar]
- 6.Tabit CE, Chung WB, Hamburg NM and Vita JA. Endothelial dysfunction in diabetes mellitus: molecular mechanisms and clinical implications. Rev Endocr Metab Disord. 2010;11:61–74. [DOI] [PMC free article] [PubMed] [Google Scholar]
- 7.Ito A, Tsao PS, Adimoolam S, Kimoto M, Ogawa T and Cooke JP. Novel mechanism for endothelial dysfunction: dysregulation of dimethylarginine dimethylaminohydrolase. Circulation. 1999;99:3092–3095. [DOI] [PubMed] [Google Scholar]
- 8.Sydow K, Mondon CE, Schrader J, Konishi H and Cooke JP. Dimethylarginine dimethylaminohydrolase overexpression enhances insulin sensitivity. Arterioscler Thromb Vasc Biol. 2008;28:692–697. [DOI] [PMC free article] [PubMed] [Google Scholar]
- 9.Hwangbo C, Wu J, Papangeli I, Adachi T, Sharma B, Park S, Zhao L, Ju H, Go GW, Cui G, et al. Endothelial APLNR regulates tissue fatty acid uptake and is essential for apelin’s glucose-lowering effects. Sci Transl Med. 2017;9:407. [DOI] [PMC free article] [PubMed] [Google Scholar]
- 10.Das A, Huang GX, Bonkowski MS, Longchamp A, Li C, Schultz MB, Kim LJ, Osborne B, Joshi S, Lu Y, et al. Impairment of an Endothelial NAD(+)-H2S Signaling Network Is a Reversible Cause of Vascular Aging. Cell. 2018;173:74–89.e20. [DOI] [PMC free article] [PubMed] [Google Scholar]
- 11.Sung HK, Doh KO, Son JE, Park JG, Bae Y, Choi S, Nelson SM, Cowling R, Nagy K, Michael IP, et al. Adipose vascular endothelial growth factor regulates metabolic homeostasis through angiogenesis. Cell Metab. 2013;17:61–72. [DOI] [PubMed] [Google Scholar]
- 12.Seki T, Hosaka K, Fischer C, Lim S, Andersson P, Abe M, Iwamoto H, Gao Y, Wang X, Fong GH, et al. Ablation of endothelial VEGFR1 improves metabolic dysfunction by inducing adipose tissue browning. J Exp Med. 2018;215:611–626. [DOI] [PMC free article] [PubMed] [Google Scholar]
- 13.Seki T, Hosaka K, Lim S, Fischer C, Honek J, Yang Y, Andersson P, Nakamura M, Naslund E, Yla-Herttuala S, et al. Endothelial PDGF-CC regulates angiogenesis-dependent thermogenesis in beige fat. Nat Commun. 2016;7:12152. [DOI] [PMC free article] [PubMed] [Google Scholar]
- 14.Elias I, Franckhauser S, Ferre T, Vila L, Tafuro S, Munoz S, Roca C, Ramos D, Pujol A, Riu E, et al. Adipose tissue overexpression of vascular endothelial growth factor protects against diet-induced obesity and insulin resistance. Diabetes. 2012;61:1801–1813. [DOI] [PMC free article] [PubMed] [Google Scholar]
- 15.Ngo DT, Farb MG, Kikuchi R, Karki S, Tiwari S, Bigornia SJ, Bates DO, LaValley MP, Hamburg NM, Vita JA, et al. Antiangiogenic actions of vascular endothelial growth factor-A165b, an inhibitory isoform of vascular endothelial growth factor-A, in human obesity. Circulation. 2014;130:1072–1080. [DOI] [PMC free article] [PubMed] [Google Scholar]
- 16.Robciuc MR, Kivela R, Williams IM, de Boer JF, van Dijk TH, Elamaa H, Tigistu-Sahle F, Molotkov D, Leppanen VM, Kakela R, et al. VEGFB/VEGFR1-Induced Expansion of Adipose Vasculature Counteracts Obesity and Related Metabolic Complications. Cell Metab. 2016;23:712–724. [DOI] [PMC free article] [PubMed] [Google Scholar]
- 17.Fukumura D, Ushiyama A, Duda DG, Xu L, Tam J, Krishna V, Chatterjee K, Garkavtsev I and Jain RK. Paracrine regulation of angiogenesis and adipocyte differentiation during in vivo adipogenesis. Circ Res. 2003;93:e88–e97. [DOI] [PMC free article] [PubMed] [Google Scholar]
- 18.Pellegrinelli V, Rouault C, Veyrie N, Clement K and Lacasa D. Endothelial cells from visceral adipose tissue disrupt adipocyte functions in a three-dimensional setting: partial rescue by angiopoietin-1. Diabetes. 2014;63:535–549. [DOI] [PubMed] [Google Scholar]
- 19.Crewe C, Joffin N, Rutkowski JM, Kim M, Zhang F, Towler DA, Gordillo R and Scherer PE. An Endothelial-to-Adipocyte Extracellular Vesicle Axis Governed by Metabolic State. Cell. 2018;175:695–708.e13. [DOI] [PMC free article] [PubMed] [Google Scholar]
- 20.Bartel DP. MicroRNAs: target recognition and regulatory functions. Cell. 2009;136:215–233. [DOI] [PMC free article] [PubMed] [Google Scholar]
- 21.Chen Z, Lai TC, Jan YH, Lin FM, Wang WC, Xiao H, Wang YT, Sun W, Cui X, Li YS, et al. Hypoxia-responsive miRNAs target argonaute 1 to promote angiogenesis. J Clin Invest. 2013;123:1057–1067. [DOI] [PMC free article] [PubMed] [Google Scholar]
- 22.Lawler PR and Lawler J. Molecular basis for the regulation of angiogenesis by thrombospondin-1 and −2. Cold Spring Harb Perspect Med. 2012;2:a006627. [DOI] [PMC free article] [PubMed] [Google Scholar]
- 23.Miao Y, Ajami NE, Huang TS, Lin FM, Lou CH, Wang YT, Li S, Kang J, Munkacsi H, Maurya MR, et al. Enhancer-associated long non-coding RNA LEENE regulates endothelial nitric oxide synthase and endothelial function. Nat Commun. 2018;9:292. [DOI] [PMC free article] [PubMed] [Google Scholar]
- 24.Nam D, Ni CW, Rezvan A, Suo J, Budzyn K, Llanos A, Harrison D, Giddens D and Jo H. Partial carotid ligation is a model of acutely induced disturbed flow, leading to rapid endothelial dysfunction and atherosclerosis. Am J Physiol Heart Circ Physiol. 2009;297:H1535–H1543. [DOI] [PMC free article] [PubMed] [Google Scholar]
- 25.Alva JA, Zovein AC, Monvoisin A, Murphy T, Salazar A, Harvey NL, Carmeliet P and Iruela-Arispe ML. VE-Cadherin-Cre-recombinase transgenic mouse: a tool for lineage analysis and gene deletion in endothelial cells. Dev Dyn. 2006;235:759–767. [DOI] [PubMed] [Google Scholar]
- 26.Wang D, Zhang Z, O’Loughlin E, Lee T, Houel S, O’Carroll D, Tarakhovsky A, Ahn NG and Yi R. Quantitative functions of Argonaute proteins in mammalian development. Genes Dev. 2012;26:693–704. [DOI] [PMC free article] [PubMed] [Google Scholar]
- 27.Van Stry M, Oguin TH 3rd, Cheloufi S, Vogel P, Watanabe M, Pillai MR, Dash P, Thomas PG, Hannon GJ and Bix M. Enhanced susceptibility of Ago1/3 double-null mice to influenza A virus infection. J Virol. 2012;86:4151–4157. [DOI] [PMC free article] [PubMed] [Google Scholar]
- 28.Cannon B and Nedergaard J. Brown adipose tissue: function and physiological significance. Physiol Rev. 2004;84:277–359. [DOI] [PubMed] [Google Scholar]
- 29.Puigserver P, Wu Z, Park CW, Graves R, Wright M and Spiegelman BM. A cold-inducible coactivator of nuclear receptors linked to adaptive thermogenesis. Cell. 1998;92:829–839. [DOI] [PubMed] [Google Scholar]
- 30.Bostrom P, Wu J, Jedrychowski MP, Korde A, Ye L, Lo JC, Rasbach KA, Bostrom EA, Choi JH, Long JZ, et al. A PGC1-alpha-dependent myokine that drives brown-fat-like development of white fat and thermogenesis. Nature. 2012;481:463–468. [DOI] [PMC free article] [PubMed] [Google Scholar]
- 31.Cao Y. Angiogenesis and vascular functions in modulation of obesity, adipose metabolism, and insulin sensitivity. Cell Metab. 2013;18:478–489. [DOI] [PubMed] [Google Scholar]
- 32.Van Nostrand EL, Pratt GA, Shishkin AA, Gelboin-Burkhart C, Fang MY, Sundararaman B, Blue SM, Nguyen TB, Surka C, Elkins K, et al. Robust transcriptome-wide discovery of RNA-binding protein binding sites with enhanced CLIP (eCLIP). Nat Methods. 2016;13:508–514. [DOI] [PMC free article] [PubMed] [Google Scholar]
- 33.Okamura K, Ishizuka A, Siomi H and Siomi MC. Distinct roles for Argonaute proteins in small RNA-directed RNA cleavage pathways. Genes Dev. 2004;18:1655–1666. [DOI] [PMC free article] [PubMed] [Google Scholar]
- 34.Dogar AM, Semplicio G, Guennewig B and Hall J. Multiple microRNAs derived from chemically synthesized precursors regulate thrombospondin 1 expression. Nucleic Acid Ther. 2014;24:149–159. [DOI] [PMC free article] [PubMed] [Google Scholar]
- 35.Isenberg JS, Ridnour LA, Perruccio EM, Espey MG, Wink DA and Roberts DD. Thrombospondin-1 inhibits endothelial cell responses to nitric oxide in a cGMP-dependent manner. Proc Natl Acad Sci U S A. 2005;102:13141–13146. [DOI] [PMC free article] [PubMed] [Google Scholar]
- 36.Ma Y, Yabluchanskiy A and Lindsey ML. Thrombospondin-1: the good, the bad, and the complicated. Circ Res. 2013;113:1272–1274. [DOI] [PMC free article] [PubMed] [Google Scholar]
- 37.Murphy-Ullrich JE and Poczatek M. Activation of latent TGF-beta by thrombospondin-1: mechanisms and physiology. Cytokine Growth Factor Rev. 2000;11:59–69. [DOI] [PubMed] [Google Scholar]
- 38.Varma V, Yao-Borengasser A, Bodles AM, Rasouli N, Phanavanh B, Nolen GT, Kern EM, Nagarajan R, Spencer HJ 3rd, Lee MJ, et al. Thrombospondin-1 is an adipokine associated with obesity, adipose inflammation, and insulin resistance. Diabetes. 2008;57:432–439. [DOI] [PMC free article] [PubMed] [Google Scholar]
- 39.Festy F, Hoareau L, Bes-Houtmann S, Pequin AM, Gonthier MP, Munstun A, Hoarau JJ, Cesari M and Roche R. Surface protein expression between human adipose tissue-derived stromal cells and mature adipocytes. Histochem Cell Biol. 2005;124:113–121. [DOI] [PubMed] [Google Scholar]
- 40.Pohl J, Ring A, Korkmaz U, Ehehalt R and Stremmel W. FAT/CD36-mediated long-chain fatty acid uptake in adipocytes requires plasma membrane rafts. Mol Biol Celll. 2005;16:24–31. [DOI] [PMC free article] [PubMed] [Google Scholar]
- 41.Meijer K, de Vries M, Al-Lahham S, Bruinenberg M, Weening D, Dijkstra M, Kloosterhuis N, van der Leij RJ, van der Want H, Kroesen BJ, et al. Human primary adipocytes exhibit immune cell function: adipocytes prime inflammation independent of macrophages. PloS one. 2011;6:e17154. [DOI] [PMC free article] [PubMed] [Google Scholar]
- 42.Kong P, Gonzalez-Quesada C, Li N, Cavalera M, Lee DW and Frangogiannis NG. Thrombospondin-1 regulates adiposity and metabolic dysfunction in diet-induced obesity enhancing adipose inflammation and stimulating adipocyte proliferation. Am J Physiol Endocrinol Metab. 2013;305:E439–E450. [DOI] [PMC free article] [PubMed] [Google Scholar]
- 43.Memetimin H, Li D, Tan K, Zhou C, Liang Y, Wu Y and Wang S. Myeloid Specific Deletion of Thrombospondin 1 Protects Against Inflammation and Insulin Resistance in Long-term Diet-induced Obese Male Mice. Am J Physiol Endocrinol Metab. 2018; 31:E1194–E1203. [DOI] [PMC free article] [PubMed] [Google Scholar]
- 44.Olerud J, Mokhtari D, Johansson M, Christoffersson G, Lawler J, Welsh N and Carlsson PO. Thrombospondin-1: an islet endothelial cell signal of importance for beta-cell function. Diabetes. 2011;60:1946–1954. [DOI] [PMC free article] [PubMed] [Google Scholar]
- 45.Rottiers V and Naar AM. MicroRNAs in metabolism and metabolic disorders. Nat Rev Mol Cell Biol. 2012;13:239–250. [DOI] [PMC free article] [PubMed] [Google Scholar]
- 46.Fernandez-Hernando C, Ramirez CM, Goedeke L and Suarez Y. MicroRNAs in metabolic disease. Arterioscler Thromb Vasc Biol. 2013;33:178–185. [DOI] [PMC free article] [PubMed] [Google Scholar]
- 47.Deiuliis JA. MicroRNAs as regulators of metabolic disease: pathophysiologic significance and emerging role as biomarkers and therapeutics. Int J Obes. (2005) 2016;40:88–101. [DOI] [PMC free article] [PubMed] [Google Scholar]
- 48.Hu F, Wang M, Xiao T, Yin B, He L, Meng W, Dong M and Liu F. miR-30 promotes thermogenesis and the development of beige fat by targeting RIP140. Diabetes. 2015;64:2056–2068. [DOI] [PMC free article] [PubMed] [Google Scholar]
- 49.Koh EH, Chernis N, Saha PK, Xiao L, Bader DA, Zhu B, Rajapakshe K, Hamilton MP, Liu X, Perera D, et al. miR-30a Remodels Subcutaneous Adipose Tissue Inflammation to Improve Insulin Sensitivity in Obesity. Diabetes. 2018;67:2541–2553. [DOI] [PMC free article] [PubMed] [Google Scholar]
- 50.Sun X, Lin J, Zhang Y, Kang S, Belkin N, Wara AK, Icli B, Hamburg NM, Li D and Feinberg MW. MicroRNA-181b Improves Glucose Homeostasis and Insulin Sensitivity by Regulating Endothelial Function in White Adipose Tissue. Circ Res. 2016;118:810–821. [DOI] [PMC free article] [PubMed] [Google Scholar]
- 51.Dobin A, Davis CA, Schlesinger F, Drenkow J, Zaleski C, Jha S, Batut P, Chaisson M and Gingeras TR. STAR: ultrafast universal RNA-seq aligner. Bioinformatics (Oxford, England). 2013;29:15–21. [DOI] [PMC free article] [PubMed] [Google Scholar]
- 52.Bray NL, Pimentel H, Melsted P and Pachter L. Near-optimal probabilistic RNA-seq quantification. Nat Biotechnol. 2016;34:525–527. [DOI] [PubMed] [Google Scholar]
- 53.Love MI, Huber W and Anders S. Moderated estimation of fold change and dispersion for RNA-seq data with DESeq2. Genome Biol. 2014;15:550. [DOI] [PMC free article] [PubMed] [Google Scholar]
- 54.Maragkakis M, Alexiou P, Nakaya T and Mourelatos Z. CLIPSeqTools--a novel bioinformatics CLIP-seq analysis suite. RNA (New York, NY). 2016;22:1–9. [DOI] [PMC free article] [PubMed] [Google Scholar]
- 55.Ashburner M, Ball CA, Blake JA, Botstein D, Butler H, Cherry JM, Davis AP, Dolinski K, Dwight SS, Eppig JT, et al. Gene ontology: tool for the unification of biology. The Gene Ontology Consortium. Nat Genet. 2000;25:25–29. [DOI] [PMC free article] [PubMed] [Google Scholar]
- 56.Yeri A, Courtright A, Reiman R, Carlson E, Beecroft T, Janss A, Siniard A, Richholt R, Balak C, Rozowsky J, et al. Total Extracellular Small RNA Profiles from Plasma, Saliva, and Urine of Healthy Subjects. Sci Rep. 2017;7:44061. [DOI] [PMC free article] [PubMed] [Google Scholar]
- 57.Friedlander MR, Mackowiak SD, Li N, Chen W and Rajewsky N. miRDeep2 accurately identifies known and hundreds of novel microRNA genes in seven animal clades. Nucleic Acids Res. 2012;40:37–52. [DOI] [PMC free article] [PubMed] [Google Scholar]
- 58.Chen Z, Wen L, Martin M, Hsu CY, Fang L, Lin FM, Lin TY, Geary MJ, Geary GG, Zhao Y, et al. Oxidative stress activates endothelial innate immunity via sterol regulatory element binding protein 2 (SREBP2) transactivation of microRNA-92a. Circulation. 2015;131:805–814. [DOI] [PMC free article] [PubMed] [Google Scholar]
- 59.Das S, Senapati P, Chen Z, Reddy MA, Ganguly R, Lanting L, Mandi V, Bansal A, Leung A, Zhang S, Jia Y, et al. Regulation of angiotensin II actions by enhancers and super-enhancers in vascular smooth muscle cells. Nat Commun. 2017;8:1467. [DOI] [PMC free article] [PubMed] [Google Scholar]
- 60.Fang X, Bogomolovas J, Wu T, Zhang W, Liu C, Veevers J, Stroud MJ, Zhang Z, Ma X, Mu Y, et al. Loss-of-function mutations in co-chaperone BAG3 destabilize small HSPs and cause cardiomyopathy. J Clin Invest. 2017;127:3189–3200. [DOI] [PMC free article] [PubMed] [Google Scholar]
- 61.Lindsey ML, Kassiri Z, Virag JAI, de Castro Bras LE and Scherrer-Crosbie M. Guidelines for measuring cardiac physiology in mice. Am J Physiol Heart Circ Physiol. 2018;314:H733–h752. [DOI] [PMC free article] [PubMed] [Google Scholar]
Associated Data
This section collects any data citations, data availability statements, or supplementary materials included in this article.