

Abstract
Algorithms for identifying patients of interest from observational data must address missing and inaccurate data and are desired to achieve comparable performance on both administrative claims and electronic health records data. However, administrative claims data do not contain the necessary information to develop accurate algorithms for disorders that require laboratory results, and this omission can result in insensitive diagnostic code-based algorithms. In this paper, we tested our assertion that the performance of a diagnosis code-based algorithm for chronic kidney disorder (CKD) can be improved by adding other codes indirectly related to CKD (e.g., codes for dialysis, kidney transplant, suspicious kidney disorders). Following the best practices from Observational Health Data Sciences and Informatics (OHDSI), we adapted an electronic health record-based gold standard algorithm for CKD and then created algorithms that can be executed on administrative claims data and account for related data quality issues. We externally validated our algorithms on four electronic health record datasets in the OHDSI network. Compared to the algorithm that uses CKD diagnostic codes only, positive predictive value of the algorithms that use additional codes was slightly increased (47.4% vs. 47.9%–48.5% respectively). The algorithms adapted from the gold standard algorithm can be used to infer chronic kidney disorder based on administrative claims data. We succeeded in improving the generalizability and consistency of the CKD phenotypes by using data and vocabulary standardized across the OHDSI network, although performance variability across datasets remains. We showed that identifying and addressing coding and data heterogeneity can improve the performance of the algorithms.
Keywords: phenotyping, chronic kidney disorder, data quality, Observational Health Data Sciences and Informatics (OHDSI), reproducibility, portability
Graphical Abstract

1. Introduction
Chronic kidney disorder (CKD) affects the kidney with the potential to cause both progressive loss of kidney function and subsequent complications (National Kidney Foundation, 2002). CKD is also a significant cause of mortality and disability as approximately 11.1% of adults in the United States (22.4 million) have stage 1 to 3 CKD, and the prevalence is rising (Levey et al., 2011). While recognizing CKD is crucial to research and healthcare initiatives, CKD awareness among patients and healthcare providers remain low (Plantinga et al., 2008; Shah et al., 2012; Tuot et al., 2012). Irreversible damage to the kidneys can be slowed during the early stages of the disease when CKD is often asymptomatic and remains undiagnosed. Additionally, due to the severity of this condition and its impact on multiple organ systems, CKD patients are often excluded in clinical trials and observational studies, further highlighting the need for proper identification and characterization of the condition.
While prospective studies allow for real-time evaluation of kidney function and accurate detection of patients with CKD, retrospective observational studies have to rely on existing clinical data, which are often conflicting, inaccurate, and inconsistent. Given these challenges, manual curation has been used extensively to develop and evaluate the phenotypes (Hripcsak et al., 2011). The standard approach to phenotyping includes generating a domain knowledge-based algorithm and validating it by manually reviewing medical records and reporting algorithm’s quantitative performance measures. Nevertheless, this approach is neither scalable nor generalizable. While an algorithm for detecting patients of interest may perform well on the dataset used for evaluation, good evaluation metrics do not guarantee reproducibility on other data sources, which limits phenotype generalizability. Due to the limited data and resources access, researchers cannot perform external validation on all possible data sources. Therefore, there is a need to identify underlying discrepancies and inaccuracies that may occur in the data and addressing the problems during algorithm creation and evaluation.
Algorithm evaluation is complex and varies depending on the complexity of the studied phenomenon. As CKD is a highly complex disorder that often remains undiagnosed, generating and evaluating algorithms for CKD is often a time- and labor-intensive process prone to bias. CKD phenotyping depends heavily on the origin of the data as the process is based on laboratory or instrumental tests. Electronic health records (EHR) can accurately capture the decline in kidney function because the decline is determined by the glomerular filtration rate (eGFR) and microalbuminuria level recorded in the EHR (Coresh et al., 2002). However, in administrative claims data collected for billing purposes, such detailed information is not gathered and therefore claims data is limited in its ability to support clinically accurate algorithms. Because of that limitation, an alternative approach of using diagnostic codes to identify patients with CKD has gained popularity. Studies that focused on identifying CKD in administrative claims data have been in agreement for the low sensitivity of algorithms that use ICD9 codes, ranging from 11% to 32.7%. (Fleet et al., 2013; Ronksley et al., 2012; Stevens et al., 2005; Winkelmayer et al., 2005).
In addition to diagnostic codes, we hypothesize that codes that likely indicate the presence of the disease, i.e., codes for dialysis and kidney transplantation, procedures that are exclusively used to treat CKD, can improve the sensitivity and yet reduce the specificity of the algorithm. In this study, we will generate and validate a billing code-based algorithm for CKD to test our assertion that the positive predictive value (PPV) of a CKD phenotype can be improved by adding other codes indirectly related to the diagnosis of chronic kidney disorder (codes related to dialysis, kidney transplant, suspicious kidney disorders). Given reported performance variability in studies that utilized the same clinical codes (Grams et al., 2011), we want to externally validate our algorithms on different data sources, identify the possible data discrepancies and inaccuracies, and adjust our algorithms accordingly. We took advantage of an existing Observational Health Data Sciences and Informatics (OHDSI) initiative that aims to standardize data. From the work of the OHDSI, we not only performed a large network study that allows external validation of our algorithms but also identified the sources of data inconsistency, inaccuracy and missingness.
1.1. Observational Health Data Sciences and Informatics
OHDSI is an open-source, multi-stakeholder, interdisciplinary collaboration that leverages data standards to produce reliable evidence crucial to develop meaningful algorithms generalizable across databases and stakeholders [1]. OHDSI’s Observational Medical Outcomes Partnership Common Data Model (OMOP CDM) stores the data from different sources (electronic health records, claims data, registries, surveys, etc.) in a unified format guided by standard ETL (extraction-transformation-load) procedures and policies. In our study, addressing data quality of laboratory measurements and standardizing units of measure is of particular interest to us. OHDSI utilizes the OMOP Standardized Vocabularies, the backbone of OMOP CDM, that facilitates interoperability. The vocabularies are based on US and non-US taxonomies, terminologies, thesauri, ontologies and other types of vocabularies for each medical domain: diagnosis (“Condition”); laboratory and instrumental tests (“Measurement”); medical procedures (“Procedure”), medications (“Drug”), medical devices and supplies (“Device”); and clinical signs, symptoms and observations (“Observation”). Patient-level data in OMOP CDM is coded using the concepts from a subset of standard vocabularies inside OMOP Standardized Vocabularies with other concepts being linked (“mapped” to the standard ones).
The following domain-specific standard OMOP Standardized Vocabularies are used as the foundation to leverage embedded hierarchies:
SNOMED CT for Condition and Observation domains;
SNOMED CT, Current Procedural Terminology (CPT-4), Healthcare Common Procedure Coding System (HCPCS), ICD-10 Procedure Coding System (ICD10Pcs) and OPCS Classification of Interventions and Procedures version 4 (OPCS4) for Procedure domain;
SNOMED CT and Logical Observation Identifiers Names and Codes (LOINC) for Measurement domain;
RxNorm and RxNorm Extension for Drug domain.
The largest datasets available to this study and converted to OMOP CDM are claims data: IQVIA Open (unadjudicated), Claims (243 Million patients), IQVIA Pharmetrics Plus (138 Million patients), IBM MarketScan Commercial Claims and Encounters Database (141 Million patients), Optum Socio-Economic Status and Date of Death (83 Million patients) [2]. We aim to develop a sensitive CKD algorithm that can be used across all these sources.
2. Material and methods
We first created a validated gold standard EHR-based algorithm that reliably detects patients with the disease of interest for the eMERGE network based on the approved clinical standards of diagnosis and has been validated by manual chart review. Its backbone is eGFR measurement as an indicator of kidney function. We then adapted the algorithm to generate test algorithm(s) intended for administrative claims and compared their performance to that of the gold standard. To test our hypothesis, we also created an algorithm that replicates a typical approach to inferring CKD in administrative claims data that exists in the literature (utilization of CKD diagnostic codes only) and compares the performances of our test algorithms to that of the typical approach.
2.1. The gold standard phenotype
The gold standard algorithm was developed by Shang et al., tested on the Columbia University (CUMC) and New York Presbytrian (NYP) Electronic Medical Record data, and further validated by chart review. It was created for The Phenotype Knowledge Base (PheKB) within the eMERGE initiative and translated it to OMOP-version-5-compatible algorithm preserving the original algorithm rules (Appendix A, full definition can be found on https://phekb.org/phenotype/chronic-kidney-disease). This algorithm follows the National Kidney Foundation’s (NKF) Kidney Disease Outcomes Quality Initiative (KDOQI) CKD staging recommendations, as well as the those recommendations made by “The Kidney Disease: Improving Global Outcomes (KDIGO) 2012 Clinical Practice Guideline for the Evaluation and Management of CKD” [3]. It is based on eGFR (G-stage) and proteinuria (A-stage) measurements. To calculate eGFR, we extracted the data about age, gender, race, serum creatinine measurements and used Chronic Kidney Disease Epidemiology Collaboration (CKD-EPI) equation as the most robust one [4] to obtain the patients with eGFR less than 60 mL/min/1.73 m2 (<1.00 mL/s/1.73 m2).
Although the units of measure are pre-specified in the formulas, the typical units of included measures vary in some countries. For each lab test, we defined the possible spectrum of units of measure (e.g., gram, milligram, international unit, millimole) and created conversion tables to translate them to standard units used in the equation (Appendix B). We then calculated A and G stages and excluded the patients that experienced a decline in kidney function co-occurring with acute states to exclude patients with an acute kidney injury.
To define acute kidney injury as well as the other states that are utilized in the algorithm (kidney transplantation, dialysis, other kidney disorder), we leveraged OMOP Standardized Vocabularies to extend the original expert-reviewed concept sets. For these concept sets to be used across disparate data sets, we leveraged ‘Is-a’, ‘Part-of’ (additional SNOMED followed by’, ‘has due to’, ‘has associated procedure’ relationships) and ‘Maps to’ relationships stored in the OMOP Standardized Vocabularies (Appendix C). Instead of limiting concepts to a vocabulary, we took the hierarchies of the vocabularies above and followed the descendant relationships to cover more granular concepts derived from the ancestors of interest. Additionally, we used the crosswalks to the non-standard vocabularies (e.g., ICD9CM and ICD10).
The algorithm produced several categories of patients: CKD Case (includes end-stage renal disease associated with transplant, end-stage renal disease associated on dialysis, CKD stage I, CKD Stage II - V), CKD Control (eGFR indicates no renal failure) and CKD Unknow/Indeterminate (patients with no eGFR or decline in kidney function associated with acute disorders). The full algorithm definition can be found in Appendix A and the executable script can be found on GitHub (https://github.com/aostropolets/CKD).
2.2. Test algorithms
We created four test algorithms, from simple to complex, that utilized multiple occurrences of billing codes and strict time frames:
-
Patients with at least two occurrences of CKD diagnosis within two years.
This algorithm represents a typical approach to CKD identification in administrative claims data. This algorithm requires patients to have at least two codes from the CKD code set within two years, which is the most simple approach as it uses only CKD diagnosis codes and does not leverage any additional diagnosis, procedure or device codes.
Patients with at least one occurrence of CKD, dialysis or kidney transplant, and at least one additional occurrence of CKD prior to or after the index date (the date the inclusion criteria are met), excluding acute states. This algorithm includes patients with the kidney transplantation and a diagnosis of CKD within six months before or after transplantation. The algorithm also includes occurrence of kidney dialysis and a diagnosis of CKD within six months before or after dialysis, or two occurrences of CKD within a year, and excludes patients who experienced an acute state (sepsis, shock) or acute kidney failure within 30 days prior to the index date.
-
Patients with at least one occurrence of CKD, other kidney disorders, renal impairment, dialysis or kidney transplant, with at least one occurrence of CKD prior to or after the index date, excluding acute states.
Considering peculiarities of the data, we created an algorithm that replicated the first algorithm, but also included renal insufficiency and other renal disorders that might indicate CKD (renal disorders in systemic disease, hypertensive renal disease, and diabetic renal disease). This algorithm may be viewed as a more complex one, but it is also may be characterized as a more sensitive one as we include additional diagnosis codes, which represent conditions that lead to CKD (renal disorders associated with hypertension, diabetes mellitus type II and systemic disorders).
Patients with end-stage renal disorder (ESRD). We also created a narrower cohort that focuses on patients with CKD Stage V. We included patients with the kidney transplantation and a diagnosis of ESRD within three months before or after transplantation; occurrence of kidney dialysis and a diagnosis of ESRD within three months before or after dialysis, or two occurrences of ESRD within a year, excluding patients who experienced an acute state (sepsis, shock) or acute kidney failure within 30 days prior to the index date.
We used a public instance of OHDSI open source software tool Atlas available at http://www.ohdsi.org/web/atlas/ to define the cohorts for our algorithms. The full description of the algorithms with the links to OHDSI Atlas cohorts can be found in Appendix D.
2.3. Data Standardization
We run our analysis on several datasets that have been converted to OMOP Common Data Model. As discussed in the Background section, OMOP CDM allows transforming disparate source databases into a unified model. Such model has a common table that provide an ability to use the same queries on the data with different provenance and initial structure. When converting the data, one should comply with policies that ensure data quality and accuracy. Additionally, to quality assurance that each participating dataset underwent while transformed to OMOP CDM, we performed additional checks and data standardization to ensure that the data is suitable for our study.
First, we identified the possible list of units that were associated with measurements used to calculate eGFR. We created a conversion table (Appendix B) to standardize the units that may be used with a measurement. For example, depending on the provenance of the data and local standards, creatinine can be measured in mg/dL or μmol/L. For such cases, we picked one standard unit and converted to others to it to ensure that all values have the same scale.
Second, we set an approximate threshold for each measurement to identify extremely low or high values; an example of such extreme values can be the height of 10000 cm. We then eliminated those extreme values since they might have biased kidney function assessment.
Finally, we leveraged OMOP CDM Vocabularies to obtain a comprehensive list of concept codes for patient identification. As opposed to manual selection of codes, we used SNOMED hierarchy, which allowed us to get all relevant codes. As our network study was run on multiple datasets, it was crucial to capture clinical codes from disparate source vocabularies (such as CPT4, HCPCS, ICD10-CM, ICD-9CM, etc.). Instead of creating lists of possible codes for each vocabulary, we used mappings provided by OMOP Vocabularies to obtain a comprehensive list of codes.
2.4. Test algorithm evaluation
For each of the algorithms we identified the number of true positive and false positive subjects and calculated PPV defined as true positives/(true positives + false positives) against the gold standard.
We used four following datasets to evaluate our algorithms:
CUMC & NYP Electronic Medical Record (U.S.; 5,37 million patients; inpatient and outpatient visits)
IQVIA Ambulatory Electronic Medical Record (U.S.; 42 million patients; outpatient visits with approximately 50% primary care, 50% specialists),
IQVIA Oncology Electronic Medical Record (U.S.; 2 million patients; oncology ambulatory outpatient visits)
IQVIA DA Germany Electronic Medical Record (Germany; 32,7 million patients; outpatient visits)
These datasets were chosen because they contained a sufficient number of patients with these diseases and represented diverse settings of clinical care (outpatient and inpatient visits as well as primary care visits and specialists’ visits). The US appeared to be the most prevalent country of origin complemented by the European data.
3. Results
The number of patients produced by the algorithms is described in Table 1.
Table 1.
Number of patients in the gold standard algorithm and test algorithms *T – kidney transplant, D – dialysis, SKD – suspicious kidney disorders
| Row: data sources; Column: algorithms | Total population size (18–90 years) | Gold Standard | Two CKD diagnosis codes | CKD or T + CKD or D + CKD | CKD or T + CKD or D +CKD or SKD + CKD |
|---|---|---|---|---|---|
| CUMC&NYP | 5,780,365 | 171,948 | 45,444 | 64,007 | 70,445 |
| IQVIA AmbEMR | 41,908,410 | 3,438,251 | 687,898 | 1,000,555 | 1,133,844 |
| IQVIA OncEMR | 2,021,595 | 382,530 | 18,843 | 78,868 | 79,973 |
| IQVIA DA Germ | 31,492,834 | 555,467 | 52,073 | 403,628 | 405,511 |
For the narrow end stage renal disorder algorithm, we identified 89,583 in IQVIA AmbEMR, 12,689 patients in CUMC&NYP, 1,903 IQVIA in OncEMR and no patients in IQVIA DA Germ.
We approximated the prevalence of CKD using the patients generated by the gold standard algorithm and compared this number to the size of the adult population. The prevalence ranged from 1.8% in German ambulatory population to 18.9% in the US oncological population (Figure 2).
Figure 2.
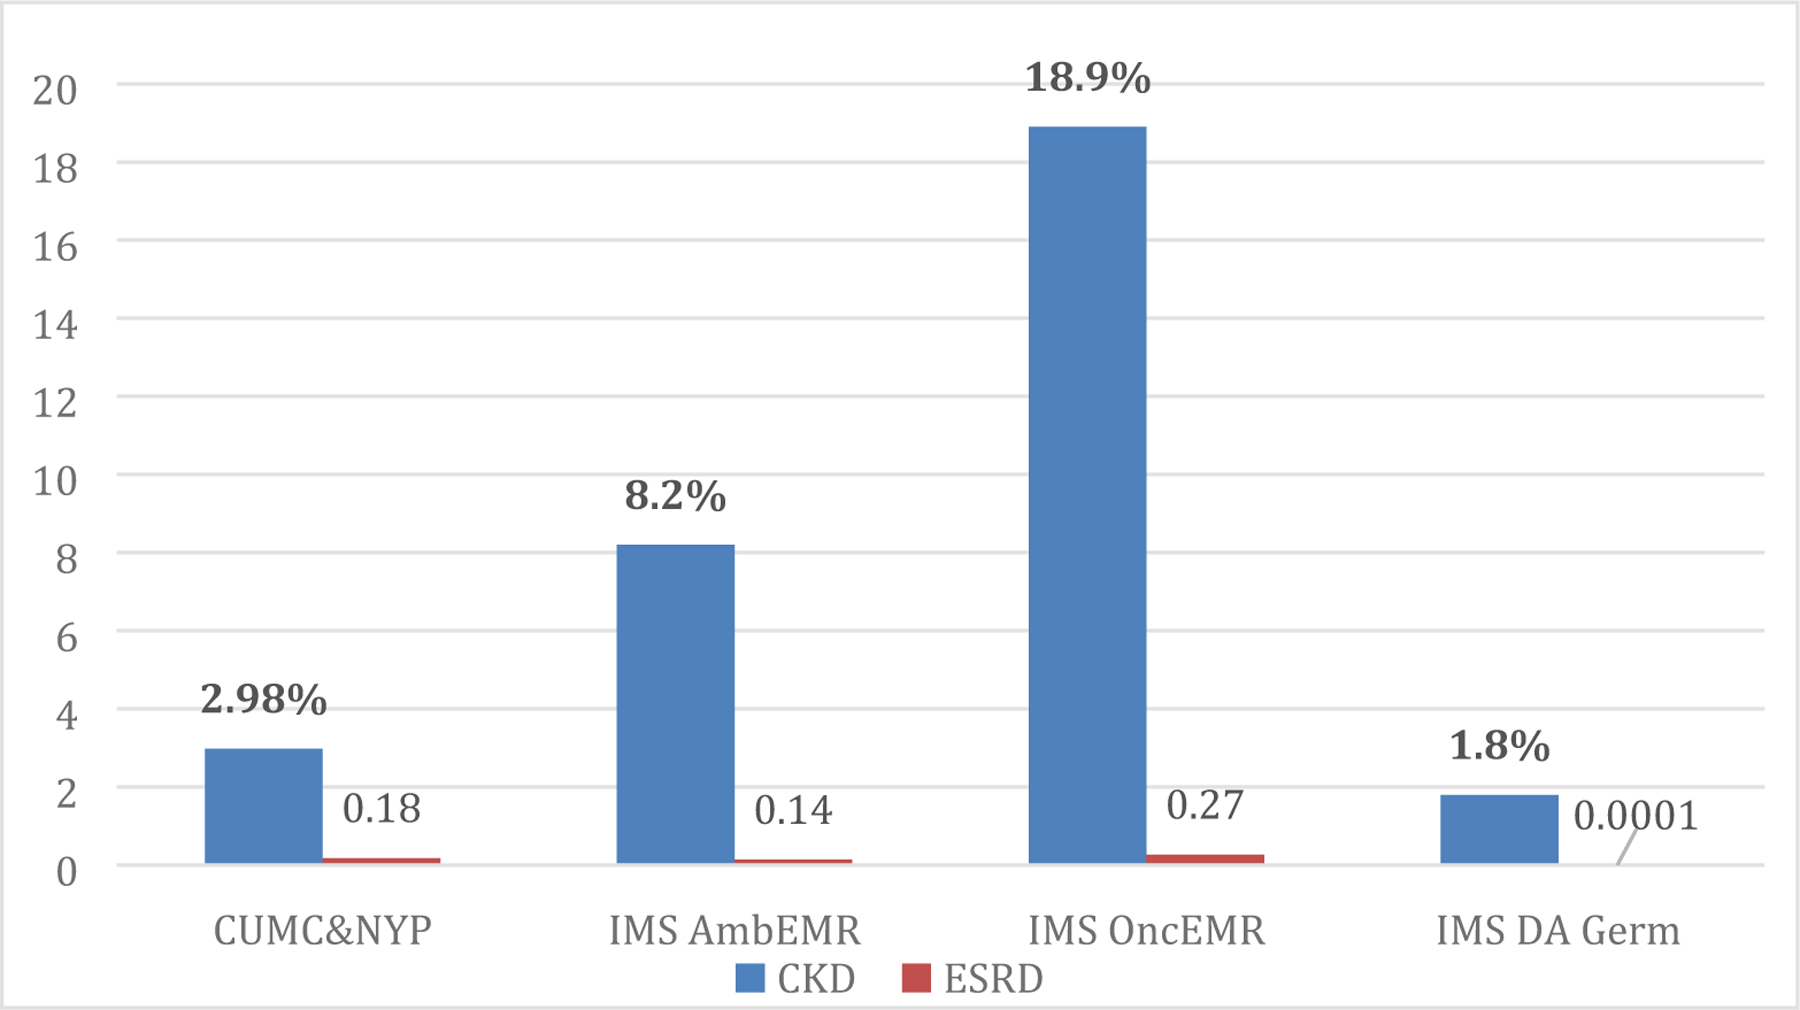
Prevalence of chronic kidney disorder and end-stage renal disorder, % in four datasets.
Comparisons of our test algorithms to the Gold Standard are provided in Table 2. Compared to the algorithm that utilizes diagnosis codes only (algorithm one), test algorithm No.2 and No.3 showed slightly greater PPV. Although the absolute numbers of PPV of the algorithms varies among datasets, we observed that the PPV of algorithm two was generally higher than PPV of algorithm three. Algorithm two was the broadest one and included not only occurrences of CKD as an inclusion criterion, but also the generic concept of kidney impairment and other kidney disorders (kidney disorders in diabetes mellitus, systemic disorders and hypertension). This allowed the consistent performance of the algorithm across disparate datasets with different coding rules.
Table 2.
Positive predictive value (PPV) of the algorithms for CKD compared to the Gold Standard, %. *T – kidney transplant, D – dialysis, SKD – suspicious kidney disorders
| Dataset | Two CKD diagnosis codes | CKD or T + CKD or D + CKD | CKD or T +CKD or D +CKD or SKD + CKD |
|---|---|---|---|
| CUMC&NYP | 45.1% | 43.7% | 41.7% |
| IQVIA AmbEMR | 61.3% | 61.6% | 61.0% |
| IQVIA OncEMR | 52.9% | 62.8% | 62.8% |
| IQVIA DA Germ | 30.3% | 26.0% | 26.0% |
| Average | 47.4% | 48.5% | 47.9% |
Nevertheless, we still observed database-dependent variability in algorithm performance. For example, the performance of all algorithms on one of the datasets (i.e., IQVIA DA Germ) had the lowest sensitivity and PPV, reflecting the lack of explicitly stated diagnosis of CKD in the data.
We also computed PPV for end stage renal disorder across all databases with the average PPV of 33.7% (51.8% for CUMC&NYP dataset, 42.6% for IQVIA OncEMR and 7.2% for IQVIA AmbEMR). IQVIA DA Germ dataset did not have specific ESRD codes, so our algorithm did not yield any patients on this dataset. Potentially, this algorithm can be used to detect the patients with end stage renal disorders, although it requires examination of the data to ensure that the dataset contains highly granular codes for ERSD.
4. Discussion
Case identification from observational data is complicated, time-consuming, and often unreliable. Variability in coding procedures and terminologies that are used across datasets may lead to different representation of the same conditions, which complicates the process of phenotyping. As phenotypes are usually built based on the local data and coding practices, they may include a limited set of vocabularies, which will not be generalizable to the other datasets. For example, there are two major terminologies for the drug domain in the US (RxNorm and NDC) and using only one of them may lead to data loss when applied in other instances. Therefore, an effective algorithm should either cover all possible terminologies or, as in the case of OMOP, utilize the single standard vocabulary that has relationships to the other vocabularies in a domain. Another approach to concept-set creation is pattern-driven: use string search or natural language processing techniques to obtain syntactic equivalents for concepts. This approach can only work correctly if concept names have the same syntactic patterns across different vocabularies, which is rarely true.
To illustrate the benefits of the vocabulary-driven approach, we extracted the codes used for CKD from the PheKB phenotype: 126 codes from SNOMED, ICD10, and ICD9CM. These codes were hand-picked based on the local CUMC coding practices, so the list does not represent the full spectrum of codes that can be used to code CKD. We also used a simple string search with words ‘chronic kidney failure’, ‘chronic kidney disorder’, or ‘CKD’. Two hundred fifty-six concepts were retrieved. The list needed manual review or additional NLP processing, as it included negations and other modifying attributes (‘At the risk of chronic kidney disease’, ‘Chronic kidney disease resolved’). As described in section 2.1, we implemented the vocabulary-driven approach using the OMOP Standardized Vocabularies, which covered 278 concepts for CKD and was reviewed for accuracy by domain specialists. As we added new concepts, we were able to identify more patient records of CKD diagnosis codes with the average gain 12 ± 2.3% across test datasets.
As we hypothesized that adding procedure codes related to CKD would increase the sensitivity of the algorithms, we created two algorithms for identifying patients who had CKD diagnosis and either kidney transplant or dialysis procedure using additional procedure codes, including all codes related to dialysis, as the latter is used as the main treatment for CKD [5]. We also included codes for kidney transplant, because this procedure is known to be associated with CKD. We leveraged the SNOMED hierarchy as well as crosswalks from SNOMED to CPT4, HCPCS, ICD9Proc and ICD10PCS (‘Is a’ and ‘Part of’ relationships) stored in SNOMED to obtain a comprehensive list of such codes. To ensure that our cases had CKD, we included only patients who had CKD and either kidney transplant or dialysis procedure. Then we created a third algorithm to include suspicious kidney conditions that may lead to CKD, such as systemic disorders, diabetic renal disorders or hypertensive renal disorders [5]. We applied similar logic to concept set creation as for the previous algorithm and used SNOMED hierarchy to retrieve relevant concept codes. OMOP CDM already maps disparate local vocabularies (ICD10-CM, ICD9-CM, Read, etc.) to a pre-defined standard vocabulary (SNOMED for condition domain) so that we did not hand-picking concept codes.
Data loss during the coding process is another issue that should be considered when creating a phenotype. Due to the nature of medical professionals’ workflow and the complexity of the diagnostic process, conditions may be recorded as non-specific codes, which require phenotype adjustment. Other studies report up to 17% of unidentified cases of chronic conditions that were missed due to the usage of less specific codes [6,7]. In our study, we found that some of the instances of chronic or acute kidney failure was partially coded as the ICD10 concept N19 “Unspecified kidney failure” of coarse granularity with no further clarification in the subsequent patient records.
As chronic and acute kidney failure are mutually exclusive diagnoses, a more granular code must be inferred based on the patterns of occurrence of diagnosis, treatment pathways or other clues. Absence of more granular codes may also lead to inability to identify separate stages of CKD, where ESRD is of a particular interest. In this case, records of dialysis and kidney transplant can serve as a substitution for ESRD diagnostic codes and can be used to partially identify the patients with ESRD.
Another source of variability is multiple units of measure that are used for measuring height, weight, serum creatinine and proteinuria (Appendix B). To be able to create a generalizable phenotype, one should account for the different units of measure and adjust the CKD-EPI equation appropriately. Laboratory test data might also be entered incorrectly, creating nonsense records. For example, we observed source electronic health record data containing height that was measured in kilograms, ratios, percent, or had negative values. Other cases are harder to identify. For example, measurement of creatinine in blood or serum has two non-overlapping normal ranges depending on the unit of measure: mg/mL or mmol/L. If the source data contain confusing or unspecified measurement units, misinterpretation of results and incorrect identification of patients with CKD happens.
These issues can be addressed by applying data quality assurance rules that check the values according to a certain threshold and eliminate suspiciously high or low values. A set of rules should be established to manipulate the data and change the units to the correct ones and drop data that cannot be interpreted. An example of such a work is an ongoing project in the scope of the OMOP THEMIS initiative, which aims to create Achilles Heel reports when units of measure or values of measurements do not meet expected values. THEMIS analyzes the data across multiple OHDSI sites and creates test–unit pairs to find inappropriate units.
To illustrate the importance of addressing these issues, we compared in Figure 2 the performance of the algorithms on the source electronic health record data and data that have been processed taking into account the issues mentioned below.
As we can see, the positive predictive value of all algorithms improves after data standardization. As stated previously, data standardization facilitates phenotype generalizability and reproducibility. Nevertheless, the peculiarities of datasets, inconsistency in coding practices and data missingness may still influence performance. Previous studies reported low sensitivity of the algorithms that utilize ICD9 codes for CKD only [8–11], which reflects low awareness of CKD among providers as patients lack diagnosis of CKD in their medical records. We observed no statistically significant difference in algorithms’ performance with adding codes of dialysis, transplant and suspicious kidney disorders (renal disorders in systemic disease, hypertensive renal disease, diabetic renal disease). Moreover, while we saw an increased number of true positive patients, the results were mainly shaped by the large number of false positive patients. This indicates the fact that patients with an established diagnosis of CKD in electronic health records do not have serum creatinine measurement, which is used to calculate eGFR. It can be explained either by missing records of creatinine measurements or, more likely, by patients being referred to an institution with a pre-existing diagnosis.
Our work has a number of limitations. First, our gold phenotype was validated on only two datasets and not on IQVIA AmbEMR, IQVIA OncEMR and IQVIA DA Germany. We believe that the data quality issues being addressed here allow us to generalize the gold standard to the other datasets. Second, we performed random record review to ensure that the trajectories of the patients identified by our algorithm fit clinically relevant patterns of CKD. Third, in the first three algorithms, we treated CKD as a single disorder without specifying a particular stage. As end stage renal disorder may be of particular interest in the clinic, we singled it out in the fourth algorithm to be able to evaluate its performance separately. We did not compute sensitivity and specificity for our algorithms since it is difficult to distinguish between false negatives and true negatives accurately in inherently incomplete EHR data.
5. Conclusions
In this study we tested our hypothesis that a billing code-based algorithm CKD can be improved by adding other codes indirectly related to chronic kidney disorder by running a network study among OHDSI datasets and validating four algorithms on four disparate OHDSI dataset with different provenance and origins of the data . We found no statistically significant improvement in PPV among our test algorithms. We showed how the common issues of phenotyping such as coarse code granularity, errorneous data entry and poor generalizability may influence phenotyping algorithms’ performance. We succeeded in improving the generalizability and consistency of the phenotypes by leveraging the data, vocabulary-based concept set creation, and approach standardization used across the OHDSI network, although individual data quality issues persist.
Supplementary Material
Figure 1.

General structure of OMOP Standardized Vocabularies.
Figure 3.

Overall positive predictive value of the algorithms among four databases, %
Highlights:
Coarse code granularity, erroneous data entry and poor generalizability may influence the performance of phenotyping algorithms
Vocabulary-driven methods for concept sets creation shows advantages in improving the accuracy for phenotyping
Observational Health Data Sciences and Informatics (OHDSI) OMOP Common Data Model facilitate phenotype generalizability and consistency
More data is not necessarily better: performance of a diagnosis-based chronic kidney failure algorithm is not improved by adding other codes indirectly related to chronic kidney disorder
Acknowledgments
Funding This work was supported by the National Institutes of Health grants U01 HG008680, R01 LM009886, and R01 LM006910.
Footnotes
Publisher's Disclaimer: This is a PDF file of an unedited manuscript that has been accepted for publication. As a service to our customers we are providing this early version of the manuscript. The manuscript will undergo copyediting, typesetting, and review of the resulting proof before it is published in its final form. Please note that during the production process errors may be discovered which could affect the content, and all legal disclaimers that apply to the journal pertain.
Competing interests. The authors declare that they have no known competing financial interests or personal relationships that could have appeared to influence the work reported in this paper.
References
- [1].Hripcsak G, Duke JD, Shah NH, Reich CG, Huser V, Schuemie MJ, Suchard MA, Park RW, Wong ICK, Rijnbeek PR, van der Lei J, Pratt N, Norén GN, Li Y-C, Stang PE, Madigan D, Ryan PB, Observational Health Data Sciences and Informatics (OHDSI): Opportunities for Observational Researchers, Stud Health Technol Inform 216 (2015) 574–578. [PMC free article] [PubMed] [Google Scholar]
- [2].OHDSI Data Network, (n.d.). http://www.ohdsi.org/web/wiki/doku.php?id=resources:2018_data_network (accessed May 21, 2019).
- [3].Page not found – KDIGO, (n.d.). https://kdigo.org/clinical_practice_guidelines/pdf/CKD/KDIGO_2012_CKD_GL.pdf (accessed July 11, 2019).
- [4].Levey AS, de Jong PE, Coresh J, M.E. l. Nahas, B.C. Astor, K. Matsushita, R.T. Gansevoort, B.L. Kasiske, K.-U. Eckardt, The definition, classification, and prognosis of chronic kidney disease: a KDIGO Controversies Conference report, Kidney International. 80 (2011) 17–28. 10.1038/ki.2010.483. [DOI] [PubMed] [Google Scholar]
- [5].KDIGO 2017 Clinical Practice Guideline Update for the Diagnosis, Evaluation, Prevention, and Treatment of Chronic Kidney Disease–Mineral and Bone Disorder (CKD-MBD), Kidney International Supplements. 7 (2017) 1–59. 10.1016/j.kisu.2017.04.001. [DOI] [PMC free article] [PubMed] [Google Scholar]
- [6].Coleman N, Halas G, Peeler W, Casaclang N, Williamson T, Katz A, From patient care to research: a validation study examining the factors contributing to data quality in a primary care electronic medical record database, BMC Family Practice 16 (2015). 10.1186/s12875-015-0223-z. [DOI] [PMC free article] [PubMed] [Google Scholar]
- [7].Kadhim-Saleh A, Green M, Williamson T, Hunter D, Birtwhistle R, Validation of the diagnostic algorithms for 5 chronic conditions in the Canadian Primary Care Sentinel Surveillance Network (CPCSSN): a Kingston Practice-based Research Network (PBRN) report, J Am Board Fam Med. 26 (2013) 159–167. 10.3122/jabfm.2013.02.120183. [DOI] [PubMed] [Google Scholar]
- [8].Fleet JL, Dixon SN, Shariff SZ, Quinn RR, Nash DM, Harel Z, Garg AX, Detecting chronic kidney disease in population-based administrative databases using an algorithm of hospital encounter and physician claim codes, BMC Nephrology 14 (2013). 10.1186/1471-2369-14-81. [DOI] [PMC free article] [PubMed] [Google Scholar]
- [9].Ronksley PE, Tonelli M, Quan H, Manns BJ, James MT, Clement FM, Samuel S, Quinn RR, Ravani P, Brar SS, Hemmelgarn BR, For the Alberta Kidney Disease Network, Validating a case definition for chronic kidney disease using administrative data, Nephrology Dialysis Transplantation. 27 (2012) 1826–1831. 10.1093/ndt/gfr598. [DOI] [PubMed] [Google Scholar]
- [10].Stevens LA, Fares G, Fleming J, Martin D, Murthy K, Qiu J, Stark PC, Uhlig K, Van Lente F, Levey AS, Low rates of testing and diagnostic codes usage in a commercial clinical laboratory: evidence for lack of physician awareness of chronic kidney disease, J. Am. Soc. Nephrol 16 (2005) 2439–2448. 10.1681/ASN.2005020192. [DOI] [PubMed] [Google Scholar]
- [11].Winkelmayer WC, Schneeweiss S, Mogun H, Patrick AR, Avorn J, Solomon DH, Identification of Individuals With CKD From Medicare Claims Data: A Validation Study, American Journal of Kidney Diseases. 46 (2005) 225–232. 10.1053/j.ajkd.2005.04.029. [DOI] [PubMed] [Google Scholar]
- [12].KDIGO_2012_CKD_GL.pdf, (n.d.). https://kdigo.org/wp-content/uploads/2017/02/KDIGO_2012_CKD_GL.pdf (accessed May 21, 2019).
- [13].KDIGO_2012_CKD_GL.pdf, (n.d.). https://kdigo.org/wp-content/uploads/2017/02/KDIGO_2012_CKD_GL.pdf (accessed July 11, 2019).
Associated Data
This section collects any data citations, data availability statements, or supplementary materials included in this article.