

Abstract
Sensorimotor synchronization (SMS) is frequently dependent on coordination of excitatory and inhibitory activity across hemispheres, as well as the cognitive control over environmental distractors. However, the timing (motor planning versus execution) and cortical regions involved in these processes remain actively debated. Functional magnetic resonance imaging data were therefore analyzed from 34 strongly right-handed healthy adults performing a cued (to initiate motor planning) SMS task with either their right or left hand (motor execution phase) based on spatially congruent or incongruent visual stimuli. Behavioral effects of incongruent stimuli were limited to the first stimulus. Functionally, greater activation was observed in left sensorimotor cortex (SMC) and right cerebellar Lobule V for congruent versus incongruent stimuli. A negative blood-oxygen level dependent response, a putative marker of neural inhibition, was present in bilateral SMC, right supplemental motor area (SMA) and bilateral Lobule V during the motor planning, but not execution phase. The magnitude of the inhibitory response was greater in right cortical regions and cerebellar Lobule V. Homologue connectivity was associated with inhibitory activity in the right SMA, suggesting that individual differences in intrinsic connectivity may mediate transcallosal inhibition. In summary, results suggest increased inhibition (i.e., greater negative BOLD response) within the right relative to left hemisphere, which was released once motor programs were executed. Both task and intrinsic functional connectivity results highlight a critical role of the left SMA in interhemispheric inhibition and motor planning.
Keywords: inhibition, motor planning, blood-oxygen level dependent, sensorimotor synchronization, hemispheric asymmetry
Introduction
Synchronizing motor programs to external stimuli (i.e., sensorimotor synchronization [SMS]) is integral to the execution of fine motor movement and the ability to mimic other’s actions (Hogeveen et al., 2015; Repp and Su, 2013). Similar to most non-reflexive movements, SMS typically consists of a preparatory phase (initiated by a cue), a pre-movement phase (between instruction and actual movement), and motor program onset/execution (Bestmann and Duque, 2016). SMS involves facilitatory processes that integrate rhythmic sensory (e.g., tapping in time with visual or auditory inputs) information, as well as inhibitory processes that suppress unwanted mirror movements or provide cognitive control over motor/sensory distractors (Brass et al., 2001; Mayer et al., 2009; Serrien et al., 2006). Although the neuronal networks responsible for SMS facilitation have been extensively studied (Hackney et al., 2015; Repp and Su, 2013), the role and timing of inhibitory and cognitive control processes in SMS remains more actively debated (Welniarz et al., 2019).
Neuromodulation data suggests greater inhibitory activity in the nondominant hemisphere, and greater activity during motor preparatory/pre-movement (operationally defined herein as planning) rather than execution phases. Specifically, the sensorimotor cortex (SMC) is known to inhibit motor activity in the contralateral hemisphere via transcallosal inhibition (TCI), with similar roles proposed for the supplementary motor area (SMA) and premotor cortex (Kroeger et al., 2010; Li et al., 2013; Welniarz et al., 2019). Hemispheric asymmetries (right > left) in motor inhibition are observed in human imaging (negative blood-oxygen level dependent [BOLD] activity) and transcranial magnetic stimulation (TMS) studies (Hayashi et al., 2008; Kroeger et al., 2010; Netz et al., 1995; Tzourio-Mazoyer et al., 2015), with TMS studies also indicating increased inhibition during motor planning relative to execution phases (Kroeger et al., 2010). Although somewhat controversial, invasive recordings suggest that negative BOLD response results from neuronal inhibition in deep cortical layers, leading to arteriolar vasoconstriction, decreases in cerebral blood flow and volume, and a subsequent increase in local deoxyhemoglobin (Boorman et al., 2010; Devor et al., 2007b; Shmuel et al., 2006). The magnitude of the negative BOLD response has also been linked with GABA levels in the anterior cingulate gyrus (Northoff et al., 2007), providing additional support as a surrogate marker of neuronal suppression. Finally, negative BOLD activity has been observed during proactive response inhibition tasks in the absence of an overt motor response (Mayer et al., 2016), suggesting that it can also be used to assess inhibition during motor planning.
In spite of the predominant theory of transcallosal inhibition (Kroeger et al., 2010; Li et al., 2013), only a few studies have investigated whether functional connectivity (i.e., derived from resting state data) within motor circuitry is associated with task-related inhibition and behavior (Fling et al., 2012; Lee and Hsieh, 2017; Mennes et al., 2011). Previous studies reported associations between task-related positive BOLD activity and interhemispheric connectivity (Ebisch et al., 2018; Jiang et al., 2004; Mennes et al., 2010; Parker et al., 2017; Smitha et al., 2017). Most pertinent to the current study, evoked BOLD in left SMC and left Lobule VI of the cerebellum during a motor tapping task has been shown to be modulated by intrinsic functional connectivity, with ranking of magnitude in resting state data predicting inverse modulation (Jiang et al., 2004). Others have reported a relationship between increased homologue functional connectivity of motor cortex and decreased microstructural integrity of the corpus callosum in older but not younger adults, with structural/functional connectivity relationships further associated with behavioral performance on a SMS task (Fling et al., 2012).
In addition to motor circuitry, the cognitive control network also inhibits prepotent motor responses (Swick et al., 2011) and suppresses attention to distractors during motor tasks (Brass et al., 2001; Mayer et al., 2009). For example, Brass et al. (2001) reported increased activation in bilateral dorsolateral prefrontal cortex (DLPFC), right frontopolar cortex, right anterior parietal cortex and precuneus during a motor mimicry task requiring movement to either an incongruent (e.g., tap right to left hand model) or congruent (e.g., tap right to right hand model) model hand. A similar network (bilateral ventro/DLPFC and inferior parietal lobule) was activated during the performance of an SMS task that required ignoring cross-modal distractors (Mayer et al., 2009).
The primary aim of current study was therefore to examine the role of inhibitory and cognitive control processes in SMS by evaluating three novel hypotheses. First, we hypothesized that a negative BOLD response, our putative marker of inhibition, would be present within the SMC ipsilateral to hand movement during the planning but not execution phase, and greater within non-dominant motor circuitry (Kroeger et al., 2010; Netz et al., 1995; Newton et al., 2005; Serrien et al., 2006). Second, we predicted that incongruent (i.e., required to tap in synchrony with an opposite hand) relative to congruent trials would result in increased tapping asynchrony and increased cognitive control network activity (Brass et al., 2001; Mayer et al., 2009). Finally, we hypothesized that intrinsic connectivity between homologue regions would be the best predictor of task-related inhibition within motor circuitry.
Methods
2.1. Transparency and ethics
In accordance with transparency and openness guidelines, study materials, processing scripts, and the data that support these findings have been archived on a publicly available repository (https://osf.io/u3yqj/). No part of the study procedures or analyses was pre-registered in a time-stamped, institutional registry prior to the research being conducted. We report here how we determined our sample size, all data exclusions (if any), inclusion and exclusion criteria, and whether they had been established prior to data analysis, all manipulations, and all measures in this study.
2.2. Participants
Forty healthy right-handed (Edinburgh Handedness Inventory = 60; Oldfield, 1971) adult volunteers, between the ages of 18–50, participated in the study. Participants were recruited from the local community through fliers, advertisements and word of mouth. Two participants were removed for accuracies lower than 70% for two or more trial types, while an additional four were extreme outliers (three times the interquartile range) for either the mean or coefficient of variation (CV) on intertap interval or asynchrony measures for two or more trial types. None of the remaining participants were identified as extreme motion outliers due to excessive mean frame-wise displacement. The final cohort therefore included 34 participants (10 females; 33.2±7.8 years old; 15.2±2.0 years of education).
Exclusion criteria consisted of a 1) history of neurological disorders, including traumatic brain injury with loss of consciousness lasting more than 30 minutes; 2) developmental disorder (autism spectrum disorder or intellectual disability); 3) Axis 1 disorder based on self-report; 4) contraindications for MRI (including pregnancy); 5) history of substance abuse disorder; 6) first-degree relative with a psychotic spectrum disorder; or 7) score greater than 29 on the Beck Depression Inventory (Beck et al., 1996). Urine-based drug screens were also conducted for all participants, with positive results leading to study exclusion. All participants provided informed consent according to institutional guidelines at the University of New Mexico School of Medicine.
2.3. SMS and Resting State Tasks
Participants completed the SMS task while undergoing fMRI data collection on a 3.0 Tesla Siemens Tim Trio scanner using a 32-channel head coil. Presentation software (Neurobehavioral Systems) was used for task stimulus presentation, synchronization of stimulus events with the MRI scanner, and recording of response times. Baseline stimuli (visual angle = 10.95°) consisted of a left and a right hand (hereafter referred to as display hands) surrounding a white fixation cross on a black background (Figure 1A). Each trial started with a visually presented cue word for 300 ms (“LEFT”, “RIGHT”, or “NONE”) indicating the required response hand for that trial and was used to initial motor planning. Each cue word was presented separately 14 times. The cue word was followed by a video showing the index finger from either the left or right display hand rhythmically tapping (13 repetitions; SMS probe) every 500 ms, which served as the probe for SMS. The SMS probe therefore indicated the start of the motor execution phase.
Figure 1: Diagram of Task Stimuli with Primary and Secondary Behavioral Measures of Interest.
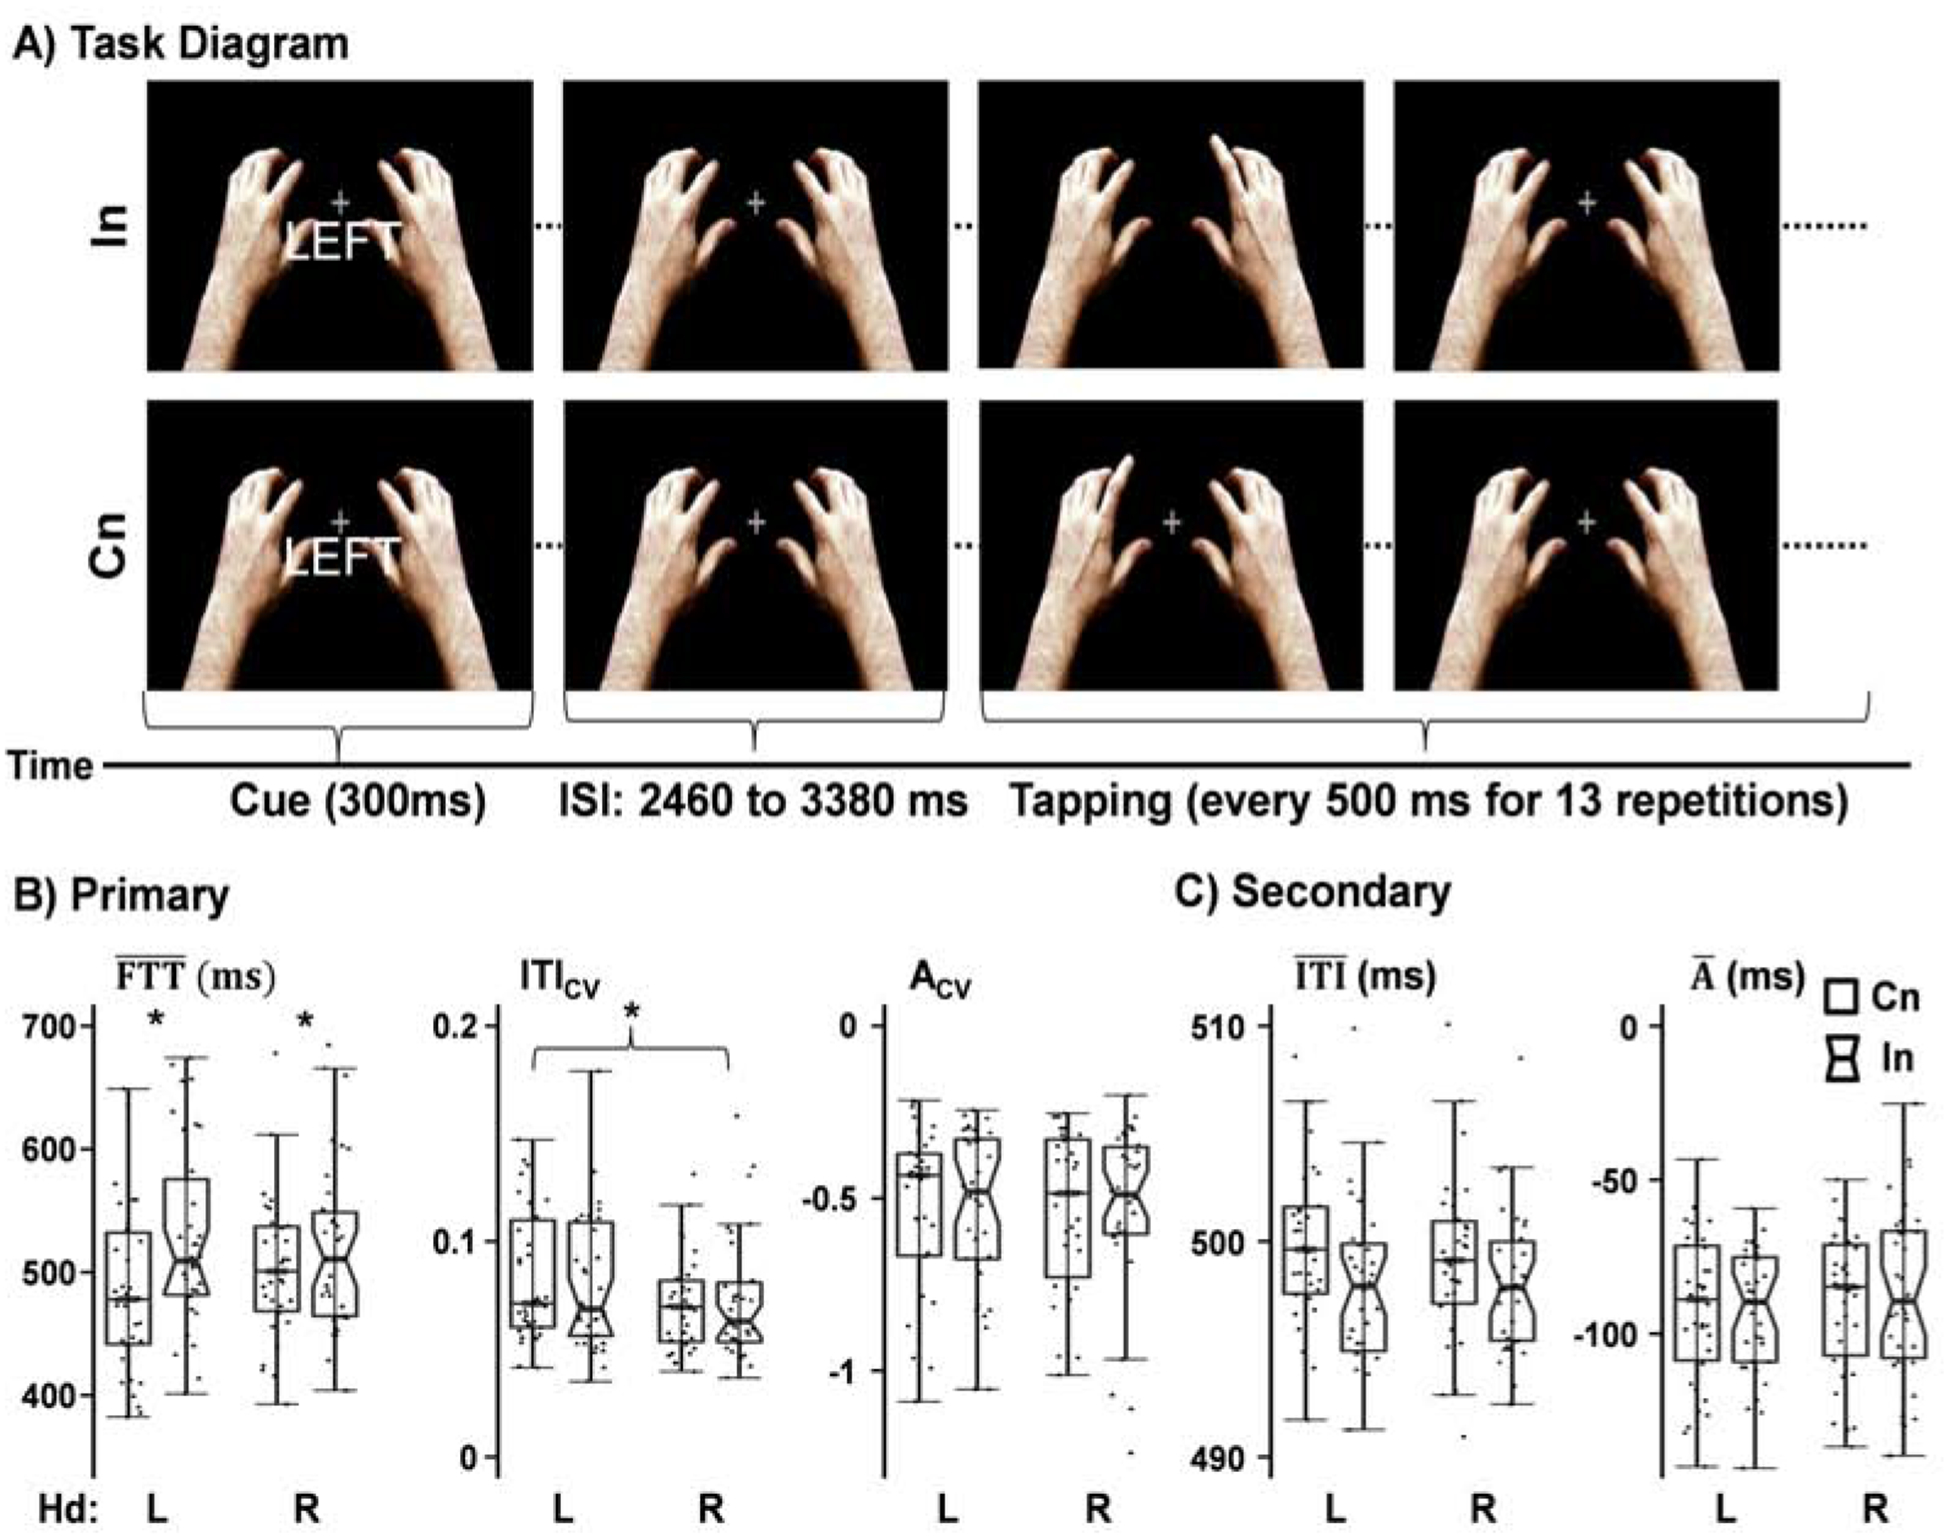
Diagrammatic representation of incongruent (In; e.g., “LEFT” cue followed by right display hand tapping) and congruent (Cn; e.g., “LEFT” cue followed by left display hand tapping) trials. An inter-stimulus interval (ISI; 2460 to 3380 ms) separated cue and display tapping to allow for the modeling of the hemodynamic response during planning (following presentation of the cue) and execution (i.e., following presentation of SMS probes) phases. Scatter box plots depict the results for primary (Panel B; mean first tap time [], coefficients of variation for intertap interval [ITICV] and asynchrony [ACV]) and secondary (Panel C; mean intertap interval [] and mean asynchrony []) behavioral performance measures during the tapping phase. For each behavioral measure, results are displayed for both incongruent (notched boxes) and congruent (rectangular boxes) trials and the right (R) and left (L) tapping hand (Hd). Significance is indicated with an * (p < 0.05).
The steps for video construction were as follows. The initial stimulus video consisted of the right hand only, which was then mirrored across a centrally presented fixation cross to create the left hand and remove any difference in tapping between hands. The background of the video was digitally removed and replaced with black, and contrast was increased to improve visibility of tendon and muscle movements. The final stimulus video was constructed frame by frame using Presentation software to ensure that the 500 ms ITI was identical between each of the individual taps for both hands. The video was played at 32 frames per second, with 16 frames corresponding to a complete tap (i.e., index finger all the way up and down). The baseline started with the finger in a down position. Frames 1–7 corresponded to rise time, with the finger in the peak position at the 8th frame occurring at 250 ms. Frames 9–15 corresponded to the fall time, with the finger returning to the down position at the 16th frame, occurring at 500 ms. The single video was concatenated 13 times (i.e., taps) for a video duration of 6500 ms.
Participants were instructed to rhythmically tap their index finger synchronously with the video display hand (i.e., SMS probe) following the presentation of a cue. The presentation tapping of the display hand could either be congruent (e.g., “LEFT” cue followed by left display hand tapping) or incongruent (e.g., “LEFT” cue followed by right display hand tapping) with the cues (primary conditions). Participants were instructed not to tap following the “NONE” cue, but only to pay attention to the hand tapping on the screen. Thus, based on the combination of cue word and the tapping laterality of the display hand, there were four primary experimental conditions (congruent left cue with left SMS probes, congruent right cue with right SMS probes, incongruent left cue with right SMS probes and incongruent right cue with left SMS probes) and two secondary conditions (none cue/left SMS probes and none cue/right SMS probes). Since SMS probes were split across congruent and incongruent presentations, each probe type was repeated in 7 blocks across the entire experiment. The entire task occurred over a total of two 5 minute and 23 second runs.
The cue-SMS probe interval (2460~3380 ms) and intertrial interval (4080~5920 ms) were both jittered with a minimum delay of approximately 2.5 s. This minimized non-linear summing of the hemodynamic response function (HRF) for the separate modeling of motor planning (i.e., following the cue) and motor execution (i.e., following motion of display hands or SMS probe) phases as well as to decrease temporal expectations (Glover, 1999). The resulting design matrix was invertible with only moderate collinearity among the various regressors.
For the resting state task, participants were required to maintain fixation on a white cross presented against a black background for approximately 5 minutes and 6 seconds. The resting state task was always performed following the behavioral task.
2.4. Behavioral Metrics from SMS Task
Behavioral metrics (Figure 2) were calculated using established procedures from the literature during the motor execution phase of SMS (Repp and Su, 2013). The total number of incorrect taps for each condition was calculated by summing any tap with the uncued hand (e.g., right hand tap following “LEFT” cue) within the entire response window (operationally defined as 100 to 8000 ms post-video onset). The mean first tap time () was calculated for all four conditions to measure initial interference. A calculation window (1250 to 6750 ms post-video onset) and a target window (200 ms before or after a display hand tap) were used to calculate the remainder of the behavioral metrics based on standard recommendations for SMS tasks (Repp and Su, 2013). The use of a calculation window permitted entrainment (i.e., responding to first two taps from display hands) to occur and excluded any perseverative responses.
Figure 2: Derivation of Behavioral Metrics from a Sample Timeline of a Single Block of the SMS Task.

Panel A displays the full response window (100 ms to 8000 ms), the entrainment window (100 to 1250 ms; corresponding to the first two display hand taps [DHT; blue triangles]) and calculation window (1250 to 6750 ms; corresponding to the third through final DHT). Example participant responses are depicted with an R. Asynchrony and intertap interval (ITI) calculations are only conducted within the calculation window. A sample asynchrony calculation (Panel B) shows the 200 ms target window surrounding each DHT. Only inphase taps (green) occurring during the calculation window are used to calculate asynchrony. Extra taps within the target window (yellow) or outphase taps not within the target window (red) are ignored in asynchrony calculation. A sample ITI calculation (Panel C) shows that all taps are used for the calculation of ITI. Each tap time is subtracted from the subsequent tap within the calculation window for ITI, starting with the first tap within the calculation window.
In-phase taps were operationally defined as the first behavioral response that occurred within the target window. Additional responses that occurred within the target window were labeled as extraneous taps. Any taps that occurred outside of the target window (between 200 and 250 ms before or after a target stimulus) were labeled as out-phase taps. The mean asynchrony () and asynchrony coefficient of variation (ACV) were calculated by subtracting each display hand tap (DHT) latency from its respective in-phase response tap (RT) latency (Figure 2B), starting from the first response tap within the calculation window, and ending with the last tap within the calculation window (N) using the formulas:
In contrast, a mean intertap interval () and its coefficient of variation (ITICV) were calculated by subtracting the difference between subsequent response times for any tap (inphase, out-phase and extraneous taps) that occurred within the calculation window (Figure 2C) starting with the second response tap within the calculation window according to the formulas:
Therefore, there was a total of three primary (ITICV, ACV, and ) and two secondary ( and ) measures of behavioral performance during the motor execution phase of SMS. Coefficients of variation were chosen as the primary measure given their prominence in the literature as a global metric of synchronized tapping (Repp and Penel, 2002).
2.5. MR Imaging
High resolution 5-echo multi-echo Magnetization Prepared Rapid Acquisition Gradient Echo T1 (repetition time [TR] = 2530 ms; echo times [TE] = 1.64, 3.5, 5.36, 7.22, 9.08 ms; inversion time [TI] = 1200 ms; flip angle = 7°; number of excitations [NEX] = 1; slice thickness = 1 mm; field of view [FOV] = 256 mm; matrix size = 256 × 256; isotropic voxels = 1 mm) were collected for structural images. Echo-planar images (EPI) were collected for two runs of task data or a single run of resting state data using a single-shot, gradient-echo echoplanar pulse sequence [TR = 460 ms; TE = 29 ms; flip angle = 44°; multiband acceleration factor = 8; NEX = 1; slice thickness = 3 mm; FOV = 248 mm; matrix size = 82 × 82].
A reference image with multiband acceleration factor set to one was also acquired for each EPI run to facilitate registration with native T1 image. Fifty-six interleaved 3.0 mm thick transversal slices were selected to provide whole-brain coverage (voxel size: 3.024 × 3.024 × 3.000 mm). Two spin-echo field mapping sequences (TR = 7220 ms; TE = 73 ms; flip angle= 90°; refocus flip angle = 180°; slice thickness = 3 mm; FOV = 248 mm; matrix size = 82 × 82; 56 interleaved slices; 3.024 × 3.024 × 3.000 mm voxels) with reversed phase encoding directions (A → P; P → A) were also collected to correct for susceptibility related artifacts in the gradient echo data.
2.6. MRI Image Preprocessing and Analyses
Task-related and resting state data were analyzed using a combination of FSL and AFNI programs. Time series images were first despiked, temporally interpolated to correct for slice-time acquisition differences, and then spatially registered in two and three dimensional space to the single band reference image of the first run to minimize effects of head motion. The spin-echo field map images were used to estimate the susceptibility-induced off-resonance field using previously described methods (Andersson et al., 2003; Smith et al., 2004). The reference EPI was then aligned with the native T1 image using an affine transformation, followed by a non-linear alignment of the native T1 image to Talairach space. The two transformation matrices (EPI reference → T1 → template) were then combined with the distortion correction map to simultaneously eliminate distortion artifacts and align all functional data into Talairach space.
There are known structural asymmetries across the hemispheres that also demonstrate varying degrees of individual differences (Corballis, 2009; Geschwind and Galaburda, 1985; Oleksiak et al., 2011; Toga and Thompson, 2003). Therefore, both native EPI and T1-weighted imaging data were reflected around the Y-axis and then separately registered to the template using non-linear registration. This procedure should maximize accuracy in terms of registration to the template, but will also result in small registration differences across hemispheres due to the asymmetrical nature of both individual data and the template. To reduce the likelihood of findings due to structural asymmetries, only clusters which had significant homologues in both hemispheres were considered in the final analyses. Time series data were then blurred using a 6 mm Gaussian full-width half-maximum filter. Given our interest in inhibitory signals as measured by negative BOLD signals, global signal correction was not performed for either task or resting state analyses (Liu et al., 2017; Murphy and Fox, 2017).
Deconvolution was used to generate a single HRF separately for planning (post-cue; first 31 images) and execution (post-video onset; 43 images) phases for each trial type relative to baseline (visual fixation plus gradient noise). HRFs were normalized by the average baseline coefficients to estimate percent signal change. Separate regressors were included for incorrect trials but were not analyzed further due to low error rates (Mayer et al., 2011). The normalized beta coefficients were then summed corresponding to the peak (planning phase post-cue = 3.68 – 7.36 s; execution phase post video = 3.68 – 11.04 s) as well as the post-stimulus undershoot (PSU) to examine prolonged inhibition (planning phase = 10.12 – 12.42 s; execution phase = 12.42 to 16.56 s).
Two 2 × 2 (Cue [Left vs. Right] × Hemisphere [Left vs. Right]) ANOVAs were conducted for the peak and PSU data from the motor planning phase, whereas 2 × 2 × 2 (Tapping Hand [Left vs. Right] × Hemisphere [Left vs. Right] × Congruency [Incongruent vs. Congruent]) ANOVAs were conducted for the peak and PSU data from the execution phase. All second level analyses were conducted with AFNI’s 3dMVM. In this analytic framework, our a priori predictions of greater inhibition should be evident in the Cue/Tapping Hand × Hemisphere interaction whereas cognitive interference effects should be captured by the main effect and/or interactions with Congruency.
All whole brain results were corrected at a voxelwise threshold corresponding to p < 0.05 based on 10,000 Monte-Carlo simulations (p < 0.001 and minimum cluster size = 520 microliters) using a Non-Gaussian spherical autocorrelation function from the AFNI program (Cox et al., 2017). In addition, only bilaterally represented clusters or midline clusters with greater than 520 microliters of volume in both hemispheres were further considered. Significant effects are reported for all follow-up testing of interactions at p < 0.05.
2.7. Resting State Analyses
Linear regressions were performed to assess if intrinsic connectivity within the motor network could predict the magnitude of inhibitory activity during task. Specifically, following the identical preprocessing pipeline listed above, resting state time-series data were subsequently cleaned by regressing out variance associated with the six-rigid body motion parameters and their derivatives, as well as white matter and ventricular noise sources. Connectivity strength was then determined by extracting time-series data from nine significant left and reflected right hemisphere motor nodes (see Results section). Nodal connectivity strength was then correlated in a pairwise fashion, followed by Fisher’s Z score transformation of absolute correlation values. Absolute values were chosen due to concerns regarding negative correlations in several graph theory metrics (Fornito et al., 2013; Rubinov and Sporns, 2011; Schwarz and McGonigle, 2011). Hierarchical linear regressions were used to test a priori predictions of inhibition being primarily controlled by intrinsic connectivity strength between contralateral homologue regions (Li et al., 2013). Entry order in the model therefore followed the same general pattern: 1) exact contralateral homologue region to the dependent variable, 2) similar contralateral homologue regions if existing (i.e., a different cluster of activation within the SMA), 3) the averaged correlation strength among nodes from both non-homologue contralateral cortex and ipsilateral cerebellum or 4) the averaged correlation strength among nodes from both the ipsilateral non-homologue cortex and contralateral cerebellar nodes. Adjusted R2 of the overall model and R2 change were used to assess significance of each step in the model.
Results
3.1. Behavioral Results
Behavior data in the manuscript are presented with both mean and standard deviation (M ± SD). Accuracy rates were near ceiling (99.5±1.25%) and not analyzed further. A series of 2 × 2 (Tapping Hand [Left vs. Right] × Congruency [Incongruent vs. Congruent]) repeated measures ANOVAs were performed on our primary (ITICV, ACV, and ) behavioral measures (Figure 1B). A main effect of tapping hand was observed for ITICV (F[1,33] = 4.27, p = 0.047), with increased variation observed for the left (0.09 ± 0.03) relative to right (0.07 ± 0.03) hand. A main effect of congruency was observed on (F[1,33] = 10.65, p = 0.003), with a slower first tap in response to incongruent (523.9 ± 64.1 ms) relative to congruent (496.4 ± 60.4 ms) trials. All other main effects and interactions were not significant.
Identical ANOVAs were performed on secondary ( and ) behavioral measures (Figure 1C). Results indicated only a trend interaction for (F[1,33] = 3.49, p = 0.071), which was not examined further given the marginal level of significance. No other main effects or interactions were significant.
3.2. fMRI Results
Planning Phase: Peak BOLD
Thresholded (Figure 3A; cortical surface data presented in Figure 3B) results from the 2 × 2 (Cue [Left vs. Right] × Hemisphere [Left vs. Right]) whole brain ANOVA of the peak phase indicated a significant interaction in the SMC/inferior parietal lobule (IPL; BAs 1–6/40; 7290 μl), supplementary motor area (SMA; BAs 6/31; 522 μl) and Lobule V (880 μl) of the cerebellum. However, the pattern of the interaction varied across these three areas. Within the SMC, simple effects testing indicated a positive BOLD response in the hemisphere contralateral to the cued hand versus a negative response for the ipsilateral hemisphere (i.e., bilateral TCI). A significant difference also existed between left/right cued activity in the right SMC whereas the left hemisphere was only a trend (Figure 3C). The pattern of contralateral/ipsilateral activity relative to cued hand was reversed for Lobule V of the cerebellum, with significant differences between right and left cues again only observed in the right cerebellum. Finally, a positive BOLD response was observed in the right SMA for left cues in conjunction with a negative response for right hand cues (TCI), whereas the left SMA indicated null effects between left and right hand cues (no TCI). Neither the main effect of Cue nor Hemisphere were significant.
Figure 3: Motor Planning Phase Results and Hemodynamic Response Functions.
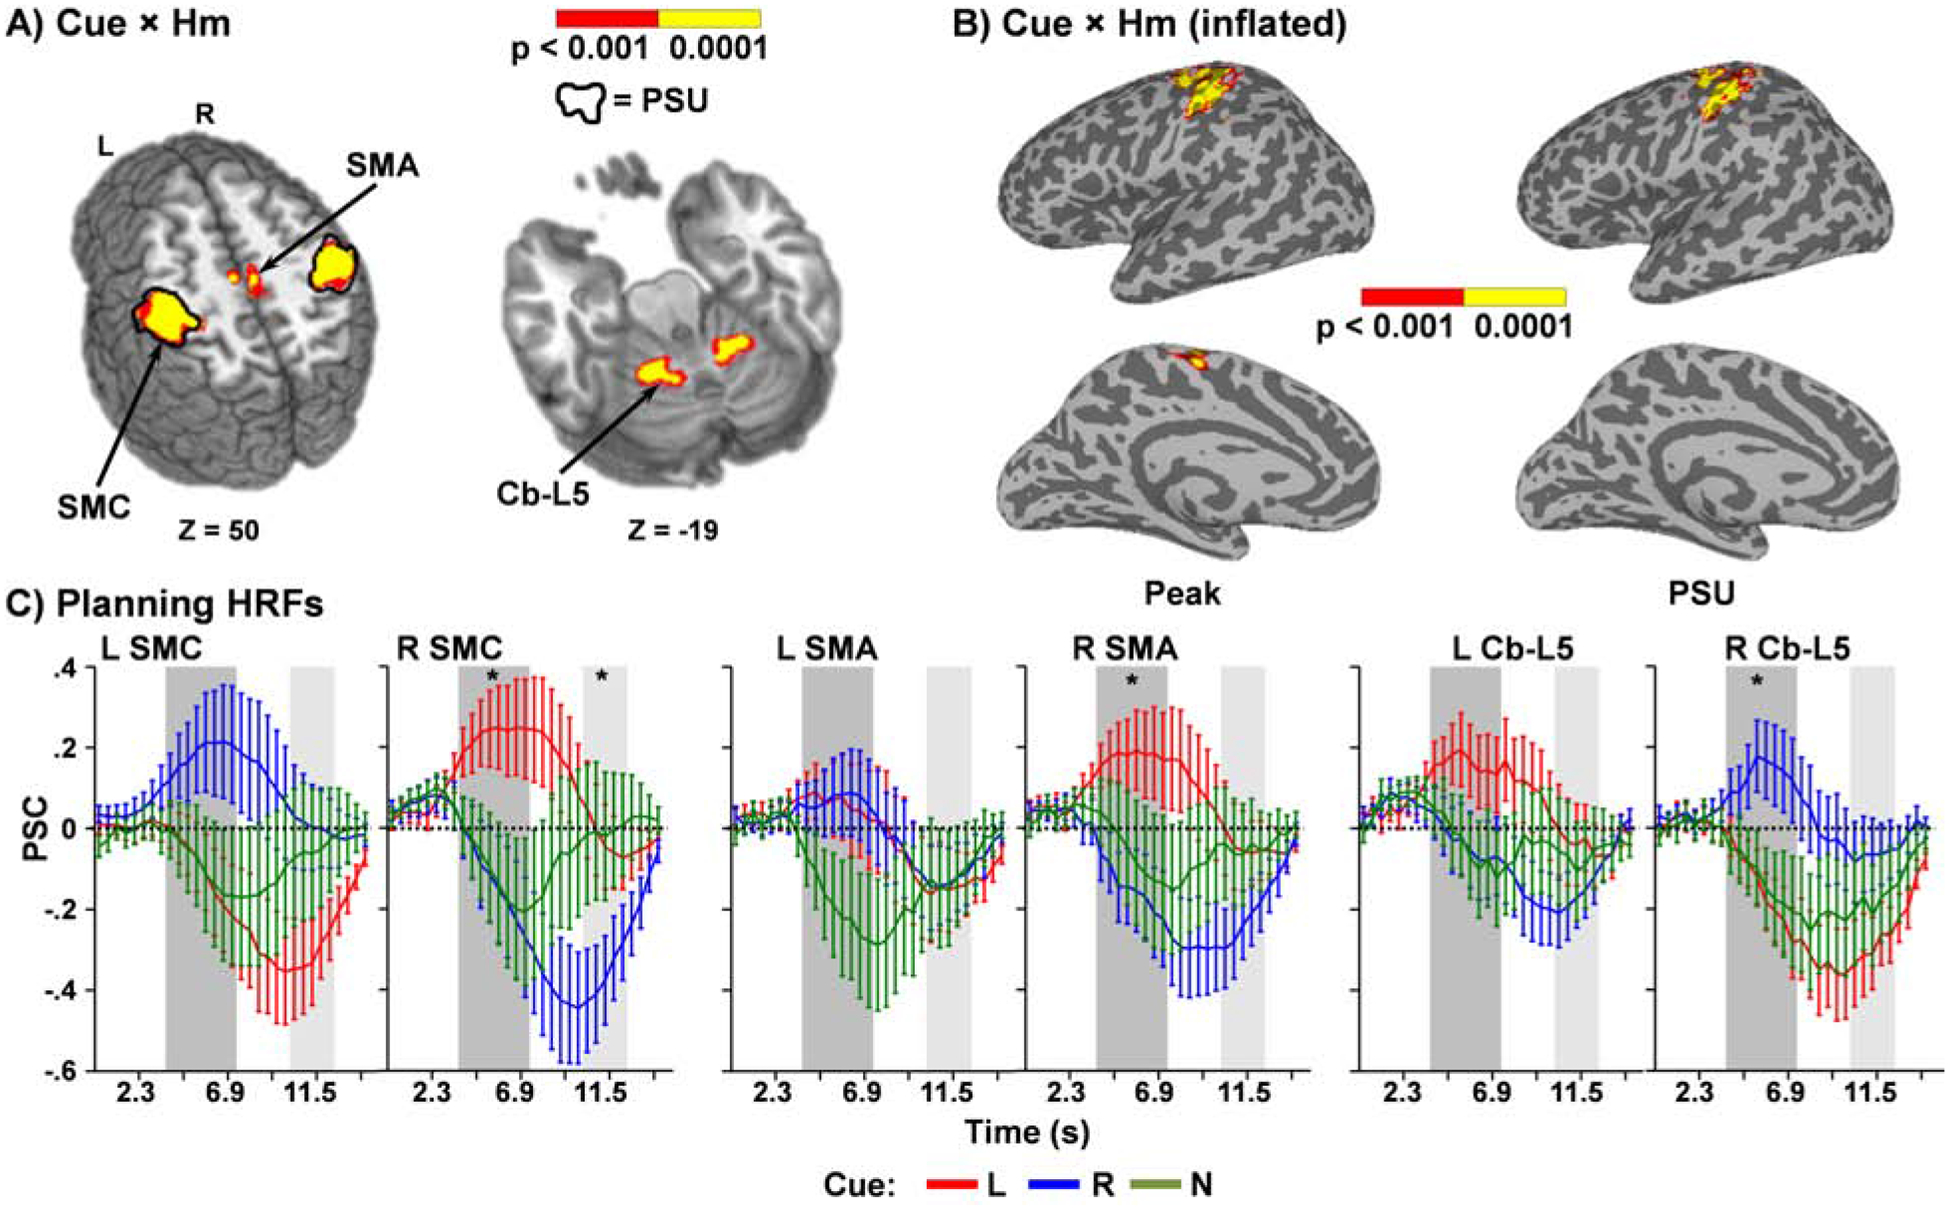
Regions (Panel A) exhibiting significant Cue × Hemisphere (Hm) interaction during motor planning for either the peak (colors: p < 0.001 = red; p < 0.0001 = yellow) or post-stimulus undershoot (PSU; black outline) phases of the hemodynamic response function (HRF). Significant interactions during the peak phase included sensorimotor cortex (SMC), supplementary motor area (SMA) and Lobule V of the cerebellum (Cb-L5), with the SMC also exhibiting significant differences during the PSU phase. Locations of the axial (Z) slices are given according to the Talairach atlas. Thresholded results are also projected to the cortical surface in Panel B. Panel C presents line graphs with the mean percent signal change (PSC) from baseline plotted over the entire HRF for the left (L) and right (R) SMC, SMA, and Cb-L5. Error bars indicate standard error of the mean, line color denotes Cue type (L=Red; R=Blue), and shaded regions indicate peak (dark grey) or PSU (light grey) windows of the HRF. Significance is indicated with an asterisk (p < 0.05) and was limited to the primary analyses (right/left cues). The HRF associated with NONE cues (green) is included for qualitative comparisons only.
Additional linear mixed effects analyses were performed in which the five regions exhibiting inhibitory activity (bilateral SMC, right SMA, and bilateral cerebellum) were tested for association with the three primary behavioral measures (ITICV, ACV, and ). Analyses were corrected for multiple comparisons across the 5 clusters (Bonferroni 0.05/5=0.01). Overall model results indicated that was significant over the intercept only model (χ2[8]=61.86, p≤0.001), with parameter estimates indicating that was negatively associated with contralateral cued activity in the right cerebellum cluster only (β=−10.92;t[28]= −3.15; p=0.004). Conversely, overall model results for ITICV and ACV were both null compared to their intercept only models (both p’s > 0.05).
Interestingly, qualitative examination of the HRF for NONE trials (not included in main analyses) also showed evidence of inhibition that was predominantly present on a bilateral basis within motor circuitry (bilateral SMC, SMA and Lobule V) but returned to baseline more quickly in most nodes than what occurred following ipsilateral cues (Figure 3C).
Planning Phase: Prolonged Inhibition
The Cue × Hemisphere interaction was also significant within the SMC/IPL (BAs 1–6/40; 6823 μl) during the PSU phase of the HRF (Black outline in Figure 3A). Simple effects testing indicated that the interaction was driven by increased inhibition (i.e., negative BOLD response) in the ipsilateral hemisphere relative to the cued hand in conjunction with baseline levels of activation in the contralateral hemisphere (Figure 3C). There were no differences between right and left cues across both the right and left SMC/IPL, as well as no significant effects of either Cue or Hemisphere. An examination of HRFs from motor circuitry during the planning phase indicated that maximum extent of inhibition occurred at 8.74 s post-cue, following the peak but prior to the traditional PSU.
Execution Phase: Peak BOLD
Results from the 2 × 2 × 2 (Tapping Hand [Left vs. Right] × Hemisphere [Left vs. Right] × Congruency [Incongruent vs. Congruent]) ANOVA for the peak phase indicated a significant three-way interaction in the primary and secondary visual cortex (BAs 17/18/23; 6013 μl), superior and inferior parietal lobule (BAs 7/40; 3170 μl), ventral visual streams extending into the cuneus (BAs 18/19/37; 38479 μl), middle temporal gyrus (MTG; BAs 21/22; 614 μl) and Lobule VII of the cerebellum (950 μl). The majority of these interactions resulted from the reversal of the appearance of the display hand during incongruent (i.e., display hand tapping in contralateral visual field to cue) relative to congruent (i.e., display hand tapping in ipsilateral visual field) trials and are therefore of minimal interest to the primary objectives of the current investigation.
Similar to the planning phase, significant Tapping Hand × Hemisphere interactions (Figure 4A; cortical surface projection = Figure 4C) were present in the SMC extending into the IPL (BAs 1–4/6/40; 8123 μl), a slightly anterior aspect of the SMA (aSMA; BAs 6/24/31; 627 μl) and Lobules V and VI of the cerebellum (BA 19; 2232 μl) during the motor execution phase. Contrary to the planning phase, positive BOLD responses (i.e., above baseline) were observed in bilateral motor circuitry. Increased activation was observed in the contralateral relative to ipsilateral SMC and aSMA for the tapping hand, as well as ipsilateral relative to contralateral Lobule V/VI for the tapping relative to non-tapping hand (Figure 4B). The magnitude of activation differences between right and left handed tapping was equivalent across both hemispheres within the SMC, whereas only the left aSMA (right hand > left hand) and left Lobule V/VI (left hand > right hand) exhibited significant tapping hand differences.
Figure 4: Motor Execution Phase Results and Hemodynamic Response Functions.

Regions (Panel A) exhibiting significant Tapping Hand (Hd) × Hemisphere (Hm) interaction during motor execution for either the peak (colors: p < 0.001 = red; p < 0.0001 = yellow) or post-stimulus undershoot (PSU; black outline) phases of the hemodynamic response function (HRF). Thresholded results are also projected to cortical surface in Panel C. Locations of sagittal (X) and axial (Z) slices are given according to the Talairach atlas. Panel B presents scatter box plots of percent signal change (PSC) data for regions exhibiting significant interactions during the peak phase including sensorimotor cortex (SMC), anterior supplementary motor area (aSMA), and Lobules V and VI of the cerebellum (Cb-L5/6). Selected regions from the PSU phase (Panel D) included the dorsal (dSMC) aspects of the SMC, putamen/globus pallidus (Put), and Lobules VII/VIII of the cerebellum (Cb-L7/8). Left (L) hemisphere data is presented in rectangular boxes and right (R) hemisphere data in notched boxes.
Both the SMC/IPL (BAs 2–4/40; 2455 μl) and Lobule V of the cerebellum (828 μl) also exhibited significant Congruency × Hemisphere interactions (Figure 5A and 5C). Simple effects testing indicated significantly greater activation for congruent relative to incongruent trials in the left, but not the right, SMC. This pattern was reversed within the Lobule V of the cerebellum, with congruent trials having greater activation than incongruent in the right, but not the left, hemisphere.
Figure 5: Regions Exhibiting Congruency Interaction Effects during Motor Execution.

Regions displaying significant (p < 0.001 = red; p < 0.0001 = yellow) Congruency (Con) × Hemisphere (Hm; Panel A) or Tapping Hand (Hd) × Congruency (Panel B) interactions during the peak phase of motor execution. Only regions with significant cross-hemisphere homologues are presented. Locations of axial (Z) slices are given according to the Talairach atlas. Panel C displays scatter box plots for percent signal change (PSC) data for the sensorimotor cortex (SMC) and Lobule V of the cerebellum (Cb-L5), both of which exhibited significant Con × Hm interactions. Congruent (Cn; rectangular boxes) and incongruent (In; notched boxes) trials are presented for both the left (L) and right (R) hemispheres. Panel D displays box and scatter plots the inferior parietal lobule (IPL), with the left (L) and right (R) hand plotted on the X-axis and the same conventions used for congruency effects.
The Tapping Hand x Congruency interaction was significant in the IPL (BA 40; 916 μl), with simple effects testing indicating increased activation for congruent relative to incongruent trials during right, but not left, hand tapping (Figure 5B and 5D). Neither the main effects of Tapping Hand nor Hemisphere were significant. Main effects of Congruency were limited to visual cortex and completely overlapped with the three-way interaction.
Execution Phase: Prolonged Inhibition
Results from the 2 × 2 × 2 (Tapping Hand [Left vs. Right] × Hemisphere [Left vs. Right] × Congruency [Incongruent vs. Congruent]) ANOVA for the PSU indicated a significant three-way interaction in secondary and associative visual cortex (BAs 18/19; 3754 μl). Simple effect testing interactions (Cue × Congruency) were significant only in the left hemisphere, with deactivation occurring during incongruent trials relative to a near baseline response to congruent trials for right hand cues only.
Significant (black outline in Figure 4A) Tapping Hand × Hemisphere interactions were present in ventral (BAs 2–4/40; 2642 μl) and dorsal (dSMC; BAs 3–6; 2798 μl) aspects of the SMC, auditory cortex (BAs 6/22/40–43; 2814 μl), ventroanterior and ventrolateral nuclei of the thalamus extending into the head of the caudate (1674 μl), putamen/globus pallidus (1974 μl), Lobules V/VI of the cerebellum extending into the visual cortex (BAs 18/19/37; 12326 μl) and Lobules VII/VIII (2562 μl) of the cerebellum. For all interactions, simple effect testing indicated that these results were primarily driven by greater differences in sustained activation for left rather than right hand tapping in the non-dominant (i.e., right cortical regions and left cerebellum) compared to dominant (i.e., left cortical regions and right cerebellum) motor circuitry (Figure 4D). The other two-way interactions (Tapping Hand × Congruency or Congruency × Hemisphere) were not significant.
Prolonged deactivation was also present for incongruent relative to congruent trials in the middle/superior temporal gyrus (BAs 19/22/37/39; 3392 μl), posterior cingulate gyrus (BAs 29–31; 685 μl) and parahippocampal gyrus extending into sub-thalamic nuclei (BAs 19/27/36/37; 1958 μl) during the PSU of the execution phase. The main effect of Hemisphere was not significant, and the main effect of Tapping Hand exhibited complete spatial overlap with the three-way interaction.
3.3. Prediction of Inhibitory BOLD Activity from Resting Connectivity
Task-related inhibitory activity was only observed during the planning phase. Hierarchical regressions were therefore limited to the bilateral SMC, right SMA, and bilateral Lobule V of the cerebellum to determine whether connectivity strength from nine empirically defined motor regions (i.e., significantly activated in task analyses) predicted the degree of task-related inhibition. The nine non-overlapping motor regions were identified from both the planning and execution phases of the task and included: the 1) sensorimotor cortex/inferior parietal lobe (SMC/IPL), 2) central portions of the supplementary motor area (SMA), 3) Lobule V of the cerebellum, 4) Lobule VII of the cerebellum; 5) aSMA; 6) dorsal SMC, 7) putamen/globus pallidus, 8) ventroanterior and ventrolateral nuclei of the thalamus extending into the head of the caudate, and 9) Lobules VII/VIII of the cerebellum. Time series data for these regions were obtained for both the left and the reflected right hemisphere for a total of 18 nodes.
Connectivity strength between all right and left hemisphere motor nodes are displayed in Figure 6. In general, contralateral cortical and subcortical (SMC, dSMC, aSMA, SMA, putamen and thalamus) connectivity was greater than ipsilateral connectivity within both the right (t[33] = −8.18, p < 0.001) and left (t[33] = −10.48, p < 0.001) hemispheres. The same pattern of increased contralateral connectivity was observed among the cerebellar nodes (Lobule V, Lobule VII and Lobule VIII) relative to ipsilateral right (t[33] = −3.69, p < 0.001) and left (t[33] = −3.43, p = 0.002) hemispheres.
Figure 6: Connectivity within Motor Circuitry and Relationship with Task Inhibition.

A connectogram depicting the average resting state correlation strength (absolute Pearson r) between empirically identified nodes of the motor network. Each node is represented by a unique color (outer circle band where left hemisphere [LH] = warm colors; right hemisphere [RH] = cool colors) and a label (dorsal sensorimotor cortex [dSMC] and SMC extending into the inferior parietal lobule [SMC]; anterior [aSMA] and central [SMA] aspects of the supplementary motor areas; putamen/globus pallidus [Put]; ventroanterior and ventrolateral nuclei of the thalamus [Thal]; and cerebellar lobules V [Cb-L5], VII [Cb-L7] and VIII [Cb-L8]). The inner multi-colored band represents connectivity to other motor nodes with r > 0.30 displayed, ordered from left to right within each band by correlation magnitude. The strength of network edges are represented by connecting strands between nodes and are grouped within four general percentiles (PCTL: 0–25th = black strand; 26–50th = dark grey strand; 51–75th = medium grey strand; 76–100th = light grey strand). As is evident by the width of crossing strands, connectivity strength was greatest between contralateral homologues. Panel B depicts the relationship between resting state connectivity between the right and left SMA (X axis; Fisher Z score) and inhibitory activity (Y axis; percent signal change [PSC]) in the right SMA for ipsilateral stimuli during the planning phase.
Results from the five hierarchical regressions indicated that only resting state contralateral connectivity of the SMA (Figure 6B) was significantly associated with cue-evoked inhibitory activity in the right SMA (Adjusted R2 = 0.15; Standardized β = −0.42; F[1,32] = 6.87; p = 0.013), with connectivity between other motor nodes not explaining additional variance. Therefore, individuals with increased SMA homologue connectivity exhibited increased (i.e., here more negative) task-related inhibition in the right SMA. Results from SMC and Lobule V cerebellar models were non-significant.
Discussion
The current study investigated three hypotheses about whether inhibition was greater in the right hemisphere during motor planning relative to execution (supported), whether task-related inhibition was associated with homologue connectivity at rest (partially supported), and whether the cognitive control network was recruited during incongruent, visually-guided SMS stimuli (not supported). Specifically, a negative BOLD response was observed in ipsilateral neocortex (bilateral SMC and right SMA) and contralateral cerebellum (Lobule V) during planning of SMS, with SMC exhibiting a more sustained pattern of inhibitory activity throughout the entire hemodynamic response. Previous studies indicate that the SMC, SMA and precuneus are integral for planning and sensorimotor integration to external stimuli during SMS (Hackney et al., 2015), whereas the basal ganglia, thalamus, and cerebellum are required for rhythmic perception, motor execution and predictive movement control (Bastian, 2006; Grahn and Brett, 2007; Repp and Su, 2013). Negative BOLD signals have been directly linked to active inhibition in deeper cortical layers through invasive recordings (Boorman et al., 2010; Devor et al., 2007a; Shmuel et al., 2006), as well as observed in ipsilateral SMC during SMS (Hamzei et al., 2002; Newton et al., 2005; Stefanovic et al., 2004) and bilaterally during proactive response inhibition (Mayer et al., 2016).
In contrast, although increased activation was observed for contralateral neocortex (SMC and SMA) and ipsilateral cerebellum relative to the tapping hand during the execution phase of SMS, there was no evidence of inhibitory BOLD in ipsilateral motor circuitry. To our knowledge, this is the first study to explicitly disambiguate increased motor inhibition during planning relative to execution through hemodynamic activity. Importantly, current findings are concordant with TMS studies that observed increased TCI between the SMC, or between premotor cortex and contralateral SMC, during motor planning (Duque et al., 2010). Previous BOLD studies modeled a single hemodynamic response and conflated motor planning with execution (Hamzei et al., 2002; Newton et al., 2005; Stefanovic et al., 2004), whereas the current study utilized rapid temporal sampling (460 ms) in conjunction with deconvolution to differentiate the phases of motor activity. Thus, current and previous (Beck et al., 2008; Kroeger et al., 2010) results suggest a release of inhibition once motor programs are actually initiated during SMS.
As generally predicted, inhibition was greater within the right SMC, right SMA and right Lobule V of the cerebellum during the planning phase relative to left hemisphere homologue regions, although this asymmetry was largest for the SMA. These findings are consistent with previous work demonstrating an asymmetric efficiency in which the left motor cortex has a greater inhibitory effect on the right motor cortex, putatively through callosally mediated inhibitory interneuron projections (Netz et al., 1995; Serrien et al., 2006). Others have reported significant negative BOLD responses in right but not left SMC during unilateral hand movements (Nirkko et al., 2001). Moreover, the left hemisphere is thought to specialize in predictive motor control, the planning and coordination of motor actions regardless of handedness (Netz et al., 1995; Serrien et al., 2006) whereas the right hemisphere is more involved in updating ongoing motor actions (Mutha et al., 2012). Collectively, these findings suggest that the left hemisphere’s inhibitory influence over the right hemisphere may be greater during motor planning relative to execution (Kroeger et al., 2010).
In the current study, evidence of inhibition was absent in the left SMA, which instead exhibited positive rather than negative BOLD signals during the planning of both right/left-hand movements. Parenthetically, the left SMA did exhibit evidence for inhibitory activity during the none trials when proactive response inhibition was required for both right and the left hand responses (Mayer et al., 2016). TCI is believed to originate from the contralateral hemisphere during excitatory neurotransmission (Li et al., 2013), and functional connectivity strength has previously been associated with positive BOLD activity across a variety of tasks (Jiang et al., 2004; Mennes et al., 2010; Parker et al., 2017; Smitha et al., 2017). Although all motor nodes showed a high degree of homologue connectivity, homologue connectivity was only associated with inhibitory BOLD activity during motor planning in the right SMA. The SMA has recently been shown to have a specific role in modulating interhemispheric actions during motor preparation (Welniarz et al., 2019). Current findings extend these results, and suggest that the SMA may be critical for the coordination and planning of movements across hemispheres, including inhibitory activity.
Not surprisingly (Schmidt et al., 2000; Todor and Kyprie, 1980), evidence of increased behavioral variability in tapping was observed for the left (non-dominant) relative to right hand in this right-handed sample. Both motor circuitry (ventroanterior/lateral nuclei of the thalamus, putamen and Lobule VII and VIII of the cerebellum) and sensory cortices (auditory and visual) exhibited increased or sustained activation in the non-dominant (i.e., right cortical regions and left cerebellum) versus dominant (i.e., left cortical regions and right cerebellum) hemispheres as well as during the post-stimulus undershoot epoch, potentially representing a neural marker of more sustained effort and/or attention to execute SMS motor programs with the non-dominant hand. The current study did not observe differential activation within premotor cortex and parietal association cortex during either planning or execution phases. In addition to motor planning, the premotor cortex is believed to code the time interval between taps (Merchant and Averbeck, 2017), with additional support from the posterior parietal association cortex when timing relies on spatial cues, as is the case with visually-guided SMS (Bueti and Walsh, 2009). All trial types in the current study required both cognitive processes, which may have resulted in similar levels of premotor and parietal activity in the current task.
In contrast to previous studies, increased activity was observed during congruent versus incongruent SMS trials in dominant motor circuitry (left SMC and right Lobule V of the cerebellum) rather than within the cognitive control network during incongruent trials (Brass et al., 2001; Mayer et al., 2009). It has been shown across numerous studies that the ventrolateral/dorsolateral prefrontal cortex and inferior parietal lobule are recruited during cognitively demanding tasks (Niendam et al., 2012). Discrepancies between current and previous results are also likely a result of differences in task design, with increased cognitive interference more likely to occur immediately following presentation of a single conflicting stimuli (Brass et al., 2001) or during continuously presented cross-modal distractors in SMS tasks (Mayer et al., 2009). This explanation is further supported by behavioral data, with both current and previous studies (Brass et al., 2001) indicating interference for incongruent stimuli only at the first tap (e.g., ). Moreover, previous work indicates that the visuospatial properties of stimuli (i.e., location of the tapping hand) play a minimal role in temporal encoding during SMS (reviewed in Repp and Su, 2013). Collectively, these results suggest that SMS can be entrained during visually-guided tasks with minimal interference beyond the first or second presentation of incongruent stimuli based on temporal (i.e., frequency of stimuli) rather than spatial (i.e., location of hand) properties (Halbig et al., 1998; Mayer et al., 2009; Repp and Su, 2013).
There are several limitations to the current study that should be noted. Foremost, the current sample was limited to strongly right-handed individuals to eliminate potential differences in basic hemisphere organization (Hodgson and Hudson, 2018). Inhibition of ipsilateral motor cortex has been shown to be greater during right-handed versus left-handed tapping in right-handed participants (Newton et al., 2005), suggesting that current results may not generalize to ambidextrous or left-handed individuals. Second, BOLD represents a proxy measure of neural activity, and our utilization of a single imaging modality does not permit disambiguation of the inhibition of neurons versus differences in cerebral blood flow or vascular reactivity (Attwell et al., 2010; Logothetis, 2008). Third, electromyography data were not collected during the task to ensure that hand movements did not occur. Fourth, resting state data were always collected after the task, which may have introduced ordering effects on the data (e.g., priming of motor system). Finally, the inhibitory window in the current study was defined a priori to minimize the likelihood of bias. The window was based on previous research suggesting similar patterns of neural activation for both positive and negative BOLD (Shmuel et al., 2002) and the typical temporal profile of the post-stimulus undershoot (Hanlon et al., 2016; Mayer et al., 2013). However, HRFs from various motor regions in the current study suggest that active inhibitory processes may follow a different timescale between the traditional peak of the HRF and the traditional post-stimulus undershoot, an important consideration for future studies.
In summary, BOLD evidence for neural inhibition was present only in the bilateral SMC, right SMA and bilateral cerebellar Lobule V, and was only observed during the planning rather than execution phase of SMS. These findings highlight the importance of separately modeling the various stages of motor programming in neuropsychiatric disorders with known SMS and/or behavioral mimicry abnormalities to better disambiguate underlying neuropathology (Dankinas et al., 2017; Ganos et al., 2012; Spengler et al., 2010). In addition to marked hemispheric asymmetry in inhibition, the strength of SMA homologue connectivity was associated with right SMA inhibition, providing additional evidence for the critical role that this structure plays in interhemispheric motor planning and coordination (Welniarz et al., 2019). Future studies that include TMS as well as BOLD imaging are required to further elucidate the potential roles of the SMA and SMC in inhibitory activity during SMS and other motor tasks.
Table 1:
Tapping Hand by Hemisphere Interaction Effects
| Label | Volume | BA | Center of Mass (X, Y, Z) |
|---|---|---|---|
| Planning Phase | |||
| SMC/IPL | 7290 μl | 1–6/40 | −39.1, −26.3, 51.9 |
| SMA | 522 μl | 6/31 | −5.7, −19.9, 54.0 |
| Lobule V | 880 μl | NA | −15.7, −46.2, −19.1 |
| Planning Phase (Prolonged) | |||
| SMC/IPL | 6823 μl | 1–6/40 | −39.2, −25.6, 52.3 |
| Execution Phase | |||
| SMC/IPL | 8123 μl | 1–4/6/40 | −35.9, −27.9, 52.5 |
| Anterior SMA | 627 μl | 6/24/31 | −5.5, −14.5, 48.3 |
| Lobules V/VI | 2232 μl | 19 | −12.8, −50.0, −19.0 |
| Execution Phase (Prolonged) | |||
| Ventral SMC | 2642 μl | 2–4/40 | −50.8, −17.6, 29.7 |
| Dorsal SMC | 2798 μl | 3–6 | −21.4, −30.3, 65.8 |
| Auditory cortex | 2814 μl | 6/22/40–43 | −54.1, −11.7, 9.7 |
| Thalamus/caudate | 1674 μl | NA | −11.7, −10.8, 17.2 |
| Putamen/globus pallidus | 1974 μl | NA | −27.3, −7.0, 2.1 |
| Lobules V/VI/visual cortex | 12326 μl | 18/19/37 | −14.7, −51.9, −15.2 |
| Lobules VTI/VTII | 2562 μl | NA | −11.0, −56.0, −37.1 |
Notes: BA=Brodmann area; SMC/IPL=sensorimotor cortex/inferior parietal lobe; SMA=supplementary motor area; Lobules V/VI/VII/VIII=Lobules V/VI/VII/VIII of the cerebellum
Funding
This work was supported by the National Institutes of Health (grant number 1RO1MH101512-04 to A.R.M).
Footnotes
Publisher's Disclaimer: This is a PDF file of an unedited manuscript that has been accepted for publication. As a service to our customers we are providing this early version of the manuscript. The manuscript will undergo copyediting, typesetting, and review of the resulting proof before it is published in its final form. Please note that during the production process errors may be discovered which could affect the content, and all legal disclaimers that apply to the journal pertain.
Declaration of interest: none.
Data Availability
Data that support the findings of this study are openly available under the Research Domain Criteria (RDoC) Initiative at https://nda.nih.gov/edit_collection.html?id=2102.
References
- Andersson JL, Skare S, and Ashburner J (2003). How to correct susceptibility distortions in spin-echo echo-planar images: application to diffusion tensor imaging. Neuroimage 20, 870–888. [DOI] [PubMed] [Google Scholar]
- Attwell D, Buchan AM, Charpak S, Lauritzen M, Macvicar BA, and Newman EA (2010). Glial and neuronal control of brain blood flow. Nature 468, 232–243. [DOI] [PMC free article] [PubMed] [Google Scholar]
- Bastian AJ (2006). Learning to predict the future: the cerebellum adapts feedforward movement control. Curr Opin Neurobiol 16, 645–649. [DOI] [PubMed] [Google Scholar]
- Beck AT, Steer RA, and Brown GK (1996). Manual for the Beck depression inventory-II. San Antonio. [Google Scholar]
- Beck S, Richardson SP, Shamim EA, Dang N, Schubert M, and Hallett M (2008). Short intracortical and surround inhibition are selectively reduced during movement initiation in focal hand dystonia. J Neurosci 28, 10363–10369. [DOI] [PMC free article] [PubMed] [Google Scholar]
- Bestmann S, and Duque J (2016). Transcranial Magnetic Stimulation: Decomposing the Processes Underlying Action Preparation. Neuroscientist 22, 392–405. [DOI] [PubMed] [Google Scholar]
- Boorman L, Kennerley AJ, Johnston D, Jones M, Zheng Y, Redgrave P, and Berwick J (2010). Negative blood oxygen level dependence in the rat: a model for investigating the role of suppression in neurovascular coupling. J Neurosci 30, 4285–4294. [DOI] [PMC free article] [PubMed] [Google Scholar]
- Brass M, Zysset S, and von Cramon DY (2001). The inhibition of imitative response tendencies. Neuroimage 14, 1416–1423. [DOI] [PubMed] [Google Scholar]
- Bueti D, and Walsh V (2009). The parietal cortex and the representation of time, space, number and other magnitudes. Philos Trans R Soc Lond B Biol Sci 364, 1831–1840. [DOI] [PMC free article] [PubMed] [Google Scholar]
- Corballis MC (2009). The evolution and genetics of cerebral asymmetry. Philos Trans R Soc Lond B Biol Sci 364, 867–879. [DOI] [PMC free article] [PubMed] [Google Scholar]
- Cox R, Chen G, Glen DR, Reynolds RC, and Taylor PA (2017). FMRI Clustering in AFNI: False Positive Rates Redux. Brain Connectivity 7, 152–171. [DOI] [PMC free article] [PubMed] [Google Scholar]
- Dankinas D, Melynyte S, Siurkute A, and Dapsys K (2017). Pathological Imitative Behavior and Response Preparation in Schizophrenia. Arch Clin Neuropsychol 32, 533–540. [DOI] [PubMed] [Google Scholar]
- Devor A, Tian P, Nishimura N, Teng IC, Hillman EM, Narayanan SN, Ulbert I, Boas DA, Kleinfeld D, and Dale AM (2007a). Suppressed neuronal activity and concurrent arteriolar vasoconstriction may explain negative blood oxygenation level-dependent signal. J Neurosci 27, 4452–4459. [DOI] [PMC free article] [PubMed] [Google Scholar]
- Devor A, Trevelyan A, and Kleinfeld D (2007b). Is there a common origin to surround-inhibition as seen through electrical activity versus hemodynamic changes? Focus on “Duration-dependent response in SI to vibrotactile stimulation in squirrel monkey”. J Neurophysiol 97, 1880–1882. [DOI] [PubMed] [Google Scholar]
- Duque J, Lew D, Mazzocchio R, Olivier E, and Ivry RB (2010). Evidence for two concurrent inhibitory mechanisms during response preparation. J Neurosci 30, 3793–3802. [DOI] [PMC free article] [PubMed] [Google Scholar]
- Ebisch SJH, Gallese V, Salone A, Martinotti G, di IG, Mantini D, Perrucci MG, Romani GL, Di GM, and Northoff G (2018). Disrupted relationship between “resting state” connectivity and task-evoked activity during social perception in schizophrenia. Schizophr Res 193, 370–376. [DOI] [PubMed] [Google Scholar]
- Fling BW, Kwak Y, Peltier SJ, and Seidler RD (2012). Differential relationships between transcallosal structural and functional connectivity in young and older adults. Neurobiol Aging 33, 2521–2526. [DOI] [PMC free article] [PubMed] [Google Scholar]
- Fornito A, Zalesky A, and Breakspear M (2013). Graph analysis of the human connectome: promise, progress, and pitfalls. Neuroimage 80, 426–444. [DOI] [PubMed] [Google Scholar]
- Ganos C, Ogrzal T, Schnitzler A, and Munchau A (2012). The pathophysiology of echopraxia/echolalia: relevance to Gilles de la Tourette syndrome. Mov Disord 27, 1222–1229. [DOI] [PubMed] [Google Scholar]
- Geschwind N, and Galaburda AM (1985). Cerebral lateralization. Biological mechanisms, associations, and pathology: I. A hypothesis and a program for research. Arch Neurol 42, 428–459. [DOI] [PubMed] [Google Scholar]
- Glover GH (1999). Deconvolution of impulse response in event-related BOLD fMRI. Neuroimage 9, 416–429. [DOI] [PubMed] [Google Scholar]
- Grahn JA, and Brett M (2007). Rhythm and beat perception in motor areas of the brain. J Cogn Neurosci 19, 893–906. [DOI] [PubMed] [Google Scholar]
- Hackney ME, Lee HL, Battisto J, Crosson B, and McGregor KM (2015). Context-Dependent Neural Activation: Internally and Externally Guided Rhythmic Lower Limb Movement in Individuals With and Without Neurodegenerative Disease. Front Neurol 6, 251. [DOI] [PMC free article] [PubMed] [Google Scholar]
- Halbig TD, Mecklinger A, Schriefers H, and Friederici AD (1998). Double dissociation of processing temporal and spatial information in working memory. Cognitive Neuropsychology 36, 305–311. [DOI] [PubMed] [Google Scholar]
- Hamzei F, Dettmers C, Rzanny R, Liepert J, Buchel C, and Weiller C (2002). Reduction of excitability (“inhibition”) in the ipsilateral primary motor cortex is mirrored by fMRI signal decreases. Neuroimage 17, 490–496. [DOI] [PubMed] [Google Scholar]
- Hanlon FM, Shaff NA, Dodd AB, Ling JM, Bustillo JR, Abbott CC, Stromberg SF, Abrams S, Lin DS, and Mayer AR (2016). Hemodynamic response function abnormalities in schizophrenia during a multisensory detection task. Hum Brain Mapp 37, 745–755. [DOI] [PMC free article] [PubMed] [Google Scholar]
- Hayashi MJ, Saito DN, Aramaki Y, Asai T, Fujibayashi Y, and Sadato N (2008). Hemispheric asymmetry of frequency-dependent suppression in the ipsilateral primary motor cortex during finger movement: a functional magnetic resonance imaging study. Cereb Cortex 18, 2932–2940. [DOI] [PMC free article] [PubMed] [Google Scholar]
- Hodgson JC, and Hudson JM (2018). Speech lateralization and motor control. Prog Brain Res 238, 145–178. [DOI] [PubMed] [Google Scholar]
- Hogeveen J, Obhi SS, Banissy MJ, Santiesteban I, Press C, Catmur C, and Bird G (2015). Task-dependent and distinct roles of the temporoparietal junction and inferior frontal cortex in the control of imitation. Soc Cogn Affect Neurosci 10, 1003–1009. [DOI] [PMC free article] [PubMed] [Google Scholar]
- Jiang T, He Y, Zang Y, and Weng X (2004). Modulation of functional connectivity during the resting state and the motor task. Hum Brain Mapp 22, 63–71. [DOI] [PMC free article] [PubMed] [Google Scholar]
- Kroeger J, Baumer T, Jonas M, Rothwell JC, Siebner HR, and Munchau A (2010). Charting the excitability of premotor to motor connections while withholding or initiating a selected movement. Eur J Neurosci 32, 1771–1779. [DOI] [PubMed] [Google Scholar]
- Lee HH, and Hsieh S (2017). Resting-State fMRI Associated with Stop-Signal Task Performance in Healthy Middle-Aged and Elderly People. Front Psychol 8, 766. [DOI] [PMC free article] [PubMed] [Google Scholar]
- Li JY, Lai PH, and Chen R (2013). Transcallosal inhibition in patients with callosal infarction. J Neurophysiol 109, 659–665. [DOI] [PubMed] [Google Scholar]
- Liu TT, Nalci A, and Falahpour M (2017). The global signal in fMRI: Nuisance or Information? Neuroimage 150, 213–229. [DOI] [PMC free article] [PubMed] [Google Scholar]
- Logothetis NK (2008). What we can do and what we cannot do with fMRI. Nature 453, 869–878. [DOI] [PubMed] [Google Scholar]
- Mayer AR, Franco AR, Canive J, and Harrington DL (2009). The effects of stimulus modality and frequency of stimulus presentation on cross-modal distraction. Cereb Cortex 19, 993–1007. [DOI] [PubMed] [Google Scholar]
- Mayer AR, Hanlon FM, Dodd AB, Yeo RA, Haaland KY, Ling JM, and Ryman SG (2016). Proactive response inhibition abnormalities in the sensorimotor cortex of patients with schizophrenia. J Psychiatry Neurosci 41, 312–321. [DOI] [PMC free article] [PubMed] [Google Scholar]
- Mayer AR, Ruhl D, Merideth F, Ling J, Hanlon FM, Bustillo J, and Canive J (2013). Functional imaging of the hemodynamic sensory gating response in schizophrenia. Hum Brain Mapp 34, 2302–2312. [DOI] [PMC free article] [PubMed] [Google Scholar]
- Mayer AR, Teshiba TM, Franco AR, Ling J, Shane MS, Stephen JM, and Jung RE (2011). Modeling conflict and error in the medial frontal cortex. Hum Brain Mapp 33, 2843–2855. [DOI] [PMC free article] [PubMed] [Google Scholar]
- Mennes M, Kelly C, Zuo XN, Di MA, Biswal BB, Castellanos FX, and Milham MP (2010). Inter-individual differences in resting-state functional connectivity predict task-induced BOLD activity. Neuroimage 50, 1690–1701. [DOI] [PMC free article] [PubMed] [Google Scholar]
- Mennes M, Vega PN, Kelly C, Di MA, Castellanos FX, and Milham MP (2011). Resting state functional connectivity correlates of inhibitory control in children with attention-deficit/hyperactivity disorder. Front Psychiatry 2, 83. [DOI] [PMC free article] [PubMed] [Google Scholar]
- Merchant H, and Averbeck BB (2017). The Computational and Neural Basis of Rhythmic Timing in Medial Premotor Cortex. J Neurosci 37, 4552–4564. [DOI] [PMC free article] [PubMed] [Google Scholar]
- Murphy K, and Fox MD (2017). Towards a consensus regarding global signal regression for resting state functional connectivity MRI. Neuroimage 154, 169–173. [DOI] [PMC free article] [PubMed] [Google Scholar]
- Mutha PK, Haaland KY, and Sainburg RL (2012). The effects of brain lateralization on motor control and adaptation. J Mot Behav 44, 455–469. [DOI] [PMC free article] [PubMed] [Google Scholar]
- Netz J, Ziemann U, and Homberg V (1995). Hemispheric asymmetry of transcallosal inhibition in man. Exp Brain Res 104, 527–533. [DOI] [PubMed] [Google Scholar]
- Newton JM, Sunderland A, and Gowland PA (2005). fMRI signal decreases in ipsilateral primary motor cortex during unilateral hand movements are related to duration and side of movement. Neuroimage 24, 1080–1087. [DOI] [PubMed] [Google Scholar]
- Niendam TA, Laird AR, Ray KL, Dean YM, Glahn DC, and Carter CS (2012). Meta-analytic evidence for a superordinate cognitive control network subserving diverse executive functions. Cognitive, Affective, & Behavioral Neuroscience 12, 241–268. [DOI] [PMC free article] [PubMed] [Google Scholar]
- Nirkko AC, Ozdoba C, Redmond SM, Burki M, Schroth G, Hess CW, and Wiesendanger M (2001). Different ipsilateral representations for distal and proximal movements in the sensorimotor cortex: activation and deactivation patterns. Neuroimage 13, 825–835. [DOI] [PubMed] [Google Scholar]
- Northoff G, Walter M, Schulte RF, Beck J, Dydak U, Henning A, Boeker H, Grimm S, and Boesiger P (2007). GABA concentrations in the human anterior cingulate cortex predict negative BOLD responses in fMRI. Nat Neurosci 10, 1515–1517. [DOI] [PubMed] [Google Scholar]
- Oldfield RC (1971). The assessment and analysis of handedness: the Edinburgh inventory. Cognitive Neuropsychology 9, 97–113. [DOI] [PubMed] [Google Scholar]
- Oleksiak A, Postma A, van, d.H. I, Klink PC, and van Wezel RJ (2011). A review of lateralization of spatial functioning in nonhuman primates. Brain Res Rev 67, 56–72. [DOI] [PubMed] [Google Scholar]
- Parker JO, Voets NL, Adcock JE, Stacey R, and Jbabdi S (2017). Resting connectivity predicts task activation in pre-surgical populations. Neuroimage Clin 13, 378–385. [DOI] [PMC free article] [PubMed] [Google Scholar]
- Repp BH, and Penel A (2002). Auditory dominance in temporal processing: new evidence from synchronization with simultaneous visual and auditory sequences. J Exp Psychol Hum Percept Perform 28, 1085–1099. [PubMed] [Google Scholar]
- Repp BH, and Su YH (2013). Sensorimotor synchronization: a review of recent research (2006–2012). Psychon Bull Rev 20, 403–452. [DOI] [PubMed] [Google Scholar]
- Rubinov M, and Sporns O (2011). Weight-conserving characterization of complex functional brain networks. Neuroimage 56, 2068–2079. [DOI] [PubMed] [Google Scholar]
- Schmidt SL, Oliveira RM, Krahe TE, and Filgueiras CC (2000). The effects of hand preference and gender on finger tapping performance asymmetry by the use of an infra-red light measurement device. Cognitive Neuropsychology 38, 529–534. [DOI] [PubMed] [Google Scholar]
- Schwarz AJ, and McGonigle J (2011). Negative edges and soft thresholding in complex network analysis of resting state functional connectivity data. Neuroimage 55, 1132–1146. [DOI] [PubMed] [Google Scholar]
- Serrien DJ, Ivry RB, and Swinnen SP (2006). Dynamics of hemispheric specialization and integration in the context of motor control. Nat Rev Neurosci 7, 160–166. [DOI] [PubMed] [Google Scholar]
- Shmuel A, Augath M, Oeltermann A, and Logothetis NK (2006). Negative functional MRI response correlates with decreases in neuronal activity in monkey visual area V1. Nat Neurosci 9, 569–577. [DOI] [PubMed] [Google Scholar]
- Shmuel A, Yacoub E, Pfeuffer J, Van de Moortele PF, Adriany G, Hu X, and Ugurbil K (2002). Sustained negative BOLD, blood flow and oxygen consumption response and its coupling to the positive response in the human brain. Neuron 36, 1195–1210. [DOI] [PubMed] [Google Scholar]
- Smith SM, Jenkinson M, Woolrich MW, Beckmann CF, Behrens TE, Johansen-Berg H, Bannister PR, De LM, Drobnjak I, Flitney DE, Niazy RK, Saunders J, Vickers J, Zhang Y, De SN, Brady JM, and Matthews PM (2004). Advances in functional and structural MR image analysis and implementation as FSL. Neuroimage 23 Suppl 1, S208–S219. [DOI] [PubMed] [Google Scholar]
- Smitha KA, Arun KM, Rajesh PG, Thomas B, and Kesavadas C (2017). Resting-State Seed-Based Analysis: An Alternative to Task-Based Language fMRI and Its Laterality Index. AJNR Am J Neuroradiol 38, 1187–1192. [DOI] [PMC free article] [PubMed] [Google Scholar]
- Spengler S, Bird G, and Brass M (2010). Hyperimitation of actions is related to reduced understanding of others’ minds in autism spectrum conditions. Biol Psychiatry 68, 1148–1155. [DOI] [PubMed] [Google Scholar]
- Stefanovic B, Warnking JM, and Pike GB (2004). Hemodynamic and metabolic responses to neuronal inhibition. Neuroimage 22, 771–778. [DOI] [PubMed] [Google Scholar]
- Swick D, Ashley V, and Turken U (2011). Are the neural correlates of stopping and not going identical? Quantitative meta-analysis of two response inhibition tasks. Neuroimage 56, 1655–1665. [DOI] [PubMed] [Google Scholar]
- Todor JI, and Kyprie PM (1980). Hand differences in the rate and variability of rapid tapping. J Mot Behav 12, 57–62. [DOI] [PubMed] [Google Scholar]
- Toga AW, and Thompson PM (2003). Mapping brain asymmetry. Nat Rev Neurosci 4, 37–48. [DOI] [PubMed] [Google Scholar]
- Tzourio-Mazoyer N, Petit L, Zago L, Crivello F, Vinuesa N, Joliot M, Jobard G, Mellet E, and Mazoyer B (2015). Between-hand difference in ipsilateral deactivation is associated with hand lateralization: fMRI mapping of 284 volunteers balanced for handedness. Front Hum Neurosci 9, 5. [DOI] [PMC free article] [PubMed] [Google Scholar]
- Welniarz Q, Gallea C, Lamy JC, Meneret A, Popa T, Valabregue R, Beranger B, Brochard V, Flamand-Roze C, Trouillard O, Bonnet C, Bruggemann N, Bitoun P, Degos B, Hubsch C, Hainque E, Golmard JL, Vidailhet M, Lehericy S, Dusart I, Meunier S, and Roze E (2019). The supplementary motor area modulates interhemispheric interactions during movement preparation. Hum Brain Mapp 40, 2125–2142. [DOI] [PMC free article] [PubMed] [Google Scholar]