

Abstract
The COVID‐19 pandemic caused by SARS‐CoV‐2 has is a global health challenge. Angiotensin‐converting enzyme 2 (ACE2) is the host receptor for SARS‐CoV‐2 entry. Recent studies have suggested that patients with hypertension and diabetes treated with ACE inhibitors (ACEIs) or angiotensin receptor blockers have a higher risk of COVID‐19 infection as these drugs could upregulate ACE2, motivating the study of ACE2 modulation by drugs in current clinical use. Here, we mined published datasets to determine the effects of hundreds of clinically approved drugs on ACE2 expression. We find that ACEIs are enriched for ACE2‐upregulating drugs, while antineoplastic agents are enriched for ACE2‐downregulating drugs. Vorinostat and isotretinoin are the top ACE2 up/downregulators, respectively, in cell lines. Dexamethasone, a corticosteroid used in treating severe acute respiratory syndrome and COVID‐19, significantly upregulates ACE2 both in vitro and in vivo. Further top ACE2 regulators in vivo or in primary cells include erlotinib and bleomycin in the lung and vancomycin, cisplatin, and probenecid in the kidney. Our study provides leads for future work studying ACE2 expression modulators.
Keywords: angiotensin I‐converting enzyme 2, coronavirus disease 2019, dexamethasone, drug‐modifying ACE2 expression, severe acute respiratory syndrome coronavirus 2
Subject Categories: Microbiology, Virology & Host Pathogen Interaction; Chemical Biology
Analyzing large‐scale in vitro and in vivo publicly available transcriptomic data of drug treatments, we identify the effects of hundreds of clinically approved drugs on expression of ACE2, the host receptor of SARS‐CoV‐2.

Introduction
The ongoing pandemic of coronavirus disease 2019 (COVID‐19), caused by the severe acute respiratory syndrome coronavirus 2 (SARS‐CoV‐2) virus, has plagued so far over 200 countries and has resulted in over 11 million cases and 500,000 deaths since the start of 2020. A key cellular receptor for SARS‐CoV‐2 entry in humans is angiotensin‐converting enzyme 2 (encoded by the gene ACE2) (Brielle et al, 2020). A recent publication by Fang et al (2020) suggested that patients with hypertension (HT) and diabetes mellitus may be at higher risk of having severe COVID‐19 disease, as these patients have been reported to express ACE2 at an increased level. One mechanism is that HT patients are often treated with ACE inhibitors (ACEIs) or angiotensin II type‐I receptor blockers (ARBs), which have been previously suggested to increase ACE2 expression (Ferrario et al, 2005; Liang et al, 2015; Vuille‐dit‐Bille et al, 2015; Li et al, 2017). In contrast to the hypothesis that ACEis or ARBs could be deleterious, an early clinical study of hospitalized COVID‐19 patients showed significantly lower mortality among patients taking ACEis or ARBs (Zhang et al, 2020).
ACEIs and ARBs are widely used antihypertensive drugs acting on the renin–angiotensin system, a hormone system comprising different variants of angiotensin peptides with important roles in regulating vascular and kidney functions (Dimou et al, 2019). ACEIs inhibit the ACE gene (but not the ACE2 gene) whose encoded protein, ACE, converts angiotensin I to angiotensin II. ARBs suppress the blood pressure‐increasing effect of angiotensin II by blocking its binding to its receptor (Dimou et al, 2019). Distinct from ACE, ACE2 is responsible for the conversion of angiotensin I and angiotensin II into other forms including angiotensin‐(1–9) and angiotensin‐(1–7), which counteracts the effect of angiotensin II and may paradoxically have protective effects on the lung and on the cardiovascular system (Jiang et al, 2014; Paz Ocaranza et al, 2020). The possibility that ACE2 expression may affect either susceptibility to SARS‐CoV‐2 infection or severity of disease after infection has raised the need to investigate the effects of a variety of prescribed drugs on the modulation of ACE2 expression.
Addressing this challenge, we aimed to identify drugs whose treatment can alter ACE2 expression and, assuming that the latter is an important determinant, possibly increase or decrease the infection risk of COVID‐19. To this end, we analyzed the Connectivity Map (CMAP) dataset that provides transcriptomic data of a collection of cell lines treated with approximately 20,000 small molecules (Subramanian et al, 2017). Utilizing this resource, we mined the ACE2 expression fold change (logFC) after each drug treatment, to identify clinically approved drugs that result in strong upregulation or downregulation of ACE2 expression in this data. We additionally mined the Gene Expression Omnibus (GEO) and the Gene Tissue Expression Consortium resource (GTEx) datasets aiming to identify which of the emerging in vitro findings may have further in vivo support.
Results
We first focused on antihypertensive (anti‐HT) drug treatment data from the CMAP dataset to study the suggestion of Fang et al (2020) that certain anti‐HT drugs may affect ACE2 expression. Among the available cell types from CMAP, we focused on carcinoma cell lines, since they are of epithelial origin and may bear more resemblance to airway epithelium, a major site of viral entry. We identified 48 clinically approved anti‐HT drugs that were tested on the same four carcinoma cell lines for up to 24 h in CMAP and computed the ACE2 expression changes after their treatment averaged across the cell lines (Materials and Methods; the cell lines are A549, MCF7, PC3, and VCAP, selected because of the data available for a high number of drugs tested on all these cells, see Appendix Note S1, Appendix Fig S1 and Table EV1A for details).
Individually, no widely prescribed anti‐HT drug was found to increase ACE2 expression significantly in these experiments, but methyldopa (an alpha‐2 adrenergic receptor agonist) and molsidomine (a vasodilator) do significantly decrease ACE2 expression (Fig 11A, logFC = −0.605 and −0.290, P = 0.002 and 0.005, respectively; adjusted P = 0.11 for both; Table EV1B). When the individual drug results are aggregated to identify the effects of major classes of anti‐HT drugs, we find that ACEIs, but not ARBs, tend to upregulate ACE2 expression (Fig 11B, Gene set enrichment analysis (GSEA) method P = 0.026, adjusted P < 0.1; Table EV1C). Anti‐adrenergics other than alpha/beta‐blockers tend to downregulate ACE2 (Fig 11B, GSEA P = 0.032, adjusted P < 0.1; Table EV1C). Notably, we find that calcium channel blockers (CCBs) do not significantly change ACE2 expression, consistent with the fact that they do not act on the renin–angiotensin system. This finding provides preliminary in vitro support for the suggestion of Fang et al (2020) that CCBs may be considered as an alternative to ACEIs and is further supported by results from a large study cohort where hypertensive patients treated with CCBs (amlodipine and nifedipine) had no increase in urinary ACE2 levels compared with untreated controls (Furuhashi et al, 2015). A similar analysis for the 13 approved antidiabetic drugs in the CMAP dataset that were tested on the same four carcinoma cell lines did not identify any individual or class of drugs that significantly altered ACE2 expression, partly due to the small number of drugs in this class (Table EV1D and E).
Figure 1. The landscape of ACE2 expression levels alterations in response to drug treatments across cell lines in CMAP (Subramanian et al, 2017).

-
A–FDifferential expression analysis for ACE2 expression changes in treated vs control samples was performed with the level 3 CMAP data of 24‐h response values using limma (Ritchie et al, 2015; Materials and Methods). Volcano plots showing the log fold change (x‐axis) and uncorrected negative log10 P value (y‐axis) of ACE2 expression changes are given for (A) 48 antihypertensive drugs and (C) 672 clinically approved drugs that are each tested on four carcinoma cell lines from CMAP (Subramanian et al, 2017). The ACE2 expression levels in control and drug‐treated groups for the top significant drugs (vorinostat, panobinostat, and isotretinoin) among the 672 clinically approved drugs are shown with box plots in (D), the ACE2 expression log fold change values and adjusted P values from limma, and the number of samples per group are labeled for each drug. In the box plot of panel (D), the center line, box edges, and whiskers denote the median, interquartile range, and the rest of the distribution in respective order, except for points that were determined to be outliers using a method that is a function of the interquartile range, as in standard box plots. The enrichment of positive/negative ACE2 expression regulators in different drug classes based on their mechanism of action (MOA) was tested with the GSEA method as implemented in the R package fgsea (preprint: Korotkevich et al, 2019; Materials and Methods), and the enrichment significance (negative log10 P values) is shown in bar plots in (B) and (E), for the analysis on the 48 antihypertensive drugs and the 672 clinically approved drugs, respectively. We further extended the analysis to a larger set of 989 clinically approved drugs tested on a total of 28 cell lines (16 cancer and 12 normal cells; this list is provided in Table EV2A with details including primary site, subtype and donor demographics) where each drug may have been tested on a different subset of cells (Materials and Methods) and performed enrichment analysis using the WHO ATC drug classification data (World Health Organization, 2006), and top enriched drug classes are shown in (F). The horizontal and the vertical dashed lines denote a P value of 0.05. Drug indication and ATC classification annotations are obtained from the DrugBank database (Wishart et al, 2018). All P values are computed from differential expression analysis using limma (Ritchie et al, 2015) (Materials and Methods). ACEIs, angiotensin‐converting enzyme inhibitors; ARBs, angiotensin II type‐I receptor blockers; CCBs, calcium channel blockers; ERAs, endothelin receptor antagonists; TKR, tyrosine kinase receptor.
We then turned to analyze a broad set of 672 clinically approved drugs, each of which was tested on the same four carcinoma cell lines as described above in the CMAP dataset, to identify the top drugs that upregulate or downregulate ACE2 expression (full results in Table EV1F). The top upregulators are vorinostat and panobinostat, both of which are anticancer histone deacetylase (HDAC) inhibitors (Fig 11C and D, logFC = 0.321 and 0.457, adjusted P = 2.77e−18 and 7.70e−3, respectively). They have previously been shown to have antifibrotic effects and can reduce the risk of acute respiratory deterioration (Lyu et al, 2019; Maher & Strek, 2019). The top ACE2 downregulator is isotretinoin, a vitamin A derivative with suspected respiratory side effects (Gorpelioglu et al, 2010) (Fig 11C and D, logFC = −0.478, adjusted P = 0.036). Notably, we identified six clinically approved drugs in CMAP that are currently being investigated in clinical trials (www.clinicaltrials.gov) for COVID‐19 (chloroquine, thalidomide, methylprednisolone, losartan, lopinavir, and ritonavir), none of which was found to alter ACE2 expression significantly (P > 0.1, Table EV1F).
Analyzing the expression results of these 672 drugs in an aggregated manner, we performed a GSEA based on the drug‐induced ACE2 expression fold changes and identified several classes of drugs based on mechanism of action (MOA) that are significantly enriched for up or downregulation of ACE2 expression, using the MOA annotation from the Drug Repurposing Hub (Corsello et al, 2017) (Fig 11E; Materials and Methods; full result in Table EV1G). Top classes of ACE2‐upregulating drugs are HDAC inhibitors (GSEA P = 0.003, adjusted P = 0.02) and dopamine receptor antagonists (GSEA P = 0.007, adjusted P = 0.02). We further extended this analysis to 989 clinically approved drugs tested on a total of 28 CMAP cell lines. The 28 cell lines include 16 cancer and 12 normal cells (this list is provided in Table EV2A with details including primary site, subtype, and donor demographics), where each drug may have been tested on a different subset of cells (Materials and Methods). We examined the enrichment of ACE2‐modulating drugs in the different WHO Anatomical Therapeutic Chemical (ATC) indication categories (World Health Organization, 2006) (Fig 11F; Materials and Methods; full results in Table EV2C, based on ACE differential expression result in Table EV2B). We find that the class of drugs targeting the renin–angiotensin system is enriched for upregulators of ACE2 (GSEA P = 0.044), while antineoplastic agents, and in particular protein kinase inhibitors, are enriched for downregulators of ACE2 expression (GSEA P = 0.004), although these classes do not achieve significance after FDR correction (Table EV2C). Specific protein kinase inhibitors were also previously shown to inhibit MERS‐CoV and SARS‐CoV in vitro (Dyall et al, 2014).
The analyses described above were performed by aggregating the drug‐induced expression changes across cell types (Materials and Methods). We next analyzed CMAP data of additional relevant cell types separately by their tissue of origin to investigate potential tissue‐specific effects. We focused on the lung, kidney, liver, central nervous system (CNS), and intestine (Materials and Methods), which represent tissues that can be affected by SARS‐CoV‐2 (Zaim et al, 2020). For each of these tissues, we were only able to find one (or two, for lung) cell type where a reasonable number (> 100) of clinically approved drugs have been tested at the 24‐h time point (details in Table EV2D). The cells identified from kidney, liver, and CNS were non‐cancerous or primary cells (HA1E, PHH, and NPC cells, respectively), which could be more relevant for our investigation than the cancer cell lines from CMAP. As expected, the drug‐induced ACE2 expression changes exhibit mostly weak correlations across cells from different tissue types, with Spearman's correlation coefficients between the log fold changes of pairs of cells ranging from −0.07 to 0.2 (Fig EV1A; Table EV2E). Nevertheless, we observed a consistent but insignificant trend that ACEIs tend to upregulate ACE2 expression across the three normal cell types from kidney, liver, and CNS (Fig EV1B). Concordant with the findings above from the four carcinoma cell lines in CMAP, antineoplastic agents as a group were found to be enriched for drugs downregulating ACE2 in the normal NPC cells from CNS (GSEA adjusted P = 0.01, Fig EV1C, Table EV2F).
Figure EV1. Comparison of drug‐induced ACE2 differential expression profiles and enrichments of drug classes in ACE2 modulators in lung, kidney, liver, central nervous system (CNS), and gastrointestinal tract (GI) cells.

- ACE2 differential expression after drug treatment was analyzed for clinically approved drugs separately in cells from each of the tissues of origin (listed above) in CMAP, as described in the main text. The matrix of Spearman's correlation coefficients for the drug‐induced ACE2 expression fold changes across common drugs between each pair of tissue types are visualized in a heatmap. Spearman's Rho values are labeled in each cell of the heatmap.
- A heatmap visualizing the GSEA normalized enrichment score for the enrichment of each sub‐category of antihypertensive drugs in the positive/negative regulators of ACE2 expression, separately in each tissue type. Positive enrichment score (red) means that the drug class is enriched for drugs upregulating ACE2 expression, vice versa (colored in blue). Missing result is colored gray (for ARBs in GI, since no ARBs are tested in the GI cell line used in the analysis). CCBs, calcium channel blockers; ARBs, angiotensin II type‐I receptor blockers; ACEIs, angiotensin‐converting enzyme inhibitors.
- Enrichment of each drug class is based on the WHO ATC drug indication in the positive/negative regulators of ACE2 expression, separately in each tissue type. Top five drug classes (x‐axis) ranked by significance are visualized for each tissue type (separated into the different panels). The y‐axis represents the normalized enrichment score as explained above, the dots are colored by level of significance computed with the GSEA method as implemented in the R package fgsea (preprint: Korotkevich et al, 2019), and the size of the dots represent the size of the drug class (larger dots correspond to larger drug classes).
Additionally, we also analyzed CMAP drug treatment data beyond the 24‐h time point used above. We identified 14 clinically approved drugs with such data available, which were tested on either the 293T or VCAP cell lines for 48 h (details and results in Table EV2G). In these data, vemurafenib, fluphenazine, and afatinib were found to significantly upregulate ACE2 expression (adjusted P < 0.1), and imatinib significantly downregulated ACE2 (adjusted P = 0.001). Treatment data at the 6‐ and 24‐h time points in the same cell line were available for vemurafenib and fluphenazine; for both drugs, we observed a trend of time‐dependent increase in the level of ACE2 upregulation (Fig EV2), suggesting that these drugs may modulate ACE2 expression during prolonged treatment.
Figure EV2. Time‐dependent ACE2 expression changes induced by fluphenazine and vemurafenib from the CMAP dataset.
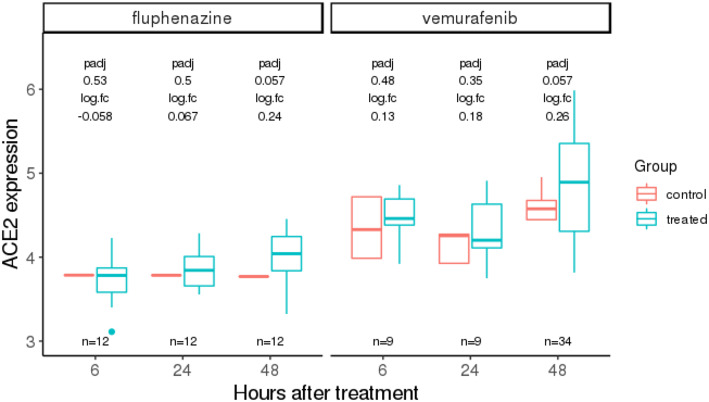
Fluphenazine and vemurafenib represent the drugs that significantly modulate ACE2 expression at the 48‐h time point, and for which data are also available at 6‐ and 24‐h time points. The adjusted P values (padj) computed using limma (Ritchie et al, 2015) and log fold changes (logFC) in treated vs control ACE2 expressions are labeled above the box plots. We observe a time‐dependent increase in the extent of ACE2 upregulation in treated vs control for both of these drugs. The three x‐axis values (6, 24, and 48) are placed equidistant not on a linear scale. Here, the center line, box edges, and whiskers in the box plots denote the median, interquartile range, and the rest of the distribution in respective order, except for points that were determined to be outliers using a method that is a function of the interquartile range, as in standard box plots.
To extend our analysis beyond the CMAP dataset, we mined the GEO database for gene expression data of drug treatments with matched controls in lung and kidney tissue or cells (Materials and Methods). We collected a total of 74 relevant lung datasets involving 42 unique clinically approved drugs, among which 27 datasets (covering 21 drugs) were composed of non‐cancerous samples including primary bronchial epithelial cells and in vivo samples from human and rodents (Table EV3A). Similarly, for kidney, 35 datasets for 29 drugs (including 23 drugs in 28 non‐cancer datasets involving in vivo samples) were identified (Table EV3B). The drug‐induced ACE2 differential expression results (Materials and Methods) for the lung and kidney datasets are summarized in Fig 22A and C, respectively. The top significant drugs identified from the more relevant non‐cancer datasets are visualized in Fig 22B and D. For lung, the most significant drug is dexamethasone, which upregulates ACE2 in datasets of both normal and Pneumocystis‐infected mice lung tissue (logFC = 0.97 and 0.36, adjusted P = 0.001 and 0.027, respectively, Fig 22B). Dexamethasone also increased ACE2 expression in our analysis of four carcinoma cell lines from the CMAP dataset (logFC = 0.18, P = 0.006, Table EV1F). Notwithstanding, one should note that recent studies have reported that dexamethasone treatment of hospitalized COVID‐19 patients has beneficial effects, but this might be due to its immune‐modulatory actions (preprint: Horby et al, 2020). Another top identified drug is the epidermal growth factor receptor (EGFR) inhibitor erlotinib, which is found to upregulate ACE2 in a dataset of human primary bronchial epithelial cells (logFC = 1.04, adjusted P = 2.95E‐5, Fig 22B), a relevant cell type suggested to interact with the SARS‐CoV‐2 virus (Mason, 2020). In the CMAP analysis, we observed a non‐significant trend of ACE2 upregulation at 24 h by erlotinib (logFC = 0.05, adjusted P > 0.1, Table EV1F). Interestingly, erlotinib has been reported to inhibit the endocytosis and intracellular trafficking of multiple viruses including hepatitis C, dengue, and Ebola, exerting broad‐spectrum antiviral effects (Bekerman et al, 2017). The chemotherapeutic drug bleomycin is a significant ACE2 downregulator identified in a dataset of rat lung tissue (logFC = −0.17, adjusted P = 0.003, Fig 22B), in accordance with an earlier report that bleomycin decreases ACE2 protein level in alveolar epithelial cells (Uhal & Abdul‐Hafez, 2010).
Figure 2. Drug‐induced ACE2 differential expression in lung and kidney‐derived cells or tissue types from the GEO database.

-
A–DThis fig summarizes the differential expression analysis results for ACE2 upon treatment by clinically approved drugs in samples of lung and kidney datasets mined from the GEO database, spanning both cancer and non‐cancer datasets (Materials and Methods). Volcano plots showing the log fold change (x‐axis) and uncorrected negative log10 P value (y‐axis) of ACE2 expression changes are displayed in (A) for 74 datasets of cells or tissue samples from lung, involving 42 clinically approved drugs, and in (C) for 35 kidney datasets involving 29 clinically approved drugs. Among these, we focused on the top significant drugs that modulate ACE2 expression in non‐cancerous cells or tissue samples from lung and kidney, which are shown in (B) and (D), respectively, where the ACE2 expression (y‐axis) difference between control and treated groups (x‐axis) are shown with box plots. In the title of each box plot, the GEO identifier of the respective studies and the corresponding drug name and the sample type are provided. Different datasets involving experiments using the same drug were analyzed and presented separately, since the sample types can be different across datasets. All the P values are computed from differential expression analysis using limma (Ritchie et al, 2015) (Materials and Methods). In the box plots of panels (B) and (D), the center line, box edges, and whiskers denote the median, interquartile range, and the rest of the distribution in the respective order, except for points that were determined to be outliers using a method that is a function of the interquartile range, as in standard box plots. HBEC, human primary bronchial epithelial cells.
Among the most significant candidates in the kidney cell analysis (summarized in Fig 22C), we again focused on non‐cancer datasets and observed that the chemotherapy drug cisplatin upregulated ACE2 in mice kidney samples, while it downregulated ACE2 in the renal cortex of rat (logFC = 0.29 and −1.16, adjusted P = 8.06E−3 and 2.36E−5, respectively, Fig 22D), suggesting a cell type and possibly species‐specific effect. Vancomycin, another top identified drug, is a glycopeptide antibiotic that increases ACE2 expression in mice kidney samples from two independent datasets (logFC = 0.89 and 0.93, adjusted P = 0.04 for both). Glycopeptide antibiotics and its derivatives have been previously shown to block MERS and SARS cell entry (Zhou et al, 2016). Probenecid, a drug for treating gout, was found to decrease ACE2 expression in a renal cortical cell line (logFC = −0.61, adjusted P = 0.001, Fig 22D); this drug has been proposed to be repurposed for anti‐influenza therapy (Perwitasari et al, 2013). Other significant drugs arising from the analysis of cancer datasets of lung and kidney from GEO are shown in Fig EV3 with additional information in Appendix Note S2.
Figure EV3. Significant drug hits with differential ACE2 expression in control vs treated searching across GEO lung datasets.

Providing the subset of top significant drugs hits from differential analysis of ACE2 in control vs treated samples from cancer cells with lung tissue of origin, where ACE2 expression is provided (y‐axis) in control and treated samples. GEO ID of the respective studies are provided. HBEC, human bronchial epithelial cells. GEO ID of the respective studies are provided. All the P values are computed from differential expression analysis using limma (Ritchie et al, 2015) (Materials and Methods). Here, the center line, box edges, and whiskers in the box plots denote the median, interquartile range, and the rest of the distribution in the respective order, except for points that were determined to be outliers using a method that is a function of the interquartile range, as in standard box plots.
Finally, we mined gene expression in normal human lung tissue from the GTEx dataset to extend our in vitro findings (Lonsdale et al, 2013). To this end, we identified genes whose expression is positively or negatively associated with ACE2 expression, and then examined whether targets of certain classes of drugs are enriched among those genes. This analysis is based on the notion that the effect of drug treatment, which usually acts on the protein level, is functionally similar to the effect of downregulating the drug target expression on the mRNA level. Consistent with our earlier findings in CMAP, we find that the targets of ACEIs are enriched for genes negatively associated with ACE2 expression in normal human lung tissue (Fisher's test adjusted P = 8.58E−4, Materials and Methods), while the targets of antineoplastic drugs are enriched for genes positively correlated with ACE2 expression (adjusted P = 2.24E−4). Additionally, the latter association for antineoplastic drug targets is also observed in a single‐cell RNA‐seq dataset of normal lung tissue (adjusted P = 7E−3) (Vieira Braga et al, 2019).
Discussion
To date, solid evidence concerning whether ACE2 expression can alter the risk of COVID‐19 infection is lacking. The role of ACEIs/ARBs in modulating the clinical course of viral pneumonia and COVID‐19 infection is also under debate (Diaz, 2020; Esler & Esler, 2020; Gurwitz, 2020; Zhang et al, 2020; Zheng et al, 2020). If ACE2 expression does influence either susceptibility or disease course, it is important to chart the landscape of how commonly used therapeutic drugs affect ACE2 expression. Addressing this challenge, we performed a systematic in vitro analysis of the CMAP cell line data that shows that ACEIs, although not most other antihypertensives, are enriched for upregulators of ACE2 expression (Fig 11B). Extending the scope of our analyses, we identified additional clinically approved drugs and drug categories that affect ACE2 expression in vitro (Fig 11C–E). Analyzing the additional but limited amount of CMAP data for cells from different tissue types and for drug treatment for longer durations up to 48 h, we find that the drug‐induced ACE2 changes can be tissue‐specific and time‐dependent (Figs EV1 and EV2), and for some drugs, their effect on ACE2 can become stronger upon prolonged treatment (Fig EV2). We successfully corroborated some of the drugs’ effects identified in CMAP, mining in vitro and in vivo gene expression data of the lung and kidney from the GEO database. The analysis of GEO data from primary or immortalized cells also resulted in additional candidate ACE2 regulators, including a corticosteroid (dexamethasone), antineoplastic drugs (erlotinib, bleomycin and cisplatin tested in non‐cancerous samples), an antibiotic (vancomycin), and an uricosuric agent (probenecid) to be further investigated in experimental studies assessing their effects on ACE2 expression, which may be relevant to SARS‐CoV‐2 infection and pathogenesis.
Materials and Methods
The CMAP data
The level 3 data of the Connectivity Map (CMAP) dataset (Subramanian et al, 2017) were downloaded from the GEO database (GSE92742 and GSE70138). We used the DrugBank database (Wishart et al, 2018) to identify all drugs that are clinically approved in the United States, Canada, or the EU and then matched the drugs to the compounds in CMAP by drug generic names. Starting from this subset of CMAP data for only the clinically approved drugs, we first aimed to choose a reasonably large set of drugs such that each of the drugs in the set were tested on the same set of cell types (also at the same concentration and duration of treatment) for consistency. Due to incomplete data in CMAP, there exists a trade‐off between the number of cell types and the number of drugs to include (Appendix Note S1 and Fig S1). Balancing this trade‐off, we selected a set of 672 clinically approved drugs, each of which had been tested on the same four carcinoma cell lines (A549, MCF7, PC3, and VCAP, Table EV1; the epithelium‐derived carcinoma cell may also better resemble the airway epithelial cells relevant for COVID‐19 as explained in the main text) for 24 h at a concentration of 10 μM. The chosen time point and concentration represent the most frequent treatment condition present in the dataset. This subset of 672 approved drugs includes 48 antihypertensive and 13 antidiabetic drugs, which we used for the first part of our analysis. In the later parts of our analyses, (i) trading biological homogeneity for higher coverage, we included drugs that each can be tested on a different number and types of cells, resulting in 989 clinically approved drugs tested on a total of 28 cell types, which we used for the analysis of enrichment of drug classes by WHO ATC indications; (ii) we filtered CMAP data separately for each tissue type that can be affected by COVID‐19, including lung, kidney, liver, central nervous system, and intestine; for each of these tissues, only one (two for lung) cell type was found with data for treatment by > 100 approved drugs (details in Table EV1), and we used these data subsets for the analysis of tissue type‐specific ACE2 response to drugs; (iii) we selected CMAP data with drug treatment for 48 h, resulting in 14 approved drugs each tested on either 293T or VCAP cell line, and we used this subset of data to investigate the time dependency of drug‐induced ACE2 changes.
Identification of ACE2 modulators from the CMAP dataset
Using each of the subsets of CMAP data as described above, we selected the expression data of only the “landmark” and “BING” (best‐inferred) genes for the population controls and the drug‐treated samples. The landmark/BING genes and population controls are previously described in the CMAP publication (Subramanian et al, 2017); ACE2 is not a landmark gene but is a best‐inferred gene. For each drug, differential expression (DE) analysis of drug‐treated samples vs population controls was performed using limma (Ritchie et al, 2015) taking advantage of the data across all landmark/BING genes, and finally, the DE results for ACE2 were selected. In cases where each drug was tested on more than one cell type, for example in the first part of our analysis where all drugs were tested on the same four carcinoma cell lines (described above), cell type was included as a covariate in the limma linear model (Ritchie et al, 2015), i.e., the results represent averaged DE across the cell types.
Analysis of drug classes enrichment in ACE2 modulators
With the drug‐induced ACE2 differential expression results across the selected clinically approved drugs as described above, we tested for the enrichment of different classes of drugs for positive/negative ACE2 modulators with the GSEA method as implemented in the R package fgsea (preprint: Korotkevich et al, 2019). Specifically, the drug‐induced ACE2 expression log fold change values were ranked, and the GSEA method was applied to the ranked list with “gene sets” for GSEA being the sets of drugs of each class. The drug classes were based on mechanisms of action (MOA) and indication in our two respective analysis described in the main text, where the MOA annotation was obtained from the Drug Repurposing Hub (Corsello et al, 2017), and for drug indication, we used the WHO ATC classification (World Health Organization, 2006) obtained from the DrugBank database (Wishart et al, 2018).
Identification of ACE2 modulators using the GEO database
We systematically mined the GEO database for gene expression data of drug treatment with matched controls in lung and kidney cells/tissues combining programmatic search and manual curation. Specifically, we downloaded an SQL database of GEO metadata (timestamp: May 10, 2020) using the R package GEOmetadb (Zhu et al, 2008) and used an in‐house script (see Data availability) to query the metadata for GEO datasets and data series whose summary, description, or study design information contain the generic names of any of the clinically approved drugs (identified from DrugBank, as described above). We then further filtered the resulting datasets to find keywords such as “lung/pneumo”, “bronchial/bronchus”, “kidney/renal/nephr”, and “treat” (see our script for details; Data availability) to obtain a smaller set of several hundreds of candidate GEO studies. These were then manually selected for relevant studies with drug‐treated and control expression profiling. We were careful to exclude studies that compare drug responses in two groups differed by genotype at a single locus, such as between a wild‐type cell line and an isogenic mutant cell line. For each selected relevant study, the gene expression and phenotypic data were downloaded from GEO, the control group and the treated group(s) were manually labeled, and differential expression analysis between treated and control groups was performed with limma (Ritchie et al, 2015). If a single GEO study contains experiments of treatment by different drugs, the analysis was then performed individually for each drug. Similarly, for cases where the same drug was tested on different sample types in a study (e.g., a cancer cell line and a normal cell), each cell line was analyzed separately. In cases where multiple time points of drug treatment are available, the drug treatment time was controlled for as a covariate in the limma linear model. Details on those finally selected studies are given in Table EV3A and B.
Co‐expression analysis of drug targets and ACE2 expression
We computed the association between the expression of ACE2 and each gene in the GTEx human lung tissue (Lonsdale et al, 2013) and mapped the genes to clinically approved drugs that target (i.e., inhibit) them using drug target annotation from DrugBank (Wishart et al, 2018). We then identified the two sets of drugs that target only genes with significant positive or negative correlations with ACE2, respectively (i.e., drugs targeting multiple genes with mixed directions of correlation with ACE2 are excluded). The enrichment of these two sets of drugs in the WHO ATC classes of drug indication (World Health Organization, 2006) was analyzed using Fisher's test. Similarly, we computed the correlation of each gene with ACE2 expression in a single‐cell RNA‐seq dataset comprising 10,360 cells from upper and lower airways and lung parenchyma in healthy lungs (GSE130148) (Vieira Braga et al, 2019) and mapped each gene to the corresponding targeting drugs. For this list, we performed GSEA (preprint: Korotkevich et al, 2019) to test for enrichment in the WHO ATC classes of drug indication (World Health Organization, 2006).
P values in this study were adjusted with the Benjamini–Hochberg method.
Author contributions
ER conceived and supervised the study. SS, KC, and ER designed and developed the methodology. KC and SS acquired and analyzed the data. KC, SS, ER, AAS, KA, and ES wrote, reviewed, and revised the manuscript.
Conflict of interest
The authors declare that they have no conflict of interest.
Supporting information
Appendix
Expanded View Figures PDF
Table EV1
Table EV2
Table EV3
Review Process File
Acknowledgements
This research was supported in part by the Intramural Research Program of the National Institutes of Health, NCI, and used the computational resources of the NIH HPC Biowulf cluster (http://hpc.nih.gov). We acknowledge and thank the National Cancer Institute for providing financial and infrastructural support. S.S and K.C. are supported by the NCI‐UMD Partnership for Integrative Cancer Research Program. We thank Dr. Fiorella Schischlik, Sanna Madan, and Dr. Bríd Ryan for constructive comments on this study.
Mol Syst Biol. (2020) 16: e9628
Data availability
All the data analyzed in this study are from published studies or publicly accessible datasets. The CMAP data were downloaded from the GEO database (GSE92742 [http://www.ncbi.nlm.nih.gov/geo/query/acc.cgi?acc=GSE92742] and GSE70138 [http://www.ncbi.nlm.nih.gov/geo/query/acc.cgi?acc=GSE70138]). The identifiers of the other GEO datasets we curated and analyzed (those containing drug treatment data of lung and kidney‐derived cell or tissue samples) can be found in Table EV3. The code used for the analysis can be obtained from https://github.com/ruppinlab/ACE2_modulating_drugs.
References
- Bekerman E, Neveu G, Shulla A, Brannan J, Pu S‐Y, Wang S, Xiao F, Barouch‐Bentov R, Bakken RR, Mateo R et al (2017) Anticancer kinase inhibitors impair intracellular viral trafficking and exert broad‐spectrum antiviral effects. J Clin Invest 127: 1338–1352 [DOI] [PMC free article] [PubMed] [Google Scholar]
- Brielle ES, Schneidman‐Duhovny D, Linial M (2020) The SARS‐CoV‐2 exerts a distinctive strategy for interacting with the ACE2 human receptor. Viruses 12: 497 [DOI] [PMC free article] [PubMed] [Google Scholar]
- Corsello SM, Bittker JA, Liu Z, Gould J, McCarren P, Hirschman JE, Johnston SE, Vrcic A, Wong B, Khan M et al (2017) The Drug Repurposing Hub: a next‐generation drug library and information resource. Nat Med 23: 405–408 [DOI] [PMC free article] [PubMed] [Google Scholar]
- Diaz JH (2020) Hypothesis: angiotensin‐converting enzyme inhibitors and angiotensin receptor blockers may increase the risk of severe COVID‐19. J Travel Med 27: taaa041 [DOI] [PMC free article] [PubMed] [Google Scholar]
- Dimou C, Antza C, Akrivos E, Doundoulakis I, Stabouli S, Haidich AB, Kotsis V (2019) A systematic review and network meta‐analysis of the comparative efficacy of angiotensin‐converting enzyme inhibitors and angiotensin receptor blockers in hypertension. J Hum Hypertens 33: 188–201 [DOI] [PubMed] [Google Scholar]
- Dyall J, Coleman CM, Hart BJ, Venkataraman T, Holbrook MR, Kindrachuk J, Johnson RF, Olinger GG Jr, Jahrling PB, Laidlaw M et al (2014) Repurposing of clinically developed drugs for treatment of Middle East respiratory syndrome coronavirus infection. Antimicrob Agents Chemother 58: 4885–4893 [DOI] [PMC free article] [PubMed] [Google Scholar]
- Esler M, Esler D (2020) Can angiotensin receptor‐blocking drugs perhaps be harmful in the COVID‐19 pandemic? J Hypertens 38: 781–782 [DOI] [PubMed] [Google Scholar]
- Fang L, Karakiulakis G, Roth M (2020) Are patients with hypertension and diabetes mellitus at increased risk for COVID‐19 infection? Lancet Respir Med 8: e21 [DOI] [PMC free article] [PubMed] [Google Scholar]
- Ferrario CM, Jessup J, Chappell MC, Averill DB, Brosnihan KB, Tallant EA, Diz DI, Gallagher PE (2005) Effect of angiotensin‐converting enzyme inhibition and angiotensin II receptor blockers on cardiac angiotensin‐converting enzyme 2. Circulation 111: 2605–2610 [DOI] [PubMed] [Google Scholar]
- Furuhashi M, Moniwa N, Mita T, Fuseya T, Ishimura S, Ohno K, Shibata S, Tanaka M, Watanabe Y, Akasaka H et al (2015) Urinary angiotensin‐converting enzyme 2 in hypertensive patients may be increased by olmesartan, an angiotensin II receptor blocker. Am J Hypertens 28: 15–21 [DOI] [PubMed] [Google Scholar]
- Gorpelioglu C, Ozol D, Sarifakioglu E (2010) Influence of isotretinoin on nasal mucociliary clearance and lung function in patients with acne vulgaris. Int J Dermatol 49: 87–90 [DOI] [PubMed] [Google Scholar]
- Gurwitz D (2020) Angiotensin receptor blockers as tentative SARS‐CoV‐2 therapeutics. Drug Dev Res 10.1002/ddr.21656 [DOI] [PMC free article] [PubMed] [Google Scholar]
- Horby P, Lim WS, Emberson J, Mafham M, Bell J, Linsell L, Staplin N, Brightling C, Ustianowski A, Elmahi E et al (2020) Effect of dexamethasone in hospitalized patients with COVID‐19: preliminary report. medRxiv 10.1101/2020.06.22.20137273 [PREPRINT] [DOI] [Google Scholar]
- Jiang F, Yang J, Zhang Y, Dong M, Wang S, Zhang Q, Liu FF, Zhang K, Zhang C (2014) Angiotensin‐converting enzyme 2 and angiotensin 1‐7: novel therapeutic targets. Nat Rev Cardiol 11: 413–426 [DOI] [PMC free article] [PubMed] [Google Scholar]
- Korotkevich G, Sukhov V, Sergushichev A (2019) bioRxiv 10.1101/060012 [PREPRINT] [DOI]
- Li XC, Zhang J, Zhuo JL (2017) The vasoprotective axes of the renin‐angiotensin system: physiological relevance and therapeutic implications in cardiovascular, hypertensive and kidney diseases. Pharmacol Res 125: 21–38 [DOI] [PMC free article] [PubMed] [Google Scholar]
- Liang Y, Deng H, Bi S, Cui ZAL, Zheng D, Wang Y (2015) Urinary angiotensin converting enzyme 2 increases in patients with type 2 diabetic mellitus. Kidney Blood Press Res 40: 101–110 [DOI] [PubMed] [Google Scholar]
- Lonsdale J, Thomas J, Salvatore M, Phillips R, Lo E, Shad S, Hasz R, Walters G, Garcia F, Young N et al (2013) The genotype‐tissue expression (GTEx) project. Nat Genet 45: 580‐585 [DOI] [PMC free article] [PubMed] [Google Scholar]
- Lyu X, Hu M, Peng J, Zhang X, Sanders YY (2019) HDAC inhibitors as antifibrotic drugs in cardiac and pulmonary fibrosis. Ther Adv Chronic Dis 10: 10.1177/2040622319862697 [DOI] [PMC free article] [PubMed] [Google Scholar]
- Maher TM, Strek ME (2019) Antifibrotic therapy for idiopathic pulmonary fibrosis: time to treat. Respir Res 20: 205 [DOI] [PMC free article] [PubMed] [Google Scholar]
- Mason RJ (2020) Pathogenesis of COVID‐19 from a cell biology perspective. Eur Respir J 55: 2000607 [DOI] [PMC free article] [PubMed] [Google Scholar]
- Paz Ocaranza M, Riquelme JA, García L, Jalil JE, Chiong M, Santos RAS, Lavandero S (2020) Counter‐regulatory renin‐angiotensin system in cardiovascular disease. Nat Rev Cardiol 17: 116–129 [DOI] [PMC free article] [PubMed] [Google Scholar]
- Perwitasari O, Yan X, Johnson S, White C, Brooks P, Tompkins SM, Tripp RA (2013) Targeting organic anion transporter 3 with probenecid as a novel anti‐influenza a virus strategy. Antimicrob Agents Chemother 57: 475–483 [DOI] [PMC free article] [PubMed] [Google Scholar]
- Ritchie ME, Phipson B, Wu D, Hu Y, Law CW, Shi W, Smyth GK (2015) limma powers differential expression analyses for RNA‐sequencing and microarray studies. Nucleic Acids Res 43: e47 [DOI] [PMC free article] [PubMed] [Google Scholar]
- Subramanian A, Narayan R, Corsello SM, Peck DD, Natoli TE, Lu X, Gould J, Davis JF, Tubelli AA, Asiedu JK et al (2017) A next generation connectivity map: L1000 platform and the first 1,000,000 profiles. Cell 171: 1437–1452.e17 [DOI] [PMC free article] [PubMed] [Google Scholar]
- Uhal B, Abdul‐Hafez A (2010) Bleomycin downregulates ACE‐2 In Alveolar Epithelial Cells through a Posttranscriptional Mechanism Inhibitable by Angiotensin, pp. 1–7. A58. ANIMAL MODELS OF PULMONARY FIBROSIS Available at: 10.1164/ajrccm-conference.2010.181.1_meetingabstracts.a1979 [DOI] [Google Scholar]
- Vieira Braga FA, Kar G, Berg M, Carpaij OA, Polanski K, Simon LM, Brouwer S, Gomes T, Hesse L, Jiang J et al (2019) A cellular census of human lungs identifies novel cell states in health and in asthma. Nat Med 25: 1153–1163 [DOI] [PubMed] [Google Scholar]
- Vuille‐dit-Bille RN, Camargo SM, Emmenegger L, Sasse T, Kummer E, Jando J, Hamie QM, Meier CF, Hunziker S, Forras‐Kaufmann Z et al (2015) Human intestine luminal ACE2 and amino acid transporter expression increased by ACE‐inhibitors. Amino Acids 47: 693–705 [DOI] [PubMed] [Google Scholar]
- Wishart DS, Feunang YD, Guo AC, Lo EJ, Marcu A, Grant JR, Sajed T, Johnson D, Li C, Sayeeda Z et al (2018) DrugBank 5.0: a major update to the DrugBank database for 2018. Nucleic Acids Res 46: D1074–D1082 [DOI] [PMC free article] [PubMed] [Google Scholar]
- World Health Organization (2006) WHO collaborating centre for drug statistics methodology: ATC classification index with DDDs and guidelines for ATC classification and DDD assignment. Oslo, Norway: Norwegian Institute of Public Health; [Google Scholar]
- Zaim S, Chong JH, Sankaranarayanan V, Harky A (2020) COVID‐19 and multiorgan response. Curr Probl Cardiol 45: 100618 [DOI] [PMC free article] [PubMed] [Google Scholar]
- Zhang P, Zhu L, Cai J, Lei F, Qin J‐J, Xie J, Liu Y‐M, Zhao Y‐C, Huang X, Lin L et al (2020) Association of inpatient use of angiotensin‐converting enzyme inhibitors and angiotensin II receptor blockers with mortality among patients with hypertension hospitalized with COVID‐19. Circ Res 126: 1671–1681 [DOI] [PMC free article] [PubMed] [Google Scholar]
- Zheng Y‐Y, Ma Y‐T, Zhang J‐Y, Xie X (2020) COVID‐19 and the cardiovascular system. Nat Rev Cardiol 17: 259–260 [DOI] [PMC free article] [PubMed] [Google Scholar]
- Zhou N, Pan T, Zhang J, Li Q, Zhang X, Bai C, Huang F, Peng T, Zhang J, Liu C et al (2016) Glycopeptide antibiotics potently inhibit cathepsin L in the late endosome/lysosome and block the entry of ebola virus, middle east respiratory syndrome coronavirus (MERS‐CoV), and severe acute respiratory syndrome coronavirus (SARS‐CoV). J Biol Chem 291: 9218–9232 [DOI] [PMC free article] [PubMed] [Google Scholar]
- Zhu Y, Davis S, Stephens R, Meltzer PS, Chen Y (2008) GEOmetadb: powerful alternative search engine for the Gene Expression Omnibus. Bioinformatics 24: 2798–2800 [DOI] [PMC free article] [PubMed] [Google Scholar]
Associated Data
This section collects any data citations, data availability statements, or supplementary materials included in this article.
Supplementary Materials
Appendix
Expanded View Figures PDF
Table EV1
Table EV2
Table EV3
Review Process File
Data Availability Statement
All the data analyzed in this study are from published studies or publicly accessible datasets. The CMAP data were downloaded from the GEO database (GSE92742 [http://www.ncbi.nlm.nih.gov/geo/query/acc.cgi?acc=GSE92742] and GSE70138 [http://www.ncbi.nlm.nih.gov/geo/query/acc.cgi?acc=GSE70138]). The identifiers of the other GEO datasets we curated and analyzed (those containing drug treatment data of lung and kidney‐derived cell or tissue samples) can be found in Table EV3. The code used for the analysis can be obtained from https://github.com/ruppinlab/ACE2_modulating_drugs.