

Abstract
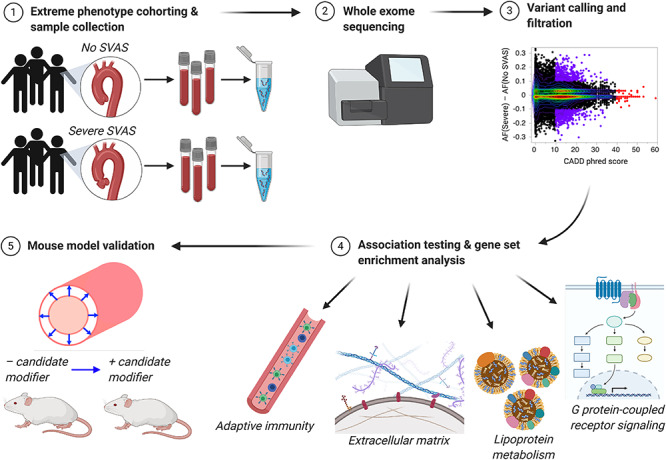
Supravalvular aortic stenosis (SVAS) is a narrowing of the aorta caused by elastin (ELN) haploinsufficiency. SVAS severity varies among patients with Williams–Beuren syndrome (WBS), a rare disorder that removes one copy of ELN and 25–27 other genes. Twenty percent of children with WBS require one or more invasive and often risky procedures to correct the defect while 30% have no appreciable stenosis, despite sharing the same basic genetic lesion. There is no known medical therapy. Consequently, identifying genes that modify SVAS offers the potential for novel modifier-based therapeutics. To improve statistical power in our rare-disease cohort (N = 104 exomes), we utilized extreme-phenotype cohorting, functional variant filtration and pathway-based analysis. Gene set enrichment analysis of exome-wide association data identified increased adaptive immune system variant burden among genes associated with SVAS severity. Additional enrichment, using only potentially pathogenic variants known to differ in frequency between the extreme phenotype subsets, identified significant association of SVAS severity with not only immune pathway genes, but also genes involved with the extracellular matrix, G protein-coupled receptor signaling and lipid metabolism using both SKAT-O and RQTest. Complementary studies in Eln+/−; Rag1−/− mice, which lack a functional adaptive immune system, showed improvement in cardiovascular features of ELN insufficiency. Similarly, studies in mixed background Eln+/− mice confirmed that variations in genes that increase elastic fiber deposition also had positive impact on aortic caliber. By using tools to improve statistical power in combination with orthogonal analyses in mice, we detected four main pathways that contribute to SVAS risk.
Graphical Abstract
Graphical Abstract.
Introduction
The elastin (ELN) gene encodes an extracellular matrix (ECM) protein that allows tissues that stretch, including the skin, lungs and blood vessels, to recoil. ELN insufficiency is associated with cardiovascular complications, including decreased caliber and stenosis of large elastic arteries, hypertension and vascular stiffness (1–4). ELN insufficiency is caused by one of two genetic conditions: familial supravalvular aortic stenosis (SVAS; OMIM #185500), due to point mutations in ELN (reviewed in (5)), and Williams–Beuren syndrome (WBS; OMIM #194050), caused by a microdeletion of 26–28 genes (including ELN) at the 7q11.23 locus (6,7). This 1.5- to 1.8-Mb region is known as the Williams–WBS critical region (WBSCR) (8). WBS affects 1:10 000 individuals while familial SVAS is rarer still.
Focal stenoses of the supravalvular aorta and pulmonary arteries are a leading cause of morbidity and mortality for patients with SVAS and WBS. However, as in many haploinsufficiency diseases, phenotype severity varies widely. Although 20–30% of WBS patients have severe stenosis requiring surgical intervention, the majority show limited to no focal narrowing of their great vessels (9,10). This variability in presentation suggests that other genetic and/or environmental factors modify SVAS severity in patients with ELN insufficiency. Past studies have identified sex as a modifier: male patients tend to be diagnosed with more severe SVAS and more severe overall cardiovascular disease (11). However, male sex does not fully explain SVAS phenotype variability within the WBS population (10).
Because large WBS or SVAS patient cohorts were not previously available to power modifier studies, investigators turned to animal model association studies. Mouse models of ELN insufficiency, the Eln+/− mouse and WBSCR deletion mouse, share many cardiovascular features with human SVAS and WBS patients (12,13), including higher blood pressure, decreased aortic caliber, an increased number of elastic lamellae and increased vascular wall thickness. A modifier study identified quantitative trait loci (QTLs) associated with aortic caliber and systolic blood pressure in C57BL/6 J Eln+/− X 129X1/SvJ F2 mice (14). Though some peaks were shared between the two phenotypes, most were phenotype-specific, suggesting that ELN insufficiency predisposes to both vascular phenotypes but that they are likely independently modified. Therefore, subsequent modifier studies would need to be phenotype-specific.
In humans, WBS deletions that included NCF1 on the telomeric end decreased hypertension risk (4,15), but to date no coding region modifiers for the SVAS phenotype have been confirmed. One common hypothesis is that coding variation in the remaining ELN copy modifies the severity of WBS vascular phenotypes (10,16). The only study to address this was unable to show an association between ELN variation and cardiovascular severity, but was limited by sample size (N = 49) and considered all cardiovascular phenotypes together (including stenosis, hypertension and intracardiac anomalies) (17). The issue of small sample size is a significant challenge for all rare-disease association studies using whole exome/genome data and requires analysis pipelines that optimize discovery.
To combat these problems, we collected a larger cohort of well-phenotyped WBS patients (N = 104)—the largest WBS patient group exome sequenced to date—and directed our efforts to identifying modifiers specific to the SVAS phenotype (Supplementary Material, Fig. S1 outlines our sequencing analysis pipeline). We undertook an extreme-phenotype analysis, focusing only on patients with either no SVAS or severe (hemodynamically significant) SVAS, an approach that has proven effective in identifying rare causal variants of common disease (18). To increase the likelihood that the variants identified would have meaningful biological impact, we concentrated on those most likely to alter protein function (missense, stop-gain and stop-loss). We then employed variant prescreening using the phred-scaled Combined Annotation-Dependent Depletion (CADD) score (19) and marginal frequency between the groups to refine our variant set. Finally, we used gene set enrichment analysis (GSEA) (20) to test for enrichment of Molecular Signatures Database (MSigDB) biological pathways in our gene set (http://software.broadinstitute.org/gsea/msigdb/index.jsp), followed by association tests of SVAS severity with each of the top pathways using the Optimal Sequence Kernel Association Test (SKAT-O) (21,22) and RQTest (23,24). Our methods identified several candidate modifier pathways that were tested in mouse models of ELN insufficiency.
An improved understanding of genes and pathways associated with SVAS pathology will aid in drug targeting and development with the goal of decreasing morbidity and mortality due to stenosis in the WBS population.
Results
Patient cohort demographics
Our study evaluated data from 104 individuals with documented WBS. Their demographics are shown in Table 1. The population was majority Caucasian, and the number of males and females was approximately equal. The average age of last SVAS phenotyping was 16.4 years. Forty-six participants had no SVAS, 42 had mild (non-hemodynamically significant) SVAS and 16 had a history of severe SVAS. The mild SVAS group exhibited a wide spectrum of disease and a large number of children younger than 5 years (13/42), whose final SVAS phenotype may not be known due to the potential for progression of stenosis severity in this age group (25). To ensure that only patients with conclusive SVAS status were studied and to provide the widest phenotypic difference between groups, subsequent testing was performed on the extreme outcomes (no SVAS vs severe SVAS) only (N = 62). This subset was also majority Caucasian and was 59.7% female. The average age at last SVAS phenotyping was higher (20.1 years; range: 11 months to 66.6 years), with 90.3% of patients being 5 years or older. Of the six children younger than 5 years, four had severe SVAS, leaving only two young children (both aged 3.3 years) marked as ‘no SVAS,’ who had the potential to progress.
Table 1.
Demographic data for WBS cohort. Demographics are presented overall and by SVAS severity subgroup. Age at last SVAS phenotyping is listed
| Variable | All patients | No SVAS (N = 46) | Mild SVAS (N = 42) | Severe SVAS (N = 16) | |
|---|---|---|---|---|---|
| Sex (%) | Female | 53.8% | 64.7% | 45.2% | 37.5% |
| Ethnicity (%) | Caucasian | 87.5% | 87.0% | 88.1% | 87.5% |
| Latinx | 6.7% | 8.7% | 7.1% | 0% | |
| Asian | 4.8% | 4.3% | 4.8% | 6.3% | |
| Middle Eastern | 1.0% | 0% | 0% | 6.3% | |
| Deletion size (%) | Typical | 92.3% | 95.7% | 90.5% | 87.5% |
| Atypical | 7.7% | 4.3% | 9.5% | 12.5% | |
| Age at phenotyping (mean, range) | 16.4 | 20.9 | 11.0 | 18.0 | |
| (0.1–66.6) | (3.3–66.6) | (0.1–32.5) | (0.9–46.0) | ||
We performed univariate analysis of the demographic data, but no variables were statistically significantly correlated with SVAS severity (Supplementary Material, Table S1; Bonferroni-corrected α = 0.017). Male sex was the only marginally significant correlate of SVAS severity (P = 0.04). Consequently, we did not include these covariates in subsequent association testing models.
Single-nucleotide variants in the ELN gene and the broader WBS critical region do not appear to modify SVAS severity
To identify modifiers of the SVAS phenotype, we first focused on variation in the remaining ELN copy, since missense changes in this allele could impact the quality of residual ELN deposited. Only two non-synonymous single nucleotide variants (SNVs; rs2071307 and rs17855988, both with phred-scaled CADD score > 10) were identified as variable in the cohort; both were included in the analysis. Single-gene SKAT-O analysis revealed no significant association between these ELN SNVs and severe SVAS (P = 0.159; Fig. 1A).
Figure 1.

Variation in immune pathways, but not ELN, is associated with severe SVAS. (A) SKAT-O burden analysis of patients with no or severe SVAS. (B) Manhattan plot of gene-based exome-wide association testing of 42 360 variants in 12 546 genes. No individual genes reached exome-wide significance, but nominally significant genes of interest are noted. The blue line indicates P < 0.05, which was used as the cutoff for GSEA. The red line indicates P < 3.1 × 10⁻³. (C) Network of experimentally validated interactions between proteins of Reactome immune system gene set (N = 53). Outer ring of each node contains colors corresponding to membership in top 10 Reactome pathways that are enriched within this network.
Extending our search beyond ELN itself, we evaluated variants within the genes in the WBSCR—an area already at genetic risk due to its hemizygous state. For this analysis, we excluded three patients with atypically small WBS deletions, so all participants would have one copy of all genes analyzed. Single-gene SKAT-O revealed no association of WBSCR gene variation with the severe SVAS phenotype (Supplementary Material, Fig. S2A; Bonferroni-corrected α = 0.0045). The most nominally significant gene association was seen for CLIP2 (P = 0.09). Similarly, Fisher’s exact testing revealed no correlation between the number of variants in this region and SVAS phenotype severity (P = 0.37, Supplementary Material, Fig. S2B).
Further restricting this analysis to only those SNVs with a minor allele frequency (MAF) difference > 5% between the severe and no SVAS groups and a phred-scaled CADD score ≥ 10—i.e. a pool more likely to contain causative variants—revealed no significant improvement (N = 3 variants, including the two ELN variants noted above and rs1128349 in DNAJC30; SKAT-O P = 0.29).
Exome-wide gene-based analyses reveal enrichment for immune variants
Not finding strong candidate modifiers in the WBSCR, we expanded our search to the exome. We performed two analyses: one examining all non-synonymous, stop-gain and stop-loss variants in the exome on a gene-by-gene basis, and a second analysis including only those variants with phred-scaled CADD score ≥ 10 and a known difference in MAF among extreme-phenotype groups. Both methodologies favor unbiased discovery: the first method allows an underpowered but complete view of all variants and the second includes prescreening for variants most likely to impact functional differences between groups.
For the unfiltered analysis, we used gene-based SKAT-O with Madsen-Browning SNV weights (26) to evaluate functional variants in individuals with extreme SVAS phenotypes (N = 62). For this purpose, 42 360 variants in 12 546 genes were analyzed. While underpowered to detect all but the strongest associations, the data were overall of high quality, especially at smaller P-values (Supplementary Material, Fig. S3). The best single-gene P-value (uncorrected) was in the range of 1 × 10⁻⁴ (Fig. 1B, Supplementary Material, Table S2). The top genes included WDR36 (P = 1.8 × 10⁻⁴), a gene involved in T cell activation, and FZD4 (P = 4.6 × 10⁻⁴), which is associated with incomplete vascularization and tortuosity of the retinal vasculature in some retinopathies (27,28). Additionally, we noted the presence of COL11A1 (P = 1.6 × 10⁻³), a key gene in collagen fibril formation, and CACNA1B (P = 1.5 × 10⁻³). None met the threshold for exome-wide significance.
Rather than one single gene acting as a modifier of the SVAS phenotype, we hypothesized that risk could be influenced by multiple low-impact changes in genes within the same pathway. We thus chose to perform GSEA of top genes from the exome-wide analysis (genes with P < 0.05, N = 944/12 543). Here we used P-values to rank the degree to which variants in these genes were differentially present in our extreme phenotype groups. Using this cutoff, we selected the top 8% of genes to carry forward for GSEA.
GSEA identified several gene sets of interest, with statistical significance measured by q-values, which indicate false discovery rate (FDR)-adjusted P-values (Table 2). The top two gene sets were related to the immune and adaptive immune systems (q = 6.10 × 10⁻⁸ and 1.69 × 10⁻⁷, respectively). Affected genes in the immune system pathway (Fig. 1C) are involved in multiple aspects of adaptive and innate immune function, including antigen processing and presentation and cytokine signaling.
Table 2.
Top hits for GSEA of top genes in gene-based exome-wide analysis. Variants with P < 0.05 (N = 944) were analyzed. Q-values are FDR-adjusted P-values
| Pathway | # Genes in gene set (K) | # Genes in overlap (k) | k/K | P-value | q-value |
|---|---|---|---|---|---|
| Reactome immune system | 933 | 53 | 0.057 | 4.59 × 10⁻¹¹ | 6.10 × 10⁻⁸ |
| Reactome adaptive immune system | 539 | 37 | 0.069 | 2.54 × 10⁻¹⁰ | 1.69 × 10⁻⁷ |
| Reactome generic transcription pathway | 352 | 26 | 0.074 | 2.68 × 10⁻⁸ | 1.19 × 10⁻⁵ |
| Reactome transmembrane transport of small molecules | 413 | 26 | 0.063 | 6.05 × 10⁻⁷ | 2.01 × 10⁻⁴ |
| Reactome L1CAM interactions | 86 | 11 | 0.13 | 1.56 × 10⁻⁶ | 4.15 × 10⁻⁴ |
| Reactome developmental biology | 396 | 24 | 0.061 | 3.12 × 10⁻⁶ | 6.37 × 10⁻⁴ |
| KEGG MAPK signaling pathway | 267 | 19 | 0.71 | 3.35 × 10⁻⁶ | 6.37 × 10⁻⁴ |
Filtered variant analysis identifies extracellular matrix modifiers of SVAS
Our initial analyses evaluated all non-synonymous variants in the exome on a gene-by-gene basis. Given our sample size of 62, evaluation of such a large number of variants and genes limited our power to find significant associations. Consequently, our second analysis was restricted to a subset of all variants with both a phred-scaled CADD score ≥ 10 and a MAF difference ≥ 10% between the severe and no SVAS groups (N = 860/12 543 genes; colored purple in Fig. 2A and shown in Supplementary Material, Table S3), as these are more likely to contribute to protein function differences between groups (19). In this analysis, no single variant was present in all members of a severity class and variants with the highest CADD scores (colored red in Fig. 2A) were uncommon (MAF < 5%) and present in similar fractions of patients with and without severe stenosis.
Figure 2.

Filtered variant assessment shows prominent role for ECM genes in SVAS risk. (A) Plot of phred-scaled CADD score vs AF difference between severe and no SVAS groups from 42 360 non-synonymous variants of 12 546 genes. Variants with phred-scaled CADD score ≥ 40 are red; variants with CADD-phred ≥10 and AF difference between severe and no SVAS groups > 0.1 are purple (1005 variants in 860 genes); and variant density is shown in red and green contour. (B) Gene sets for the top 25 pathways identified by GSEA of these 860 genes; affected genes within pathways in black. Hierarchical clustering (right and top) of gene sets and sets of pathway membership based on matrices of Jaccard similarity (bottom and left) ranging from none (blue) to complete identity (yellow). Bold arrows and text at right indicate four pathways taken as representatives for the broader clusters (gene names visible in Supplementary Material, Table S5).
GSEA of these higher CADD/higher MAF difference variants (1005 variants in 860 genes) identified multiple canonical pathways, with the top 25 pathways, which involved 188 of the 860 genes, shown in Supplementary Material, Table S4. Examination of the affected genes in these top 25 pathways suggested that several clusters of these genes were driving enrichment for multiple pathways and further, that some of the pathways had biologically related functions. Hierarchical clustering showed that the enriched pathways cluster into four nearly distinct sets, which also correspond to related sets of biological functions (Fig. 2B, Supplementary Material, Table S5). In each cluster, the pathway with the largest number of affected genes was taken as a representative set when assessing significance of enrichment. The four clusters included pathways and genes related to the ECM (e.g. Naba matrisome: q = 4.67 × 10⁻²¹), to G protein-coupled receptor (GPCR) signaling (e.g. Reactome signaling by GPCR: q = 4.71 × 10⁻⁷), to lipid metabolism (Reactome lipids and lipoprotein metabolism: q = 3.01 × 10⁻⁵) and to the immune system (Reactome immune system: q = 1.95 × 10⁻⁵).
Recognizing that multiple pathways appeared enriched in potentially high-impact variants, we assessed whether there was a statistical association between genotypes for the genes in these specific pathways and extreme-phenotype status. We applied the SKAT-O method to test the association of genotype variants in each pathway with the severe and no SVAS cohorts using RVTESTS (22). We found a significant association between variants and phenotype with FDR < 0.05 in 21 of the 25 top pathways from GSEA overall, including each of the four representative pathways previously highlighted by clustering analysis (Table 3, Supplementary Material, Table S6). The variants in the matrisome and lipid metabolism pathways had the strongest association with SVAS severity (q = 0.004 for both).
Table 3.
SKAT-O and RQTest results for four representative pathway association with SVAS. FDR, false discovery rate; GPCR, G protein-coupled receptor
| Pathway | RVTEST SKAT-O FDR | RQTest rqt FDR |
|---|---|---|
| Naba matrisome | 3.7 × 10⁻³ | 3.4 × 10⁻¹³ |
| Reactome signaling by GPCR | 1.0 × 10⁻² | 4.4 × 10⁻⁶ |
| Reactome metabolism of lipids and lipoproteins | 3.7 × 10⁻³ | 2.4 × 10⁻⁴ |
| Reactome immune system | 3.5 × 10⁻² | 4.4 × 10⁻⁶ |
We also applied RQTests using Wald statistics in the R package ‘rqt’ to test the association of variants in the identified pathways with SVAS severity (Table 3, Supplementary Material, Table S6) (23,24). The matrisome pathway had the strongest association with SVAS severity (q = 3.4 × 10⁻¹³). Twenty-one out of 25 pathways were significantly associated with SVAS severity, with FDR < 0.05 (Supplementary Material, Table S6). Patient-specific genotype/phenotype data are shown for the Naba matrisome gene list (Fig. 3A). Seven genes were identified with particularly high phred-scaled CADD scores and allele-frequency differences (Fig. 3B). Genotype/phenotype data for the remaining three key pathways are shown in Supplementary Material, Figures S4–S6.
Figure 3.

Genotype/phenotype relationship for 72 SVAS risk–associated ECM genes. (A) Genotypes for each of 62 extreme-phenotype participants (X-axis) and 84 variants in 72 Naba matrisome genes (Y-axis). Homozygous alternate is red, heterozygous brown and homozygous reference blue. (B) Phred-scaled CADD scores (X-axis) and difference in AF (Y-axis) between severe and no SVAS subsets. Seven genes showed extreme phred-scaled CADD scores and/or extreme AF differences between severe and no SVAS subsets. Red are more common in severe disease patients and blue are more common in those without stenosis.
Validation of candidate pathways in mice
Our human genomic analyses revealed four candidate modifier pathways. To confirm that the pathways revealed by exome analysis contained relevant genes, we evaluated two candidate pathways in Eln+/− mice. These mice share many vascular features with human ELN insufficiency patients, including narrowed arterial caliber, an increased number of elastic lamellae, higher blood pressure and increased vascular stiffness (12,29).
To interrogate immunity-related targets, particularly those affecting the adaptive immune system, which were highlighted by both analyses, we bred the Eln+/− (C57BL/6 J) mouse to the Rag1−/− (C57BL/6 J) mouse. Rag1−/− mice fail to form B or T cells (30), and therefore have congenitally reduced adaptive immunity. As previously reported, Eln+/−; Rag1+/+ mice had a narrower aortic diameter than Eln+/+; Rag1+/+ wild-type (WT) mice (P < 0.01 or better Fig. 4A) and a higher systolic blood pressure (P < 0.0001; Fig. 4B) (29). However, the addition of Rag1−/− to the Eln+/− background (Eln+/−; Rag1−/−) both increased ascending aortic caliber (P < 0.05–0.0001 covering all physiologic pressures; Fig. 4A) and decreased systolic blood pressure relative to Eln+/−; Rag1+/+ (P < 0.001; Fig. 4B), suggesting that changes to genes controlling the adaptive immune system have the potential to modify vascular features relevant to ELN insufficiency.
Figure 4.

Orthogonal testing of candidate pathways. (A) Outer aortic diameter mean (SD) at 0–175 mm Hg measured ex vivo by pressure myography. Tukey multiple corrections. *P < 0.05, **P < 0.01, ***P < 0.001, ****P < 0.0001. * compare Eln+/+; Rag1+/+ to Eln+/−; Rag1+/+. ^ compare Eln+/+; Rag1+/+ to Eln+/−; Rag1−/−. # compare Eln+/−; Rag1+/+ to Eln+/−; Rag1−/−. (B) Mean (SD) systolic blood pressure of Eln+/+; Rag1+/+, Eln+/−; Rag1+/+, and Eln+/−; Rag1−/− mice. (C) Mean (SD) desmosine levels (normalized to total vessel protein) in Eln+/− (N = 286) and WT (N = 321) mouse ascending aortas. (D) Mean (SD) aortic caliber at 100 mm Hg in Eln+/− and WT mice, as assessed by ex vivo pressure-diameter analysis. (E) Pearson’s r correlation between desmosine level and aortic diameter, corrected for Eln genotype at 125 mm Hg, mouse strain and assay plate number. ****P < 0.0001.
Next, we used mouse modeling to evaluate the impact of variation in the matrisome. In reviewing the genes implicated by our human studies, we found no single gene that could plausibly influence changes to the full matrisome. However, we noticed that many matrisome components, including versican (31), heparan sulfate proteoglycans (32,33), latent TGF-beta binding proteins (34), bone morphogenic proteins (35) and matrix metalloproteinases (36) had previously been implicated in elastic fiber assembly or stability/maintenance. Consequently, we hypothesized that changes in the genetic background that influence the amount of aortic ELN could impact the vascular phenotypes of Eln+/− mice.
To determine whether variations in total aortic ELN content are associated with changes in vascular phenotype, we analyzed levels of desmosine (an ELN-specific crosslink that can be used to quantify ELN (37)) in C57BL/6 J Eln+/− X DBA2/J F2 mice (N = 264) and C57BL/6 J Eln+/− X 129X1/SvJ F2 mice (N = 340), and correlated the results to vascular phenotypes associated with ELN insufficiency (not all phenotypes were collected for all animals). C57BL/6 J Eln+/− X DBA2 F1 mice have previously been shown to have a milder vascular phenotype than C57BL/6 J mice alone, while C57BL/6 J Eln+/− X 129X1/SvJ F1 mice have a more severe phenotype (14); therefore, variation in phenotype among the F2 mice was expected.
When evaluated as a group, the ascending aortas from Eln+/− mice had a reduced mean desmosine/total protein ratio (P = 7.3 × 10−49; Fig. 4C) and a narrower mean diameter (P = 2.7 × 10⁻²⁴; Fig. 4D) than those from WT mice. In addition, mean systolic blood pressure was higher (Supplementary Material, Fig. S7A, P = 3.4 × 10⁻²⁶) and mean ascending aortic length was greater (Supplementary Material, Fig. S7B, P = 7.7 × 10−67) in Eln+/− mice. Pearson’s correlation analysis, which was performed controlling for Eln genotype, mouse strain (C57BL/6 J X DBA/2 or C57BL/6 J X 129X1/SvJ) and assay plate number, showed minimal correlation between ELN content and any of the vascular parameters: Pearson’s r statistic ranged from −0.02 to 0.11 (Fig. 4E, Table 4 and Supplementary Material, Table S7A). However, when WT and Eln+/− mice were analyzed separately, the correlation between desmosine and aortic diameter became stronger for the Eln+/− group (r = 0.15 at 100 mm Hg, r = 0.19 at 125 mm Hg; Table 4) while remaining negligible for the WT mice (r = 0.04–0.06; Table 4). These results indicate that in the haploinsufficient state, the amount of ELN deposited correlates with aortic size at physiologic pressure suggesting that changes in the genetic background that influence the total amount of ELN assembled have the potential to alter vascular phenotypes. However, neither systolic blood pressure nor aortic length showed any within-Eln genotype desmosine correlation (Supplementary Material, Table S7B and C).
Table 4.
Correlation between desmosine level and aortic diameter. Pearson’s correlation coefficient is shown for all mice and for Eln+/+ (WT) and Eln+/− mice separately
| Pearson’s r | P-value | n | Adjustments | |
|---|---|---|---|---|
| Diameter at 100 mm Hg | ||||
| All mice | 0.08 | 0.6 | 593 | Plate, Eln genotype, background |
| WT only | 0.04 | 0.55 | 277 | Plate, background |
| Eln+/− only | 0.15 | 0.01 | 316 | Plate, background |
| Diameter at 125 mm Hg | ||||
| All mice | 0.11 | 7.4 × 10⁻³ | 593 | Plate, Eln genotype, background |
| WT only | 0.06 | 0.30 | 277 | Plate, background |
| Eln+/− only | 0.19 | 7.0 × 10⁻⁴ | 316 | Plate, background |
Taken together, the mouse studies reinforce the feasibility of our exome studies to identify relevant modifier pathways. More work is needed to confirm the remaining two pathways.
Discussion
ELN insufficiency causes a characteristic but variable set of cardiovascular outcomes in affected individuals. Understanding the genetic influences underlying this inconsistent presentation may allow scientists to co-opt these pathways for the purpose of designing novel therapeutics. To begin our analysis, we evaluated potential modifiers of SVAS severity in WBS patients cited in the literature, such as male sex (11). In our cohort, affected males did show more severe SVAS, but the association was not strong and consequently was not carried into subsequent analyses. Because SVAS severity can evolve over the first few years of life, we confirmed that the ‘no SVAS’ group contained a minimal number of young children that might serve as false negatives. Only two such children were included in that subgroup and neither of them were infants.
After ruling out covariates, we focused on the remaining ELN copy. Delio et al. (17) were unable to find an association between ELN variation and cardiovascular disease in their cohort of 49 patients. We attempted to mitigate these challenges by using a larger cohort (N = 104) and used an extreme-phenotype approach to identify patient groups with the largest potential difference in phenotype. Based on earlier animal research showing distinct modifier peaks for the various cardiovascular features of ELN insufficiency (14), we focused on SVAS—the phenotypic feature that causes the highest morbidity and mortality. To increase the likelihood of impact for the variants studied, we included only missense, stop-gain and stop-loss changes. Only two such variants were identified in ELN in our extreme-phenotype WBS cohort, and neither variant individually, nor both together had a large impact on SVAS severity. It is possible that a small effect could be detected in a larger cohort, but coding differences in ELN did not explain the majority of SVAS risk seen in WBS patients. Of note, we did not evaluate non-coding, synonymous or splice variants from our whole exome data. One previous investigation identified a single SNV in intron 22 of ELN (rs2528795) that was associated with stenosis risk in a cohort of 25 WBS patients (38). Additional whole genome-based studies are necessary to understand the impact of non-coding and structural variation.
To extend the genomic space for analysis, we moved to the WBSCR, given that genes located there also exhibit haploinsufficiency in WBS. In a recent study of patients with 22q11.2 deletion syndrome, a similar strategy effectively identified modifiers (39). In our WBS analysis, however, no single gene or combination of genes within the WBSCR showed a highly suggestive result. The highest nominal association was seen for CLIP2, a gene thought to impact neurodevelopmental outcomes in mice and potentially humans, but for which cardiovascular data are lacking (40).
In the absence of a strong association within ELN or the WBSCR, we performed exome-wide analyses: first with all functional coding variants, then with a subset of variants with both phred-scaled CADD scores ≥10 and AF differences ≥10% between the severe and no SVAS subsets. In the first analysis, no single gene reached exome-wide significance. This was expected due to the large number of genes and variants being interrogated in a relatively small rare-disease cohort. However, GSEA revealed an abundance of genes related to the immune and adaptive immune systems. In the second analysis, focusing on higher-impact variants, the immune-pathway genes were again noted, but additional pathways were also identified. In both analyses, the variants associated with SVAS severity were present in only a subset of participants. In no case were variants seen in all members of either phenotype group (severe vs no SVAS) and in general, they were common, with >96% of the pre-filtered variants present with MAF ≥ 5%. Similarly, the highest-impact variants—those with phred-scaled CADD score > 30—were generally rare and were distributed equally between the SVAS phenotype groups. These findings suggested that there is no single on-off switch that differentiates between WBS patients with and without SVAS. ELN insufficiency puts an individual at risk for stenosis, but multiple rare and common variants in several genes likely interact to influence the actual development of SVAS.
Altogether, these analyses identified a set of genes in four general pathways that were thought to impact disease severity. Our next goal was to confirm the validity of these pathways. Review of the literature shows that many of the identified genes have a previously described vascular phenotype. Of particular interest were the phenotypes described for LTBP4, BMP4, MMP9 and HSPG2, genes known to influence elastic fiber assembly. The LTBP4 knockdown mouse shows the most direct evidence of disruption of elastic fiber assembly with markedly abnormal elastic matrices in numerous tissues (41). In addition to their previously described role in assembly or maintenance of elastic matrices, BMP4 and MMP9 deficiencies have been shown to impact vascular smooth muscle cell proliferation and/or migration (42,43), mechanisms that are likely relevant to the development of SVAS. Likewise, deficiency for perlecan, encoded by HSPG2, has been implicated in developmental vascular anomalies such as transposition of the great vessels (a phenotype also thought to involve hyperproliferation) as well as in more subtle vascular findings of the conotruncal region (44). It is likely that many of the top genes from our analyses have not been fully evaluated for vascular features due to ascertainment bias based on the gene type (immune genes being evaluated first in immune cells), but these findings underscore their relevance as potential modifiers of vascular disease.
Immunity, in particular, has not been specifically associated with stenosis risk before, but has increasingly been found to play an important role in modifying cardiovascular disease risk (reviewed in (45–48)). Because SVAS severity tends to evolve most greatly in the first 1–2 years of life, these results suggest that immune responses to new environmental exposures may play a role. To verify our human findings regarding the role of the adaptive immune system, we crossed the Eln+/− mouse to a Rag1−/− mutant. Eln+/−; Rag1−/− mice, lacking mature B or T cells, had a lower blood pressure and a larger aortic caliber than their Eln+/−; Rag1+/+ counterparts. T cell function has been linked to hypertension (49,50) and ascending aortic aneurysm (51), but additional work is needed to understand the role of the immune system in ELN-mediated vascular remodeling. Interestingly, Kimura et al. (52) recently showed differential expression of genes related to B cell activation in WBS patients relative to controls. It is unknown whether the B cell signal further segregates with stenosis history in the WBS population but this hypothesis could be tested by evaluating B cell number and gene expression in blood from young patients with and without stenosis.
The ECM-based gene sets showed the highest significance in our second, filtered association analysis, and included variation in genes such as VCAN and LTBP4, which are known to impact elastic fiber assembly and deposition (31,53,54). Interestingly, our mixed-background mouse studies revealed a correlation between ELN (desmosine) concentration and aortic diameter in Eln+/− animals. This difference was not attributable to changes in ELN itself, as no single-nucleotide polymorphism differences are known to exist between the three strains tested (http://www.informatics.jax.org/home/strain). However, our findings support the conclusion that in the ELN haploinsufficient state, gene variation that influences final ELN quantity has the potential to modify final aortic caliber, potentially via impacting elastic fiber assembly or homeostasis. Previous studies combining mutations in Eln and other matrisome genes, such as Fbn1, have shown alterations in vessel morphology and mechanics (55). Moreover, a recent QTL study showed multiple peaks for aortic caliber in Eln+/− mice (14). Review of the genes under those peaks revealed several of the matrisome genes identified in this study, including SDC3 and MEGF6. Future studies combining the Eln+/− with candidate mutant lines such as these would allow scientists to test specific hypotheses regarding ELN protein dosage and its impact of matrix integrity and cell proliferation.
Taken together, we propose that multiple small-impact hits in the pathways identified interact to specifically influence SVAS severity. Consequently, it is reasonable that drugs targeting these pathways could be useful for improving outcomes for affected individuals. For example, a recent study showed that treating Eln+/− mice with minoxidil, a KATP channel opener, resulted in an increased aortic caliber and improved blood flow to end organs. The minoxidil effect persisted after the drug was removed, an outcome attributed to its ability to alter the expression of over 100 ECM genes simultaneously (56). Similarly, medication affecting the immune system could be considered for genetically susceptible individuals. A recent review describes how the mammalian target of rapamycin (mTOR) pathway regulates innate immune cell function (57). Additionally, rapamycin, an mTOR inhibitor, effectively controlled smooth muscle proliferation and matrix remodeling in ELN deficient or insufficient mice (58,59).
In contrast to genome-wide association studies (GWAS) of common diseases, such as hypertension, studies in rare diseases such as this are often limited by sample size. To validate our results, it would be ideal to replicate our findings in an independent exome cohort; however, such a cohort is not currently available for the WBS population. Given this limitation, we do not suggest that the pathways identified here represent a final or complete list of WBS modifiers—rather, we argue that our proof-of-principle study has uncovered one set of candidate modifier pathways that can be further investigated by our group and others.
In addition, because ELN insufficiency is also known to predispose to hypertension, we looked for overlap of our gene list with those previously identified in hypertension GWAS studies. Ultimately, we found seven of our candidate SVAS modifiers (ADAMTS7, FBXL19, PDE5A, PKHD1, CEP68, FGGY and GATA2) on the 107-gene hypertension list (60). These findings parallel those seen in the Eln+/− mouse QTL studies (14), where only a small overlap between aortic diameter and blood pressure peaks was identified. Studies in larger cohorts may reveal additional modifier pathways as well as interactions among the currently identified genes.
Another limitation is the use of only exonic sequence in the analysis, which meant that we were unable to assess the effects of non-coding variation on SVAS phenotype severity. Further whole-genome investigations will allow for interrogation of both non-coding and structural variation that may influence gene expression and impact protein quantity, and for incorporation of additional covariates such as sex that may be significantly associated with risk in a larger group.
Identification of modifier genes is challenging. By using a set of strategies aimed at boosting power for genomic analyses, including extreme-phenotype analysis, prescreening for variants with increased likelihood of pathogenicity, functional enrichment of genes and pathway-level testing, we identified new pathways relevant to SVAS severity. Orthogonal mouse studies supported these suggestive associations, adding proof of concept to our methods. Taken together, our study identified variation in four key pathways that associated with differences in stenosis severity in WBS patients. Further study of these pathways has the potential to both provide deeper mechanistic insight into the cause of stenosis and to allow targeting of appropriate therapeutics to higher-risk patients.
Materials and Methods
Human studies
WBS patient sample and SVAS phenotype data collection
Samples and phenotype data were collected through the Williams Syndrome and Supravalvular Aortic Stenosis DNA and Tissue Bank protocol, approved by the Institutional Review Boards of the Washington University School of Medicine (WUSM) and the National Institutes of Health (NIH). Consent forms were signed by the affected individuals or their caregiver depending on ability to consent. Affected individuals then donated blood or saliva for DNA extraction. Phenotype data were collected from available medical records and online caretaker surveys.
SVAS phenotypes were coded as follows: no SVAS was defined as never having been diagnosed with focal stenosis in the supravalvular region. Mild SVAS was considered presence of stenosis in the supravalvular aortic area that was determined to be non-hemodynamically significant; these participants had no history of surgical intervention, nor had surgery been recommended. Finally, severe SVAS was defined as having been diagnosed with hemodynamically significant SVAS. For these individuals, surgical intervention was recommended or performed to treat the condition.
WBS diagnosis was confirmed by clinical (N = 23; assays from multiple companies) or research chromosomal microarray (N = 79; CytoScan HD, Applied Biosystems, Foster City, CA, USA; analyzed with Chromosomal Analysis Suite software, Thermo Fisher Scientific, Waltham, MA, USA). For a total of 94 subjects, ELN deletion was confirmed by either research or clinical array; for eight patients both array types were used. For the remainder (N = 18), WBS region copy number was analyzed using TaqMan copy number probes located both inside and outside the common WBS deletion (Thermo Fisher Scientific). The probes were located in the following genes: AUTS2 (Hs04984177_cn), CALN1 (Hs04946916_cn), FZD9 (Hs03649975_cn), CLIP2 (Hs00899301_cn), POM121C (Hs07529820_cn) and HIP1 (Hs00052426_cn). Copy number analysis was performed according to the manufacturer’s instructions and output data were analyzed using Copy Caller software (Thermo Fisher Scientific).
Sequencing, variant calling and variant annotation
Steps in this workflow are outlined in Supplementary Material, Figure S1. Whole-exome sequencing was performed on 112 samples by the WUSM McDonnell Genome Institute. NimbleGen SeqCap EZ Choice HGSC Library v2.1 libraries were prepared according to the manufacturer’s instructions (http://netdocs.roche.com/PPM/SeqCapEZLibraryLR_Guide_v2p0_Nov_2011.pdf; Roche Sequencing Solutions, Pleasanton, CA, USA). Libraries were sequenced on an Illumina HiSeq 2500 sequencer, and exomes were aligned to the human reference genome (UCSC hg38) using BWA-MEM v0.7.17 (61). This work utilized the computational resources of the NIH High Performance Computing Biowulf cluster (http://hpc.nih.gov). Picard v2.9.2 was used to mark and sort duplicates (http://broadinstitute.github.io/picard/). Base recalibration and realignment of reads were performed with the Genome Analysis Toolkit v3.6 (GATK). Variants were called on a per-individual basis using the GATK HaplotypeCaller with the n + 1 procedures (62). Mean depth of coverage among our WBS samples was 20X for targeted regions. Variant annotation was carried out using ANNOVAR v2018-04-16 (63).
Site-based quality control (QC) was then performed on the annotated variants. First, to remove variants that failed variant quality score recalibration, we used VCFtools v0.1.15 (64). Passing variants were grouped by type (indels and multiallelic variants vs. SNVs) using BCFtools v1.6 (65). SNVs were subsequently filtered using VCFtools v0.1.15 to mark sites with a genotype quality score < 20 (or <99% likelihood of being true positive calls) or a per-genotype read depth of less than 8X as ‘missing.’ VCFtools was then used to filter out sites where more than 20% of the SNV calls were missing, as well as SNVs aligned to mitochondrial DNA or unmapped contigs.
The remaining high-confidence SNVs were used for sample-based QC. Three WBS samples lacking adequate phenotype data were removed using PLINK v1.9 (66). Next, PLINK was used to verify self-reported sex and to calculate per-sample coverage of high-confidence SNVs. SNVs from sex chromosomes were removed from the analysis. Lastly, two low-quality samples with coverage <80% of high-quality SNVs called were removed. The EIGENSOFT v6.1.4 SmartPCA tool (67) was used to identify any population substructure among the remaining 107 WBS samples. Three samples were identified as outliers and were therefore excluded from subsequent association testing (Supplementary Material, Fig. S8). Finally, genotypes for the final set of high-confidence SNVs and high-quality samples were filtered using PLINK to exclude sites lacking variation. A list of all variants identified in the WBS extreme phenotype cohort, as well as the allele frequency in each group and the variant CADD score can be found in Supplementary Material, Table S8.
Univariate analysis of sex, ethnicity and deletion size associated with SVAS severity
Recent literature suggests that chromosomal sex, ethnicity and deletion size may affect risk of cardiovascular disease features in WBS (4,11,15,68,69). Sex was determined based on caretaker survey data and confirmed by PLINK sex check analysis. Ethnicity was determined based on caretaker survey data and confirmed by EIGENSTRAT analysis. Atypical deletions were defined as those smaller than the typical 26-gene deletion (from NSUN5 to GTF2I), larger than the typical 28-gene deletion (from NSUN5 to GTF2IRD2) or shifted from the typical deletion start and end coordinates (70). Age reported was at the time of phenotyping. Fisher’s exact tests were used to compare these characteristics between WBS phenotype groups using RStudio v1.1.383 in an R v3.4.2 environment (RStudio Team, 2017 at http://www.rstudio.com/).
Exome-wide gene-based association testing and GSEA
Gene-based association testing was carried out using the SKAT R package (21). Since we hypothesized that rare or common SNVs could reasonably serve as modifiers of phenotype severity, we performed association testing using SKAT-O, as this allows for the assessment of rare and common variants together with relative weighting, and for the inclusion of both positive and negative allele effects (21). We used the MAF-based Madsen-Browning variant weighting scheme, in which rare SNVs are weighted slightly more than common ones (26). To improve our ability to identify modifier variants leading to changes in protein function, we focused only on non-synonymous, stop-gain and stop-loss SNVs. We used an extreme phenotype model to obtain the strongest signal from the SVAS phenotype by eliminating ‘noise’ from individuals with variable degrees of intermediate severity.
We performed gene-based analysis on ELN and the 10 additional OMIM-designated genes in the WBSCR containing non-synonymous SNVs. Genes in the flanking low-copy-number repeat areas were avoided as short reads are not reliably mapped by standard alignment protocols. For the unbiased exome wide analysis, we interrogated 12 543 genes.
Following gene-based, exome-wide association analysis, the MSigDB’s GSEA tool (http://software.broadinstitute.org/gsea/msigdb) (20,71) was used to search for enrichment of canonical pathways and gene sets among genes with (unadjusted) P < 0.05 (N = 1029 of 12 543) in our extreme phenotype WBS cohort. Here, we used P-values to rank genes based on their relative burden among phenotype groups and used an alpha of 0.05 to select the top differentially present genes. We next visualized the interactions among the enriched genes from the most enriched pathway (Reactome immune system) using Cytoscape v3.7.1 and the stringApp extension v1.4.2 (72), with a confidence score cutoff of 0.4 (i.e. medium confidence).
Filtered variant set GSEA and pathway-based association testing
In our secondary analysis, we limited the analysis space to variants with an increased chance of impacting gene function: those predicted to have higher deleteriousness based on their phred-scaled CADD score (19), and those with marginal (≥10%) differences in allele frequency between severe SVAS and non-SVAS groups. Both the original variant set and the pre-filtered set here are well-correlated with those in the gnomAD NFE cohort (the population to which our patients are most similar) with r-values exceeding 0.97 (Supplementary Material, Fig. S9).
After filtering, resulting variants were analyzed by MSigDB GSEA as above. Overlap of the gene sets with variants within the top 25 resulting pathways was assessed using a similarity matrix with subsequent average-linkage hierarchical clustering to identify groups of pathways with genes in common. Similarity was assessed by using the Jaccard index (J), where J(A,B) = |A∩B|/|A∪B| for display purposes, genes were clustered by similarity of pathway membership using the same method.
Similarity matrix calculations and clustering were performed using the R package prabclus (R package v2.3-1; https://CRAN.R-project.org/package=prabclus). The enriched pathways were also interrogated for association with phenotype differences using SKAT-O-based RVTEST (22), and the Wald statistics-based rqt package (24,73). Patient-specific genotype-phenotype plots were coded with numerical value ‘0’ for homozygous reference, ‘1’ for heterozygous and ‘2’ for homozygous alternate, and were then clustered by genotype/gene.
Mouse investigations
Mouse strains and breeding
Experiments were approved by the animal studies committee at the WUSM. The Eln+/− mouse, which was previously described as predominantly C57BL/6 J (74), was backcrossed three additional generations into C57BL/6 J prior to these experiments, and single-nucleotide polymorphism genotyping was performed to assure majority C57BL/6 J status (14). For the Rag1−/− experiments, the C57BL/6 J Eln+/− mouse was bred to the Rag1 (B6.129S7-Rag1tm1Mom/J) knockout mouse; generating the Eln+/−;Rag1−/−. Rag1−/−mice produce no mature B or T cells (30). Rag1−/− mice and matched controls were given trimethoprim/sulfamethoxazole (333 mg/ml dosed in drinking water) to prevent opportunistic infections. For the desmosine crosslink experiments, the C57BL/6 J Eln+/− mouse was bred to the 129X1/SvJ mouse. F1 mice were then mated to produce F2 intercrossed progeny for phenotyping, as described below (N = 340) (see (14) for details). Similar intercrosses were performed with C57BL/6 J Eln+/− X DBA/2 J mice (N = 264). For all experiments, mice were phenotyped at 3 months of age. Littermates were used whenever possible, although not all animals could be assessed for all phenotypes (e.g. some animals were excluded due to technical limitations such as erratic response to anesthesia (blood pressure) or formation of a small hole or tear in the vessel (aortic pressure diameter measurements)). All animals were housed together under standard conditions.
Blood pressure measurements
Due to the number of experimental animals and the narrowness/tortuosity of the arteries in the Eln+/− mice, invasive blood pressure monitoring by telemetry was not achievable. Consequently, blood pressure was measured in sedated mice using a centrally placed catheter. Mice were anesthetized using 1.5% inhaled isoflurane and restrained on a heated pad to maintain body temperature. A 1.4F Millar catheter (model SPR-671; Millar Instruments, Houston, TX, USA) was then inserted into the ascending aorta via the right carotid artery. Isoflurane administration was reduced to 1%, and cyclic pressure measurements were recorded using LabChart 5 software (ADInstruments, Colorado Springs, CO, USA).
Aortic pressure and diameter measurements
Isolated ascending aortas were cannulated on a pressure myograph (Danish Myotechnology, Copenhagen, Denmark), and bathed in physiological saline (130 mM NaCl, 4.7 mM KCl, 1.6 mM CaCl2, 1.18 mM MgSO4-7H2O, 1.17 mM KH2PO4, 14.8 mM NaHCO3, 5.5 mM dextrose and 0.026 mM EDTA [pH 7.4]) at 37°C. Prior to data acquisition, vessels were inflated and longitudinally stretched to in vivo length. Pressure was then increased from 0 to 175 mm Hg in increments of 25 mm Hg, and outer diameter was measured and manually recorded. Further experimental details have been described in our previous studies (56,75).
For desmosine correlation analysis, we analyzed outer diameter at 100 and 125 mm Hg, which is close to the working systolic pressure in Eln+/+ and Eln+/− mice, respectively. For the Rag1−/− mouse experiments, the entire pressure volume curve is reported.
Ascending aorta length measurements
The length of the ascending aorta was measured using digital calipers from the base of the aortic root to the innominate branch point.
Desmosine analysis
Desmosine analysis was performed as previously described (56,76). Briefly, ascending aortas, from the root to just proximal to the innominate branch point, were dissected and frozen at −80°C for storage. When a complete cohort was available, vessels were lyophilized and sealed in glass vials (C&G Containers Scientific) containing 100 μL of 6 N hydrochloric acid (Thermo Fisher Scientific). Hydrolysis was performed at 105°C for 48 h in a Thomas/Weber model 25 oven (Arthur H. Thomas Company, Philadelphia, PA, USA), and samples were dried in a vacuum concentrator at 65°C for 1.5 h (Speedvac, Thermo Fisher Scientific). Afterwards, they were dissolved in 400 μL water and filtered using a 0.45-μm filter (Lambda Scientific, Edwardstown, Australia). A ninhydrin-based assay was used to calculate total protein content (77). Absorbance at 575 nm was determined using a Synergy H4 Multi-Mode Plate Reader (BioTek, Winooski, VT, USA). Protein concentration in the sample was calculated by comparison with a standard curve (calibration standard for protein hydrolysis obtained from Pickering Laboratories, Mountain View, CA, USA).
Desmosine levels in tissue hydrolysates were quantified using an enzyme-linked immunosorbent assay (78). Briefly, an aliquot of the sample was mixed with a 1:4000 dilution of rabbit anti-desmosine antiserum (79)—a gift from Dr Barry Starcher, University of Texas Health Center—and added to a desmosine-ovalbumin–coated well in a 96-well plate. Washes were as previously reported (76). Peroxidase activity was quantified using SureBlue TMB peroxidase substrate (KPL, Gaithersburg, MD, USA). Absorbance at 650 nm was determined using a Synergy H4 Multi-Mode Plate Reader (BioTek), and desmosine content was determined by extrapolation from a desmosine standard curve run on the same plate. Desmosine standards and desmosine-ovalbumin conjugate were obtained from Elastin Products Company (Owensville, MO, USA). Blocking buffer, dilution buffer, wash solution and the SureBlue TMB peroxidase substrate were purchased from KPL. All procedures were performed at room temperature, unless otherwise noted. For correlation studies, total aortic desmosine concentration (nM/sample) was normalized to total aortic protein content (mg/sample) to account for differences in aortic/animal size. Genotype and phenotype data were kept separately until the time of analysis. Seven samples were excluded for extreme outlier status, suggesting technical error.
Statistical analysis
To compare quantitative data in two groups, the Student’s t test was used. Two-way analysis of variance (ANOVA) was used for double-mutant analyses and pressure-diameter testing. Tukey’s correction was used for multiple testing. All these analyses were performed using GraphPad Prism 7 (GraphPad Software, San Diego, CA, USA).
Pearson’s partial correlation coefficients between desmosine/total protein ratio and systolic blood pressure, aortic length, and aortic caliber at 100 and 125 mm Hg were calculated using SAS®9.4 (Cary, NC, USA), with adjustment for the plate effect, Eln genotypes, and the genetic breeding background.
Supplementary Material
Acknowledgements
The authors would like to acknowledge Dr Barbara Pober, Dr Michael Lugo, and Mr Joshua Danback, who helped with recruitment and obtaining participant consent. They would also like to thank the study participants and their families, without whom this study would not be possible. The NHLBI DIR Bioinformatics Core provided initial bioinformatic support/guidance for PCRP.
Funding
This work was supported by the National Institutes of Health (HL006212 to BAK and HL053325 to RPM) and the Children’s Discovery Institute of the Washington University School of Medicine (MD-II-2013-269 and CH-FR-2011-169).
Conflict of Interest Statement: The authors have nothing to disclose.
Abbreviations
SVAS, supravalvular aortic stenosis; WBS, Williams–Beuren syndrome; ECM, extracellular matrix; WBSCR, Williams–Beuren syndrome critical region; QTL, quantitative trait locus; CADD, combined annotation-dependent depletion; GSEA, gene set enrichment analysis; MSigDB, molecular signatures database; SKAT-O, optimal sequence kernel association test; SNV, single nucleotide variant; MAF, minor allele frequency; FDR, false discovery rate; GPCR, G protein-coupled receptor; WT, wild-type; mTOR, mammalian target of rapamycin; GWAS, genome wide association study; WUSM, Washington University School of Medicine; NIH, National Institutes of Health; GATK, genome analysis toolkit; QC, quality control; gnomAD, genome aggregation database; NFE, non-Finnish European; ANOVA, analysis of variance.
References
- 1. Collins R.T. 2nd, Kaplan P., Somes G.W. and Rome J.J. (2010) Cardiovascular abnormalities, interventions, and long-term outcomes in infantile Williams syndrome. J. Pediatr., 156, 253, e251–258. [DOI] [PubMed] [Google Scholar]
- 2. Curran M.E., Atkinson D.L., Ewart A.K., Morris C.A., Leppert M.F. and Keating M.T. (1993) The elastin gene is disrupted by a translocation associated with supravalvular aortic stenosis. Cell, 73, 159–168. [DOI] [PubMed] [Google Scholar]
- 3. Joyce C.A., Zorich B., Pike S.J., Barber J.C. and Dennis N.R. (1996) Williams-Beuren syndrome: phenotypic variability and deletions of chromosomes 7, 11, and 22 in a series of 52 patients. J. Med. Genet., 33, 986–992. [DOI] [PMC free article] [PubMed] [Google Scholar]
- 4. Kozel B.A., Danback J.R., Waxler J.L., Knutsen R.H., Las Fuentes L., Reusz G.S., Kis E., Bhatt A.B. and Pober B.R. (2014) Williams syndrome predisposes to vascular stiffness modified by antihypertensive use and copy number changes in NCF1. Hypertension, 63, 74–79. [DOI] [PMC free article] [PubMed] [Google Scholar]
- 5. Duque Lasio M.L. and Kozel B.A. (2018) Elastin-driven genetic diseases. Matrix Biol., 71–72, 144–160. [DOI] [PMC free article] [PubMed] [Google Scholar]
- 6. Ewart A.K., Morris C.A., Atkinson D., Jin W., Sternes K., Spallone P., Stock A.D., Leppert M. and Keating M.T. (1993) Hemizygosity at the elastin locus in a developmental disorder, Williams syndrome. Nat. Genet., 5, 11–16. [DOI] [PubMed] [Google Scholar]
- 7. Lowery M.C., Morris C.A., Ewart A., Brothman L.J., Zhu X.L., Leonard C.O., Carey J.C., Keating M. and Brothman A.R. (1995) Strong correlation of elastin deletions, detected by FISH, with Williams syndrome: evaluation of 235 patients. Am. J. Hum. Genet., 57, 49–53. [PMC free article] [PubMed] [Google Scholar]
- 8. Osborne L.R., Martindale D., Scherer S.W., Shi X.M., Huizenga J., Heng H.H., Costa T., Pober B., Lew L., Brinkman J. et al. (1996) Identification of genes from a 500-kb region at 7q11.23 that is commonly deleted in Williams syndrome patients. Genomics, 36, 328–336. [DOI] [PubMed] [Google Scholar]
- 9. Zalzstein E., Moes C.A., Musewe N.N. and Freedom R.M. (1991) Spectrum of cardiovascular anomalies in Williams-Beuren syndrome. Pediatr. Cardiol., 12, 219–223. [DOI] [PubMed] [Google Scholar]
- 10. Pober B.R., Johnson M. and Urban Z. (2008) Mechanisms and treatment of cardiovascular disease in Williams-Beuren syndrome. J. Clin. Invest., 118, 1606–1615. [DOI] [PMC free article] [PubMed] [Google Scholar]
- 11. Sadler L.S., Pober B.R., Grandinetti A., Scheiber D., Fekete G., Sharma A.N. and Urban Z. (2001) Differences by sex in cardiovascular disease in Williams syndrome. J. Pediatr., 139, 849–853. [DOI] [PubMed] [Google Scholar]
- 12. Li D.Y., Faury G., Taylor D.G., Davis E.C., Boyle W.A., Mecham R.P., Stenzel P., Boak B. and Keating M.T. (1998) Novel arterial pathology in mice and humans hemizygous for elastin. J. Clin. Invest., 102, 1783–1787. [DOI] [PMC free article] [PubMed] [Google Scholar]
- 13. Segura-Puimedon M., Sahun I., Velot E., Dubus P., Borralleras C., Rodrigues A.J., Valero M.C., Valverde O., Sousa N., Herault Y. et al. (2014) Heterozygous deletion of the Williams-Beuren syndrome critical interval in mice recapitulates most features of the human disorder. Hum. Mol. Genet., 23, 6481–6494. [DOI] [PubMed] [Google Scholar]
- 14. Kozel B.A., Knutsen R.H., Ye L., Ciliberto C.H., Broekelmann T.J. and Mecham R.P. (2011) Genetic modifiers of cardiovascular phenotype caused by elastin haploinsufficiency act by extrinsic noncomplementation. J. Biol. Chem., 286, 44926–44936. [DOI] [PMC free article] [PubMed] [Google Scholar]
- 15. Del Campo M., Antonell A., Magano L.F., Munoz F.J., Flores R., Bayes M. and Perez Jurado L.A. (2006) Hemizygosity at the NCF1 gene in patients with Williams-Beuren syndrome decreases their risk of hypertension. Am. J. Hum. Genet., 78, 533–542. [DOI] [PMC free article] [PubMed] [Google Scholar]
- 16. Girirajan S. and Eichler E.E. (2010) Phenotypic variability and genetic susceptibility to genomic disorders. Hum. Mol. Genet., 19, R176–R187. [DOI] [PMC free article] [PubMed] [Google Scholar]
- 17. Delio M., Pope K., Wang T., Samanich J., Haldeman-Englert C.R., Kaplan P., Shaikh T.H., Cai J., Marion R.W., Morrow B.E. et al. (2013) Spectrum of elastin sequence variants and cardiovascular phenotypes in 49 patients with Williams-Beuren syndrome. Am. J. Med. Genet. A, 161A, 527–533. [DOI] [PubMed] [Google Scholar]
- 18. Cirulli E.T. and Goldstein D.B. (2010) Uncovering the roles of rare variants in common disease through whole-genome sequencing. Nat. Rev. Genet., 11, 415–425. [DOI] [PubMed] [Google Scholar]
- 19. Kircher M., Witten D.M., Jain P., O'Roak B.J., Cooper G.M. and Shendure J. (2014) A general framework for estimating the relative pathogenicity of human genetic variants. Nat. Genet., 46, 310–315. [DOI] [PMC free article] [PubMed] [Google Scholar]
- 20. Subramanian A., Tamayo P., Mootha V.K., Mukherjee S., Ebert B.L., Gillette M.A., Paulovich A., Pomeroy S.L., Golub T.R., Lander E.S. et al. (2005) Gene set enrichment analysis: a knowledge-based approach for interpreting genome-wide expression profiles. Proc. Natl. Acad. Sci. U. S. A., 102, 15545–15550. [DOI] [PMC free article] [PubMed] [Google Scholar]
- 21. Lee S., Emond M.J., Bamshad M.J., Barnes K.C., Rieder M.J., Nickerson D.A., Team N.G.E.S.P.-E.L.P., Christiani D.C., Wurfel M.M. and Lin X. (2012) Optimal unified approach for rare-variant association testing with application to small-sample case-control whole-exome sequencing studies. Am. J. Hum. Genet., 91, 224–237. [DOI] [PMC free article] [PubMed] [Google Scholar]
- 22. Zhan X., Hu Y., Li B., Abecasis G.R. and Liu D.J. (2016) RVTESTS: an efficient and comprehensive tool for rare variant association analysis using sequence data. Bioinformatics, 32, 1423–1426. [DOI] [PMC free article] [PubMed] [Google Scholar]
- 23. Lee J., Kim Y.J., Lee J., Consortium T.D.-G., Kim B.J., Lee S. and Park T. (2016) Gene-set association tests for next-generation sequencing data. Bioinformatics, 32, i611–i619. [DOI] [PMC free article] [PubMed] [Google Scholar]
- 24. Zhbannikov I.Y., Arbeev K.G. and Yashin A.I. (2017) rqt: an R package for gene-level meta-analysis. Bioinformatics, 33, 3129–3130. [DOI] [PMC free article] [PubMed] [Google Scholar]
- 25. Collins R.T. 2nd, Kaplan P., Somes G.W. and Rome J.J. (2010) Long-term outcomes of patients with cardiovascular abnormalities and Williams syndrome. Am. J. Cardiol., 105, 874–878. [DOI] [PubMed] [Google Scholar]
- 26. Madsen B.E. and Browning S.R. (2009) A groupwise association test for rare mutations using a weighted sum statistic. PLoS Genet., 5, e1000384. [DOI] [PMC free article] [PubMed] [Google Scholar]
- 27. Robitaille J., MacDonald M.L., Kaykas A., Sheldahl L.C., Zeisler J., Dube M.P., Zhang L.H., Singaraja R.R., Guernsey D.L., Zheng B. et al. (2002) Mutant frizzled-4 disrupts retinal angiogenesis in familial exudative vitreoretinopathy. Nat. Genet., 32, 326–330. [DOI] [PubMed] [Google Scholar]
- 28. MacDonald M.L., Goldberg Y.P., Macfarlane J., Samuels M.E., Trese M.T. and Shastry B.S. (2005) Genetic variants of frizzled-4 gene in familial exudative vitreoretinopathy and advanced retinopathy of prematurity. Clin. Genet., 67, 363–366. [DOI] [PubMed] [Google Scholar]
- 29. Faury G., Pezet M., Knutsen R.H., Boyle W.A., Heximer S.P., McLean S.E., Minkes R.K., Blumer K.J., Kovacs A., Kelly D.P. et al. (2003) Developmental adaptation of the mouse cardiovascular system to elastin haploinsufficiency. J. Clin. Invest., 112, 1419–1428. [DOI] [PMC free article] [PubMed] [Google Scholar]
- 30. Mombaerts P., Iacomini J., Johnson R.S., Herrup K., Tonegawa S. and Papaioannou V.E. (1992) RAG-1-deficient mice have no mature B and T lymphocytes. Cell, 68, 869–877. [DOI] [PubMed] [Google Scholar]
- 31. Merrilees M.J., Lemire J.M., Fischer J.W., Kinsella M.G., Braun K.R., Clowes A.W. and Wight T.N. (2002) Retrovirally mediated overexpression of versican v3 by arterial smooth muscle cells induces tropoelastin synthesis and elastic fiber formation in vitro and in neointima after vascular injury. Circ. Res., 90, 481–487. [DOI] [PubMed] [Google Scholar]
- 32. Tu Y. and Weiss A.S. (2010) Transient tropoelastin nanoparticles are early-stage intermediates in the coacervation of human tropoelastin whose aggregation is facilitated by heparan sulfate and heparin decasaccharides. Matrix Biol., 29, 152–159. [DOI] [PubMed] [Google Scholar]
- 33. Kozel B.A., Ciliberto C.H. and Mecham R.P. (2004) Deposition of tropoelastin into the extracellular matrix requires a competent elastic fiber scaffold but not live cells. Matrix Biol., 23, 23–34. [DOI] [PubMed] [Google Scholar]
- 34. Noda K., Dabovic B., Takagi K., Inoue T., Horiguchi M., Hirai M., Fujikawa Y., Akama T.O., Kusumoto K., Zilberberg L. et al. (2013) Latent TGF-beta binding protein 4 promotes elastic fiber assembly by interacting with fibulin-5. Proc. Natl. Acad. Sci. U. S. A., 110, 2852–2857. [DOI] [PMC free article] [PubMed] [Google Scholar]
- 35. Tojais N.F., Cao A., Lai Y.J., Wang L., Chen P.I., Alcazar M.A.A., Jesus Perez V.A., Hopper R.K., Rhodes C.J., Bill M.A. et al. (2017) Codependence of bone morphogenetic protein receptor 2 and transforming growth factor-beta in elastic Fiber assembly and its perturbation in pulmonary arterial hypertension. Arterioscler. Thromb. Vasc. Biol., 37, 1559–1569. [DOI] [PMC free article] [PubMed] [Google Scholar]
- 36. Mecham R.P., Broekelmann T.J., Fliszar C.J., Shapiro S.D., Welgus H.G. and Senior R.M. (1997) Elastin degradation by matrix metalloproteinases. Cleavage site specificity and mechanisms of elastolysis. J. Biol. Chem., 272, 18071–18076. [DOI] [PubMed] [Google Scholar]
- 37. Partridge S.M., Elsden D.F. and Thomas J. (1963) Constitution of the cross-linkages in elastin. Nature, 197, 1297–1298. [DOI] [PubMed] [Google Scholar]
- 38. Gregory M.D., Kolachana B., Yao Y., Nash T., Dickinson D., Eisenberg D.P., Mervis C.B. and Berman K.F. (2018) A method for determining haploid and triploid genotypes and their association with vascular phenotypes in Williams syndrome and 7q11.23 duplication syndrome. BMC Med. Genet, 19, 53. [DOI] [PMC free article] [PubMed] [Google Scholar]
- 39. Zhao Y., Diacou A., Johnston H.R., Musfee F.I., McDonald-McGinn D.M., McGinn D., Crowley T.B., Repetto G.M., Swillen A., Breckpot J. et al. (2020) Complete sequence of the 22q11.2 allele in 1,053 subjects with 22q11.2 deletion syndrome reveals modifiers of Conotruncal heart defects. Am. J. Hum. Genet., 106, 26–40. [DOI] [PMC free article] [PubMed] [Google Scholar]
- 40. Hoogenraad C.C., Koekkoek B., Akhmanova A., Krugers H., Dortland B., Miedema M., Alphen A., Kistler W.M., Jaegle M., Koutsourakis M. et al. (2002) Targeted mutation of Cyln2 in the Williams syndrome critical region links CLIP-115 haploinsufficiency to neurodevelopmental abnormalities in mice. Nat. Genet., 32, 116–127. [DOI] [PubMed] [Google Scholar]
- 41. Sterner-Kock A., Thorey I.S., Koli K., Wempe F., Otte J., Bangsow T., Kuhlmeier K., Kirchner T., Jin S., Keski-Oja J. et al. (2002) Disruption of the gene encoding the latent transforming growth factor-beta binding protein 4 (LTBP-4) causes abnormal lung development, cardiomyopathy, and colorectal cancer. Genes Dev., 16, 2264–2273. [DOI] [PMC free article] [PubMed] [Google Scholar]
- 42. Frank D.B., Abtahi A., Yamaguchi D.J., Manning S., Shyr Y., Pozzi A., Baldwin H.S., Johnson J.E. and Caestecker M.P. (2005) Bone morphogenetic protein 4 promotes pulmonary vascular remodeling in hypoxic pulmonary hypertension. Circ. Res., 97, 496–504. [DOI] [PubMed] [Google Scholar]
- 43. Johnson C. and Galis Z.S. (2004) Matrix metalloproteinase-2 and -9 differentially regulate smooth muscle cell migration and cell-mediated collagen organization. Arterioscler. Thromb. Vasc. Biol., 24, 54–60. [DOI] [PubMed] [Google Scholar]
- 44. Costell M., Carmona R., Gustafsson E., Gonzalez-Iriarte M., Fassler R. and Munoz-Chapuli R. (2002) Hyperplastic conotruncal endocardial cushions and transposition of great arteries in perlecan-null mice. Circ. Res., 91, 158–164. [DOI] [PubMed] [Google Scholar]
- 45. Steven S., Frenis K., Oelze M., Kalinovic S., Kuntic M., Bayo Jimenez M.T., Vujacic-Mirski K., Helmstadter J., Kroller-Schon S., Munzel T. et al. (2019) Vascular inflammation and oxidative stress: major triggers for cardiovascular disease. Oxidative Med. Cell. Longev., 2019, 7092151. [DOI] [PMC free article] [PubMed] [Google Scholar]
- 46. Mikolajczyk T.P. and Guzik T.J. (2019) Adaptive immunity in hypertension. Curr. Hypertens. Rep., 21, 68. [DOI] [PMC free article] [PubMed] [Google Scholar]
- 47. Rodriguez-Iturbe B., Pons H. and Johnson R.J. (2017) Role of the immune system in hypertension. Physiol. Rev., 97, 1127–1164. [DOI] [PMC free article] [PubMed] [Google Scholar]
- 48. Meng X., Yang J., Dong M., Zhang K., Tu E., Gao Q., Chen W., Zhang C. and Zhang Y. (2016) Regulatory T cells in cardiovascular diseases. Nat. Rev. Cardiol., 13, 167–179. [DOI] [PMC free article] [PubMed] [Google Scholar]
- 49. Norlander A.E., Madhur M.S. and Harrison D.G. (2018) The immunology of hypertension. J. Exp. Med., 215, 21–33. [DOI] [PMC free article] [PubMed] [Google Scholar]
- 50. Marvar P.J., Thabet S.R., Guzik T.J., Lob H.E., McCann L.A., Weyand C., Gordon F.J. and Harrison D.G. (2010) Central and peripheral mechanisms of T-lymphocyte activation and vascular inflammation produced by angiotensin II-induced hypertension. Circ. Res., 107, 263–270. [DOI] [PMC free article] [PubMed] [Google Scholar]
- 51. He R., Guo D.C., Sun W., Papke C.L., Duraisamy S., Estrera A.L., Safi H.J., Ahn C., Buja L.M., Arnett F.C. et al. (2008) Characterization of the inflammatory cells in ascending thoracic aortic aneurysms in patients with Marfan syndrome, familial thoracic aortic aneurysms, and sporadic aneurysms. J. Thorac. Cardiovasc. Surg., 136, 922–929929 e921. [DOI] [PMC free article] [PubMed] [Google Scholar]
- 52. Kimura R., Swarup V., Tomiwa K., Gandal M.J., Parikshak N.N., Funabiki Y., Nakata M., Awaya T., Kato T., Iida K. et al. (2019) Integrative network analysis reveals biological pathways associated with Williams syndrome. J. Child Psychol. Psychiatry, 60, 585–598. [DOI] [PMC free article] [PubMed] [Google Scholar]
- 53. Keire P.A., L'Heureux N., Vernon R.B., Merrilees M.J., Starcher B., Okon E., Dusserre N., McAllister T.N. and Wight T. (2010) Expression of versican isoform V3 in the absence of ascorbate improves elastogenesis in engineered vascular constructs. Tissue Eng. Part A, 16, 501–512. [DOI] [PMC free article] [PubMed] [Google Scholar]
- 54. Aya R., Ishiko T., Noda K., Yamawaki S., Sakamoto Y., Tomihata K., Katayama Y., Yoshikawa K., Kubota H., Nakamura T. et al. (2015) Regeneration of elastic fibers by three-dimensional culture on a collagen scaffold and the addition of latent TGF-beta binding protein 4 to improve elastic matrix deposition. Biomaterials, 72, 29–37. [DOI] [PubMed] [Google Scholar]
- 55. Carta L., Wagenseil J.E., Knutsen R.H., Mariko B., Faury G., Davis E.C., Starcher B., Mecham R.P. and Ramirez F. (2009) Discrete contributions of elastic fiber components to arterial development and mechanical compliance. Arterioscler. Thromb. Vasc. Biol., 29, 2083–2089. [DOI] [PMC free article] [PubMed] [Google Scholar]
- 56. Knutsen R.H., Beeman S.C., Broekelmann T.J., Liu D., Tsang K.M., Kovacs A., Ye L., Danback J.R., Watson A., Wardlaw A. et al. (2018) Minoxidil improves vascular compliance, restores cerebral blood flow, and alters extracellular matrix gene expression in a model of chronic vascular stiffness. Am. J. Physiol. Heart Circ. Physiol., 315, H18–H32. [DOI] [PMC free article] [PubMed] [Google Scholar]
- 57. Weichhart T., Hengstschlager M. and Linke M. (2015) Regulation of innate immune cell function by mTOR. Nat. Rev. Immunol., 15, 599–614. [DOI] [PMC free article] [PubMed] [Google Scholar]
- 58. Li W., Li Q., Qin L., Ali R., Qyang Y., Tassabehji M., Pober B.R., Sessa W.C., Giordano F.J. and Tellides G. (2013) Rapamycin inhibits smooth muscle cell proliferation and obstructive arteriopathy attributable to elastin deficiency. Arterioscler. Thromb. Vasc. Biol., 33, 1028–1035. [DOI] [PubMed] [Google Scholar]
- 59. Jiao Y., Li G., Li Q., Ali R., Qin L., Li W., Qyang Y., Greif D.M., Geirsson A., Humphrey J.D. et al. (2017) mTOR (mechanistic target of rapamycin) inhibition decreases mechanosignaling, collagen accumulation, and stiffening of the thoracic aorta in elastin-deficient mice. Arterioscler. Thromb. Vasc. Biol., 37, 1657–1666. [DOI] [PMC free article] [PubMed] [Google Scholar]
- 60. Warren H.R., Evangelou E., Cabrera C.P., Gao H., Ren M., Mifsud B., Ntalla I., Surendran P., Liu C., Cook J.P. et al. (2017) Genome-wide association analysis identifies novel blood pressure loci and offers biological insights into cardiovascular risk. Nat. Genet., 49, 403–415. [DOI] [PMC free article] [PubMed] [Google Scholar]
- 61. Li H. and Durbin R. (2009) Fast and accurate short read alignment with burrows-wheeler transform. Bioinformatics, 25, 1754–1760. [DOI] [PMC free article] [PubMed] [Google Scholar]
- 62. McKenna A., Hanna M., Banks E., Sivachenko A., Cibulskis K., Kernytsky A., Garimella K., Altshuler D., Gabriel S., Daly M. et al. (2010) The genome analysis toolkit: a MapReduce framework for analyzing next-generation DNA sequencing data. Genome Res., 20, 1297–1303. [DOI] [PMC free article] [PubMed] [Google Scholar]
- 63. Wang K., Li M. and Hakonarson H. (2010) ANNOVAR: functional annotation of genetic variants from high-throughput sequencing data. Nucleic Acids Res., 38, e164. [DOI] [PMC free article] [PubMed] [Google Scholar]
- 64. Danecek P., Auton A., Abecasis G., Albers C.A., Banks E., DePristo M.A., Handsaker R.E., Lunter G., Marth G.T., Sherry S.T. et al. (2011) The variant call format and VCFtools. Bioinformatics, 27, 2156–2158. [DOI] [PMC free article] [PubMed] [Google Scholar]
- 65. Li H., Handsaker B., Wysoker A., Fennell T., Ruan J., Homer N., Marth G., Abecasis G., Durbin R. and Genome Project Data Processing, S (2009) The sequence alignment/map format and SAMtools. Bioinformatics, 25, 2078–2079. [DOI] [PMC free article] [PubMed] [Google Scholar]
- 66. Purcell S., Neale B., Todd-Brown K., Thomas L., Ferreira M.A., Bender D., Maller J., Sklar P., Bakker P.I., Daly M.J. et al. (2007) PLINK: a tool set for whole-genome association and population-based linkage analyses. Am. J. Hum. Genet., 81, 559–575. [DOI] [PMC free article] [PubMed] [Google Scholar]
- 67. Price A.L., Patterson N.J., Plenge R.M., Weinblatt M.E., Shadick N.A. and Reich D. (2006) Principal components analysis corrects for stratification in genome-wide association studies. Nat. Genet., 38, 904–909. [DOI] [PubMed] [Google Scholar]
- 68. Komoike Y., Fujii K., Nishimura A., Hiraki Y., Hayashidani M., Shimojima K., Nishizawa T., Higashi K., Yasukawa K., Saitsu H. et al. (2010) Zebrafish gene knockdowns imply roles for human YWHAG in infantile spasms and cardiomegaly. Genesis, 48, 233–243. [DOI] [PubMed] [Google Scholar]
- 69. Kruszka P., Porras A.R., Souza D.H., Moresco A., Huckstadt V., Gill A.D., Boyle A.P., Hu T., Addissie Y.A., Mok G.T.K. et al. (2018) Williams-Beuren syndrome in diverse populations. Am. J. Med. Genet. A, 176, 1128–1136. [DOI] [PMC free article] [PubMed] [Google Scholar]
- 70. Pober B.R. (2010) Williams-Beuren syndrome. N. Engl. J. Med., 362, 239–252. [DOI] [PubMed] [Google Scholar]
- 71. Liberzon A., Subramanian A., Pinchback R., Thorvaldsdottir H., Tamayo P. and Mesirov J.P. (2011) Molecular signatures database (MSigDB) 3.0. Bioinformatics, 27, 1739–1740. [DOI] [PMC free article] [PubMed] [Google Scholar]
- 72. Szklarczyk D., Gable A.L., Lyon D., Junge A., Wyder S., Huerta-Cepas J., Simonovic M., Doncheva N.T., Morris J.H., Bork P. et al. (2019) STRING v11: protein-protein association networks with increased coverage, supporting functional discovery in genome-wide experimental datasets. Nucleic Acids Res., 47, D607–D613. [DOI] [PMC free article] [PubMed] [Google Scholar]
- 73. Lee S., Choi S., Kim Y.J., Kim B.J., Consortium T.d.-G., Hwang H. and Park T. (2016) Pathway-based approach using hierarchical components of collapsed rare variants. Bioinformatics, 32, i586–i594. [DOI] [PMC free article] [PubMed] [Google Scholar]
- 74. Li D.Y., Brooke B., Davis E.C., Mecham R.P., Sorensen L.K., Boak B.B., Eichwald E. and Keating M.T. (1998) Elastin is an essential determinant of arterial morphogenesis. Nature, 393, 276–280. [DOI] [PubMed] [Google Scholar]
- 75. Wagenseil J.E., Nerurkar N.L., Knutsen R.H., Okamoto R.J., Li D.Y. and Mecham R.P. (2005) Effects of elastin haploinsufficiency on the mechanical behavior of mouse arteries. Am. J. Physiol. Heart Circ. Physiol., 289, H1209–H1217. [DOI] [PubMed] [Google Scholar]
- 76. Stoilov I., Starcher B.C., Mecham R.P. and Broekelmann T.J. (2018) Measurement of elastin, collagen, and total protein levels in tissues. Methods Cell Biol., 143, 133–146. [DOI] [PubMed] [Google Scholar]
- 77. Starcher B. (2001) A ninhydrin-based assay to quantitate the total protein content of tissue samples. Anal. Biochem., 292, 125–129. [DOI] [PubMed] [Google Scholar]
- 78. Gunja-Smith Z. (1985) An enzyme-linked immunosorbent assay to quantitate the elastin crosslink desmosine in tissue and urine samples. Anal. Biochem., 147, 258–264. [DOI] [PubMed] [Google Scholar]
- 79. Starcher B.C. and Mecham R.P. (1981) Desmosine radioimmunoassay as a means of studying elastogenesis in cell culture. Connect. Tissue Res., 8, 255–258. [DOI] [PubMed] [Google Scholar]
Associated Data
This section collects any data citations, data availability statements, or supplementary materials included in this article.