Abstract
Biomarker assessments of tumor specimens is widely used in cancer research to audit tumor cell intrinsic as well as tumor cell extrinsic features including the diversity of immune, stromal, and mesenchymal cells. To comprehensively and quantitatively audit the tumor-immune microenvironment (TiME), we developed a novel multiplex immunohistochemistry (mIHC) platform and computational image processing workflow using a single formalin-fixed paraffin-embedded (FFPE) tissue section. Herein, we validated this platform using nine matched primary newly diagnosed and recurrent head and neck squamous cell carcinoma (HNSCC) sections sequentially subjected to immunodetection with a panel of 29 antibodies identifying malignant tumor cells, and 17 distinct leukocyte lineages and their functional states. Image cytometric analysis was applied to interpret chromogenic signals from digitally scanned and coregistered light microscopy-based images enabling identification and quantification of individual tumor cells, structural features, immune cell phenotypes and their functional state. In agreement with our previous study via a 12-plex imaging mIHC platform, myeloid-inflamed status in newly diagnosed primary tumors associated with significantly short progression free survival, independent of lymphoid-inflamed status. Spatial distribution of tumor and immune cell lineages in TiME was also examined and revealed statistically significant CD8+ T cell exclusion from tumor nests, whereas regulatory T cells and myeloid cells, when present in close proximity to tumor cells, highly associated with rapid cancer recurrence. These findings indicate presence of differential immune-spatial profiles in newly diagnosed and recurrent HNSCC, and establish the robustness of the 29-plex mIHC platform and associated analytics for quantitative analysis of single tissue sections revealing longitudinal TiME changes.
1. Introduction
With the remarkable success of immune therapies targeting T cell checkpoint molecules, there is a significant medical need to more efficiently stratify patients likely to respond to therapy based on tumor cell intrinsic and extrinsic biomarkers, as well as longitudinal monitoring of patients receiving therapy to reveal response and resistance mechanisms (DeNardo et al., 2011; Galon et al., 2006; Palucka & Coussens, 2016; Ruffell & Coussens, 2015). Rate limiting for these analyses is ability to deeply audit immune contexture using biopsy specimens or surgical resection material when available. As such, multiple imaging platforms have emerged that enable multiplexed monitoring of 7–60 biomarkers in tissue sections; however, the high cost of reagents and imaging instrumentation severely limit broad use for routine analyses (Angelo et al., 2014; Gerdes et al., 2013; Stack, Wang, Roman, & Hoyt, 2014). Polychromatic flow cytometry gets around many of these issues where sufficient tissue is available and enables evaluation of 18+ fluorescently conjugated antibodies or more if using single cell mass cytometry, e.g., cytometry by time-of-flight (CyTOF) (Bendall et al., 2011). The primary limitation of these approaches is that single cell suspensions are required, thus both tissue architecture and spatial assessments are lost.
We previously reported a practical and cost effective chromogenic sequential IHC method with iterative labeling, digital scanning and subsequent antibody stripping of tissue sections, to enable simultaneous evaluation of 12+ biomarkers in a single formalin-fixed paraffin-embedded (FFPE) tissue section (Tsujikawa et al., 2017). To further develop chromogenic mIHC, we now report a modified approach enabling quantitative assessment of 29 biomarkers in a single FFPE tissue section, enabled by a combination of heat and chemical stripping of antibodies and chromogen in between immunodetection cycles. Using this platform in matched FFPE tissue specimens from a cohort of newly diagnosed and recurrent primary HNSCC, we revealed that specific immune complexity profiles associate with loco-regional recurrence. These technical advancements in mIHC and digital image analysis can be applicable to a wide variety of tissue-based biomarker studies.
2. Results
2.1. Sequential IHC based on heat-mediated and chemical stripping enables highly multiplexed imaging in one FFPE tissue section
To further develop a practical and cost effective multiplexed imaging approach, we sought to overcome a primary limitation of our previously reported 12-plex chromogenic IHC method (Tsujikawa et al., 2017) reliant on iterative cycles of horseradish peroxidase (HRP)-based detection of primary antibodies and whole slide digital imaging, followed by heat-mediated antibody stripping and alcohol stripping of the chromogen, 3-amino-9-ethylcarbazole (AEC). While robust, this approach is limited by the fact that iterative heat treatments reduce IHC sensitivity depending on epitope/antibody states (Tsujikawa et al., 2017). To resolve this limitation, we adopted hydrogen peroxide and methanol-based peroxidase inactivation, commonly utilized for Western blots (Sennepin et al., 2009). Optimized hydrogen peroxide and methanol treatment inactivates HRP of secondary antibodies, allowing for addition of a second (or third) primary/secondary antibody combination from a different host species before progressing to the next round by heat-based antibody stripping (Fig. 1, see Section 4), following digital scanning of chromogen-stained sections, AEC chromogenic signals are removed by methanol treatment.
Fig. 1.
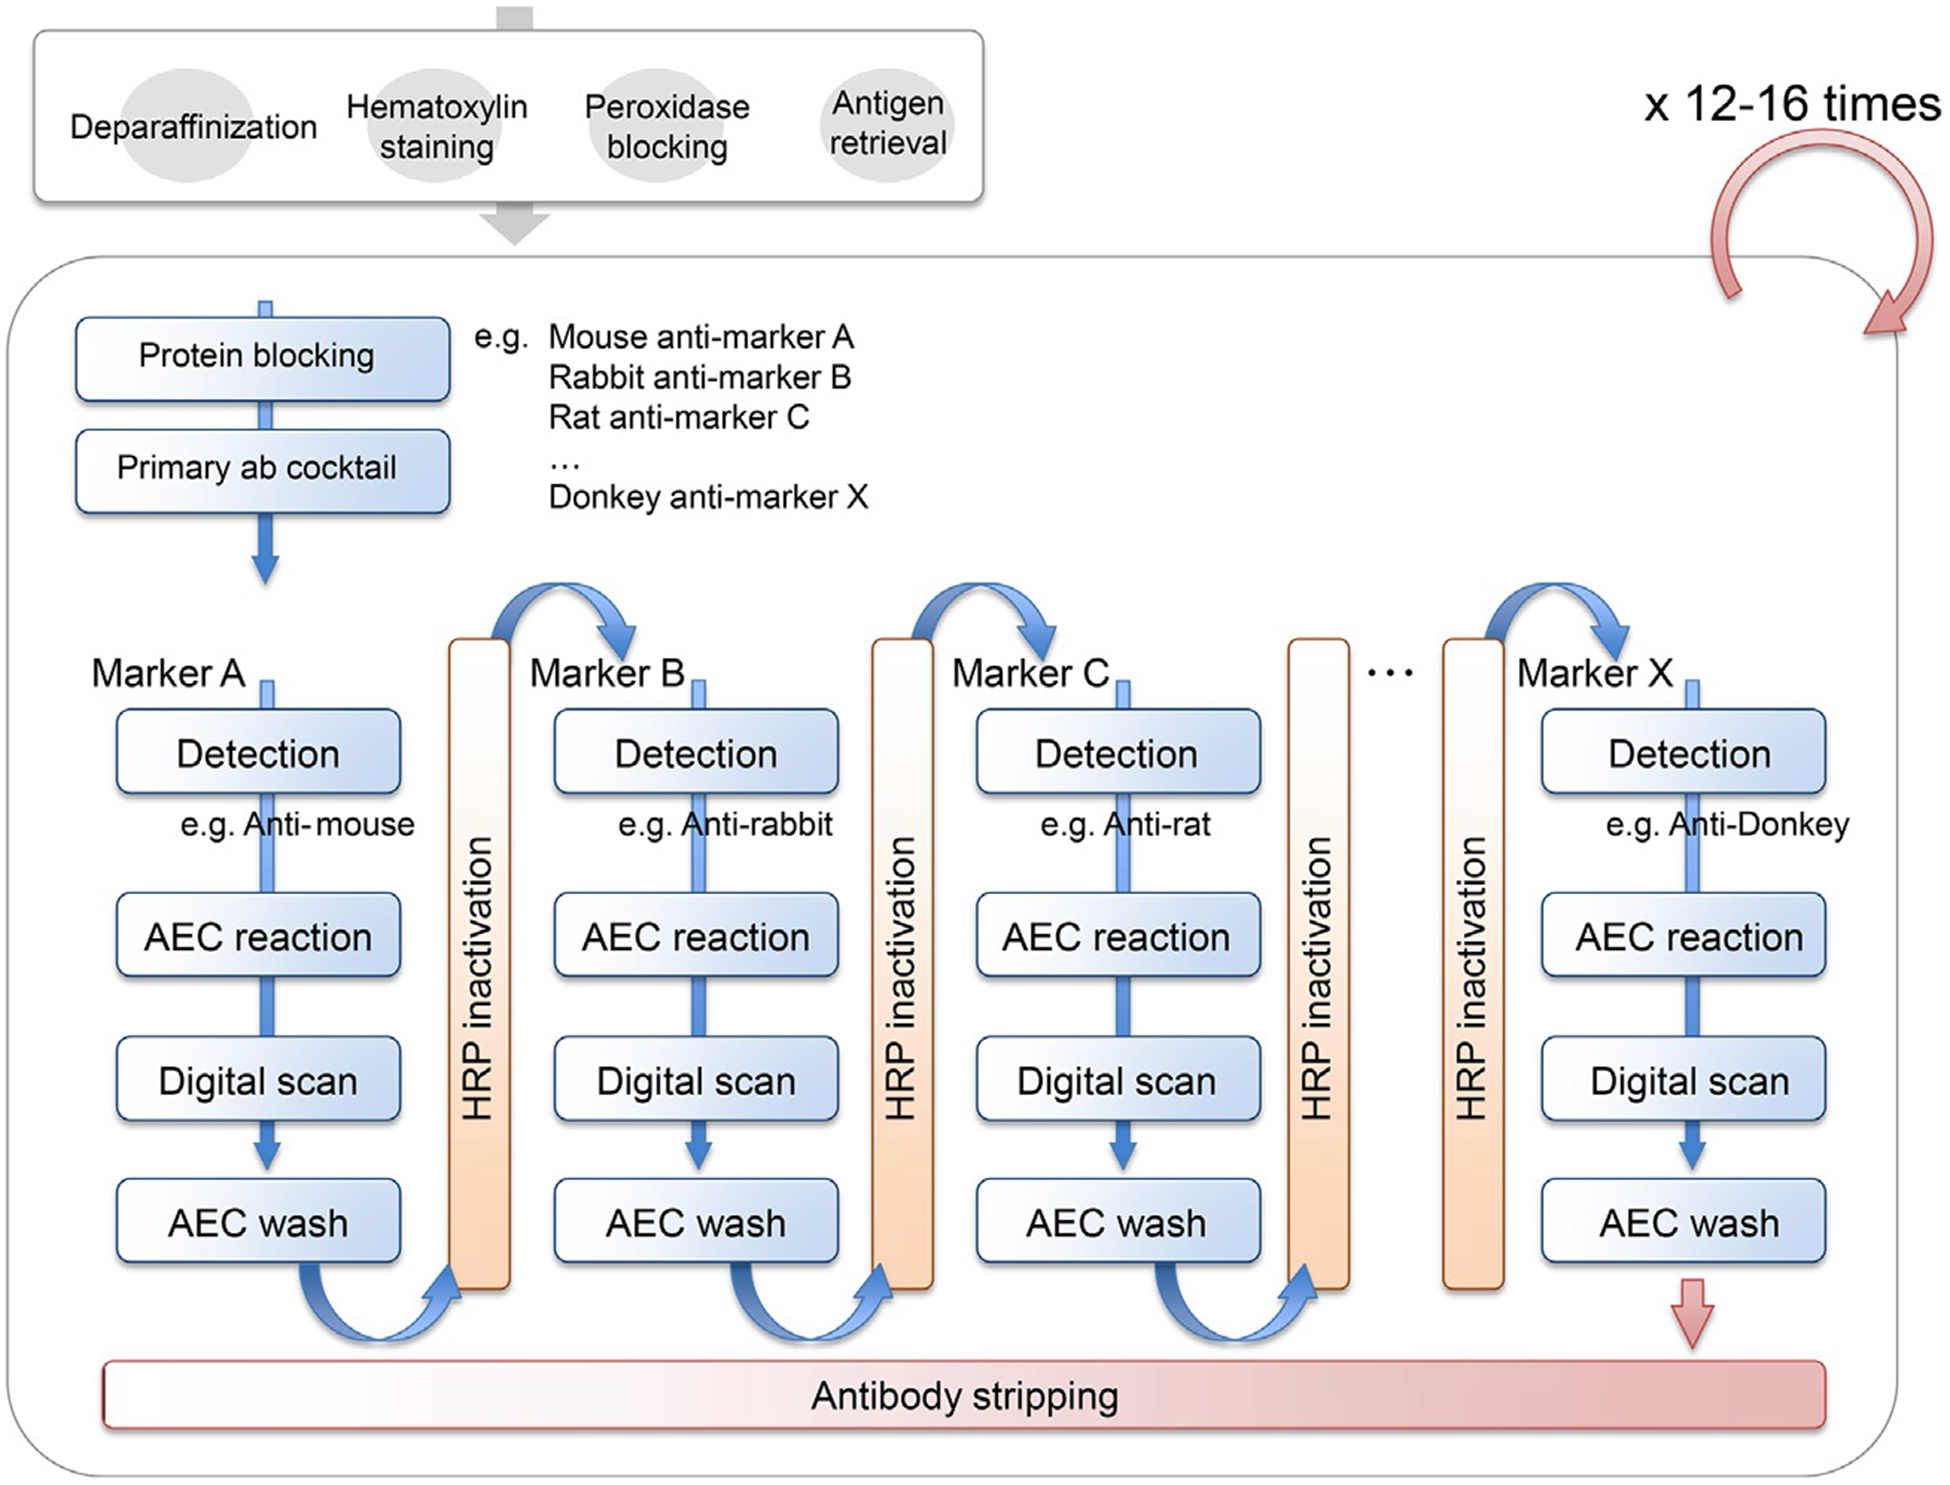
Experimental workflow of 29-biomarker sequential IHC and image visualization. One FFPE tissue section is preprocessed by deparaffinization, hematoxylin staining, endogenous peroxidase blocking, and antigen retrieval, followed by +12 iterative cycles of heat-mediated antibody stripping protocol. In each cycle, primary antibody is detected by host species-specific secondary antibody and alcohol-soluble chromogen, 3-amino-9-ethylcarbazole (AEC), followed by chromogen stripping and horseradish peroxidase (HRP)-inactivation, allowing detection of another primary antibody based on different host species.
Using this approach, we developed a panel of 29 mouse/rat and rabbit-derived antibodies (Table 1) for sequential detection of lymphoid and myeloid immune cell lineages, stromal and epithelial markers, and functional markers in one FFPE tissue section (Fig. 2A–F). As complete signal clearance is needed for detection of subsequent biomarkers, we validated complete loss of antibody and chromogen by comparing heat-mediated antibody stripping (Tsujikawa et al., 2017) with hydrogen peroxide and methanol-based HRP inactivation (Fig. 3). With the exception of some murine and rat antibodies, we did not observe significant cross reactivity among antibodies from different species, enabling validation for placement of antibodies in specific cycles (Table 1).
Table 1.
Sequential IHC panel information.
| Cycle1 | Cycle2 | Cycle3 | Cycle4 | Cycle5 | Cycle6 | Cycle7 | Cycle8 | Cycle9 | Cycle10 | Cycle11 | Cycle12 | Cycle13 | Cycle14 | Cycle15 | |
|---|---|---|---|---|---|---|---|---|---|---|---|---|---|---|---|
| R1 | R2 | R5 | R7 | R9 | R11 | R13 | R15 | R17 | R19 | R21 | R23 | R25 | R27 | R29 | |
| Primary Ab | Hematoxylin | tBTK | PD1 | PD-L1 | ICOS | GATA-3 | CD66b | CD45 | T-bet | GzmB | CD68 | CD4 | Ki67 | SMA | p16 |
| Clone/Product# | D3H5 | NAT105 | E1L3N | SP98 | L50–823 | G10F5 | H130 | EPR9301 | GB7 | PG-M1 | SP35 | SP6 | ab5694 | E6H4 | |
| Vender | Cell Signaling | Abcam | Cell Signaling | LSBio | BD | eBioscience | Thermo Scientific | Abcam | BioRad | Abacam | Ventana | Sigma- Aldrich |
Abcam | Ventana | |
| Host sp | Rb IgG | Ms IgG | Rb IgG | Rb IgG | Ms IgG | Ms IgM | Ms IgG | Rb IgG | Ms IgG | Ms IgG | Rb IgG | Rb IgG | Rb IgG | Ms IgG | |
| Conc. | 1/50 | 1/50 | 1/100 | 1/25 | 1/100 | 1/600 | 1/100 | 1/100 | 1/200 | 1/50 | 1/8 | 1/1000 | 1/200 | Original | |
| Reaction | 1min | RT, 30min | RT, 30min | RT, 60 min | RT, 30min | RT, 30min | RT, 30min | RT, 30min | RT, 30min | RT, 30min | RT, 30min | RT, 30min | RT, 30min | RT, 30min | RT, 30min |
| AEC | 40min | 40min | 40min | 40min | 40min | 20min | 40min | 20min | 20min | 20min | 20min | 20min | 20min | 10min | |
| Cycle2 | Cycle3 | Cycle4 | Cycle5 | Cycle6 | Cycle7 | Cycle8 | Cycle9 | Cycle10 | Cycle11 | Cycle12 | Cycle13 | Cycle14 | Cycle15 | ||
| Cycle1 | R3 | R6 | R8 | R10 | R12 | R14 | R16 | R18 | R20 | R22 | R24 | R26 | R28 | ||
| Primary Ab | DC-LAMP | EOMES | NKp46 | DC-SIGN | CSF1R | CD3 | CD8 | CD163 | MHC II | CD20 | Foxp3 | Tryptase | Pan-CK | ||
| Clone/Product# | 1010E1.01 | ab2283 | 195314 | DC-28 | SP211 | SP7 | SP16 | 10D6 | EPR11226 | SP32 | 236A/E7 | AA1 | AE1/AE3 | ||
| Vender | Novus Biological | EMD Millipore | R&D | Santa Cruz | Abcam | Thermo Scientific | Thermo Scientific | Thermo Scientific | Abcam | Sigma-Aldrich | eBioscience | Abcam | Abcam | ||
| Host sp | Rat IgG | Rb IgG | Ms IgG | Ms IgG | Rb IgG | Rb IgG | Rb IgG | Ms IgG | Rb IgG | Rb IgG | Ms IgG | Ms IgG | Ms IgG | ||
| Conc. | 1/100 | 1/1000 | 1/20 | 1/100 | 1/300 | 1/150 | 1/100 | 1/100 | 1/20000 | 1/2000 | 1/1000 | 1/200000 | 1/2000 | ||
| Reaction | RT, 30min | RT, 30min | RT, 30min | RT, 30min | RT, 30min | RT, 30min | RT, 30min | RT, 30min | RT, 30min | RT, 60min | RT, 30min | RT, 30min | RT, 30min | ||
| AEC | 30min | 20min | 20min | 20min | 20min | 20min | 20min | 20min | 10min | 20min | 20min | 20min | 10min |
R4 at Cycle2: Primary Ab, RORgt (Clone 6F3.1, EMD Millipore, Ms IgG, 1/200, RT, 30min), AEC 10min
Fig. 2.
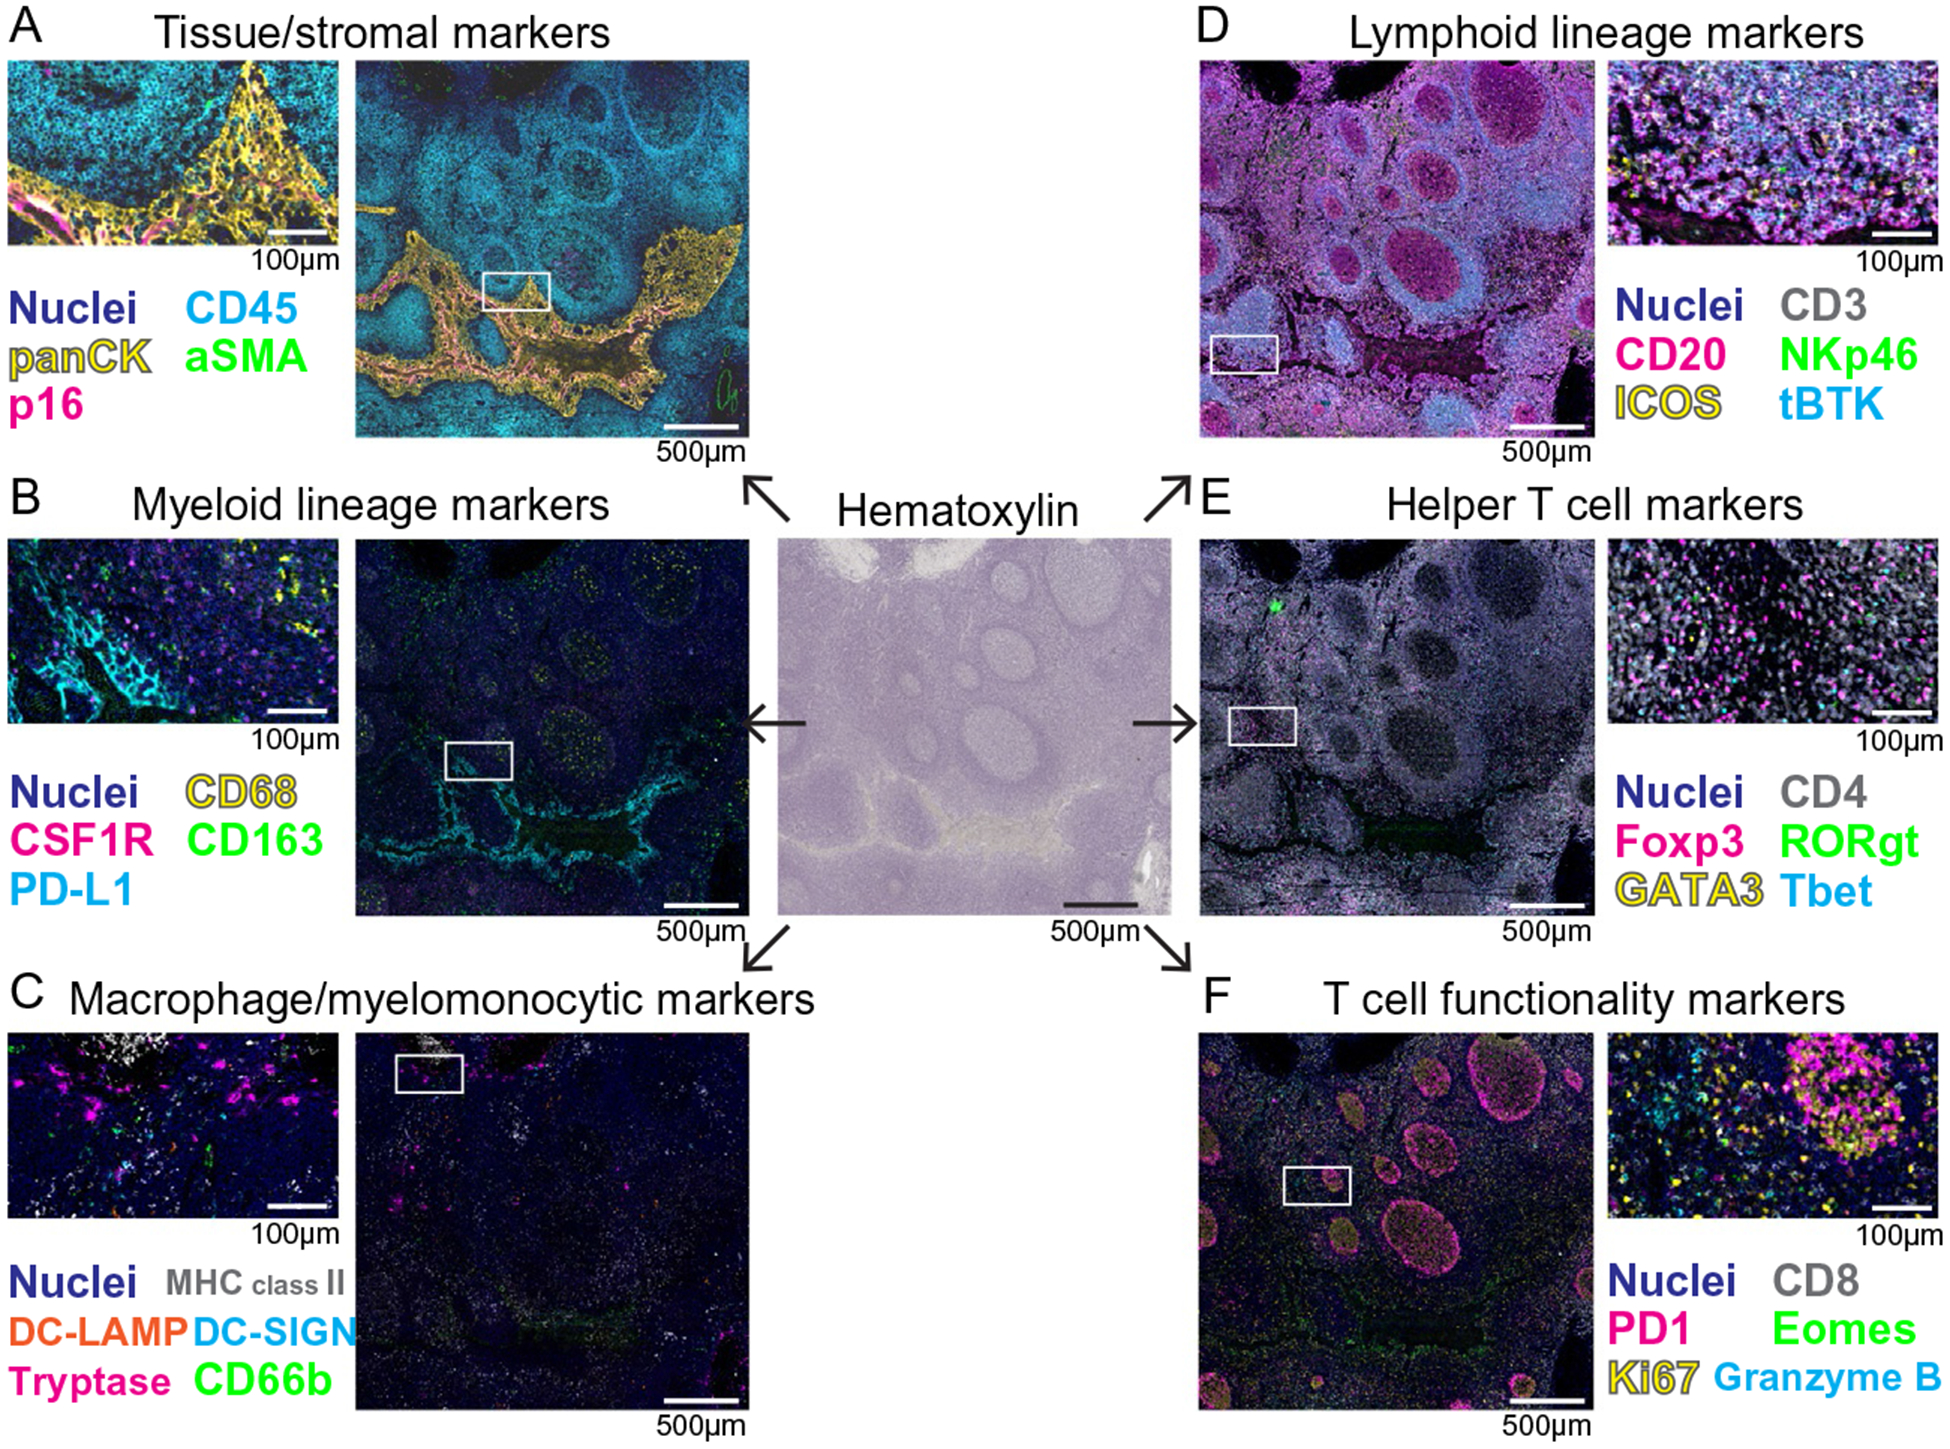
Representative images of 29-biomarker mIHC to visualize immune cell phenotypes in a single FFPE section of human tonsil. Pseudocolored images of mIHC staining based on a single FFPE tissue section of human tonsil. Chromogenic signal was extracted for each marker, pseudocolored and overlaid in ImageJ to simultaneously visualize TiME compartments for tissue/stromal markers (A), myeloid cell lineage markers (B), macrophage/myelomonocytic lineage markers (C), lymphoid lineage markers (D), helper T cell markers (E), and T cell functionality markers (F). The boxes depict magnified areas. Scale bars and colors are shown.
Fig. 3.
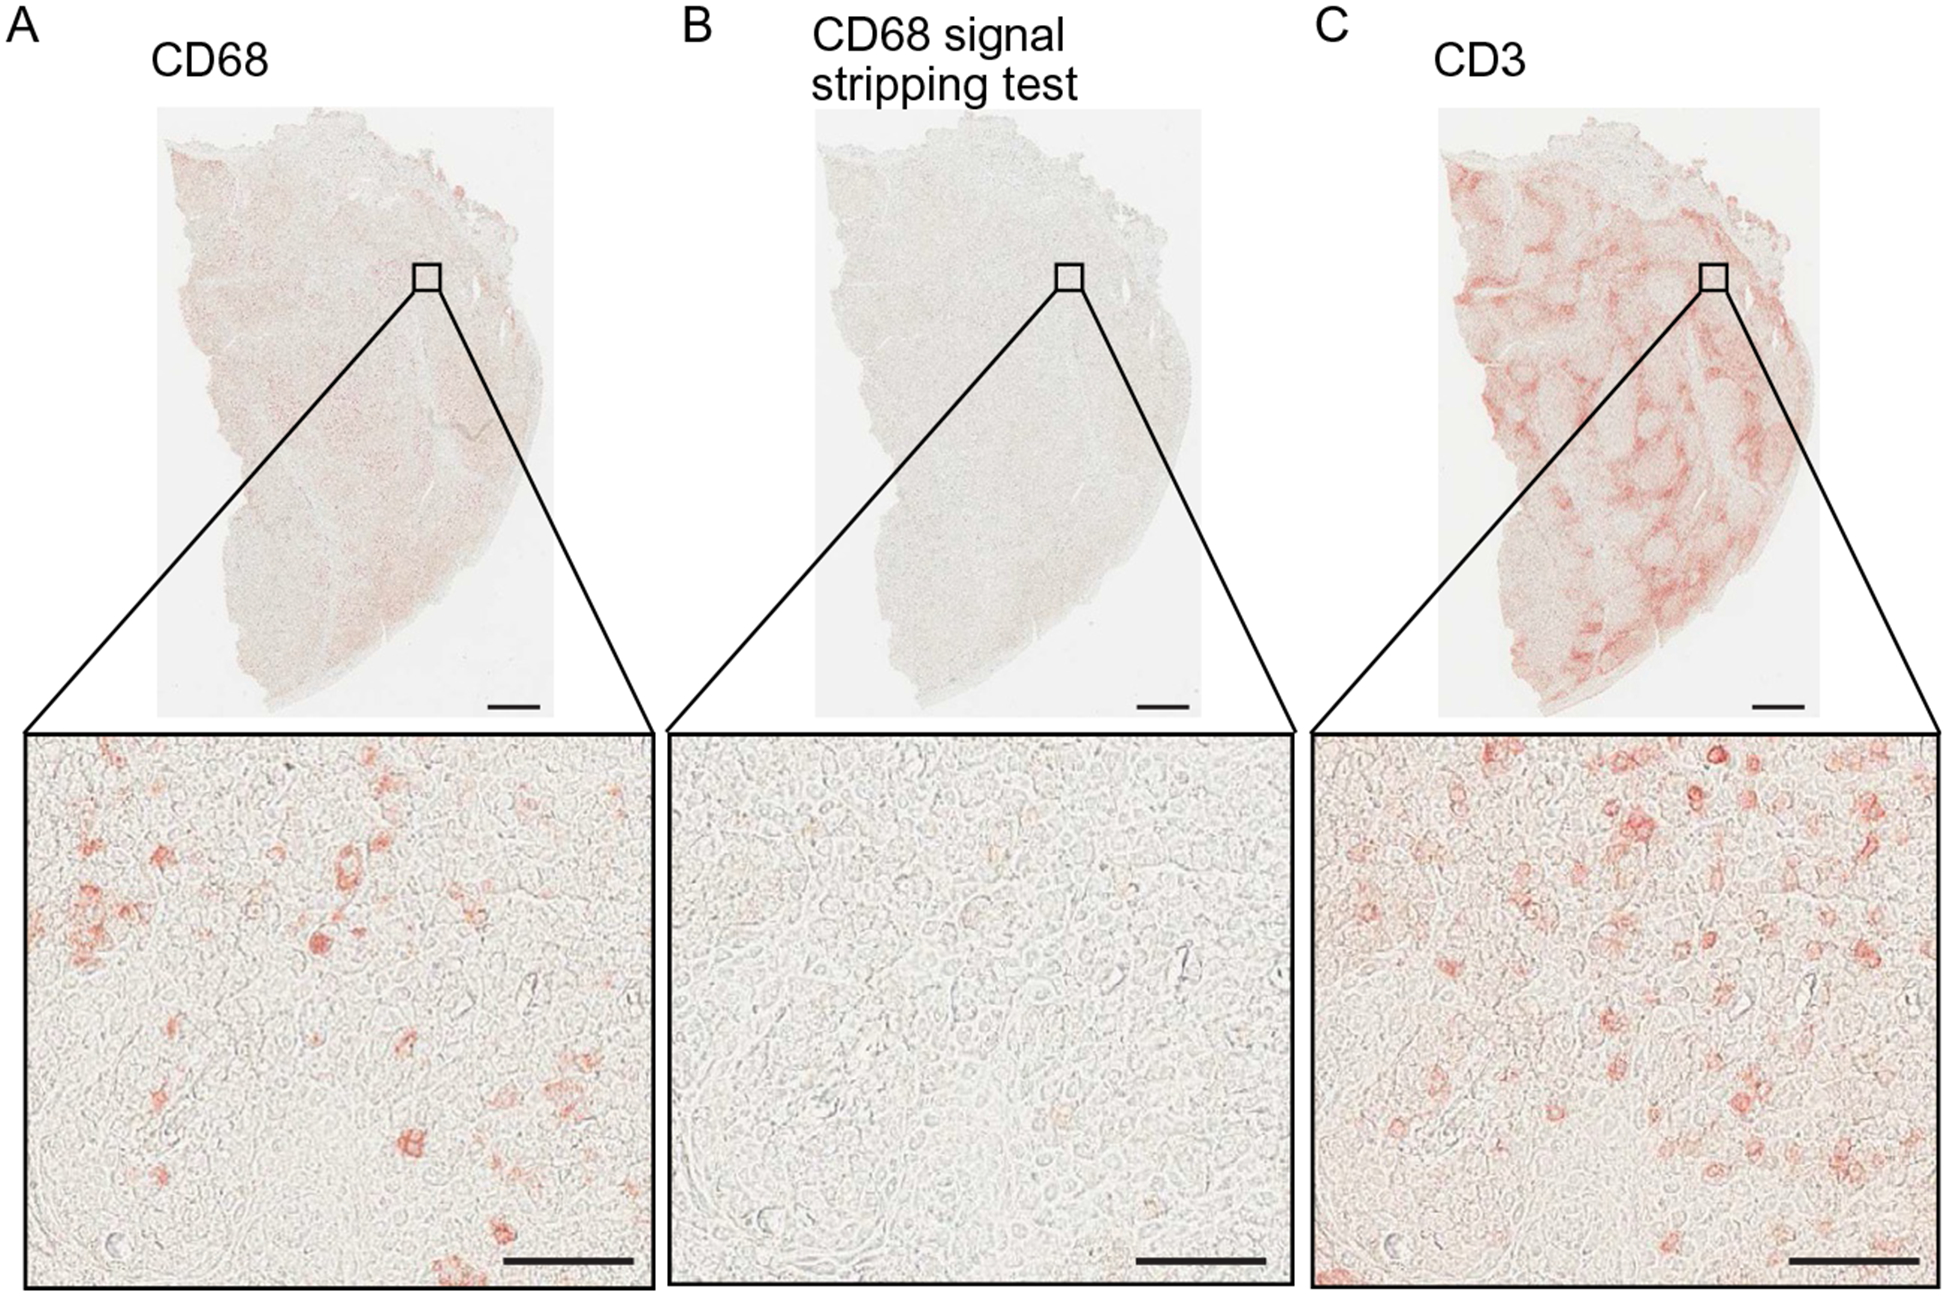
Validation of methanol-based peroxidase inactivation for mIHC. (A) CD68 mIHC visualization (left panel) shows specific and strong staining in human tonsil tissue. Following CD68 visualization, chromogen was stripped and HRP was inactivated using hydrogen peroxidase (0.6%) diluted in 100% methanol. AEC was reapplied and no chromogenic signal was detected (B), confirming efficient and complete stripping of CD68 signal. (C) Then, CD3 antibody was detected with secondary and AEC chromogen, showing distinct, specific, and strong signal. Scale bars=500μm (low magnification) and 50μm (high magnification).
2.2. mIHC images are quantitatively evaluated by image cytometry analysis with preserved tissue-context information
Quantitative assessment is vital for imaging-based biomarker exploration; thus, we utilized an image analysis pipeline including image cytometry for evaluation of the 29-plex images. Image cytometry is a multiparameter cytometric approach via quantification of chromogenic intensities based on single cell segmentation using CellProfiler (Carpenter et al., 2006). Hematoxylin-stained images are used for single cell nuclear segmentation, followed by quantification of chromogenic signals in serial AEC-stained images, enabling “flow cytometry in image” based on multiparametric information including cell size, compactness, and location with chromogenic intensity for each biomarker (Tsujikawa et al., 2017). This quantification was applied to the 29-biomarker multiplex mIHC images, where lymphoid, myeloid, and stromal components were assessed based on hierarchical gating strategies (Fig. 4 and Table 2). The output from this image analysis pipeline is assignment of a phenotype, e.g., tumor cell, CD8+ T cell or macrophage, etc., for each cell in the image. Importantly, image cytometry enables analysis of spatial characteristics based on cell location and tissue context information, enabling in-depth analysis of various immune cell lineages in the tumor-immune microenvironment.
Fig. 4.
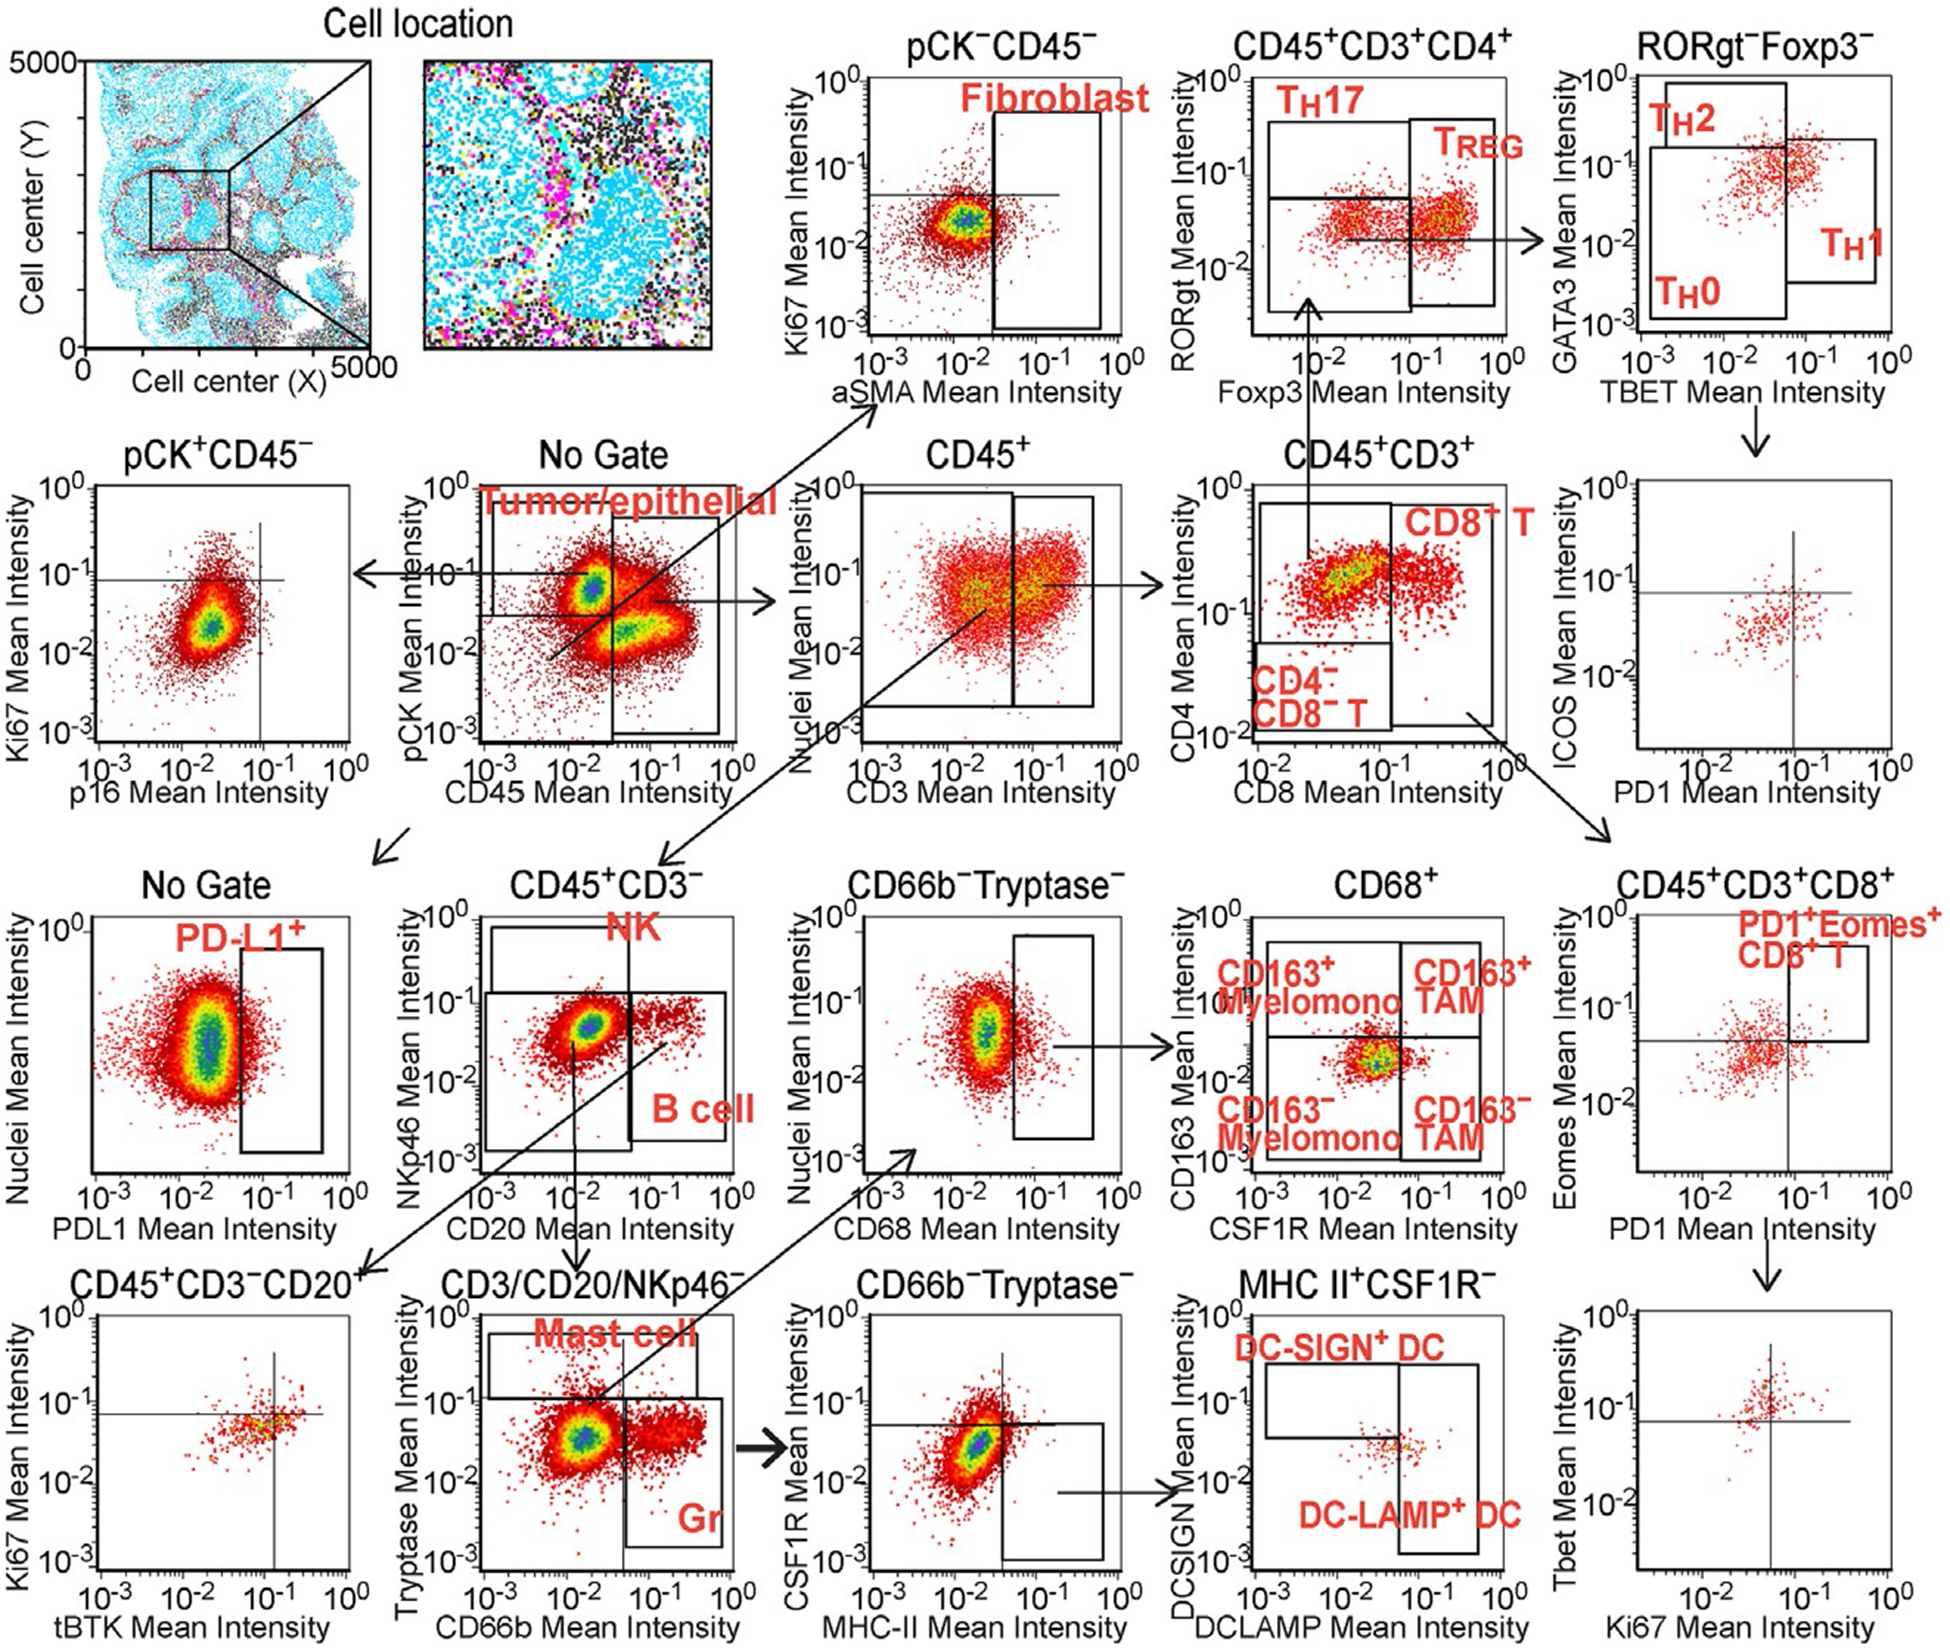
Multiparameter cytometric image analysis toward quantification of the mIHC. Image cytometry-based cell population analyses for 29-biomarkers are shown. The markers used for identification of cell lineages are shown in Table 2. Single cell segmentation results were utilized as templates for quantification of serially scanned AEC images, and pixel intensities of chromogenic signals and area-shape measurements were extracted and recorded by single cell-analysis together with location in original images. Gating thresholds for qualitative identification were determined based on data in negative controls. The x and y axes are shown on a logarithmic scale.
Table 2.
Selective markers utilized for lineage identification.
| Lineage | Identification |
|---|---|
| Neoplastic epithelium | CD45− PanCK+ |
| Myofibroblastic CAFs | CD45− PanCK− aSMA+ |
| TH0 (naïve) helper T cells | CD45+ CD3+ CD4+ CD8− Foxp3- RORgt− Tbet− GATA3− |
| Regulatory T cells (TREG) | CD45+ CD3+ CD4+ CD8− Foxp3+ |
| TH 17 helper T cells | CD45+ CD3+ CD4+ CD8− RORgt+ |
| TH 2 helper T cells | CD45+ CD3+ CD4+ CD8− GATA3+ |
| TH 1 helper T cells | CD45+ CD3+ CD4+ CD8− Tbet+ |
| CD8+ T lymphocytes | CD45+ CD3+ CD4− CD8+ |
| Natural killer cells (NK) | CD45+ CD3− CD20− NKp46+ |
| B cells | CD45+ CD3− NKp46− CD20+ |
| CD66b+ granulocytes | CD45+ CD3/CD20/NKp46− CD66b+ |
| Mast cells | CD45+ CD3/CD20/NKp46− CD66b− Tryptase+ |
| CD163− TAM | CD45+ CD3/CD20/NKp46− CD66b− Tryptase− CD68+ CSF1R+ CD163− |
| CD163+ TAM | CD45+ CD3/CD20/NKp46− CD66b− Tryptase− CD68+ CSF1R+ CD163+ |
| CD163− myelomonocytic | CD45+ CD3/CD20/NKp46− CD66b− Tryptase− CD68+ CSF1R− CD163− |
| CD163+ myelomonocytic | CD45+ CD3/CD20/NKp46− CD66b− Tryptase− CD68+ CSF1R− CD163+ |
| DC-SIGN+ DC | CD45+ CD3/CD20/NKp46− CD66b− Tryptase− CD68− HLA+ DC-SIGN+ |
| DC-LAMP+ DC | CD45+ CD3/CD20/NKp46− CD66b− Tryptase− CD68− HLA+ DC-LAMP+ |
2.3. 29-biomarker mIHC analysis of primary and recurrent HNSCC reveals profound differences in immune cell complexities
To verify the potential of 29-biomarker mIHC, we evaluated matched primary and recurrent HNSCC tumor specimens from 9 patients, as compared to our previous results obtained from 12-plex mIHC imaging of 38 primary HNSCC specimens (Tsujikawa et al., 2017). Following quantification of cell percentages of 17-distinct immune cell lineages identified by image cytometry gating strategies (Fig. 4), immune complexity profiles of primary versus loco-regionally recurrent HNSCC tissues were comparatively assessed (Fig. 5A). In the recurrent status, as compared to newly diagnosed primary HNSCC tumors, the percentage of TH0 and CD20+ B cells significantly decreased while immature DC-SIGN+ DCs and several myeloid lineages increased, indicating presence of distinct immune profiles between primary and recurrent disease (Fig. 5A). Since we previously reported that HNSCC tumors classified into lymphoid and myeloid-inflamed subgroups based on tumor-immune complexity and associated with clinical outcomes (Tsujikawa et al., 2017), we next explored potential immune signatures based on the composition of tumor-infiltrating immune cells. An unsupervised hierarchical clustering analysis revealed presence of two distinct immune complexity profiles, where lymphoid and myeloid lineage cells were differentially present (Fig. 5B). Interestingly, matched newly diagnosed and recurrent primary tumors were generally classified into the same cluster except for two cases (Case #6 and #7, see Fig. 5B, highlighted gray), implying presence of individual host-derived immune signatures maintained throughout recurrence. Notably, the type of immune infiltrate in primary tumors was associated with duration to recurrence, where myeloid-inflamed profiles exhibited shorter progression free survival (PFS) as compared to lymphoid-inflamed profiles (Fig. 5C).
Fig. 5.
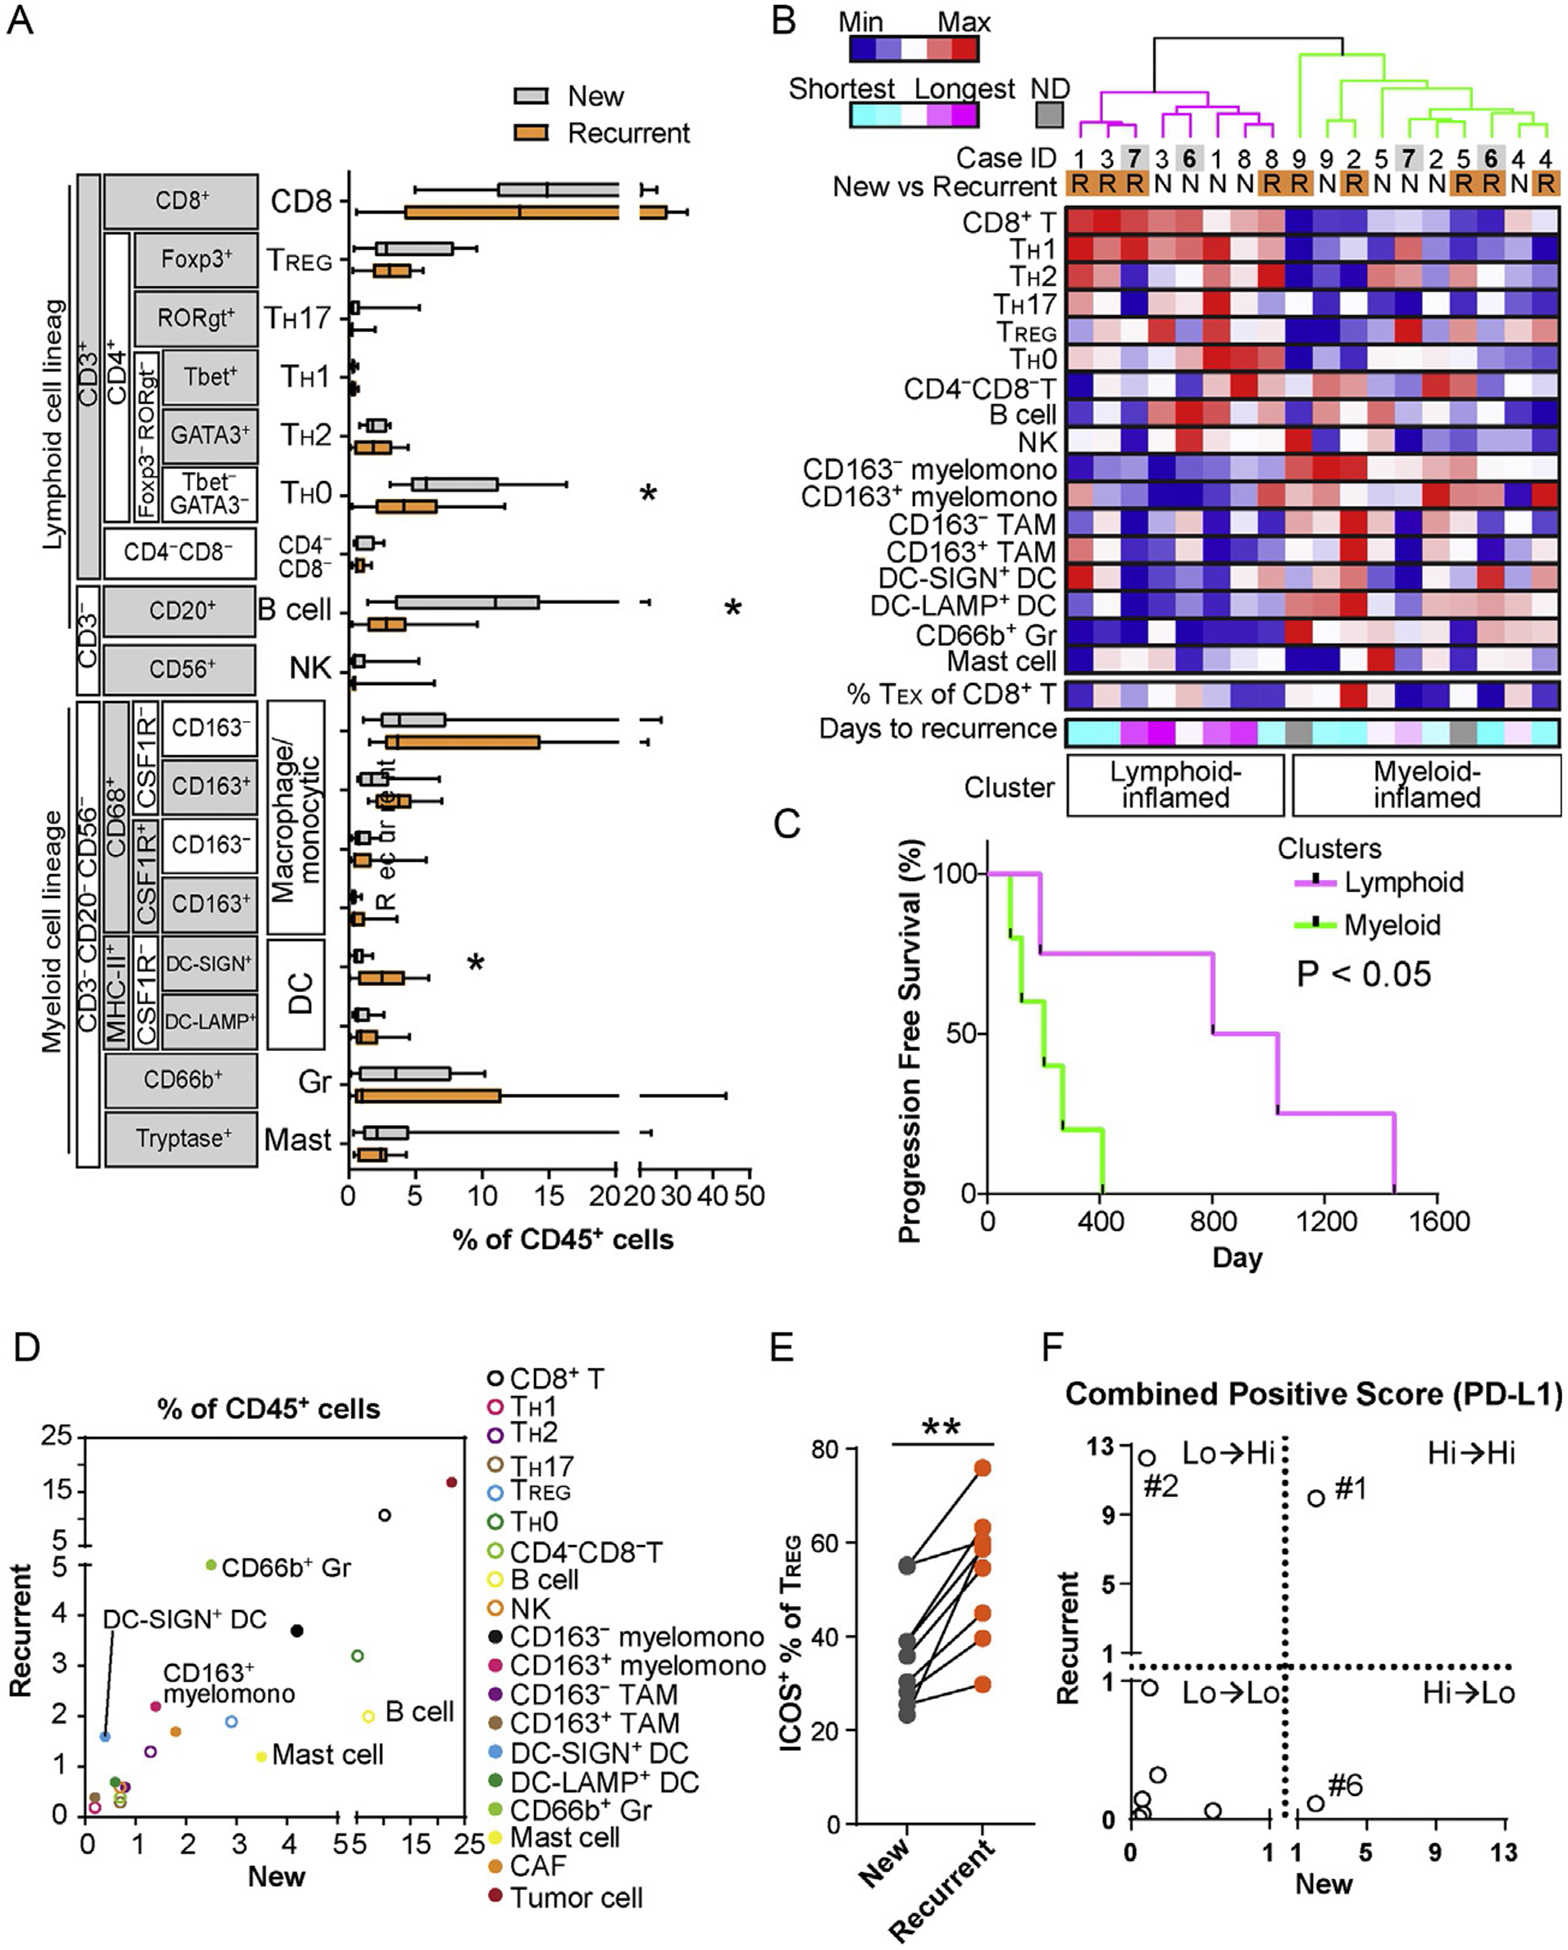
29-Biomarker mIHC analysis of primary and recurrent HNSCC reveals differences in immune cell complexities. (A) Immune cell frequency comparing newly diagnosed primary and recurrent primary tumors (N=9) was quantified as a percentage of total CD45+ cells. Bars, boxes and whiskers represent median, interquartile range and range, respectively. Statistical differences were determined via Wilcoxon signed rank tests, with *P<0.05. (B) Immune cell percentages of total CD45+ cells were shown as a heat map according to a color scale (upper left). The top dendrogram shows the result of unsupervised hierarchical clustering, depicting lymphoid and myeloid-inflamed subgroups. Percentages of dysfunctional (potentially exhausted) PD-1+Eomes+ CD8+ T cells (TEX) and days to recurrence shown at the bottom, according to color scales. (C) Kaplan-Meier analysis of PFS of primary tumors stratified by clusters identified in (B). Statistical significance was determined via log-rank test. (D) Averages of percentages of CD45+ cells were comparatively evaluated in newly diagnosed primary and recurrent primary tumors. (E) ICOS+ percentages of total TREG comparing newly diagnosed primary and recurrent primary tumors are shown (N=9). Statistical difference determined via Wilcoxon signed rank tests, with **P<0.01. (F) Combined positive score (%) of PD-L1 (total PD-L1+ cells/total tumor cells) are compared between newly diagnosed primary and recurrent primary tumors. Numbering shows case ID shown in (B).
As indicated in Fig. 5A, specific immune cell lineages were differentially present in newly diagnosed and recurrent primary tumors, despite generally maintained lymphoid versus myeloid-inflamed profiles, thus, we focused on identification of specific cell lineages associated with primary/recurrent status. Comparative analysis again revealed preserved proportions of immune cell lineages between primary and recurrent status; however, myeloid cell lineages highlighted by CD66b+ Gr and immature DC-SIGN+ DC were more frequently observed in the recurrent status (Fig. 5D), potentially associated with immunosuppressive profiles identified in our previous analyses (Carus, Ladekarl, Hager, Nedergaard, & Donskov, 2013; Chaput, Conforti, Viaud, Spatz, & Zitvogel, 2008; Ilie et al., 2012). Furthermore, as compared with newly diagnosed primary tumors, recurrent primary tumors had significantly higher expression of ICOS by TREG cells (Fig. 5E), a notable finding as this has been associated with dysfunctional antitumor immunity (Tu et al., 2016). Together (Fig. 5D–E), these data indicate that recurrent status associates with increased presence of immunosuppressive cell types in primary tumors. Finally, since PD-L1 expression profiles, especially combined positive scores (CPS) containing PD-L1 of both tumor and immune infiltrates, have been recently identified as a biomarker candidate for immune checkpoint blockade in HNSCC (Rischin et al., 2019), we comparatively evaluated CPS in primary and recurrent status (Fig. 5F), to reveal broad variations in dynamics of PD-L1 scoring. Although several of the cases evaluated herein exhibited preserved PD-L1 scoring in both newly diagnosed and recurrent primary tumors, two of nine (#2 and #6) revealed significant differences, potentially related to phenotypic and proportional changes in tumor and immune cells (Fig. 5F), and highlight the clinical issue of distinct immune complexity profiles in primary and recurrent disease, where myeloid-inflamed profiles are associated with shorter duration to recurrence.
2.4. Longitudinal immunospatial profiling reveals differential spatial pattern of tumor-immune cell distribution in primary and recurrent HNSCC
Since 29-biomarker mIHC serves as a powerful platform to evaluate spatial relationships of tumor-immune lineages with preserved tissue architecture, we sought to develop an analytic workflow to quantitatively assess spatial patterns of tumor and immune cells, comparing primary and recurrent HNSCC (Fig. 6A). Neighbor cell analysis, typically utilized for cell-cell spatial relationship studies, has a fundamental limitation, where cell-cell distance is extensively affected by cell densities. To address this, we adopted pair correlation function analysis (Ripley, 1977; Strand, Robinson, & Bunting, 2007), which represents the probability of finding an object at a distance away from a reference cell, while also normalizing for cell densities (see Section 4, Fig. 6A). This workflow was applied for analysis of spatial relationships between tumor cells and 17 different immune cell lineages. Interestingly, among lymphoid lineages, NK cells had a closer proximity to tumor cells in both primary and recurrent HNSCC compared to CD8+ T cells, indicating exclusion of CD8+ T cells by tumor nests (Fig. 6B). TREG cells were located far from primary tumor cells, while they were much closer in recurrent disease, thus revealing a potential dynamic associated with transition from primary to recurrent status. Among myeloid cell lineages, recurrent primary tumors generally exhibited close proximity between tumor and myeloid cells, indicating presence of myeloid-inflamed microregional profiles (Fig. 6C). Together with observations in Fig. 5, 29-plex mIHC with statistical strategies for spatial pattern analysis revealed longitudinal changes of immunospatial profiles potentially associated with disease progression and locoregional recurrence of HNSCC.
Fig. 6.
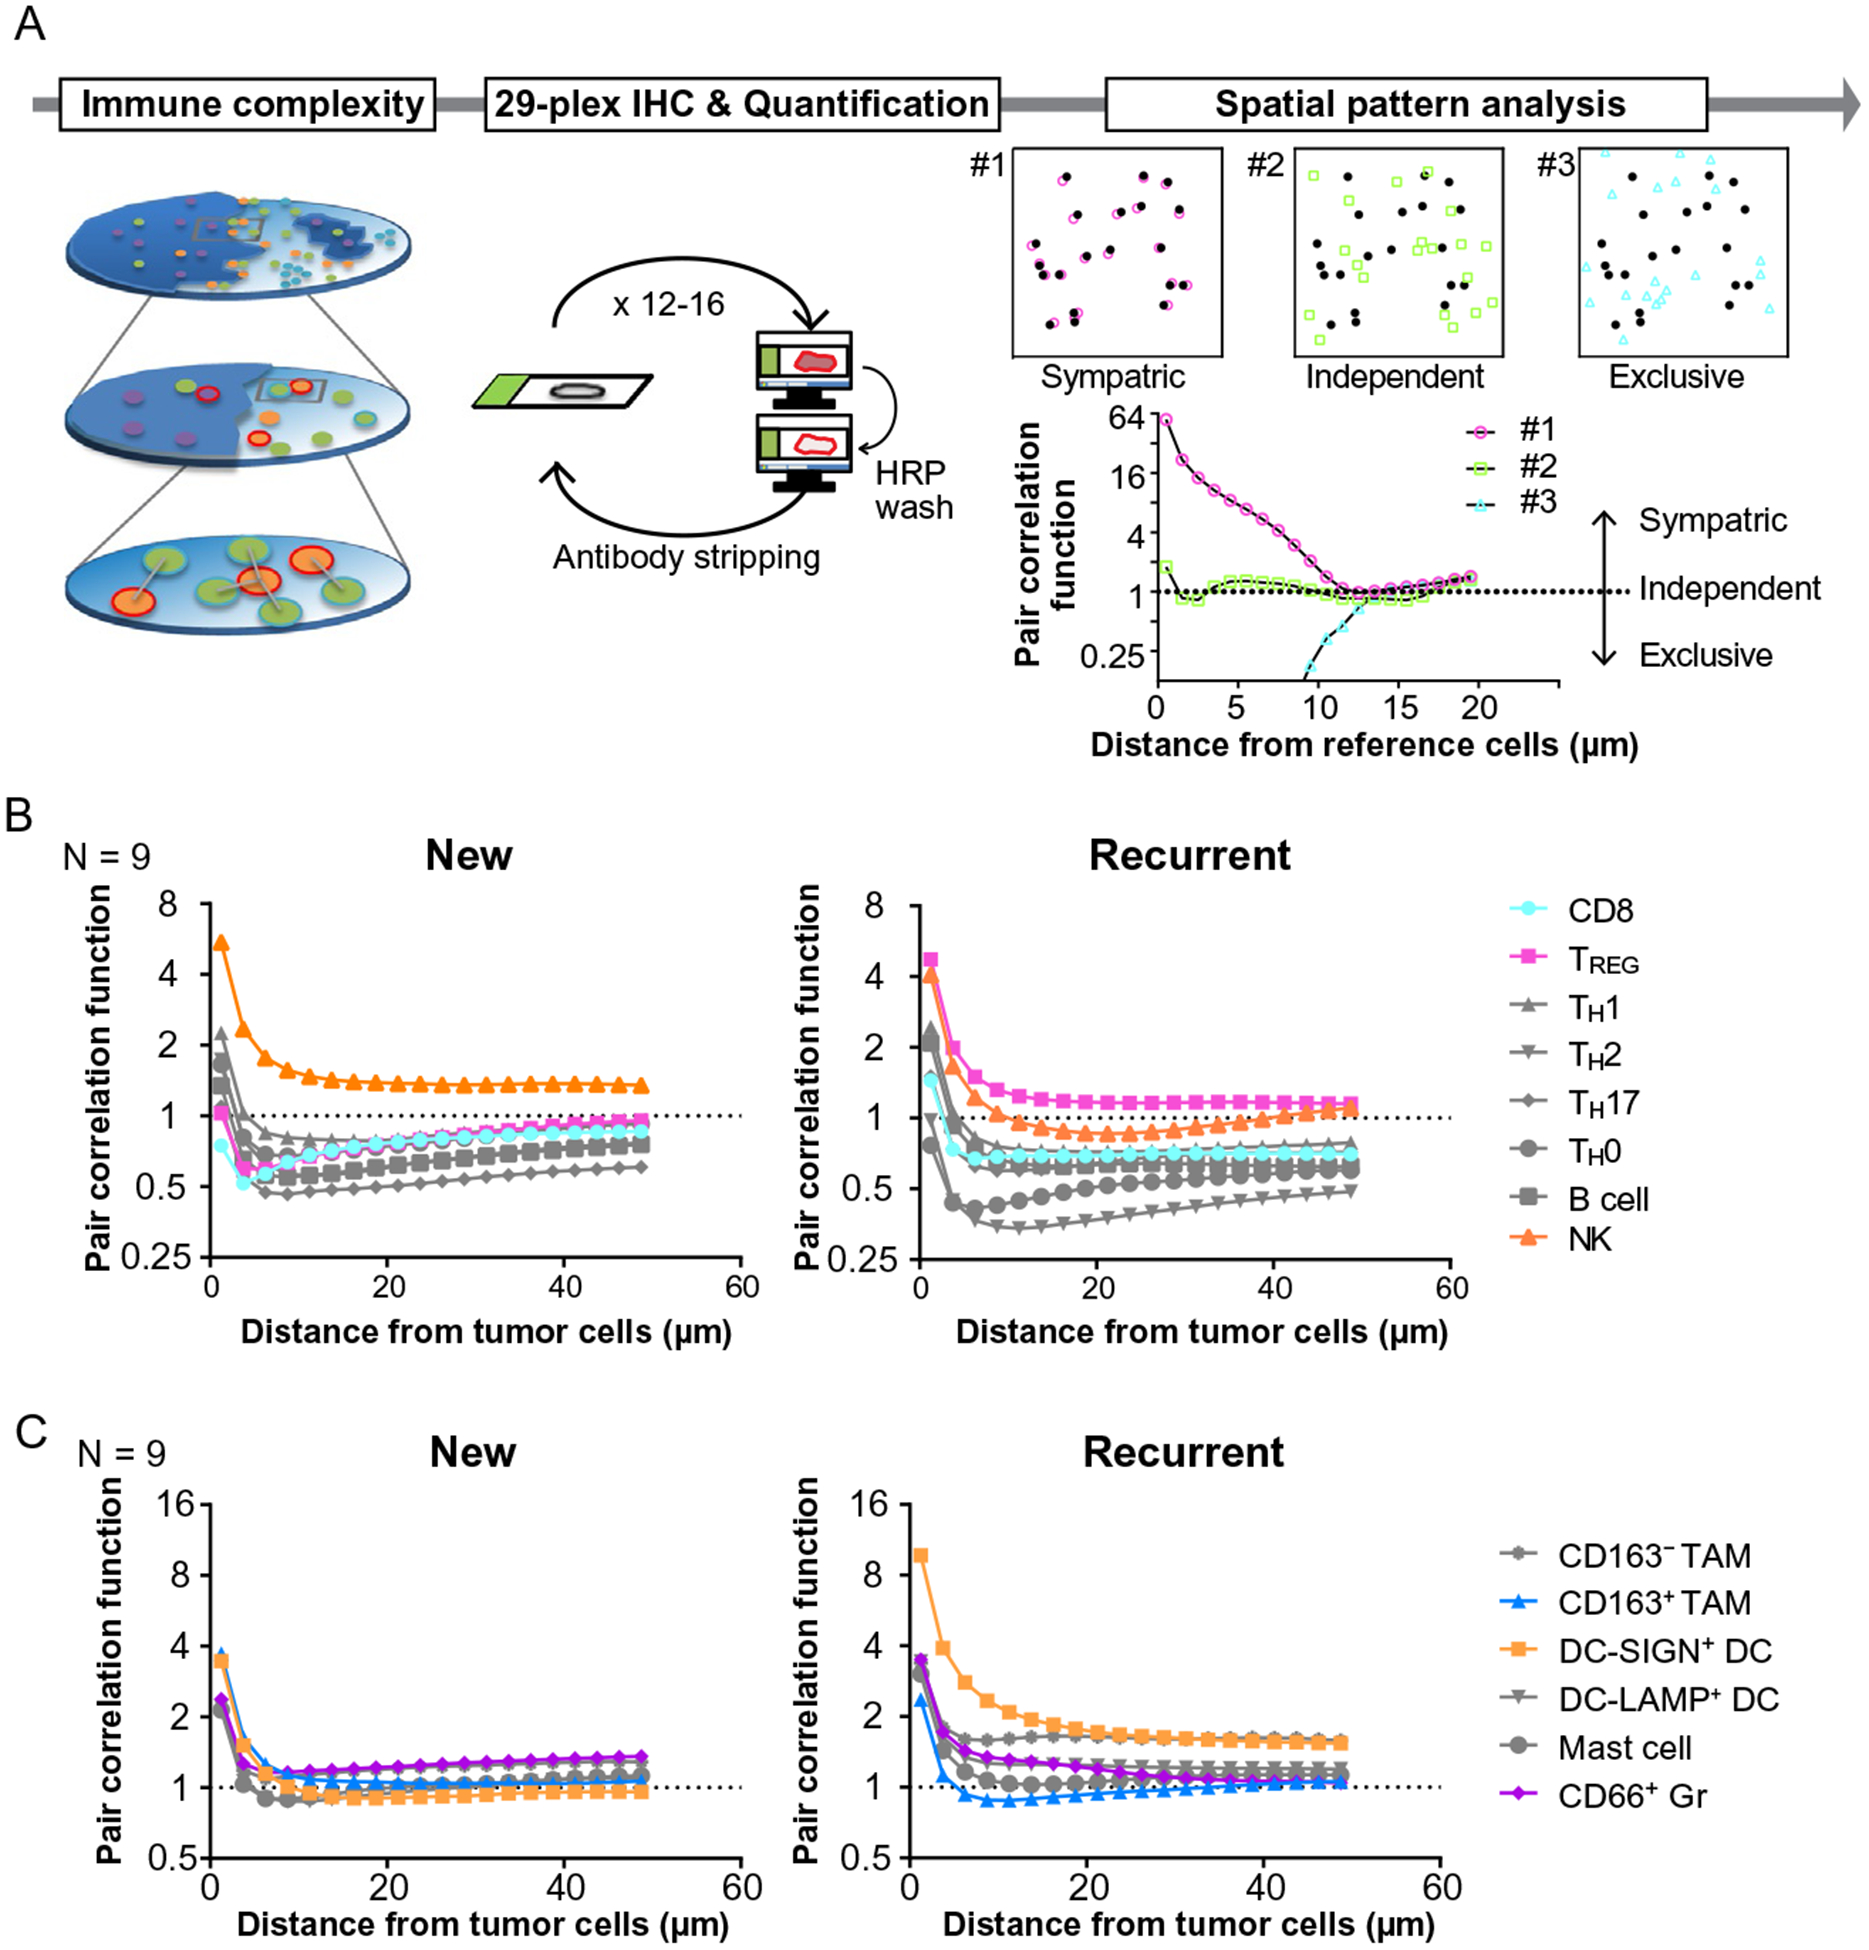
Comparative analysis of primary and recurrent HNSCC reveals the dynamics of immunospatial profiles. (A) A schematic overview of immunospatial complexity analysis based on 29-plex IHC is shown. Spatial pattern analysis performed based on calculation of pair correlation function, which represents the probability of finding an object at a distance away from a reference cell, independent of cell density of object cell lineages. Three examples demonstrate representative patterns of spatial distribution as the value of one stands for independent distribution. (B, C) Averages of pair correlation function based on distance from tumor cells are shown (N=9) in lymphoid (B) and myeloid lineages (C).
3. Discussion
Herein we describe advancement of mIHC methods enabling deep auditing of immune contexture in human cancer specimens. Our previously published mIHC method involved detection of a single antibody species with a peroxidase-conjugated secondary and chromogen, within a single heat-mediated stripping cycle (Tsujikawa et al., 2017). We have advanced this method by instead utilizing chemical inactivation of peroxidase (on the secondary antibody) after detection of the first antibody, thereby enabling detection of two or more antibody species within a single heat-strip cycle. This methodological advancement increases the number of antibody targets that can be detected on a single FFPE section by two- to threefold (29 total in the current study), enabling deeper identification of cellular lineages and functional states. Further, detection of 29+ biomarkers within a single FFPE tissue section is expected to support unprecedented exploration of cell-cell location relationships in the TiME with relatively low cost, ease of adaptation, and flexibility. Altogether this technological advancement supports deeper exploration of immune contexture in human cancers and is expected to enable discovery of predictive biomarkers or targets for therapy.
Accumulating evidence indicates that the TiME regulates disease progression, recurrence and response to therapy in a wide variety of cancer types (Fridman, Pages, Sautes-Fridman, & Galon, 2012; Palucka & Coussens, 2016). Utilizing the 29-plex approach, we focused on comparing contexture and spatial dynamics of immune complexity between primary and recurrent HNSCC; intratumoral immune cell proportions revealed presence of lymphoid and myeloid-inflamed profiles (Fig. 5), similar to our previous studies from head and neck oropharyngeal cancer (Tsujikawa et al., 2017), vaccination-treated pancreatic ductal adenocarcinoma (Tsujikawa et al., 2017), and pathologically aggressive papillary thyroid carcinoma (Means et al., 2019). Importantly, lymphoid-inflamed status in primary tumors was associated with favorable PFS (Fig. 5C), presumably indicating presence of antitumor immunity slowing disease progression. Furthermore, longitudinal analysis comparing newly diagnosed and recurrent primary tumors revealed that recurrent status could be inflamed by myeloid cells especially for immature DC and CD66b+ Gr, together with immunosuppressive ICOS+ TREG, potentially related to mechanisms of disease progression. The present study also focused on PD-L1 scoring of both tumor and immune cells, which has been identified as a candidate biomarker for immune checkpoint blockade in HNSCC (Rischin et al., 2019). Our data revealed a wide range of PD-L1 staining in both newly diagnosed and recurrent primary tumors (Fig. 5F), that could be linked to variation of PD-L1 status reflecting intratumoral heterogeneity, but more likely instead reflecting differential immune profiles associated with longitudinal changes in PD-L1 status.
As Galon and colleagues have developed Immunoscore to characterize the distribution of T cells in the TiME (Fridman et al., 2012; Galon et al., 2006), spatial patterns of immune cells have been considered to provide key information aiding development of immune-related biomarkers. Beyond limitations in conventional IHC- or IF-based approaches, our imaging approach allows evaluation of 17 immune cell lineages, cancer associated fibroblasts and tumor cells in a single tissue with preserved tissue architecture, enabling comprehensive assessment of spatial patterns of cellular components in the TiME (Fig. 6A). In this study, we focused on the immunospatial relationship of various types of immune cells to tumor cells, and found CD8+ T cell exclusion and sympatric distribution of TREG and myeloid cells in recurrent HNSCC (Fig. 6B and C). Although the present study has a considerable limitation due to the small sample size (N=9), requiring careful interpretation of results in the clinical context, our statistical approaches for spatial relationship analysis provide a basis for further extensive immunospatial bioinformatics based on 29-plex mIHC imaging platform.
Finally, this study establishes the validity of a novel 29-plex mIHC technology for analysis of single surgical/biopsy tissue sections and reveals differential immune complexity profiles of recurrent versus primary HNSCC. Those observations provide important insights into potential mechanisms of tumor recurrence and therapeutic failure that will guide future development of biomarker and therapeutic targets in HNSCC.
4. Material and methods
4.1. Clinical samples
Study subjects were nine patients with recurrent HNSCC after definitive surgery, chemotherapy, and/or radiation therapy. Matched FFPE tissue specimens from the newly diagnosed primary and recurrent primary tumors for each patient were obtained from the Oregon Health and Science University (OHSU) Knight Biolibrary. Tissue specimens were de-identified and coded with a unique identifier prior to analysis. Demographic and clinical data including HPV status, tobacco and alcohol use, treatment regimens, and survival outcomes was collected. All HNSCC tumors were staged according to the eighth edition AJCC/UIC TNM classification and cohort characteristics are shown in Table 3. All studies involving human tissue were approved by institutional IRB (protocol #809 and #3609), and written informed consent was obtained.
Table 3.
Patient and disease characteristics.
| Variable | N (%) |
|---|---|
| Average age at diagnosis | 61 |
| Gender | |
| Male | 2 (22%) |
| Female | 7 (78%) |
| Race | |
| White | 8 (89%) |
| Asian | 1 (11%) |
| Tumor site | |
| Oral cavity | 4 (44%) |
| Oropharynx | 2 (22%) |
| Larynx | 3 (33%) |
| Staging | |
| Stage 1 | 2 (22%) |
| Stage 2 | 1 (11%) |
| Stage 3 | 1 (11%) |
| Stage 4 | 5 (56%) |
| HPV status | |
| Negative | 9 (100%) |
| Positive | 0 (0%) |
| Smoking history | |
| Yes | 5 (56%) |
| No | 4 (44%) |
| Alcohol history | |
| Yes | 7 (78%) |
| No | 2 (22%) |
| Management | |
| Platinum + Radiation | 6 (67%) |
| Cetuximab + Radiation | 3 (33%) |
4.2. Sequential immunohistochemistry and image acquisition
This staining methodology builds upon our previously described methods (Tsujikawa et al., 2017), with addition of detecting up to two primary antibody targets in each staining cycle by taking advantage of primaries produced in different species and a robust method to inactivate HRP on secondary antibodies. Sections of FFPE tissue (5μm) were baked at 60°C for 60min, deparaffinized with xylene, and rehydrated in serially graded alcohols, then placed in distilled water. Slides were stained with hematoxylin (Dako, S3301) for 1min, mounted with 1× TBST buffer (Boston Bioproducts, IBB-181R), coverslipped with Signature Series Cover Glass (Thermo Scientific, 12460S), and subjected to whole slide digital scanning at 20× magnification using an Aperio ImageScope (Leica Biosystems). Slides were de-coverslipped with 1.0min of agitation in TBST, endogenous peroxidase activity was blocked (0.6% H202 diluted in methanol, 30min at room temperature), then slides were subjected to heat-mediated antigen retrieval in 1× pH 6.0 citrate buffer (Biogenex Laboratories, HK0809K) for 20min at 95 °C. Then, slides were subjected to 12+ cycles of mIHC, where each cycle started with by annealing multiple primary antibodies, detecting the first primary antibody with a HRP-conjugated secondary antibody following by chromogen development, and whole slide digital scanning. Then, chromogenic signal was stripped and inactivation of the HRP-conjugated secondary used to detect the first primary was achieved by incubating slides with 0.6% hydrogen peroxidase diluted in methanol for 30min. Then, secondary antibody to detect the next primary (that was annealed at the start of the cycle but not visualized yet) was added, AEC chromogen was developed, and digital whole slide imaging was performed. Using this approach allowed the detection of up to two distinct primary antibodies (rounds) within a single heat stripping cycle. The antibodies (clones, manufacturer, and dilution) that were used are listed in Table 1.
4.3. Image processing and analysis
Image processing and analysis were performed using ImageJ Version 1.48 (Schneider, Rasband, & Eliceiri, 2012), CellProfiler Version 2.2.0, and FCS Express 6 Image Cytometry RUO, in analogous to the previously reported 12-plex mIHC image analytic workflow encompassing image processing, visualization, and quantification (Tsujikawa et al., 2017).
For image processing, image coregistration was performed to align images vertically so that single-cell measurements can be associated across images as previously reported (Tsujikawa et al., 2017). Following image coregistration, the images were preprocessed by AEC signal extraction, using a custom macro for color deconvolution in ImageJ Version 1.48 (Schneider et al., 2012), where Color_Deconvolution [H AEC] was used to separate hematoxylin and AEC chromogen signal from background, followed by signal cleaning and background elimination (Ruifrok & Johnston, 2001).
For visualization, images were converted from RGB to CMYK in ImageJ with the NIH plugin RGB_to_CMYK (https://imagej.nih.gov/ij/plugins/cmyk/index.html) to extract AEC signal in the yellow channel, then overlaid in pseudo-color in imageJ and ImageScope (Leica Biosystems).
For quantification, images produced in color deconvolution were utilized to quantify single cell mean intensity signal measurements for every stained marker, using CellProfiler Version 2.2.0 with the pipeline “29Plex_CellProfiler.cpproj.” The pipeline is available under GPLv2 at https://github.com/multiplexIHC/29plex-IHC. All pixel intensity and shape-size measurements were saved to a file format compatible with flow and image cytometry data analysis software, FCS Express 6 Image Cytometry RUO Version 6.05.0028 (De Novo Software). In image cytometry analysis, cell lineages were quantitatively evaluated based on the gating strategy shown in Table 2 and Fig. 4. Gating thresholds for qualitative identification were determined based on data in negative controls. Immune cell numbers were normalized as percentages of total CD45+ cells, and subjected to unsupervised hierarchical clustering based on Ward’s minimum variance method, using “hclust” from “R.”
For spatial analysis, the point pairwise correlation function, Ripley’s K (Ripley, 1977), was used to determine the spatial correlation between subtypes of immune populations. Using FCS Express 6 Image Cytometry RUO, the location for each cell centroid were exported as the coordinate for each cell. Pair correlation function was calculated by algorithms written in C++ (http://takenaka-akio.org/etc/pair_cor/), where an adjacency distance matrix for each cell type of interest was used to determine pair correlations and describe cell patterns in a given region.
4.4. Statistics
Wilcoxon signed rank tests were used to determine statistically significant differences in paired data. Spearman correlation coefficient was used to assess correlations of cell percentages and densities among cell lineages. An unsupervised hierarchical clustering was performed with Ward’s minimum variance method (“hclust” from “R”). All statistical calculations were performed by R software, version 3.5.2 (www.r-project.org). P< 0.05 was considered statistically significant.
Acknowledgments
The authors thank Justin Tibbitts, Teresa Beechwood, and Meghan Lavoie for regulatory and technical assistance. This project was supported by Oregon Clinical and Translational Research Institute (OCTRI, #UL1TR000128) from the National Center for Advancing Translational Sciences (NCATS) at the National Institutes of Health (NIH), OHSU Knight Cancer Institute (P30 CA069533-17), and Grant-in-Aid for Scientific Research (17H07016) from the Japan Society for the Promotion of Science. L.M.C. acknowledges support from the NIH/NCI, Breast Cancer Research Foundation, Susan G. Komen Foundation, Stand Up To Cancer—Lustgarten Foundation Pancreatic Cancer Convergence Dream Team Translational Research Grant, and the Brenden-Colson Center for Pancreatic Health.
References
- Angelo M, Bendall SC, Finck R, Hale MB, Hitzman C, Borowsky AD, et al. (2014). Multiplexed ion beam imaging of human breast tumors. Nature Medicine, 20(4), 436. [DOI] [PMC free article] [PubMed] [Google Scholar]
- Bendall SC, Simonds EF, Qiu P, El-ad DA, Krutzik PO, Finck R, et al. (2011). Single-cell mass cytometry of differential immune and drug responses across a human hematopoietic continuum. Science, 332(6030), 687–696.21551058 [Google Scholar]
- Carpenter AE, Jones TR, Lamprecht MR, Clarke C, Kang IH, Friman O, et al. (2006). CellProfiler: Image analysis software for identifying and quantifying cell phenotypes. Genome Biology, 7(10), R100. [DOI] [PMC free article] [PubMed] [Google Scholar]
- Carus A, Ladekarl M, Hager H, Nedergaard B, & Donskov F (2013). Tumour-associated CD66b+ neutrophil count is an independent prognostic factor for recurrence in localised cervical cancer. British Journal of Cancer, 108(10), 2116. [DOI] [PMC free article] [PubMed] [Google Scholar]
- Chaput N, Conforti R, Viaud S, Spatz A, & Zitvogel L (2008). The Janus face of dendritic cells in cancer. Oncogene, 27(45), 5920. [DOI] [PubMed] [Google Scholar]
- DeNardo DG, Brennan DJ, Rexhepaj E, Ruffell B, Shiao SL, Madden SF, et al. (2011). Leukocyte complexity predicts breast cancer survival and functionally regulates response to chemotherapy. Cancer Discovery, 1(1), 54–67. 10.1158/2159-8274.CD-10-0028. [DOI] [PMC free article] [PubMed] [Google Scholar]
- Fridman WH, Pages F, Sautes-Fridman C, & Galon J (2012). The immune contexture in human tumours: Impact on clinical outcome. Nature Reviews. Cancer, 12(4), 298. [DOI] [PubMed] [Google Scholar]
- Galon J, Costes A, Sanchez-Cabo F, Kirilovsky A, Mlecnik B, Lagorce-Pagès C, et al. (2006). Type, density, and location of immune cells within human colorectal tumors predict clinical outcome. Science, 313(5795), 1960–1964. [DOI] [PubMed] [Google Scholar]
- Gerdes MJ, Sevinsky CJ, Sood A, Adak S, Bello MO, Bordwell A, et al. (2013). Highly multiplexed single-cell analysis of formalin-fixed, paraffin-embedded cancer tissue. Proceedings of the National Academy of Sciences of the United States of America, 110(29), 11982–11987. [DOI] [PMC free article] [PubMed] [Google Scholar]
- Ilie M, Hofman V, Ortholan C, Bonnetaud C, Coëlle C, Mouroux J, et al. (2012). Predictive clinical outcome of the intratumoral CD66b-positive neutrophil-to-CD8-positive T-cell ratio in patients with resectable nonsmall cell lung cancer. Cancer, 118(6), 1726–1737. [DOI] [PubMed] [Google Scholar]
- Means C, Clayburgh DR, Maloney L, Sauer D, Taylor MH, Shindo ML, et al. (2019). Tumor immune microenvironment characteristics of papillary thyroid carcinoma are associated with histopathological aggressiveness and BRAF mutation status. Head & Neck, 1–11. 10.1002/hed.25740. [DOI] [PubMed] [Google Scholar]
- Palucka AK, & Coussens LM (2016). The basis of oncoimmunology. Cell, 164(6), 1233–1247. [DOI] [PMC free article] [PubMed] [Google Scholar]
- Ripley BD (1977). Modelling spatial patterns. Journal of the Royal Statistical Society: Series B: Methodological, 39(2), 172–192. [Google Scholar]
- Rischin D, Harrington KJ, Greil R, Soulieres D, Tahara M, Castro GD, et al. (2019). Protocol-specified final analysis of the phase 3 KEYNOTE-048 trial of pembrolizumab (pembro) as first-line therapy for recurrent/metastatic head and neck squamous cell carcinoma (R/M HNSCC). Journal of Clinical Oncology, 37(15_suppl), 6000 10.1200/JCO.2019.37.15_suppl.6000. [DOI] [Google Scholar]
- Ruffell B, & Coussens LM (2015). Macrophages and therapeutic resistance in cancer. Cancer Cell, 27(4), 462–472. 10.1016/j.ccell.2015.02.015. [DOI] [PMC free article] [PubMed] [Google Scholar]
- Ruifrok AC, & Johnston DA (2001). Quantification of histochemical staining by color deconvolution. Analytical and Quantitative Cytology and Histology, 23(4), 291–299. [PubMed] [Google Scholar]
- Schneider CA, Rasband WS, & Eliceiri KW (2012). NIH Image to ImageJ: 25 Years of image analysis. Nature Methods, 9(7), 671–675. [DOI] [PMC free article] [PubMed] [Google Scholar]
- Sennepin AD, Charpentier S, Normand T, Sarré C, Legrand A, & Mollet LM (2009). Multiple reprobing of Western blots after inactivation of peroxidase activity by its substrate, hydrogen peroxide. Analytical Biochemistry, 393(1), 129–131. [DOI] [PubMed] [Google Scholar]
- Stack EC, Wang C, Roman KA, & Hoyt CC (2014). Multiplexed immunohistochemistry, imaging, and quantitation: A review, with an assessment of Tyramide signal amplification, multispectral imaging and multiplex analysis. Methods, 70(1), 46–58. [DOI] [PubMed] [Google Scholar]
- Strand EK, Robinson AP, & Bunting SC (2007). Spatial patterns on the sagebrush steppe/Western juniper ecotone. Plant Ecology, 190(2), 159–173. [Google Scholar]
- Tsujikawa T, Kumar S, Borkar RN, Azimi V, Thibault G, Chang YH, et al. (2017). Quantitative multiplex immunohistochemistry reveals myeloid-inflamed tumor-immune complexity associated with poor prognosis. Cell Reports, 19(1), 203–217. [DOI] [PMC free article] [PubMed] [Google Scholar]
- Tu J-F, Ding Y-H, Ying X-H, Wu F-Z, Zhou X-M, Zhang D-K, et al. (2016). Regulatory T cells, especially ICOS+ FOXP3+ regulatory T cells, are increased in the hepatocellular carcinoma microenvironment and predict reduced survival. Scientific Reports, 6, 35056. [DOI] [PMC free article] [PubMed] [Google Scholar]


