Abstract
Raspberry ketone (RK) (4-(4-hydroxyphenyl)-2-butanone) is the major compound responsible for the characteristic aroma of red raspberries, and has long been used commercially as a flavoring agent and recently as a weight loss supplement. A targeted UHPLC-QqQ-MS/MS method was developed and validated for analysis of RK and 25 associated metabolites in mouse plasma and brain. Dispersion and projection analysis and central composite design were used for method optimization. Random effect analysis of variance was applied for validation inference and variation partition. Within this framework, repeatability, a broader sense of precision, was calculated as fraction of accuracy variance, reflecting instrumental imprecision, compound degradation and carry-over effects. Multivariate correlation analysis and principle component analysis were conducted, revealing underlying association among the manifold of method traits. R programming was engaged in streamlined statistical analysis and data visualization. Two particular phenomena, the analytes’ background existence in the enzyme solution used for phase II metabolites deconjugation, and the noted liability of analytes in pure solvent at 4 °C vs. elevated stability in biomatrices, were found critical to method development and validation. The approach for the method development and validation provided a foundation for experiments that examine RK metabolism and bioavailability.
Keywords: Design of experiment, surface response modelling, multivariate analysis, metabolomics, random effects ANOVA
Graphical Abstract
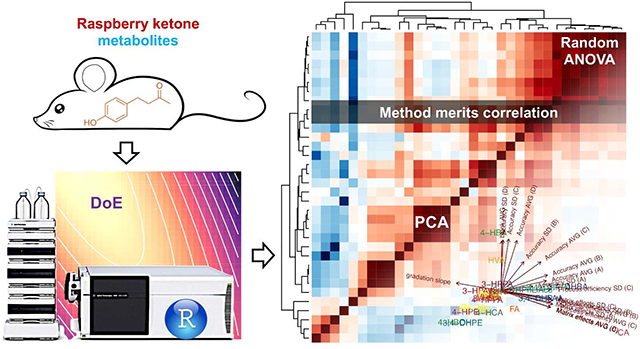
1. Introduction
4-(4-hydroxyphenyl)-butan-2-one or raspberry ketone (RK) is the major aromatic compound responsible for the characteristic flavor of red raspberries (Rubus idaeus) [1], and has been widely used for long time as a generally recognized as safe (GRAS) flavoring substance in foods, perfumery and cosmetics. Due to the low natural concentration (0.01~4 mg/kg fresh weight in raspberries), RK is mainly produced by chemical synthesis.
In recent years, RK has received growing attention for its potential health benefits. RK was shown to reduce lipid accumulation in adipocytes [2, 3], prevent high-fat diet induced obesity in mice [4] and associated nonalcoholic steatohepatitis in rats [5]; and also alleviate ovariectomy-induced obesity in rats [3]. Apart from anti-obesity related benefits, other functions have also been reported, including antiandrogenic activity in the human breast cancer cells [6]; depigmentation activities for zebrafish and mice [7]; anti-inflammatory properties in E.coli lipopolysaccharide-stimulated macrophages [8]; as well as cardioprotective action against isoproterenol-induced cardiotoxicity in rats [9]. Of the many health benefits reported, the anti-obesity effects have attracted most attention, and there has been an increased demand for RK as a food supplement for weight loss in recent years, despite a lack of pharmacokinetics and toxicological data. As such, it is imperative to examine the in vivo bioavailability and toxicity to ensure safe human consumption at the labeled doses in commercial products [10, 11].
In contrast to the abundant number of studies reporting RK’s biological effects, studies on RK metabolism are scarce. In a pioneering work conducted in the 1980s, Sporstøl et al. studied RK metabolites in the urine of rats, guinea-pigs and rabbits using GC/MS [12]. After enzymatic deconjugation, 13 metabolites were identified, with the reduction product 4-(4-hydroxyphenyl) butan-2-ol or raspberry alcohol (ROH) being the predominant one; other metabolites were derived from modification of RK side chain and/or aromatic ring through hydroxylation, methylation, carboxylation and/or decarboxylation. Apart from this landmark study, there has been no other related study reported.
To comprehensively study RK metabolism, pharmacokinetics and bioavailability, and to prepare for translation into clinical trials to assess RK safety / toxicity at the recommended intake amount in RK-enriched supplements, this work focused on development and validation of an ultra-high performance liquid chromatography with a triple quadrupole tandem mass spectrometry (UHPLC-QqQ-MS/MS) method for targeted determination of RK and its metabolites in plasma and brain specimens from mice. In this work, RK and 25 associated metabolites were investigated which were selected based on the potential RK biopathway(s) and structural similarity to RK [13]. Building upon modern MS/MS methodology, improved statistics and visualization tools with streamlined analysis using R programming were applied for method performance evaluation and validation results interpretation.
2. Materials and Methods
2.1. Chemicals and reagents
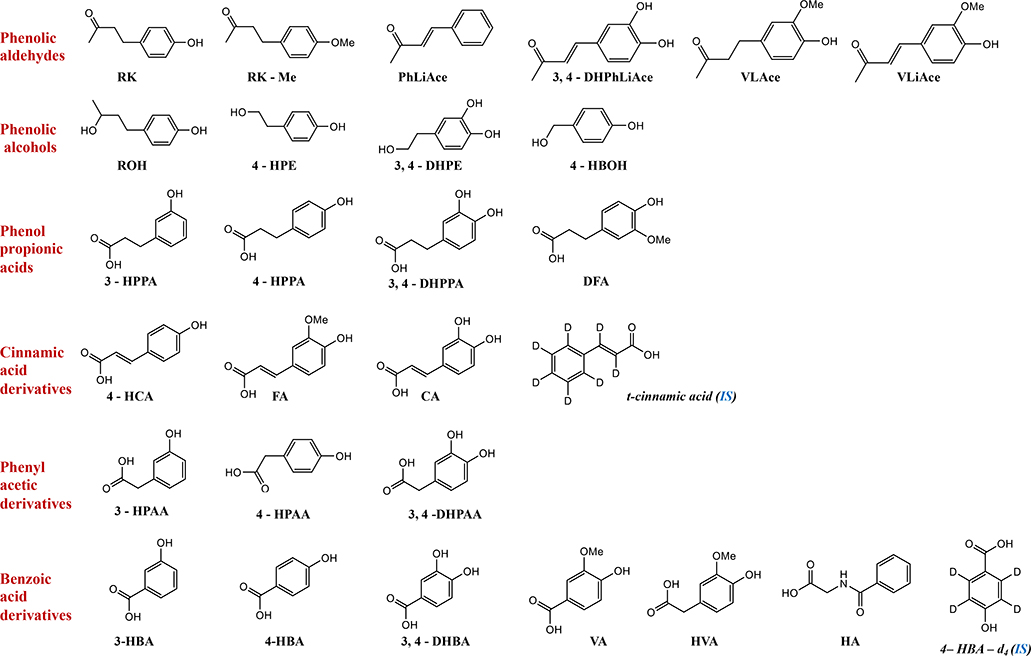
Standards of analytes (analytical or reference grade) used included RK (1), and its phenolic aldehyde derivatives, 4-(4-methoxyphenyl)-2-butanone (RK-Me) or anisylacetone (2), benzylideneacetone (PhLiAce) (3), 3, 4-dihydroxybenzylideneacetone (3,4-DHPhLiAce) (4), vanillylacetone (VLAce) (5), vanillylidenacetone (VLiAce) (6); phenolic alcohol derivatives, ROH (7), 2-(4-hydroxyphenyl) ethanol or tyrosol (4-HPE) (8), 2-(3, 4-dihydroxyphenyl) ethanol (3, 4-DHPE) or 3-hydroxytyrosol (9), 4-hydroxybenzyl alcohol (4-HBOH) (10); phenylpropionic derivatives, 3-(3-hydroxyphenyl) propionic acid (3-HPPA) (11), 3-(4-hydroxyphenyl) propionic acid (4-HPPA) (12), 3-(3, 4-dihydroxyphenyl) propionic acid (3, 4-DHPPA) (13), 3-(3-methoxy, 4-hydroxyphenyl) propionic acid or dihydroferulic acid (DFA) (14); cinnamic acid derivatives, 4-hydroxycinnamic acid (4-HCA) or p-coumaric acid (15), ferulic acid (FA) (16), caffeic acid (CA) (17); phenyl acetic derivatives, 3-hydroxyphenylacetic acid (3-HPAA) (18), 4-hydroxyphenylacetic acid (4-HPAA) (19), 3, 4-dihydroxyphenylacetic acid (3, 4-DHPAA) (20); benzoic acid derivatives, 3-hydroxybenzoic acid (3-HBA) (21), 4-hydroxybenzoic acid (4-HBA) (22), 3, 4-dihydroxybenzoic acid or protocatechuic (3, 4-DHBA) (23), vanillic acid (VA) (24), homovanillic acid (HVA) (25), and hippuric acid (HA) (26). In addition, trans-cinnamic acid-d7 (27) and 4-hydroxybenzoic-d4 acid (28) were used as internal standards (ISs). The chemical structures are presented in Fig. 1. The aforementioned standards, and ascorbic acid and β-glucuronidase (from limpets (Patella vulgate), ≥85,000 units/mL in contamination with sulfatase) were purchased from Sigma-Aldrich (St. Louis, MO), except that standards of 4 and 14 from Alfa Aesar (Tewksbury, MA), 7 from USP (Rockville, MD), 16 and 23 from ChromaDex (Irvine, CA). Other reagents including methanol, ethyl acetate, glacial acetic acid, formic acid, concentrated hydrochloric acid and LC/MS grade water and acetonitrile were obtained from Fisher Scientific (Pittsburgh, PA). Associated reagent solution preparation for various purposes refers to the supplementary information.
Fig. 1.
Analytes’ structure, categories and abbreviations. Abbreviations refer to section 2.1.
2.2. Instrument
Analytical work was performed using an Agilent 1290 Infinity II UHPLC coupled with 6470 triple quadrupole mass spectrometry (QqQ-MS/MS) with an electrospray ionization (ESI) source (Agilent Technologies, Santa Clara, CA). Nitrogen from a Parker Balston NitroFlow60NA nitrogen generator (Lancaster, NY) was used as the nebulizer gas and collision gas. Chromatographic separation was achieved using a Waters Acquity UPLC BEH C18 column (2.1 × 50 mm, 1.7 μm) with a VanGuard Acquity C18 guard column (2.1 × 5 mm, 1.7 μm) (Milford, MA).
2.3. Mice plasma and brain collection
Seven-week old male C57BL/6J mice (Jackson Laboratory, Bar Harbor, ME) fed on polyphenol-free diet were deeply anesthetized with isoflurane 5% with oxygen for blood collection by cardiac puncture. Plasma was acquired after blood centrifugation at 3000 ×g for 10 min at 4 °C, and then acidified with 2% formic acid to a final concentration of 0.2% (v/v). After cardiac puncture and exsanguination, and perfusion with 0.9% saline, brains were excised, homogenized with 0.2% formic acid (1:2, w/v) and snap frozen in liquid nitrogen. Plasma and brain were stored at −80 °C before analysis. All protocols involving animals were approved by the Institutional animal Care and Use Committee of Rutgers University (OLAW #A3262–01, protocol #13–001).
2.4. Sample preparation
For preparation of reference standard solution, about 15 mg of each standard was accurately weighted and prepared in 25 mL 70% methanol with 0.1% formic acid as stock solution, as then separately aliquoted into 1.5 mL Eppendorf tubes and stored under −80°C. Stock solutions for each compound (except internal standards (IS)) after conditioned to room temperature were mixed as a standard cocktail, and then diluted with 60% methanol with 0.1% formic acid to desired concentration (~200 ng/mL) for instrumental optimization, or diluted with the same solvent into serial concentration (0.1 ng/mL ~ 6 μg/mL) with spiked IS (~100 ng/mL) for calibration. For β-glucuronidase solution (~2000 U) preparation, the original enzyme extract was diluted by 40 times using NaH2PO4 buffer (0.4 mol/L, pH 5.0).
For analyte extraction from biomatrices, an aliquot of 100 μL plasma was thawed on ice followed by adding 5 μL of each IS solution (ca 2 μg/mL), 300 μL of 0.4 M NaH2PO4 buffer (pH 5.4), and 50 μL of β-glucuronidase solution (~2000 U diluted in NaH2PO4 buffer). The cocktail was gently mixed, briefly purged with nitrogen to exclude headspace oxygen, and then incubated at 37°C for 45 minutes. The analytes were then extracted with 500 μL of ethyl acetate, vigorously vortexed for 10 sec, sonicated in ice water for 10 min, and then centrifuged at 5000 ×g for 5 min. The supernatant was collected in a glass tube containing 20 μL 2% ascorbic acid methanol solution. The precipitate was then extracted in like manner for two more times. The pooled supernatant was dried under a gentle stream of nitrogen. The residue was reconstituted in 100 μL of 60% methanol containing 0.1% formic acid, centrifuged at 16, 000 ×g for 10 min before LC-MS analysis. The brain samples were processed in similar procedure as plasma, except the following: the tissue amount used was 500 μL; enzyme solution amount used was 100 μL; after incubation, 100 μL of 4% HCl was added before extraction to denature and precipitate proteins.
2.5. UHPLC-QqQ-MS/MS method
For chromatographic separation, water with 0.1% acetic acid (AA) was used as mobile phase A and acetonitrile with 0.1% AA as phase B, with a flow rate at 0.45 mL/min. The gradient elution (noted as B%) was 5% at 0 min; 10% at 0.5 min; 28% at 3.8 min; 40% at 3.9 min; 55% at 5.5 min; 80% at 5.6 min and then held isocratically until 6 min. The column was equilibrated for 2.5 min before next injection. The column was thermostatted at 30 °C and the autosampler maintained at 4°C. The injection volume was 3.5 μL.
For MS analysis, a further statistical analysis was conducted upon prior reported RK ESI fractional factorial design [14] as preparation for ESI optimization of all other 25 analytes. Dispersion analysis was conducted to investigate instrumental stability operated at each parameter level, and projection analysis was performed to select and confirm important ESI parameters for further optimization [15]. Following that, drying gas temperature (DGT), drying gas flow rate (DGF) and nozzle voltage (NV), confirmed as the most important ESI parameters, were then further tuned for all analytes, particularly with DGT and DGF optimized collectively by central composite design (CCD). The final ESI conditions were set at DGT 200°C, DGF 12 L/min, and NV +1500 / −1000 V; as to other ESI settings, nebulizer pressure at 30 psi, sheath gas temperature at 250 °C with its flow rate at 8 L/min, and capillary voltage at + 3000 V/ − 2500 V. The MS was operated in dynamic multiple reaction monitoring (dMRM) mode with switching polarities, optimized as previously described [14, 16].
2.6. Method validation
The validation procedure followed U. S. Food and Drug Administration guidelines and relevant literature [17, 18] with necessary adaptation. For accuracy assessment, quality control samples (QCS’s) were prepared by spiking blank biomatrices with standard mixture containing all analytes at four levels (A, 2000 ng/mL; B, 1000 ng/mL; C, 150 ng/mL; and D, 15 ng/mL, concentration in final processed samples to be injected), each level with five replicates. All QCS’s were injected in randomized order, with duplicate injections spaced by ca 10 hours in a single sequence as a simulation of a typical batch time. Accuracy was computed following the rule of error propagation and random effects analysis of variance (RND-ANOVA). Repeatability was calculated as the mean square error associated with RND-ANOVA variance partition. Validation of matrix effects, recovery and processing efficiency, adapted from the approach by Matuszewski et al. [19, 20], comprised two-level (B, C) spiking post-extraction (vs. spiking pre-extraction for accuracy validation) and spiking in pure solvent, with calculation following the error propagation rule. Method validation results and associated statistical quantities were then subjected to multivariate correlation analysis and principle component analysis (PCA) [21]. Associated formulas are shown in Supplementary Material.
2.7. Statistics analysis
Microsoft Excel (version 16.16.5), Design Expert (version 8.0.6) and R (version 1.1.463) were used for statistical computation [22, 23]. The R script constructed for data analysis refers to https://yuanbofaith.github.io/RK_LCMS/. The original data from which the script reads refer to the Supplementary Material.
3. Results and Discussion
3.1. ESI dispersion and projection analysis
Dispersion analysis upon a prior reported RK-oriented ESI fractional factorial design [14] revealed in this work higher measurement volatility at the elevated level of nebulizer pressure as well as sheath gas flow, and thus the lower levels for both settings were used in the developed method of this work. The magnitude of other ESI settings did not exert noticeable impact on performance consistency (Fig. S1).In addition, the prior work reported the large effects of DGT, DGF and NV, yet without considering what is known as the alias structure, i.e., the apparent effects of investigated factors were in fact confounded or “contaminated” with other effects (see Supplementary spreadsheet “Fractional factorial”). To clear-up the alias effects, projection analysis was conducted in this work by collapsing the original design into two replicates of 23 full factorial design of DGT, DGF and NV (Tables S1–S3) while treating other ESI factors as background noise, and indicated more than 70% accountability for total data variability from the three factors alone. As such, the three factors were subjected to further optimization for all metabolites investigated.
3.2. DGT and DGF optimization by CCD
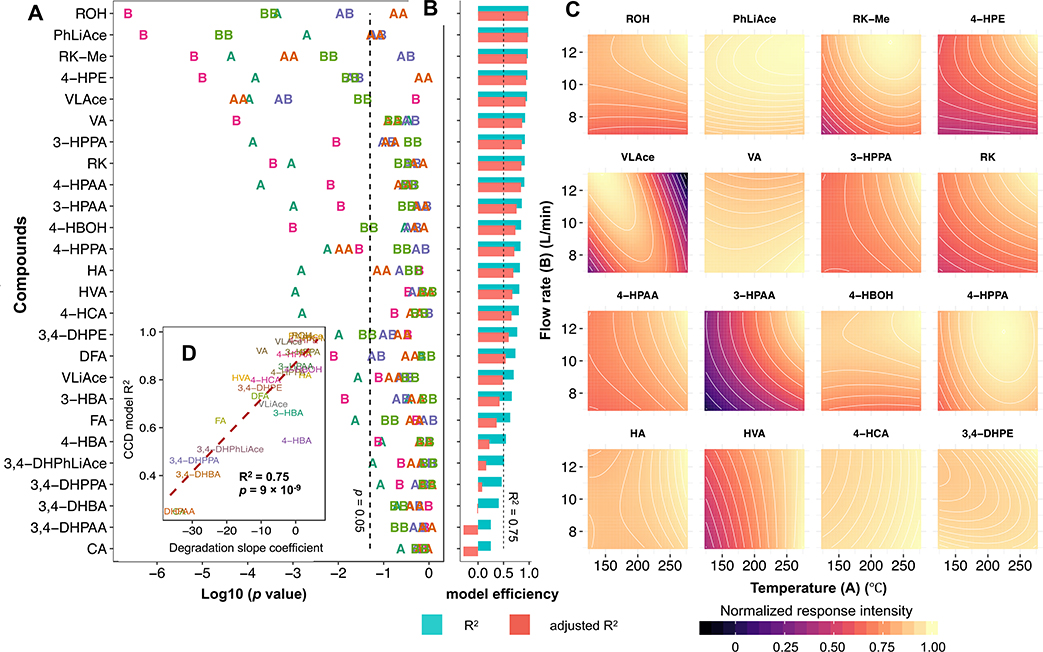
As DGT and DGF presented strong interaction while negligible interaction with NV as suggested by projection analysis, DGT and DGF were collectively optimized using CCD (unlike NV tuned independently), with CCD design displayed in Table S4. A quadratic model was used to approximate signal responses of all analytes, shown in Fig. 2A–C. Generally, higher signal response was favored by increased DGF, and thus 12 L/min was selected as the final DGF. For DGT, special consideration was given to VLAce and 3-HPAA, both of which showed highest susceptibility to DGT but in an opposite manner, i.e., one was favored at low level while the other at high end. As such, 200°C was selected as the DGT. Modelling efficiency was strongly associated with measurement consistency, which was manifested by the degree of scattering of CCD center points (repetitive measurements at the middle level of the tested factors), as shown in Fig. S2.. Compound degradation over the period of CCD batch time was later found to be the cause of measurement inconsistency, accounting for 75% of modelling inadequacy, as shown in Fig. 2D and Fig. S3.
Fig. 2.
Optimization of electrospray ionization (ESI) drying gas temperature (DGT, factor A) and drying gas flow rate (DGF, factor B) using central composite design (CCD) quadratic model. Plot (A) shows the p values of term coefficients. For term annotations, letters A and B refer to the main effects of factors A, and B, respectively; AB, the interaction effects; AA and BB, the corresponding quadratic effects. Plot (B) displays the model coefficient of determination (R2) and adjusted R2. Plot (C) shows representative contour plots. Plot (D) presents the correlation of model efficiency with compound stability. Plots (A) and (B) share the same y-axis. Compounds are arranged in decreasing order of R2.
3.3. dMRM transitions
The dMRM parameters are displayed in Table 1. Generally, phenolic acids showed higher sensitivity under negative than positive polarity by easy deprotonation of the carboxylic group. Most product ions were formed by subsequent loss of the carboxyl group by 44 Da, in agreement with prior research [24]. Other product ions were generated by loss of a methyl group for the precursors with methoxy group (e.g., VA, 167 -> 152 m/z; FA, 193 -> 178 m/z), cleavage of a phenyl bond (e.g., HA, 178 -> 77 m/z) or rupture of the aromatic ring (e.g., 3-HPAA, 151 - > 65 m/z). Phenolic aldehydes and alcohols generally exhibited higher sensitivity under positive polarity, and in-source fragmentation was noticeable for many such compounds. RK and its respective reduced and methylated derivatives ROH and RK-Me, for example, had intense in-source fragmentation by cleavage of the beta-bond (or the equivalent benzyl bond) [14], and 4-HPE featured in-source dehydration. Fragmental ions produced in the ESI chamber if predominant were selected as the precursor ions for MRM transitions. Such in-source phenomenon rendered analogues RK, ROH and 4-HBOH spectrometrically undistinguishable by having identical MRMs, but they were efficiently resolved chromatographically.
Table 1.
Compounds and dynamic multiple reaction monitoring (dMRM) parameters of the developed method.
| Elution order | Compounds | MW (Da) | RT (min) | Pol | Precursor (m/z) | Frag (V) | Quantifier (m/z) | CE (eV) | Qualifier (m/z) | CE (eV) | ratio | Dwell time (ms) | IS |
|---|---|---|---|---|---|---|---|---|---|---|---|---|---|
| 1 | 4-HBOH | 124 | 1.01 | + | 107.0 | 45.0 | 77.0 | 24 | - | - | - | 38 | 1 |
| 2 | 3,4-DHBA | 154 | 1.02 | - | 153.0 | 86.0 | 109.1 | 12 | 108.1 | 28 | 25 | 31 | 1 |
| 3 | 3,4-DHPE | 154 | 1.06 | - | 153.1 | 85.0 | 123.2 | 14 | 122.4 | 23 | 6 | 31 | 1 |
| 4 | 3,4-DHPAA | 168 | 1.19 | - | 167.0 | 60.0 | 123.1 | 5 | - | - | - | 27 | 1 |
| 5 | 4-HBA | 138 | 1.43 | - | 137.0 | 74.0 | 93.1 | 16 | - | - | - | 25 | 1 |
| 6 | 4-HPE | 138 | 1.42 | + | 121.1 | 60.0 | 77.1 | 24 | 51.2 | 44 | 50 | 23 | 1 |
| 7 | HA | 179 | 1.56 | - | 178.1 | 80.0 | 134.1 | 8 | 77.2 | 16 | 37 | 22 | 1 |
| 8 | 4-HPAA | 152 | 1.61 | - | 151.0 | 70.0 | 107.2 | 0 | - | - | - | 21 | 1 |
| 9 | IS-1 | 142 | 1.4 | - | 141.1 | 73.0 | 97.1 | 16 | 69.1 | 36 | 8 | 32 | - |
| 10 | 3,4-DHPPA | 182 | 1.62 | - | 181.1 | 80.0 | 137.1 | 9 | 59.2 | 13 | 22 | 21 | 1 |
| 11 | VA | 168 | 1.67 | - | 167.0 | 80 | 152.0 | 12 | 108.1 | 16 | 30 | 21 | 1 |
| 12 | CA | 180 | 1.69 | - | 179.0 | 88.0 | 135.1 | 16 | 89.1 | 36 | 2 | 21 | 1 |
| 13 | 3-HBA | 138 | 1.8 | - | 137.0 | 88.0 | 93.1 | 8 | - | - | - | 21 | 1 |
| 14 | HVA | 182 | 1.85 | - | 181.1 | 58.0 | 137.1 | 4 | 122.1 | 12 | 7 | 21 | 1 |
| 15 | 3-HPAA | 152 | 1.86 | - | 151.0 | 55.0 | 107.1 | 4 | 65.2 | 28 | 6 | 21 | 1 |
| 16 | 4-HPPA | 166 | 2.17 | - | 165.1 | 78.0 | 59.1 | 8 | 121.1 | 8 | 27 | 22 | 1 |
| 17 | 4-HCA | 164 | 2.27 | - | 163.0 | 80.0 | 119.1 | 12 | 93.1 | 36 | 8 | 23 | 1 |
| 18 | DFA | 196 | 2.44 | - | 195.1 | 100 | 136.1 | 11 | 121.1 | 27 | 39 | 23 | 2 |
| 19 | DHPhLiAce | 178 | 2.48 | + | 179.1 | 87.0 | 143.0 | 16 | 115.0 | 28 | 52 | 24 | 2 |
| 20 | 3-HPPA | 166 | 2.54 | - | 165.1 | 88.0 | 121.1 | 8 | 119.1 | 12 | 14 | 24 | 2 |
| 21 | FA | 194 | 2.58 | - | 193.1 | 88.0 | 134.1 | 16 | 178.1 | 12 | 66 | 25 | 2 |
| 22 | ROH | 166 | 2.79 | + | 107.0 | 130.0 | 77.1 | 24 | 51.2 | 40 | 46 | 30 | 2 |
| 23 | RK | 164 | 3.01 | + | 107.1 | 120.0 | 77.1 | 21 | 51.1 | 37 | 47 | 35 | 2 |
| 24 | VLAce | 194 | 3.26 | + | 195.1 | 60.0 | 137.1 | 4 | - | - | - | 53 | 2 |
| 25 | VLiAce | 192 | 3.45 | + | 193.1 | 110.0 | 175.1 | 12 | 143.0 | 16 | 82 | 66 | 2 |
| 26 | IS-2 | 155 | 4.42 | - | 154.2 | 74.0 | 110.1 | 8 | 82.2 | 20 | 7 | 108 | - |
| 27 | PhLiAce | 146 | 4.78 | + | 147.1 | 90.0 | 129.1 | 12 | - | - | - | 119 | 2 |
| 28 | RK-Me | 178 | 4.86 | + | 121.0 | 110.0 | 78.1 | 28 | 77.1 | 20 | 64 | 168 | 2 |
3.4. Validation results
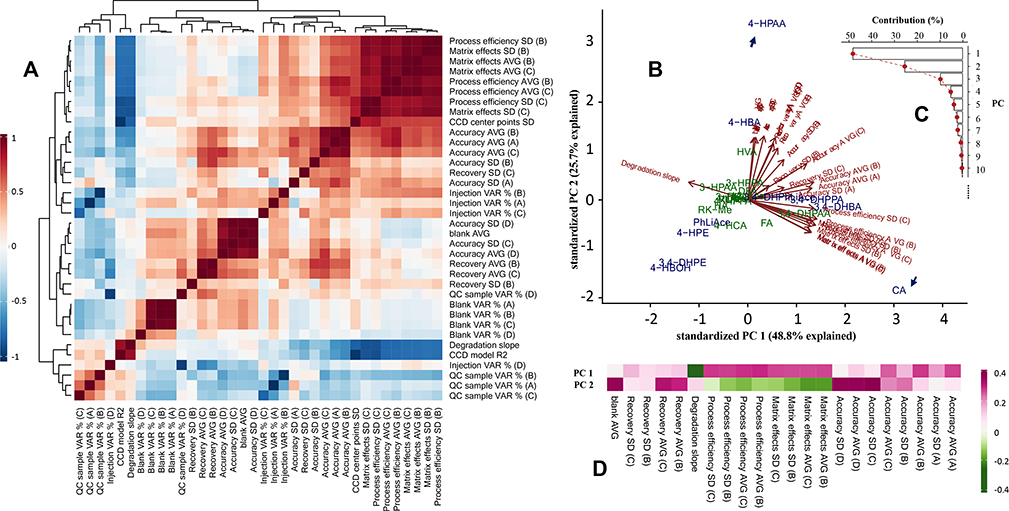
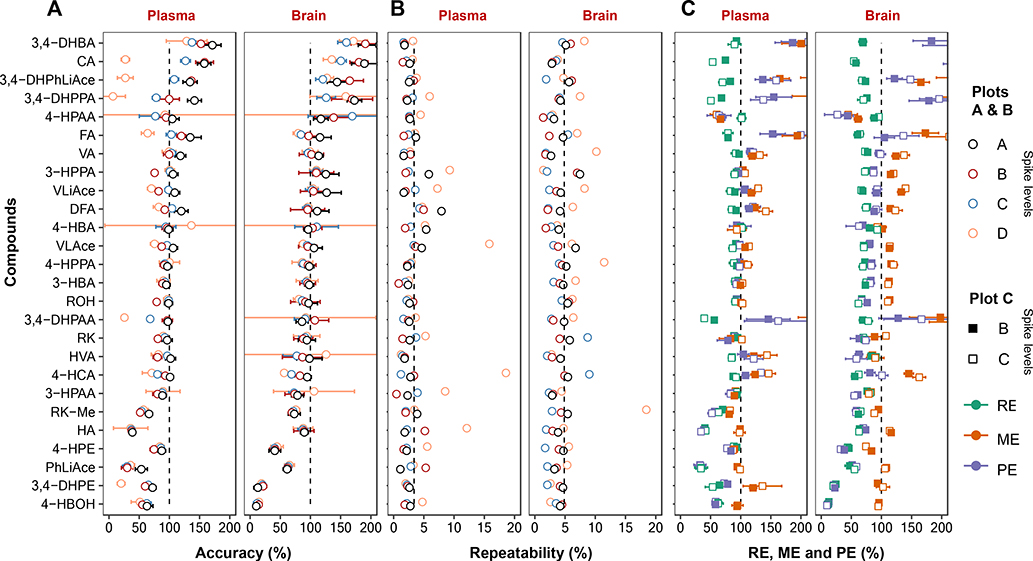
All compounds presented ideal limit of quantification down to picograms injected on column, with linear dynamic range spanning across over three orders of magnitude. The majority of compounds including RK had accuracy achieved at 80~120 % in both plasma and brain at four different spiked levels, though for certain compounds accuracy was more inflated or underestimated. Repeatability was mostly below or around 5%, with brain samples presenting more data variability than plasma. Matrix effects, recovery and processing efficiency validated at two spike levels was generally restricted within 80~120%, though brain samples imposed higher challenge to recovery than plasma, and that accuracy-aberrant compounds showed similar drifting behavior with respect to these three validated aspects. Detailed results are shown in Figs 5 and S4, Tables 2 and S5–S9.
Fig. 5.
Multivariate analysis on method analytical and validation results in mice brain samples. (A), heatmap of correlation matrix of analytical merits; (B), principle component analysis (PCA) of all analytes based on selected validation parameters with loadings display; (C), contribution percentage of constructed principle components (PCs) to total data variability; (D), eigenvector matrix. Analytes with averaged accuracy of 80~120% are marked in green, and outside this range in blue, with ellipse of corresponding color denoting ca 70% normal distribution range. For abbreviations applied in the plots, QC, quality control; VAR, variance; CCD, central composite design; SD, standard deviation; AVG, the average level.
Table 2.
Validated sensitivity, calibration and dynamic linear range.
| Elution order | Compound | Sensitivity |
Linear range for Low concentration |
Linear range for high concentration |
|||||
|---|---|---|---|---|---|---|---|---|---|
| LOD | LOQ | Range | Calibration curve | R2 | Range | Calibration curve | R2 | ||
| 1 | 4-HBOH | 0.4 | 0.8 | 0.8 ~ 785 | y = 1.289 x + 0.006 | 0.9982 | 785 ~ 6286 | y = 0.959 x + 2.141 | 0.9951 |
| 2 | 3,4-DHBA | 0.7 | 1.4 | 1.4 ~ 696 | y = 0.548 x + 0.007 | 0.9982 | 696 ~ 5571 | y = 0.395 x + 0.947 | 0.9967 |
| 3 | 3,4-DHPE | 0.2 | 0.4 | 0.4 ~ 720 | y = 1.475 x + 0.006 | 0.9888 | 720 ~ 5762 | y = 0.728 x + 4.320 | 0.9946 |
| 4 | 3,4-DHPAA | 1.4 | 2.7 | 2.7 ~ 696 | y = 0.607 x + 0.003 | 0.9989 | 696 ~ 5571 | y = 0.659 x + 0.782 | 0.9897 |
| 5 | 4-HBA | 0.2 | 0.3 | 0.3 ~ 678 | y = 2.609 x + 0.149 | 0.9976 | 678 ~ 5428 | y = 2.396 x + 0.411 | 0.9932 |
| 6 | 4-HPE | 0.8 | 1.6 | 1.6 ~ 833 | y = 0.636 x + 0.002 | 0.9945 | 833 ~ 6666 | y = 0.384 x + 1.553 | 0.9959 |
| 7 | HA | 1.3 | 2.6 | 2.6 ~ 667 | y = 0.510 x + 0.002 | 0.9984 | 667 ~ 5333 | y = 0.397 x + 0.707 | 0.9959 |
| 8 | 4-HPAA | 1.5 | 3.1 | 3.1 ~ 792 | y = 0.207 x + 0.002 | 0.9982 | 792 ~ 6333 | y = 0.104 x + 0.769 | 0.9923 |
| 9 | IS-1 | - | - | - | - | - | - | - | - |
| 10 | 3,4-DHPPA | 3.0 | 6.0 | 6.0 ~ 774 | y = 0.394 x + 0.001 | 0.9955 | 774 ~ 6190 | y = 0.212 x + 1.214 | 0.9955 |
| 11 | VA | 1.3 | 2.6 | 2.6 ~ 673 | y = 0.709 x + 0.006 | 0.9978 | 673 ~ 5381 | y = 0.440 x + 1.598 | 0.9956 |
| 12 | CA | 1.3 | 2.6 | 2.6 ~ 655 | y = 0.812 x + 0.004 | 0.9954 | 655 ~ 4583 | y = 0.843 x + 0.844 | 0.9868 |
| 13 | 3-HBA | 1.5 | 2.9 | 2.9 ~ 750 | y = 1.064 x + 0.002 | 0.9997 | 750 ~ 6000 | y = 0.884 x + 1.025 | 0.9949 |
| 14 | HVA | 2.8 | 5.6 | 5.6 ~ 714 | y = 0.400 x + 0.005 | 0.9959 | 714 ~ 5714 | y = 0.193 x + 1.303 | 0.9944 |
| 15 | 3-HPAA | 0.4 | 0.8 | 0.8 ~ 815 | y = 0.704 x + 0.001 | 0.9975 | 815 ~ 6523 | y = 0.483 x + 1.415 | 0.9959 |
| 16 | 4-HPPA | 3.0 | 6.0 | 6.0 ~ 773 | y = 0.260 x + 0.000 | 0.9994 | 773 ~ 6190 | y = 0.220 x + 0.234 | 0.9933 |
| 17 | 4-HCA | 0.2 | 0.4 | 0.4 ~ 732 | y = 1.593 x + 0.004 | 0.9987 | 732 ~ 5857 | y = 1.357 x + 1.147 | 0.9945 |
| 18 | DFA | 0.8 | 1.6 | 1.6 ~ 833 | y = 1.287 x + 0.010 | 0.9980 | 833 ~ 6666 | y = 0.555 x + 6.856 | 0.9946 |
| 19 | DHPhLiAce | 0.2 | 0.3 | 0.3 ~ 351 | y = 3.582 x + 0.023 | 0.9902 | 351 ~ 5619 | y = 2.011 x + 7.074 | 0.9908 |
| 20 | 3-HPPA | 0.7 | 1.5 | 1.5 ~ 756 | y = 3.363 x + 0.009 | 0.9971 | 756 ~ 6047 | y = 1.298 x + 17.38 | 0.9924 |
| 21 | FA | 0.4 | 0.8 | 0.8 ~ 786 | y = 0.958 x + 0.007 | 0.9949 | 786 ~ 6286 | y = 0.462 x + 4.093 | 0.9961 |
| 22 | ROH | 0.3 | 0.7 | 0.7 ~ 690 | y = 3.723 x + 0.027 | 0.9952 | 690 ~ 5523 | y = 1.778 x + 14.05 | 0.9959 |
| 23 | RK | 1.3 | 2.7 | 2.7 ~ 684 | y = 2.409 x + 0.002 | 0.9991 | 684 ~ 5476 | y = 1.381 x + 7.716 | 0.9968 |
| 24 | VLAce | 0.7 | 1.5 | 1.5 ~ 759 | y = 2.595 x + 0.004 | 0.9997 | 759 ~ 6071 | y = 1.599 x + 8.717 | 0.9973 |
| 25 | VLiAce | 0.2 | 0.4 | 0.4 ~ 774 | y = 4.055 x + 0.019 | 0.9972 | 774 ~ 6190 | y = 1.837 x + 18.78 | 0.9952 |
| 26 | IS-2 | - | - | - | - | - | - | - | - |
| 27 | PhLiAce | 0.7 | 1.4 | 1.4 ~ 726 | y = 3.372 x + 0.001 | 0.9992 | 726 ~ 5809 | y = 2.668 x + 5.473 | 0.9964 |
| 28 | RK-Me | 0.8 | 1.7 | 1.7 ~ 851 | y = 1.423 x + 0.002 | 0.9995 | 851 ~ 6809 | y = 0.889 x + 5.042 | 0.9954 |
3.5. Accuracy inference with RND-ANOVA at spike levels
The following statistical consideration motivated the use of RND-ANOVA for accuracy validation: a reliable validation may be always favored by preparation of many QCS (the factor), ideally by an imaginary pool of QCS’s of infinite size (the population), while in practice the QCS prepared essentially represents only a random sample (a = 5) drawn from the infinite population, with each QCS being a random treatment or level. With such experimental limitation in mind, RND-ANOVA was applied to make generalization or inference to the method based on the random QCS prepared. The RND-ANOVA-derived accuracy variation was mostly ca 5% higher than otherwise not used (Fig. S6).
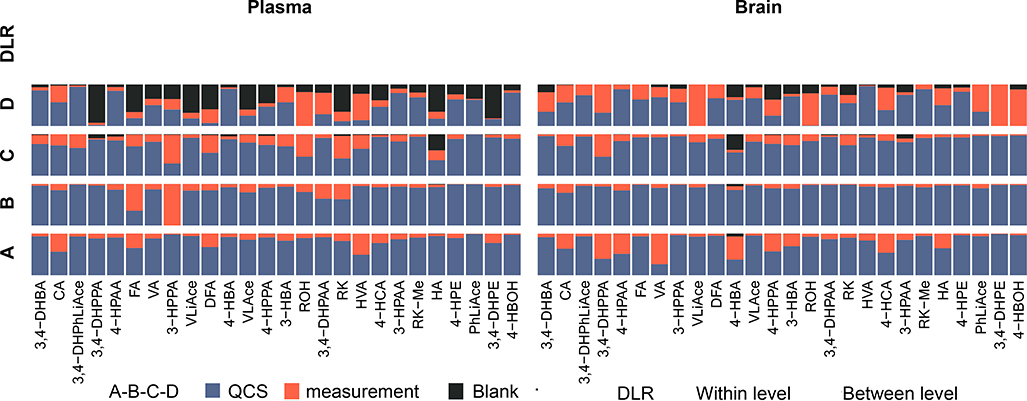
Another important function of RND-ANOVA is variance partition. The total variance of accuracy, by law of error propagation, could be split and attributed to errors respectively from blank samples (n’ = 3) and QCS’s; and the latter could be further split by RND-ANOVA and attributed to intrinsic differences in QCS’s (a = 5) and pure measurement error (n = 2), as shown in Fig. 4. The variance attributed to QCS’s reflected spiking inconsistency and sample inhomogeneity. The variance due to measurement error mirrored within biomatrix instrumental imprecision, integration-associated inconsistency, and compound liability during the 10-hour period between injection repetitions; as injections were made in complete randomized order across different spike concentrations, such measurement error also incorporated carryover effects.
Fig. 4.
Accuracy variance partition based on error propagation rule and random effects analysis of variance (RND-ANOVA). The variance is partitioned as percentage into blank sample analysis variability (n’ = 3), intrinsic differences in quality control samples (QCS) (a=5) and pure measurement error (n=2). Compounds are arranged in numerically decreasing order of accuracy.
3.6. Accuracy inference with RND-ANOVA throughout calibration range
While accuracy was routinely validated at several representative discrete concentration levels, the analyte concentration in an unknown sample in practice could reside anywhere across the continuous scale of calibration beyond the validated levels. As such, RND-ANOVA was applied for accuracy inference across the entire calibration range, with the mean square error associated with within-level variability substituted by the pooled accuracy variance across spike levels. The accuracy inference is shown in Fig. 4 and Fig. S7.
3.7. Repeatability and precision
Repeatability can be conveniently derived from accuracy validation based on the associated mean square error. Compared with “precision” in literature, which is typically conducted with multiple injections on the same sample, repeatability takes reduced repetitions (n = 2) on each sample and subjects the samples across different QCS’s (a = 5) (variation in QCS’s per se was then partitioned out) with randomized injection order. Therefore, repeatability validated in this work essentially constitutes precision yet scrutinized in a more complete context, comprehensively reflecting errors from multiple sources (see QCS’s measurement error as mentioned above) and better reflects the true consistency in a real batch analysis. In addition, an “anatomized” analysis of repeatability appears to suggest an analyte-specific instrumental drifting over the batch time (Fig. S8).
3.8. Analytical method correlation analysis
The analytical and statistical results validated and computed in this work were subjected to a comprehensive pairwise correlation analysis to understand the underlying mechanism of method performance, with an overview presented as a multivariate correlation matrix heatmap in Fig. 5A. Below follows a brief discussion of some key perspectives.
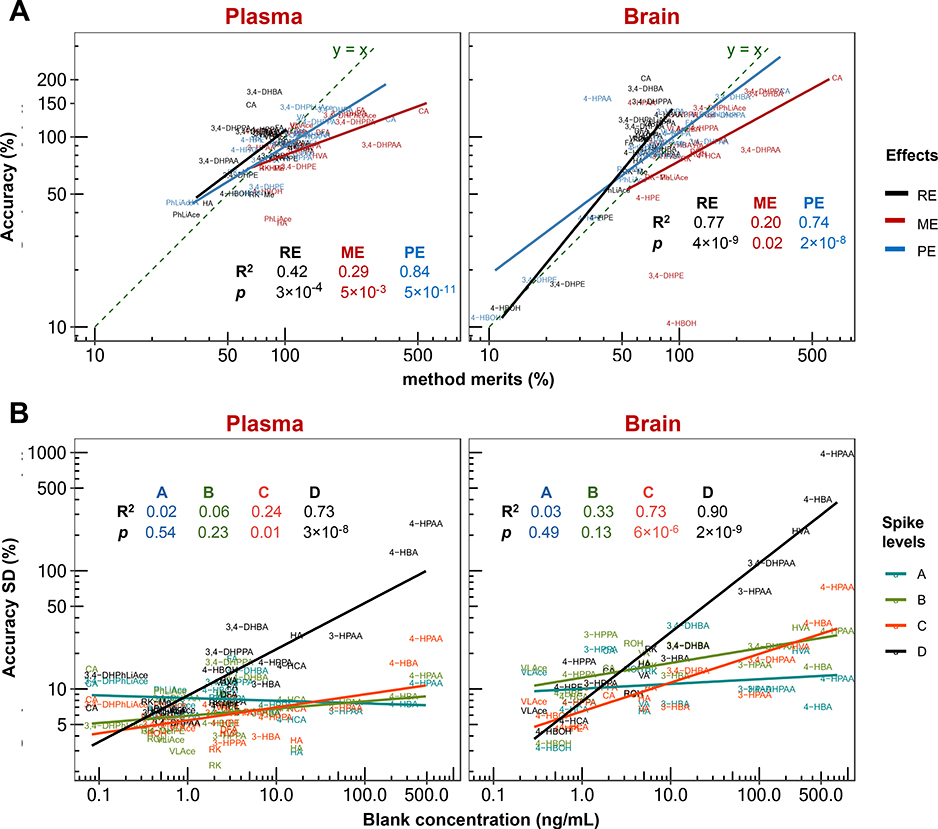
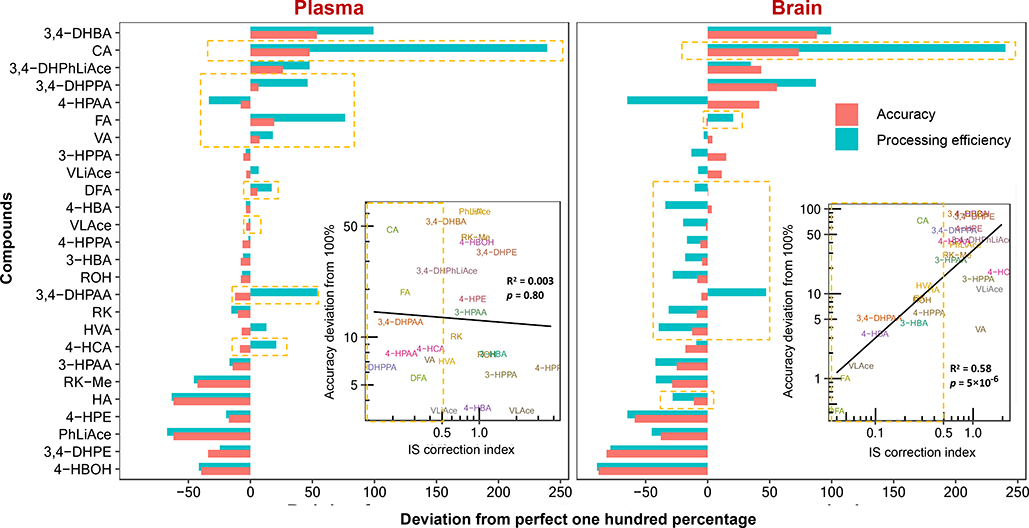
Accuracy was positively correlated with recovery, which reflects analyte extraction efficiency; and positively correlated with matrix effects. This mirrors suppression or enhancement of analyte ionization in the ESI chamber caused by co-extracted biomatrical compounds and as a result, positively correlated with processing efficiency, which is the multiplied product of and therefore a reflection of combined effects of matrix effect and recovery, accounting for 74~84% of accuracy levels in plasma and brain samples (Fig. 6A). As processing efficiency was calculated based on peak area, it essentially constitutes the accuracy without use of IS for correction of extraction loss and matrix effects. As such, the difference between accuracy and processing efficiency reflects the correction efficacy of IS. To analyze such efficacy, IS correction index is introduced and defined here as the absolute deviation of accuracy from one hundred percent divided by such deviation of processing efficiency. Thus, the smaller the index number, the higher correction power the IS exerts. The IS correction index was positively correlated with accuracy determined for the brain tissue with about 58% contribution, yet less so in plasma (Fig. 7).
Fig. 6.
Correlation analysis of validated accuracy mean value and standard deviation (SD) with recovery (RE), matrix effect (ME) and processing efficiency (PE) (A), and with endogenous or background concentration in the biomatrices (B). In plot (A), accuracy was averaged across three spike levels of A, B and C (D the lowest level was not counted due to high susceptibility to background interference), and RE, ME and PE were respectively averaged across two levels of B and C. In both plots (A) and (B), linear regression statistics were calculated based on base-10 logarithmically transformed data.
Fig. 7.
Analysis of internal standard (IS) correction efficiency. The correction efficiency was manifested by the difference between the accuracy and processing efficiency. Compounds are arranged in numerically decreasing order of accuracy, and compounds with IS correction index smaller than 0.5 are shaded in light orange color. Regression statistics were calculated based on base-10 logarithmically transformed data.
Accuracy variability was increasingly susceptible to blank concentration at lower spike concentrations. At spike level of d (15 ng/mL spiked in processed sample) in plasma and brain matrices, 73% and 90% of increase in the total accuracy variability could be respectively attributed to error from blank concentration deduction (Fig. 6B). This effect rendered quantification imprecise at the lower end of calibration range for compounds with high concentration in the background, such as 4-HPAA, 4-HBA, 3,4-DHPAA, HVA and 3-HPAA (100 ~ 700 ng/mL in sample). Interestingly, most of the background interference was introduced from the commercial β-glucuronidase solution (extracted from limpets or Patella vulgata) used for deconjugating phase II metabolites, while fewer compounds were found truly endogenous in the blank biomatrices. For example, 3,4-DHPAA and HVA were found at high levels in blank brain matrices yet lacking in plasma (Fig. S9).
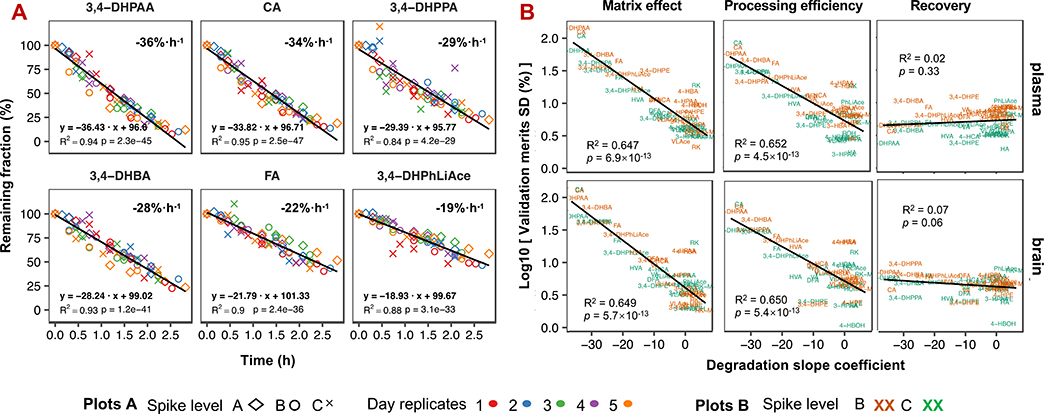
Compound (in)stability is another factor with relevant impact on method development and validation results. Among all analytes investigated, about half featured 2 ~ 36% loss per hour in pure solvent at 4 °C following a short-term zero-order dynamic model (Fig. 8A and Fig. S3). In contrast, all compounds presented remarkably elevated stability in biomatrices, manifested by the excellent repeatability which also incorporated compound degradation effects as aforementioned (mostly below 5% error; See Fig. S8. for additional stability analysis based on repeatability analysis and Fig. S10. for a separate stability experiment). A similar phenomenon was also noted in some earlier studies [25, 26]. Such (in)stability discrepancy in pure solvent and biomatrices, as a result, increased and contributed to ca 65% of the apparent variability of matrix effect and processing efficiency, whose validation involved both pure solvent and biomatrical samples; but with little impact on recovery, which only involved biomatrical samples (Fig. 8B). Thus, this effect could propa-gate to accuracy validation and lead to accuracy overestimation when calibration is prepared in neat solvent (Fig. S11).
Fig. 8.
Compound degradation and its effect on method validation. Plot (A) displays the top six most reliable compounds in pure solvent (60% methanol with 0.1% formic acid) stored in 4°C-maintained UHPLC autosampler and zero order dynamic model statistics. Experiments were replicated over five different days and concentrations (A, 2000 ng/mL; B, 1000 ng/mL; and C, 150 ng/mL), and peak areas were normalized to the first injection of each sample of different concentrations for each day as the correspondingly remaining fraction. The slope coefficient corresponds to the compound percent loss per hour. Plot (B) shows the correlation of liability (expressed as degradation slope) with matrix effect, processing efficiency and recovery.
3.9. Analytes profile comparison by PCA
All analytes’ profile was compared using PCA with selected key validation parameters, as shown in Fig. 5B–D. Explaining ca 74% of total variation, the first two principle components (PCs) reflect the closeness / uniqueness of analytes in context of their analytical characteristics. In contrast, the loading arrows reflect correlations among original variables (OAs, the analytical characteristics), i.e., OAs clustered together are generally positively correlated, those with reverse directions negatively correlated, and those close to perpendicularity only marginally correlated, agreeing with the correlation matrix in Fig. 5A. The loadings display the correlation of PCs and OAs and serve as the gateway to PC interpretation. The associated eigenvectors elements (Fig. 5D), which are the variance-unadjusted counterpart of loadings, provide a more straightforward approach for PC interpretation, as the eigenvector elements per se are the exact coefficients of the linear transformation for PCs’ construction, and directly measures the weight and functionality of each OA (in presence of other OAs; while loadings measure the weight ignoring all other OAs by standardizing off the associated variance) in this procedure. As such, the PCs in this work was interpreted mostly using the eigenvectors as the primary tool as discussed below.
PC1 is first and foremost associated with compounds’ neat-solvent liability, expressed as the zero-order kinetic degradation slope, with a negative sign (marked as the dark green cell in the first row in Fig. 5D. As such liability is causally associated with validation performance in terms of accuracy, matrix effects and processing efficiency as aforementioned, PC1 is therefore also associated with these validation results yet with a positive sign, but not as much association with recovery as expected. As such, PC1 essentially constituted the “degradation dimension”. This leads to CA as well as 3, 4-DHBA and 3, 4-DHPPA with their high liability sliding to the right side along the direction of PC1, while 4-HBOH and 3, 4-DHPE with their somehow positive slope slightly shifted to the left side.
PC2 is first of all significantly associated with the background level in the biomatrices. As the background interference propagates to accuracy determination especially at low levels as discussed above. PC2 is therefore also positively associated with the validated accuracy. As such, PC2 may be interpreted as the “background interference” dimension. Following this, 4-HPAA, due to its high background occurrence in enzyme solution, was found at the very periphery of the PCA plot along the PC2 direction.
4. Conclusion
A UHPLC-QqQ-MS/MS method for RK and 25 analytes identified as RK-derived metabolites was developed and validated. Design of experiment methodology was applied for efficient method optimization. Application of RND-ANOVA, a universal correlation analysis and PCA diagnosis revealed how the multiple parameters contributed to method performance. Two particular phenomena, the analytes’ background occurrence in the commercial enzyme solution used for metabolites deconjugation, and the unexpected rapid degradation of analytes under 4 °C in pure solvent vs. elevated stability in biomatrices, constituted the essence of the first two PCA dimensions, exerting crucial impact on method performance. In view of the validation results, the proposed method could readily serve for studies on RK metabolism, pharmacokinetics and bioavailability and associated safety / toxicity evaluation using in vivo models or in clinical trials.
Supplementary Material
Fig. 3.
Method validation results for (A), accuracy; (B), repeatability; (C), recovery (RE), matrix effects (ME) and processing efficiency (PE). Data are expressed as the mean with standard deviation indicated by error bar. The shaded area in plots (A) and (C) denotes the 80 ~120% region. Compounds are arranged in numerically decreasing order of accuracy. A small number of outliers falling outside of the displayed scale are not shown.
Highlight.
UHPLC-MS/MS method was developed for raspberry ketone and 25 metabolites.
Design of experiment methodology was used for LC-MS method optimization.
Random effect analysis of variance was used in validation design and analysis.
Multivariate statistics was applied for method performance analysis.
R programming was engaged in data analysis and visualization.
Acknowledgement
Research reported in this publication was supported by the National Center for Complementary & Integrative Health of the National Institutes of Health under Award Number R01AT008933 and the associated Administrative Supplement grant 3 R01 AT008933-03S1. The content is solely the responsibility of the authors and does not necessarily represent the official views of the National Institutes of Health. Additional funds were provided by the New Jersey Agriculture Experiment Station, Hatch Project NJ12131. We appreciate Mr. Andrew Polyak for his help in sample preparation and Miss. Jenna Thaochuetoua for data organization and figure preparation.
Footnotes
Author Statement
All authors declared no conflict of interest.
Publisher's Disclaimer: This is a PDF file of an unedited manuscript that has been accepted for publication. As a service to our customers we are providing this early version of the manuscript. The manuscript will undergo copyediting, typesetting, and review of the resulting proof before it is published in its final form. Please note that during the production process errors may be discovered which could affect the content, and all legal disclaimers that apply to the journal pertain.
References
- [1].Aprea E, Biasioli F, Gasperi F. Volatile compounds of raspberry fruit: from analytical methods to biological role and sensory impact. Molecules 2015;20:2445–74. [DOI] [PMC free article] [PubMed] [Google Scholar]
- [2].Park KS. Raspberry ketone increases both lipolysis and fatty acid oxidation in 3T3-L1 adipocytes. Planta Med 2010;76:1654–1658. [DOI] [PubMed] [Google Scholar]
- [3].Leu SY, Chen YC, Tsai YC, Hung YW, Hsu CH, Lee YM, Cheng PY. Raspberry Ketone Reduced Lipid Accumulation in 3T3-L1 Cells and Ovariectomy-Induced Obesity in Wistar Rats by Regulating Autophagy Mechanisms. J Agric Food Chem 2017;65:10907–10914. [DOI] [PubMed] [Google Scholar]
- [4].Morimoto C, Satoh Y, Hara M, Inoue S, Tsujita T, Okuda H. Anti-obese action of raspberry ketone. Life Sci 2005;77:194–204. [DOI] [PubMed] [Google Scholar]
- [5].Wang L, Meng X, Zhang F. Raspberry ketone protects rats fed high-fat diets against nonalcoholic steatohepatitis. J Med Food 2012;15:495–503. [DOI] [PMC free article] [PubMed] [Google Scholar]
- [6].Ogawa Y, Akamatsu M, Hotta Y, Hosoda A, Tamura H. Effect of essential oils, such as raspberry ketone and its derivatives, on antiandrogenic activity based on in vitro reporter gene assay. Bioorg Med Chem Lett 2010;20:2111–2114. [DOI] [PubMed] [Google Scholar]
- [7].Lin CH, Ding HY, Kuo SY, Chin LW, Wu JY, Chang TS. Evaluation of in vitro and in vivo depigmenting activity of raspberry ketone from Rheum officinale. Int J Mol Sci 2011;12:4819–35. [DOI] [PMC free article] [PubMed] [Google Scholar]
- [8].Jeong JB, Jeong HJ. Rheosmin, a naturally occurring phenolic compound inhibits LPS-induced iNOS and COX-2 expression in RAW264.7 cells by blocking NF-kappaB activation pathway. Food Chem Toxicol 2010;48:2148–53. [DOI] [PubMed] [Google Scholar]
- [9].Khan V, Sharma S, Bhandari U, Sharma N, Rishi V, Haque SE. Suppression of isoproterenol-induced cardiotoxicity in rats by raspberry ketone via activation of peroxisome proliferator activated receptor-alpha. Eur J Pharmacol 2019;842:157–166. [DOI] [PubMed] [Google Scholar]
- [10].Lee J Further research on the biological activities and the safety of raspberry ketone is needed. NFS Journal 2016;2:15–18. [Google Scholar]
- [11].Bredsdorff L, Wedebye EB, Nikolov NG, Hallas-Moller T, Pilegaard K. Raspberry ketone in food supplements--High intake, few toxicity data--A cause for safety concern? Regul Toxicol Pharmacol 2015;73:196–200. [DOI] [PubMed] [Google Scholar]
- [12].Sporstøl S, Scheline R. The metabolism of 4-(4-hydroxyphenyl) butan-2-one (raspberry ketone) in rats, guinea-pigs and rabbits. Xenobiotica 1982;12:249–257. [DOI] [PubMed] [Google Scholar]
- [13].Zhao D, Yuan B, Kshatriya D, Bello NT, Simon JE, Wu Q. Influence of diet-induced obesity on the bioavailability and metabolism of raspberry ketone (4-(4-hydroxyphenyl)-2-butanone) in mice. Molecular Nutrition and Food Research 2020. [DOI] [PMC free article] [PubMed] [Google Scholar]
- [14].Yuan B, Zhao D, Du R, Kshatriya D, Bello NT, Simon JE, Wu Q. A highly sensitive ultra-high performance liquid chromatography/tandem mass spectrometry method with in-source fragmentation for rapid quantification of raspberry ketone. J Food Drug Anal 2018. [DOI] [PMC free article] [PubMed] [Google Scholar]
- [15].Montgomery DC. Design and analysis of experiments: John wiley & sons; 2017. [Google Scholar]
- [16].Zhao D, Yuan B, Carry E, Pasinetti GM, Ho L, Faith J, Mogno I, Simon J, Wu Q. Development and validation of an ultra-high performance liquid chromatography/triple quadrupole mass spectrometry method for analyzing microbial-derived grape polyphenol metabolites. J Chromatogr B Analyt Technol Biomed Life Sci 2018;1099:34–45. [DOI] [PMC free article] [PubMed] [Google Scholar]
- [17].Food-and-Drug-Administration U. Guidance for Industry: Bioanalytical Method Validation. 2018.
- [18].Kruve A, Rebane R, Kipper K, Oldekop ML, Evard H, Herodes K, Ravio P, Leito I. Tutorial review on validation of liquid chromatography-mass spectrometry methods: part II. Anal Chim Acta 2015;870:8–28. [DOI] [PubMed] [Google Scholar]
- [19].Matuszewski BK, Constanzer ML, Chavez-Eng CM. Strategies for the assessment of matrix effect in quantitative bioanalytical methods based on HPLC-MS/MS. Anal Chem 2003;75:3019–30. [DOI] [PubMed] [Google Scholar]
- [20].Taylor PJ. Matrix effects: the Achilles heel of quantitative high-performance liquid chromatography-electrospray-tandem mass spectrometry. Clin Biochem 2005;38:328–34. [DOI] [PubMed] [Google Scholar]
- [21].Johnson RA, Wichern DW. Applied multivariate statistical analysis: Prentice hall Upper Saddle River, NJ; 2002. [Google Scholar]
- [22].R-Core-Team. R: A language and environment for statistical computing R Foundation for Statistical Computing, Vienna, Austria: ISBN 3–900051-07–0, URL http://www.R-project.org/. 2013. [Google Scholar]
- [23].Gu Z, Eils R, Schlesner M. Complex heatmaps reveal patterns and correlations in multidimensional genomic data. Bioinformatics 2016;32:2847–9. [DOI] [PubMed] [Google Scholar]
- [24].Ostrowski W, Wojakowska A, Grajzer M, Stobiecki M. Mass spectrometric behavior of phenolic acids standards and their analysis in the plant samples with LC/ESI/MS system. J Chromatogr B Analyt Technol Biomed Life Sci 2014;967:21–7. [DOI] [PubMed] [Google Scholar]
- [25].Wang YJ, Pan MH, Cheng AL, Lin LI, Ho YS, Hsieh CY, Lin JK. Stability of curcumin in buffer solutions and characterization of its degradation products. J Pharm Biomed Anal 1997;15:1867–76. [DOI] [PubMed] [Google Scholar]
- [26].Krook MA, Hagerman AE. Stability of Polyphenols Epigallocatechin Gallate and Pentagalloyl Glucose in a Simulated Digestive System. Food Res Int 2012;49:112–116. [DOI] [PMC free article] [PubMed] [Google Scholar]
Associated Data
This section collects any data citations, data availability statements, or supplementary materials included in this article.


