Abstract
Diacetoxyscirpenol (DAS) is a highly toxic type A trichothecene, a natural contaminant in food and animal feed, which is a serious hazard to human and animal health. An anti-DAS mAb, 3H10, with high sensitivity and specificity, was prepared, and an indirect competitive enzyme-linked immunosorbent assay (ic-ELISA) and a lateral-flow immunochromatographic strip (ICA strip) were developed for rapid testing of DAS in rice samples. The 50% inhibitory concentration and limit of detection of ic-ELISA were 5.97 and 0.78 ng/mL, respectively. The recovery of rice samples ranged from 99.4 to 110.7%, demonstrating that the analytical method can be used to detect rice samples. The cutoff value of the lateral-flow ICA strip to DAS was 500 ng/g. The developed immunoassay method can provide an effective method of initially detecting and screening DAS in food and feed samples.
1. Introduction
Trichothecenes are highly toxic secondary metabolites produced by Fusarium fungi, which are widely distributed in nature and seriously endanger human and animal health. Diacetoxyscirpenol (DAS, anguidine), T-2 toxin, and HT-2 toxin are among the most toxic mycotoxins of the trichothecene group.1 Like other trichothecenes, DAS exerts an amalgam of acute and chronic effects on humans and animals, such as hematotoxicity, immunotoxicity, growth retardation,2 pulmonary disorders,3 and cardiovascular effects.4 The potential for induction of anorexia by type A trichothecenes through targeting the appetite center is of particular concern from the perspective of human and animal health.5 For intraperitoneal administration, comparing anorexia efficacy, DAS is stronger than other type A trichothecenes.6 DAS is a dangerous natural contaminant of feed and agricultural products worldwide, being commonly found in cereals,7 particularly in wheat, barley, rice, and maize.8 Although there are no regulatory limits for DAS, clinical studies have shown its high toxic potency in different animal species.9 In 2016, the Joint FAO/WHO Expert Committee on Food Additives (JECFA) conducted the first toxicological assessment of DAS.10 Finally, it was decided that DAS should be involved in the group with a temporary allowable daily intake, which includes T-2 and HT-2 toxins (0.06 μg/kg bw).10 Consequently, a highly sensitive and specific DAS assay is critical to assess the safety of food and animal feed.
There are many analytical methods for the detection of DAS, including gas chromatography-tandem mass spectrometry,11 thin-layer chromatography, chromatography-mass spectrometry,12 ultraefficient UPLC–MS/MS,13 and high-resolution mass spectrometry. Romera et al.13 used UPLC–MS/MS to analyze feed samples from a Spanish market and tested the DAS for an LOD of 25 μg/kg. The sample was ground and sieved, and then 2 g of the sample was extracted with 8 mL of an extract (acetonitrile:water:formic acid = 80:19:1 v/v/v) under an orbital shaker (4-time dilution). After centrifugation at 5500 rpm for 5 min, 2 mL of the supernatant was filtered through a 0.22 μm filter and injected into a UPLC–MS/MS system.13 Although the traditional instrument detection method is sensitive and reliable, it also has the disadvantages of being time-consuming and requiring expensive equipment, complicated sample preparation, and professional operation.14 This makes it impossible to achieve rapid, low-cost, simple detection of a large number of samples on the market. Enzyme-linked immunoassays are widely used in food testing due to their high sensitivity, high selectivity, high throughput, and low cost. However, only a small number of immunoassays have been established for the test of DAS, for instance, radioimmunoassays and enzyme-linked immunosorbent assays.15 Schubring and Chu15 developed an ic-ELISA to detect DAS in wheat and corn samples. However, the antibody was highly susceptible to sample matrix interference, and the sensitivity was not high enough to be commercialized.
2. Results and Discussion
2.1. Identification of Complete Antigen
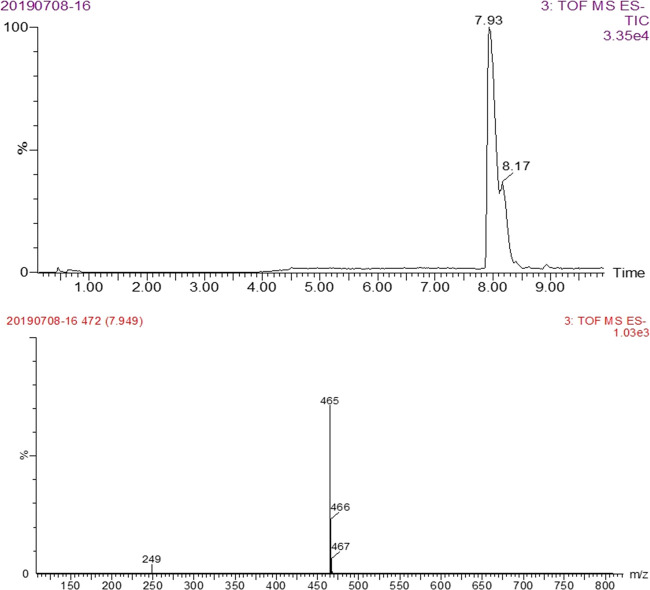
For the immunizing antigen, first of all, HS-DAS was formed by the reaction of DAS with succinic anhydride, which was then conjugated to the protein. The resulting material was identified by LC–MS/MS (Figure 2). The molecular weight of the main product was 466 as determined by negative-ion mass spectrometry, which was consistent with the molecular weight (MW 466) of the target substance HS-DAS. It can be seen that HS-DAS synthesis was successful. DAS was combined with KLH and BSA by the carbodiimide and the CDI methods, respectively, and the antigens DAS-HS-EDC-BSA and DAS-CDI-BSA were confirmed by electrophoresis (Figure 3). The synthesized antigen and the standard concentration of BSA strips showed significant band shifts, demonstrating successful synthesis of the complete antigen.
Figure 2.
LC–MS/MS result of HS-DAS hapten.
Figure 3.
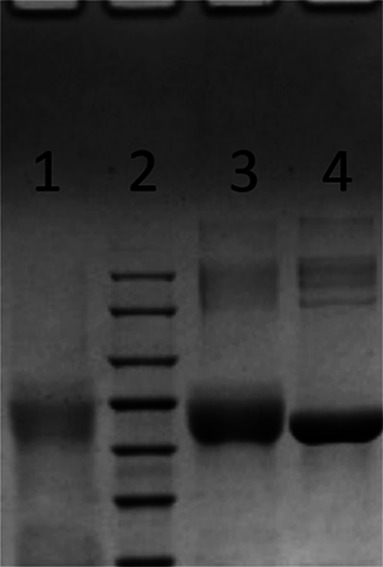
PAGE results of DAS antigens: (1) DAS-HS-EDC-BSA; (2) marker; (3) DAS-CDI-BSA; (4) BSA.
2.2. Development and Optimization of ic-ELISA
DAS-HS-EDC-KLH was used as the immunizing antigen to immunize mice, and DAS-CDI-BSA was used as the coating antigen. After the cells were fused, hybridoma cells were obtained, the ascites was prepared, and the antibody was purified. The mAbs 4F4, 4H8, 3H10, and 3H10 were identified by ic-ELISA, and the monoclonal antibody 3H10 was found to be the most sensitive.
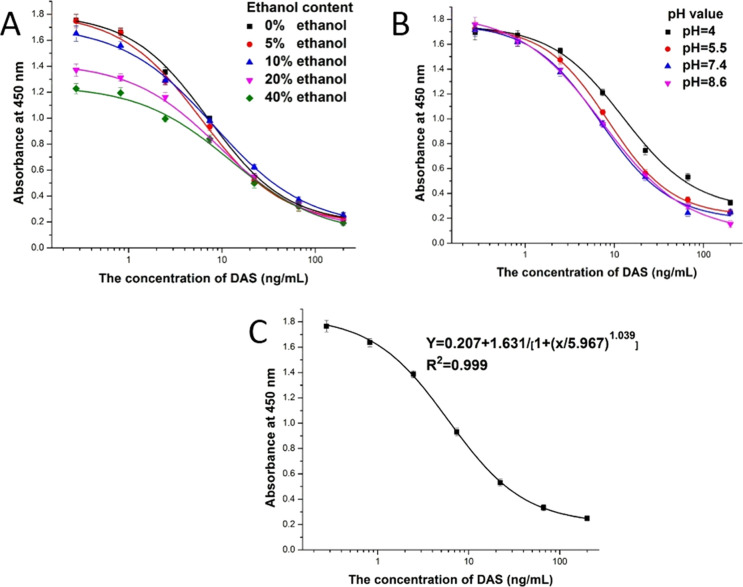
The titer and 50% inhibitory concentration (IC50) are two important indicators indicating the activity and sensitivity of the antibody, respectively, and the best optimization conditions are obtained by measuring them. The pH value is an important factor affecting the results of ic-ELISA. This is because a pH that is too high or too low will affect the physical and chemical properties of antigens and antibodies.16 The results of optimization are revealed in Figure 4A. From the test results, the pH value was in the range of 4.0–8.6, the antibody titer was basically unchanged, and the highest IC50 value was at pH 7.4, so pH 7.4 was selected. Since ethanol has low toxicity properties relative to other organic solvents, the ethanol content was selected for optimization in view of the safety of sample extraction. Once the ethanol content was higher than 20%, the antibody titer was remarkably reduced. With increasing ethanol content, the antibody inhibition effect first increased and then decreased, and the IC50 value was the lowest at 5%. Therefore, 5% ethanol was selected, at which concentration the antibody titer was high and the inhibition was good (Figure 4B). Therefore, the best test factors were pH 7.4 and 5% ethanol-PBS. Under optimal optimization conditions, the standard curve established by ic-ELISA was represented by Y = 0.207 + 1.631/[1 + (x/5.967)1.039], and the linear regression correlation coefficient (R2) was 0.99946. The IC50 was 5.97 ng/mL, and the LOD (IC10 value) was 0.78 ng/mL. The linear range was 1.57–22.6 ng/mL (Figure 4C). Comparing the properties of the antibodies with those in the literature,15,17 the results show that (Table 1) the antibody in this study not only has high sensitivity but also resists sample matrix interferences. Different trichothecene toxins were tested by ic-ELISA, such as DAS, T-2, HT-2, DON, and NIV, and the results can be seen from Table 2. The results indicate that the cross-reactivity of DAS mAb with other Fusarium toxins was less than 1%, so this antibody was highly specific.
Figure 4.
Standard curves of DAS by ic-ELISA: (A) standard curves for DAS with ic-ELISA based on different pH values; (B) standard curves for DAS with ic-ELISA based on different ethanol contents; (C) standard inhibition curve of DAS.
Table 1. Published Literature on Immunoassay Methods for Detecting Diacetoxyscirpenol.
Table 2. Cross-Reactivity of DAS mAb 3H10 with Trichothecene Toxins.
| analyte | IC50 (ng/mL) | cross-reactivity (%) |
|---|---|---|
| DAS | 5.97 | 100 |
| T-2 | >10000 | <0.1 |
| HT-2 | >10000 | <0.1 |
| DON | >10000 | <0.1 |
| NIV | >10000 | <0.1 |
2.3. Spiked and Recovery Tests by ic-ELISA
The rice sample was detected by extracting and diluting with the sample extract. The DAS spike concentrations were 100, 250, and 500 ng/g. As shown in Table 3, the recovery of DAS in rice samples was 99.4 to 110.7%, and the coefficient of variation was less than 6.9%. Therefore, the antibody is not easily interfered by the sample matrix, and this method can reliably detect DAS residues in rice for commercial application.
Table 3. Recovery of DAS in Rice Determined by ic-ELISAa.
| sample | spiked level (ng/g) | detection level (ng/g), mean ± SD | recovery rate (%) | CV (%) |
|---|---|---|---|---|
| rice (DAS) | 100 | 1.987 ± 0.025 | 99.35 ± 1.25 | 6.89 |
| 250 | 5.226 ± 0.156 | 104.52 ± 3.12 | 3.42 | |
| 500 | 11.069 ± 0.301 | 110.69 ± 3.01 | 4.57 |
Rice samples were diluted 50 times.
2.4. Optimization of the Immunochromatographic Strip
According to the results of ic-ELISA, DAS-CDI-BSA as the coating antigen had higher titer than DAS-HS-EDC-BSA and could save antigen synthesis time and cost, so the subsequent trials selected the coating antigen DAS-CDI-BSA.
Parameters such as the quantity of gold-nanoparticle-labeled monoclonal antibody and the coating antigen, as well as the suspension buffer, have a certain influence on the analytical performance and sensitivity of a lateral-flow ICA strip.16 Each condition was analyzed with a negative sample (0 ng/mL DAS) and a positive sample (25 ng/mL DAS).
The contents of the suspension buffer determine the intensity, clarity, flow rate, and background color of the T line.18 The basic suspension buffer was prepared by adding 5% sucrose, 2% sorbitol, 1% mannitol, 0.1% Tween, 0.1% PEG, and 0.04% sodium azide in 0.02 M PBS. Four different surfactants were then incorporated, including 5% polyvinylpyrrolidone (PVP), BSA, PEG, and Tween-20. The results in Figure 5 show that the basic suspension buffer containing PEG produced a deep red T-line color for DAS-negative samples, while others were light red or colorless. So, PEG was selected as the optimal resuspension buffer.
Figure 5.
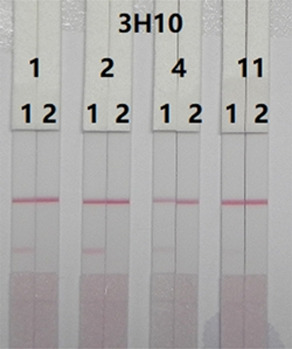
Optimization of suspension solution for sample pad: the basic suspension buffer + 5% 4 kinds of resuspensions: 1 = PVP, 2 = PEG, 4 = BSA, and 11 = Tween 20. Strip 1: negative sample without DAS (0 ng/mL); strip 2: positive sample with DAS (25 ng/mL).
Concentrations (0.3 and 0.7 mg/mL) of coating antigens onto the T line were used to detect different amounts of gold-nanoparticle-labeled monoclonal antibody (8 and 10 μg/mL, respectively). As can be seen from Figure 6A, when the negative sample was tested, as the amounts of antigen and gold-nanoparticle-labeled monoclonal antibody increased, the color intensity on the test line increased and the inhibitory effect was the same. Therefore, the amounts of coating antigen and gold-nanoparticle-labeled monoclonal antibody on the lateral-flow ICA strip were 0.7 mg/mL and 10 μg/mL, respectively.
Figure 6.
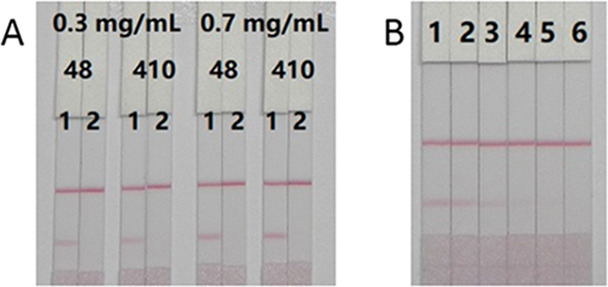
Optimization and detection of the immunochromatographic strip assay. (A) Optimization of the immunochromatographic strip with different concentrations of coating antigen (0.3, 0.7 mg/mL) and GNP-labeled mAb. 1 mL of gold nanoparticle with 4 μL of K2CO3 and antibody (8, 10 μg/mL). Strip 1: negative sample without DAS (0 ng/mL); strip 2: positive sample with DAS (25 ng/mL). (B) DAS detection by the immunochromatographic strip in PBS samples. The PBS samples: 1 = 0 ng/ mL, 2 = 0.5 ng/mL, 3 = 1 ng/mL, 4 = 2.5 ng/mL, 5 = 5 ng/mL, 6 = 10 ng/mL.
PBS samples spiked with different concentrations of DAS (0, 0.5, 1, 2.5, 5, and 10 ng/mL) were detected by the lateral-flow ICA strip. As can be seen from Figure 6B, for DAS, the cutoff value of the lateral flow ICA strip was 10 ng/mL.
2.5. Sample Analysis
To analyze the rice samples, 2 g samples were weighed from seven different points. DAS at concentrations of 0, 12.5, 25, 50, 125, 250, and 500 ng/g was added, and the solutions were extracted with 20 mL of 25% ethanol-PBS (10-time dilution). After vigorous shaking for 1 h, the supernatant was centrifuged, diluted five times, and then detected by ic-ELISA and the lateral-flow ICA strip. DAS at concentrations of 8, 20, and 40 ng/g was added to the rice samples (4-time dilution), which were prepared according to Romera et al.’s13 method and detected by the UPLC–MS/MS system. It can be seen from the results of Figure 7 that, as the concentration of DAS increased, the color of the T line began to weaken at a concentration of 1 ng/g and the color disappeared completely at a concentration of 10 ng/g. Since the dilution factor of the sample was 50, for rice samples, the LOD and cutoff value of the lateral flow ICA strip were 50 and 500 ng/g, respectively. The results in Table 4 demonstrated a good quantitative consistency between ic-ELISA and UPLC–MS/MS, further confirming the reliability of the analytical method.
Figure 7.
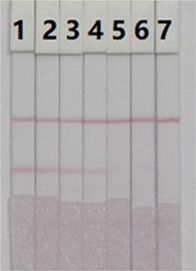
Spiked sample analysis with the immunochromatographic strip. Rice sample with DAS spiked: 1 = 0 ng/g, 2 = 0.25 ng/g, 3 = 0.5 ng/g, 4 = 1 ng/g, 5 = 2.5 ng/g, 6 = 5 ng/g, and 7 = 10 ng/g.
Table 4. DAS Concentration in the Rice Samples Quantified by ic-ELISA and UPLC–MS/MSa.
| ic-ELISA |
UPLC-MS/MS |
|||
|---|---|---|---|---|
| sample | spiked DAS (ng/g) | result (ng/g), mean ± SD | spiked DAS (ng/g) | result (ng/g), mean ± SD |
| rice | 100 | 1.987 ± 0.025 | 8 | 1.992 ± 0.009 |
| 250 | 5.226 ± 0.156 | 20 | 5.032 ± 0.021 | |
| 500 | 11.069 ± 0.301 | 40 | 10.027 ± 0.015 | |
Rice samples were diluted 50 times for ic-ELISA. Rice samples were diluted four times for UPLC–MS/MS.
3. Conclusions
In this study, a highly sensitive and specific mAb 3H10 against DAS was obtained. By optimizing the sample extraction solution, we established a simple and safe ic-ELISA and lateral-flow ICA strip for the detection of diacetoxyscirpenol. The IC50 of ic-ELISA was 5.97 ng/mL, the LOD (IC10 value) was 0.78 ng/mL, and the linear range was 1.57–22.6 ng/mL. An ic-ELISA method was established to determine DAS in rice samples, and the recovery of rice samples ranged from 99.4 to 110.7%. The lateral-flow ICA strip has a cutoff value of 500 ng/g for rice samples. Our developed immunoassay method provides an effective method for initially detecting and screening DAS in food and feed samples.
4. Materials and Methods
4.1. Chemicals and Instruments
Standards, including DAS, nivalenol (NIV), deoxynivalenol (DON), T-2 toxin, and HT-2 toxin, were purchased from J&K Scientific Co., Ltd. (Shanghai, China). 4-Dimethylaminopyridine, succinic anhydride, N-hydroxysuccinimide (NHS), 1-ethyl-carbodiimide hydrochloride (EDC), carbodiimide (CDI), bovine serum albumin (BSA), keyhole limpet hemocyanin (KLH), goat anti-mouse immunoglobulin (IgG) antibody, Freund’s incomplete adjuvant, and Freund’s complete adjuvant were obtained from Sigma-Aldrich (Shanghai, China). Other reagents were analytical-grade pure reagents produced by National Pharmaceutical Group Chemical Reagents Co., Ltd. (Shanghai, China). The nitrocellulose (NC) high-flow plus membrane (PuraBind RP) was purchased from Whatman-Xinhua Filter Paper Co. (Hangzhou, China). Sample pad (CB-SB08), absorbance pad (SX18), and polyvinylchloride (PVC) backing materials were provided by Goldbio Tech Co. (Shanghai, China).
4.2. Solutions and Buffers
The buffer solutions were prepared as follows: coating buffer solution (0.05 M sodium carbonate buffer solution), blocking buffer (0.2% gelatin, v/v in coating buffer containing), PBS buffer (0.01 M phosphate buffer solution), stop solution (2 M sulfuric acid), and washing buffer (PBS buffer solution containing 0.05% Tween 20). The substrate buffer was prepared by mixing solutions A (glycol containing 0.01% TMB) and B (0.1 M citrate phosphate buffer containing 0.3% H2O2) at a ratio of 1:5.
4.3. Synthesis of Haptens and Antigens
4.3.1. Preparation of DAS Hapten
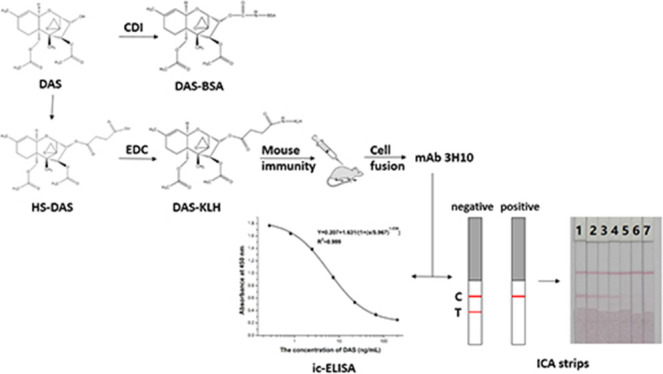
One milligram of DAS was weighed and dissolved in pyridine, and then 7.2 mg of succinic anhydride and 3.4 mg of catalytic DMAP were added. The reaction was magnetically stirred at 50 °C for 5 h in the dark. The reaction was then quenched by the addition of 50 μL of water and dried under nitrogen. The residue was extracted with water and trichloromethane. The organic phases were combined and dried under nitrogen to give the derivative HS-DAS (Figure 1).
Figure 1.
Synthesis of hapten for DAS.
4.3.2. Complete Antigen Preparation
To prepare the immunizing antigen, HS-DAS (1 mg), NHS (1 mg), and EDC (1.72 mg) were dissolved in 200 μL of DMF and stirred at room temperature for 6–8 h.19 The reaction solution was added dropwise to a protein (KLH 5.46 mg) dissolved in 2 mL of 0.05 M sodium carbonate buffer solution and stirred overnight at RT in the dark followed by dialysis in 0.01 M PBS for 3 days, with the dialysate being changed every 8 h. Prepared proteins were stored at −20 °C. DAS-EDC-KLH acted as the immunizing antigen.
The coating antigen (DAS-CDI-BSA) was prepared by the carbonyl diimidazole method. 1 mg of DAS was dissolved in 200 μL of DMF, 8 mg of CDI was added, and magnetic stirring was carried out at 37 °C for 2 h. The reaction solution was added dropwise to 1 mL of a 0.05 M sodium carbonate buffer solution (BSA 2 mg), stirred at room temperature overnight, dialyzed against 0.01 M PBS for 3 days, and stored at −20 °C. DAS-CDI-BSA acted as the coating antigen.
4.3.3. DAS Monoclonal Antibody Preparation
Aliquots of DAS-EDC-KLH complete antigen (80 μg) were fully emulsified with an equal volume of complete Freund’s adjuvant, and the first immunization was performed by subcutaneous injection of female BALB/c mice. Four weeks after the first immunization, incomplete Freund’s adjuvant was used instead of complete Freund’s adjuvant to emulsify the complete antigen (60 μg each) for booster immunization. The booster was then administered every 3 weeks (40 μg each). After five immunizations, the mouse with high titer and inhibitory rate was chosen and its spleen cells were fused with SP 2/0 myeloma cells. Target cells were screened by ic-ELISA and subcloned by limiting dilution.20 After obtaining the desired hybridoma cells, they were cultured and injected into the abdominal cavity of the mouse to produce ascites.21 The antibody was purified using octanoic acid-ammonium sulfate and stored at −20 °C.
4.4. ic-ELISA Process
In this experiment, DAS-BSA was serially diluted three times with coating buffer, and then 100 μL per well was added to 96-well microtiter ELISA plates and incubated for 2 h at 37 °C. After washing the plate three times with washing buffer, 200 μL of blocking solution was added to each well and blocked at 37 °C for 2 h. The sealed plates were washed three times, dried, and stored at 4 °C. DAS standards and antibodies were diluted with potassium salt containing 0.01 M PBS and antibody dilution buffer, respectively. Then DAS standard (50 μL) and DAS mAb (50 μL) were sequentially added to each well and incubated in a 37 °C oven for 0.5 h. After washing three times, the goat anti-mouse IgG was diluted 3000-fold with the antibody dilution, 100 μL was added to each well, and the solution was incubated at 37 °C for 0.5 h. After washing, 100 μL of the substrate buffer was added to each well and incubated at 37 °C for 15 min in the dark. After adding 50 μL of the stop solution, the absorbance was measured at 450 nm.22 A standard curve of the DAS antibody against the DAS standard was plotted, and IC50 and LOD values were calculated.
4.5. Cross-Reactivity
A cross-reactivity (CR) study was performed to determine the specificity of this mAb.23 DAS, T-2, HT-2, DON, and NIV were subjected to ic-ELISA. The CR values were calculated by the following formula:
| 1 |
4.6. Preparation of GNP-Labeled Monoclonal Antibodies
This experiment synthesized gold nanoparticles (GNPs) and GNP-labeled mAb. As described above, colloidal gold nanoparticles having an average radius of 7.5 nm were completed.24 To prepare GNP-labeled monoclonal antibodies, the pH value of the GNP solution (10 mL) was first adjusted to 8.0 with 0.1 M K2CO3, and then anti-DAS mAb (0.1 mg) was added dropwise. After reacting for 60 min at RT, BSA solution (1 mL) was further added dropwise.25 After incubation for 2 h followed by centrifugation at 7000 × g for 30 min, the resulting pellet was washed three times with 0.02 M PBS (containing 5% sucrose, 1% BSA, 0.5% PEG 6000, pH 7.4). The GNP-labeled mAb was then stored in 4 mL of gold-labeling resuspension buffer (0.02% NaN3, v/v in 0.02 M PBS) at 4 °C.
4.7. Preparation of the Lateral-Flow ICA Strip
In order to prepare the lateral-flow ICA strip, a PVC backing card, an NC film, a sample pad, and an absorbent pad were layered and assembled.26 The coating antigen was sprayed onto the NC membrane near the sample pad at a rate of 1 μL/cm with a membrane dispenser to form the test line, and the goat anti-mouse IgG antibody was sprayed onto the NC membrane adjacent to the absorbent pad to form the control line.27 After drying at 37 °C for 0.5 h, the strip was stored in a desiccator.
4.8. Principle of the Lateral-Flow ICA Strip
A 50 μL aliquot of the GNP-labeled mAb was mixed with 150 μL of a sample solution containing the DAS standard in microwells. The mixed solution was added to the sample pad after incubation for 5 min at room temperature, and the solution slowly infiltrated into the absorbent pad due to capillary action of the microporous membrane. Since the negative sample did not contain the DAS standard, the GNP-labeled mAb bound only to the coated antigen, making the T line appear red. In the positive sample, the GNP-labeled mAb bound to DAS was not captured by the coating antigen, and as a result, the T line was light red or colorless.28 Both free and bound GNP-labeled mAbs were captured by the goat anti-mouse IgG antibody on the C line, forming a deep red color.29 Negative and positive samples were judged by comparison between the T line and the C line, and the results could be visually observed within 5 min.30 Testing of a range of different concentrations of DAS standards confirmed the sensitivity of the immunochromatographic strip.
4.9. Sample Preparation and UPLC–MS/MS Analysis
Fusarium toxin samples were typically extracted by using organic reagents. The harmful reagents methanol and acetonitrile are commonly used. Consequently, ethanol has the advantages of low toxicity and safety, which ensures not only safe and clear sample pretreatment but also human health. Therefore, sample extraction was performed using 25% ethanol-PBS solution. Rice was bought at a local supermarket. After the rice without DAS (determined by UPLC–MS/MS) was ground for 20 mesh, 2 g samples were weighed from seven different points, and DAS of different concentrations was added while shaking. Each sample was then extracted with 20 mL of 25% ethanol-PBS (10-fold dilution). The mixture was oscillated on an electric shaker for 1 h and then centrifuged at 5000 × g for 20 min.31 The supernatant was diluted five times and further subjected to ic-ELISA and immunochromatographic analysis. The rice samples were prepared by the sample preparation method by Romera et al.13 and subjected to UPLC–MS/MS analysis to compare the quantitative consistency of ic-ELISA and UPLC–MS/MS.
Acknowledgments
This work is financially supported by National Key R&D Program (2017YFC1600600), and grants from the Natural Science Foundation of Jiangsu Province, MOF, and MOE (BE2014672, BE2013613, CMB21S1614, CSE11N1310).
No potential conflict of interest was reported by the authors.
The authors declare no competing financial interest.
References
- Nesic K.; Ivanovic S.; Nesic V. Fusarial toxins: secondary metabolites of Fusarium fungi. Rev. Environ. Contam. Toxicol. 2014, 228, 101–120. 10.1007/978-3-319-01619-1_5. [DOI] [PubMed] [Google Scholar]
- Zhang J.; Sheng K.; Wu W.; Zhang H. Anorectic responses to T-2 toxin, HT-2 toxin, diacetoxyscirpenol and neosolaniol correspond to plasma elevations of neurotransmitters 5-hydroxytryptamine and substance P. Ecotoxicol. Environ. Saf. 2018, 161, 451–458. 10.1016/j.ecoenv.2018.06.005. [DOI] [PubMed] [Google Scholar]
- Antonissen G.; Martel A.; Pasmans F.; Ducatelle R.; Verbrugghe E.; Vandenbroucke V.; Li S.; Haesebrouck F.; Van Immerseel F.; Croubels S. The impact of Fusarium mycotoxins on human and animal host susceptibility to infectious diseases. Toxins 2014, 6, 430–452. 10.3390/toxins6020430. [DOI] [PMC free article] [PubMed] [Google Scholar]
- Vidal A.; Mengelers M.; Yang S.; De Saeger S.; De Boevre M. Mycotoxin Biomarkers of Exposure: A Comprehensive Review. Compr. Rev. Food Sci. Food Saf. 2018, 17, 1127–1155. 10.1111/1541-4337.12367. [DOI] [PubMed] [Google Scholar]
- Lebrun B.; Tardivel C.; Félix B.; Abysique A.; Troadec J.-D.; Gaigé S.; Dallaporta M. Dysregulation of energy balance by trichothecene mycotoxins: Mechanisms and prospects. Neurotoxicology 2015, 49, 15–27. 10.1016/j.neuro.2015.04.009. [DOI] [PubMed] [Google Scholar]
- Zhang J.; Zhang H.; Liu S.; Wu W.; Zhang H. Comparison of Anorectic Potencies of Type A Trichothecenes T-2 Toxin, HT-2 Toxin, Diacetoxyscirpenol, and Neosolaniol. Toxins 2018, 10, 179. 10.3390/toxins10050179. [DOI] [PMC free article] [PubMed] [Google Scholar]
- Gonçalves R. A.; Hofstetter U.; Schatzmayr D.; Jenkins T. Mycotoxins in Southeast Asian aquaculture: plant-based meals and finished feeds. World Mycotoxin J. 2018, 11, 265–275. 10.3920/WMJ2017.2239. [DOI] [Google Scholar]
- Yang S.; De Boevre M.; Zhang H.; De Ruyck K.; Sun F.; Wang Z.; Cao X.; Shen J.; De Saeger S.; Zhang S. Unraveling the in vitro and in vivo metabolism of diacetoxyscirpenol in various animal species and human using ultrahigh-performance liquid chromatography-quadrupole/time-of-flight hybrid mass spectrometry. Anal. Bioanal. Chem. 2015, 407, 8571–8583. 10.1007/s00216-015-9016-4. [DOI] [PubMed] [Google Scholar]
- Chilaka C. A.; De Boevre M.; Atanda O. O.; De Saeger S. Prevalence of Fusarium mycotoxins in cassava and yam products from some selected Nigerian markets. Food Control 2018, 84, 226–231. 10.1016/j.foodcont.2017.08.005. [DOI] [Google Scholar]
- Yoshinari T.; Takeda N.; Watanabe M.; Sugita-Konishi Y. Development of an Analytical Method for Simultaneous Determination of the Modified Forms of 4,15-Diacetoxyscirpenol and their Occurrence in Japanese Retail Food. Toxins 2018, 10, 178. 10.3390/toxins10050178. [DOI] [PMC free article] [PubMed] [Google Scholar]
- Escrivá L.; Manyes L.; Font G.; Berrada H. Analysis of trichothecenes in laboratory rat feed by gas chromatography-tandem mass spectrometry. Food Addit. Contam., Part A 2016, 33, 329–338. 10.1080/19440049.2015.1124458. [DOI] [PubMed] [Google Scholar]
- Carballo D.; Font G.; Ferrer E.; Berrada H. Evaluation of Mycotoxin Residues on Ready-to-Eat Food by Chromatographic Methods Coupled to Mass Spectrometry in Tandem. Toxins 2018, 10, 243. 10.3390/toxins10060243. [DOI] [PMC free article] [PubMed] [Google Scholar]
- Romera D.; Mateo E. M.; Mateo-Castro R.; Gómez J. V.; Gimeno-Adelantado J. V.; Jiménez M. Determination of multiple mycotoxins in feedstuffs by combined use of UPLC-MS/MS and UPLC-QTOF-MS. Food Chem. 2018, 267, 140–148. 10.1016/j.foodchem.2017.11.040. [DOI] [PubMed] [Google Scholar]
- Han X.; Sheng F.; Kong D.; Wang Y.; Pan Y.; Chen M.; Tao Y.; Liu Z.; Ahmed S.; Yuan Z.; Peng D. Broad-spectrum monoclonal antibody and a sensitive multi-residue indirect competitive enzyme-linked immunosorbent assay for the antibacterial synergists in samples of animal origin. Food Chem. 2019, 280, 20–26. 10.1016/j.foodchem.2018.12.040. [DOI] [PubMed] [Google Scholar]
- Schubring S. L.; Chu F. S. An indirect enzyme-linked immunosorbent assay for the detection of diacetoxyscirpenol in wheat and corn. Mycotoxin Res. 1987, 3, 97–106. 10.1007/BF03191995. [DOI] [PubMed] [Google Scholar]
- Kong D.; Xie Z.; Liu L.; Song S.; Zheng Q.; Kuang H. Development of an immunochromatographic assay for the detection of alternariol in cereal and fruit juice samples. Food Agric. Immunol. 2017, 28, 1082–1093. 10.1080/09540105.2017.1326469. [DOI] [Google Scholar]
- a Chu F. S.; Liang M. Y.; Zhang G. S. Production and characterization of antibody against diacetoxyscirpenol. Appl. Environ. Microbiol. 1984, 48, 777–780. [DOI] [PMC free article] [PubMed] [Google Scholar]; b Pauly J. U.; Bitter-Suermann D.; Dose K. Production and characterization of a monoclonal antibody to the trichothecene mycotoxin diacetoxyscirpenol. Biol. Chem. Hoppe-Seyler 1988, 369, 487–492. 10.1515/bchm3.1988.369.1.487. [DOI] [PubMed] [Google Scholar]
- Zeng L.; Jiang W.; Liu L.; Song S.; Kuang H. Development of ic-ELISA and lateral-flow immunochromatographic strip for detection of vitamin B2 in an energy drink and vitamin tablets. Food Agric. Immunol. 2018, 29, 121–132. 10.1080/09540105.2017.1360257. [DOI] [Google Scholar]
- Ceballos-Alcantarilla E.; Agulló C.; Abad-Somovilla A.; Abad-Fuentes A.; Mercader J. V. Highly sensitive monoclonal antibody-based immunoassays for the analysis of fluopyram in food samples. Food Chem. 2019, 288, 117–126. 10.1016/j.foodchem.2019.03.007. [DOI] [PubMed] [Google Scholar]
- Li H.; Ma S.; Zhang X.; Li C.; Dong B.; Mujtaba M. G.; Wei Y.; Liang X.; Yu X.; Wen K.; Yu W.; Shen J.; Wang Z. Generic Hapten Synthesis, Broad-Specificity Monoclonal Antibodies Preparation, and Ultrasensitive ELISA for Five Antibacterial Synergists in Chicken and Milk. J. Agric. Food Chem. 2018, 66, 11170–11179. 10.1021/acs.jafc.8b03834. [DOI] [PubMed] [Google Scholar]
- Lei X.; Xu L.; Song S.; Liu L.; Kuang H. Development of an ultrasensitive ic-ELISA and immunochromatographic strip assay for the simultaneous detection of florfenicol and thiamphenicol in eggs. Food Agric. Immunol. 2018, 29, 254–266. 10.1080/09540105.2017.1371114. [DOI] [Google Scholar]
- Ding X.; Liu L.; Song S.; Kuang H.; Xu C. Rapid and ultrasensitive detection of 3-amino-2-oxazolidinone in catfish muscle with indirect competitive enzyme-linked immunosorbent and immunochromatographic assays. Food Agric. Immunol. 2017, 28, 463–475. 10.1080/09540105.2017.1297778. [DOI] [Google Scholar]
- Ni T.; Peng D.; Wang Y.; Pan Y.; Xie S.; Chen D.; Wang Y.; Tao Y.; Yuan Z. Development of a broad-spectrum monoclonal antibody-based indirect competitive enzyme-linked immunosorbent assay for the multi-residue detection of avermectins in edible animal tissues and milk. Food Chem. 2019, 286, 234–240. 10.1016/j.foodchem.2019.02.011. [DOI] [PubMed] [Google Scholar]
- Feng M.; Kong D.; Wang W.; Liu L.; Song S.; Xu C. Development of an Immunochromatographic Strip for Rapid Detection of Pantoea stewartii subsp. stewartii. Sensors 2015, 15, 4291–4301. 10.3390/s150204291. [DOI] [PMC free article] [PubMed] [Google Scholar]
- Guo M.; Sun L.; Liu L.; Song S.; Kuang H.; Cui G. Ultrasensitive immunochromatographic strip for detection of cyproheptadine. Food Agric. Immunol. 2018, 29, 941–952. 10.1080/09540105.2018.1490395. [DOI] [Google Scholar]
- Lin L.; Jiang W.; Xu L.; Liu L.; Song S.; Kuang H. Development of IC-ELISA and immunochromatographic strip assay for the detection of flunixin meglumine in milk. Food Agric. Immunol. 2018, 29, 193–203. 10.1080/09540105.2017.1364710. [DOI] [Google Scholar]
- Kong D.; Wu X.; Li Y.; Liu L.; Song S.; Zheng Q.; Kuang H.; Xu C. Ultrasensitive and eco-friendly immunoassays based monoclonal antibody for detection of deoxynivalenol in cereal and feed samples. Food Chem. 2019, 270, 130–137. 10.1016/j.foodchem.2018.07.075. [DOI] [PubMed] [Google Scholar]
- Hendrickson O. D.; Zvereva E. A.; Shanin I. A.; Zherdev A. V.; Dzantiev B. B. Development of a multicomponent immunochromatographic test system for the detection of fluoroquinolone and amphenicol antibiotics in dairy products. J. Sci. Food Agric. 2019, 99, 3834–3842. 10.1002/jsfa.9605. [DOI] [PubMed] [Google Scholar]
- Peng J.; Liu L.; Kuang H.; Cui G.; Xu C. Development of an icELISA and immunochromatographic strip for detection of norfloxacin and its analogs in milk. Food Agric. Immunol. 2017, 28, 288–298. 10.1080/09540105.2016.1263987. [DOI] [Google Scholar]
- Guo J.; Liu L.; Xue F.; Xing C.; Song S.; Kuang H.; Xu C. Development of a monoclonal antibody-based immunochromatographic strip for cephalexin. Food Agric. Immunol. 2014, 26, 282–292. 10.1080/09540105.2014.907242. [DOI] [Google Scholar]
- Wang J.; Peng T.; Zhang X.; Yao K.; Ke Y.; Shao B.; Wang Z.; Shen J.; Jiang H. A novel hapten and monoclonal antibody-based indirect competitive ELISA for simultaneous analysis of alternariol and alternariol monomethyl ether in wheat. Food Control 2018, 94, 65–70. 10.1016/j.foodcont.2018.06.027. [DOI] [Google Scholar]


