

Abstract
Objective.
Endothelial cells (EC) in obese adipose tissue (AT) are exposed to a chronic pro-inflammatory environment that may induce a mesenchymal-like phenotype and altered function. The objective of this study was to establish whether endothelial-to-mesenchymal transition (EndoMT) is present in human AT in obesity and to investigate the effect of such transition on endothelial function and the endothelial particulate secretome represented by extracellular vesicles (EV).
Approach and Results.
We identified EndoMT in obese human AT depots by immunohistochemical co-localization of CD31 or vWF and α-SMA. We showed that AT EC exposed in vitro to TGFβ, TNFα and IFNγ undergo EndoMT with progressive loss of endothelial markers. The phenotypic change results in failure to maintain a tight barrier in culture, increased migration and reduced angiogenesis. EndoMT also reduced mitochondrial oxidative phosphorylation and glycolytic capacity of EC. EVs produced by EC that underwent EndoMT dramatically reduced angiogenic capacity of the recipient naïve endothelial cells without affecting their migration or proliferation. Proteomic analysis of EV produced by EC in the pro-inflammatory conditions showed presence of several pro-inflammatory and immune proteins along with an enrichment in angiogenic receptors.
Conclusions
We demonstrated the presence of EndoMT in human AT in obesity. EndoMT in vitro resulted in production of EV that transferred some of the functional and metabolic features to recipient naïve EC. This result suggests that functional and molecular features of EC that underwent EndoMT in vivo can be disseminated in a paracrine or endocrine fashion and may induce endothelial dysfunction in distant vascular beds.
Keywords: endothelial to mesenchymal transition, TGFβ, pro-inflammatory cytokines, visceral fat, extracellular vesicles, proteomics, migration, permeability, angiogenesis, proliferation
Subject codes: angiogenesis, endothelium/vascular type, growth factors/cytokines, inflammation, metabolism, proteomics, obesity, vascular disease
Graphical Abstract

Introduction
Obesity and co-morbidities are associated with maladaptive adipose tissue (AT) remodeling1. Increased production of inflammatory mediators, hypoxia and fibrosis are hallmark features of the AT microenvironment in obesity, in particular in visceral AT2–4. Endothelial cells (EC) in human obese visceral fat are suggested to contribute to such maladaptive remodeling due to reduced angiogenesis, increased production of inflammatory mediators and pro-fibrotic basement membrane collagens5, 6. However, the mechanisms leading to such effects are incompletely understood.
One of the distinctive features of EC response to local inflammation is de-differentiation and endothelial-to-mesenchymal transition (EndoMT). EndoMT involves the loss of endothelial identity towards unspecialized mesenchymal-like cells that could undergo re-differentiation into mesodermal cell types, including adipocytes, in response to local cues7, 8. They can also be responsible for production of pro-fibrotic collagens and loss of their angiogenic potential in response to VEGF6, 9. EndoMT can be triggered by various inflammatory cytokines and by TGFβ isoforms10 that are produced in inflamed AT by infiltrating macrophages and lymphocytes11, 12. In in vitro models of EndoMT, cross-talk experiments showed that tissue macrophages stimulated EndoMT via secretion of IFN-γ, TNF-α, and TGF-β13–15. Also, a recent publication demonstrated that TGF-β1 and β3 are potent inducers of collagen IV expression by EC in obese human AT and contribute to local fibrosis6. The molecular mechanisms leading to EndoMT are cell and tissue-dependent and some were described for cardiac and renal fibrosis16, 17, pulmonary hypertension18 and various malignancies7. However, to our knowledge, EndoMT was not yet explored in AT vasculature in obesity. In this paper, we showed that a subset of vessels in obese AT, in particular the omental visceral fat display characteristics of EndoMT. While this is a focal event of relatively low frequency, it may have significant local effects on tissue fibrosis and impaired angiogenesis. We also showed that primary EC from lean AT undergo EndoMT in response to TGF-β and pro-inflammatory cytokine treatment in vitro. As a result of this transition, the EC display altered morphology, reduced angiogenic potential, increased migration and permeability and reduction in glycolysis, fatty acid oxidation and ATP production.
Besides local effects in the AT microenvironment, dysfunctional EC may have systemic effects that can be mediated by endothelial-derived extracellular vesicles (EV) that could contribute to development of obesity co-morbidities such as cardiovascular disease and cancers. EC have been shown to secrete EV as well as capture them from various cell types19–21. This means of communication ensures a more targeted cellular transfer of mRNA, miRNA and protein cargos. Multiple effects in recipient cells including modulation of angiogenesis, cellular growth and metabolism were documented for EV generated by various cell types, including EC22–25. In this study, we showed that EC that displayed mesenchymal characteristics in response to a pro-inflammatory challenge produced larger numbers of EV compared to control EC. The EVs produced by control and mesenchymal-like ECs had distinct angiogenic and metabolic effects in recipient EC. Using LC/MS/MS, we characterized the proteome of extracellular vesicles before and after in vitro EndoMT induction and showed that the proteome of the EV produced by the latter cells carries their pro-inflammatory signature.
In summary, we found that: i) focal EndoMT is present in lean and obese AT in humans, in particular in capillaries of obese visceral fat; ii) this process was modeled in vitro by exposure of EC from lean AT to pro-inflammatory cytokines and resulted in increased permeability and migration with reduced proliferation and angiogenesis; iii) EndoMT may have systemic effects via extracellular vesicles that carry a pro-inflammatory proteome to distant sites and could therefore contribute to endothelial dysfunction in non-inflammatory environments. These studies show that the pro-inflammatory environment in human AT in obesity impacts on endothelial function and metabolism and has potential to affect distant vascular beds and contribute to obesity related co-morbidities such as cardiovascular disease and malignancies.
Material and Methods
The data that support the findings of this study are available from the corresponding author upon reasonable request.
Human subjects
For all studies involving human subjects informed consent was obtained, and the Eastern Virginia Medical School Institutional Review Board approved the research project. The study included a cross-sectional cohort of morbidly obese type 2 diabetic (T2D) and non-diabetic subjects, aged 18–65 years, undergoing bariatric surgery at Sentara Metabolic and Weight Loss Surgery Center (Sentara Medical Group, Norfolk, Virginia). Post-mortem pancreatic fat was obtained from Dr. Manami Hara from the Kolver Diabetes Center (University of Chicago Medicine, Chicago, Illinois). Exclusion criteria included autoimmune disease such as type 1 diabetes mellitus, conditions requiring chronic immunosuppressive therapy, anti-inflammatory medications, thiazolinendiones, active tobacco use, chronic or acute infections, or a history of malignancy treated within the last 12 months. T2D was defined as a fasting plasma glucose of 126 mg/dL or greater, a glucose of 200 mg/dL or greater after a 2 hour glucose tolerance test, or use of antidiabetic medications.
Endothelial cells
Human adipose microvascular EC (HAMVEC) were purchased from ScienCell Research Laboratories (cat#: 7200, Lot #: 5439). HAMVEC were cultured on fibronectin coated plates using complete EGM-2MV Bullet Kit media (Lonza, cat#: CC-3202) supplemented with 1.0% Penicillin/Streptomycin (ThermoFisher, cat#: 15140122) in a 37°C, 5% CO2 incubator. HAMVEC experiments were conducted between passages 4–8. HAMVEC were stimulated with 5 ng/mL of TGFβ, IFNγ, and TNFα for 1 and 6 days of pro-inflammatory cytokine treatment.
Western Blots
Cells were harvested from a 6-well plate using 350 μl Cellytic M (Sigma-Aldrich, cat#: C2978) with 3.5 μl (1x) of protease inhibitor cocktail (Sigma-Aldrich, cat#: P8340). Protein concentration was measured by BCA assay (Sigma-Aldrich, cat#: QPBCA) and used for even loading of 3–20 μg on a 10% to 12% polyacrylamide gel depending on molecular weight of protein of interest. A Li-Cor Chameleon Duo ladder (cat#: 928–60000) was used as a molecular weight standard. Gels were run in a Bio-Rad Mini-Protean 2 electrophoresis box for 1 – 1.5 hours at 120 V in Electrode Running Buffer (25 mM Tris, 192 mM glycine, 3.5 mM SDS). Millipore Immobilon-FL PVDF transfer membranes (cat#: IPFL00010) were cut to match gel size and prepared by soaking in 100% MeOH followed by water, and then Transfer Buffer (25 mM Tris, 192 mM glycine, 20% MeOH). The membrane and gel were then sandwiched together and assembled in the Bio-Rad Mini-Protean 2 cell and run for 1 h at 120 V in cold Transfer Buffer with an ice pack and stirring. Membranes were then blocked for 30 min in Odyssey Blocking Buffer (Li-Cor, cat#: 927–40000 or 927–50000) with rotation in a 50 ml conical tube. This was followed by an overnight incubation at 4°C in Odyssey Blocking Buffer with 0.1% Tween 20 (Bio-Rad Laboratories, cat#: 1610781) and 1:2000 mouse anti-α-Tubulin antibody (Sigma-Aldrich, cat#: T9026; Santa Cruz Biotechnology, cat#: sc-32293) as a loading control, and either 1:500 rabbit anti-CD31 (Abcam, cat#: ab28364), 1:500 rabbit anti-vWF (Santa Cruz Biotechnology, cat#: sc-14014), 1:500 rabbit anti-VE-cadherin (Santa Cruz Biotechnology, cat#: sc-28644), 1:500 rabbit anti-Occludin (Santa Cruz Biotechnology, cat#: sc-5562), 1:500 rabbit anti-αSMA (Abcam, cat#: ab7817), 1:1000 rabbit anti-Syntenin-1 (GeneTex, cat#: GTX108470), 1:1000 rabbit anti-CD9 (Cell Signaling Technologies, cat#: 13174), 1:500 rabbit anti-CD63 (Santa Cruz Biotechnology, cat#: sc-15363), 1:1000 mouse anti-Calnexin (BD Biosciences, cat#: 610523), 1:2,000 mouse anti-HSP70 (BD Biosciences, cat# 610607); 1:1000 rabbit anti-Lamp1 (Cell Signaling Technology, cat#: 9091), or 1:500 rabbit anti-CPT1a (ABclonal, cat#: A5307). On the next day, membranes were washed four times in PTw (PBS + 0.1% Tween 20) for 5 min each and subsequently incubated in Odyssey Blocking Buffer with 0.1% Tween 20, and 1:15000 goat anti-mouse IgG 680RD (Li-Cor, cat#: 926–68070) and 1:15000 goat anti-rabbit IgG 800CW (Li-Cor, cat#: 925–32280), or 1:10000 donkey anti-mouse IgG 800CW (Li-Cor, cat#: 925–32212) and 1:10000 donkey anti-rabbit IgG 680RD (Li-Cor, cat#: 926–68073). Membranes were then washed four times in PTw, rinsed two times in PBS, and stored in PBS at 4°C for imaging with a Li-Cor Odyssey IR scanner. Protein load for exosomal markers was 20 μg, except for Lamp-1, Calnexin and HSP70 which were ran on a protein load of 8.8 μg.
Immunocytochemistry of endothelial cells
20,000–30,000 EC were seeded on fibronectin-coated, 4-well chambered slides (Corning Life Sciences, cat#: 354559). Media was removed and cells were washed three times with PBS. The EC were fixed by incubating with ice-cold, 100% methanol for 30 minutes at −20°C. Cells were then washed three times with PBS and either permeabilization by 0.1% Triton X-100 (Sigma-Aldrich, cat#: 45zr11) for 30 min at 37°C for intracellular targets, or no permeabilization for membrane targets. After permeabilization, cells were further incubated for 10 minutes at room temperature, followed by washing three times with PBS and blocking with 10% Normal Goat Serum (NGS; Vector Labs, cat#: S-1000) for 1 hour at room temperature in a humidification chamber. Cells were washed three times with PBS and incubated with primary antibody overnight at 4°C for the following intracellular and extracellular proteins: vWF (1:100; Santa Cruz Biotechnology, cat#: sc-14014), Vimentin (1:100; ABclonal Science, cat#: A2666), Twist-1 (1:100; Sigma-Aldrich, cat#: T6451), Snai1 (1:50; Santa Cruz Biotechnology, cat#: sc28199), CD31 (1:200; Abcam, cat#: ab28364), α-SMA (1:100; Abcam, cat#: ab7817), N-Cadherin (1:100; BD Biosciences, cat#: 610920), and VE-Cadherin (1:200; Santa Cruz Biotechnology, cat#: sc-28644). The next day, cells were washed three times with PBS and incubated for 1 hour at room temperature with the following secondary antibodies: goat anti-rabbit FITC (1:500; Jackson ImmunoResearch, cat#: 111-025-003) and goat anti-mouse TRITC (1:500; Jackson ImmunoResearch, cat#: 31541). Cells were washed three times with PBS and incubated with 5 μg/ml DAPI (ThermoFisher Scientific, cat#: D1306) for 10 min. Finally, Cells were washed three times with PBS and mounted and coverslipped using Fluoromount-G (SouthernBiotech, cat#: 0100–01). Coverslipped slides were imaged on an Olympus BX50 fluorescence microscope.
Adipose Tissue Immunohistochemistry
Human AT was fixed with Z-Fix and paraffin embedded. Paraffin was melted from tissue sections by placing sections in a 60°C, non-CO2 incubator for at least 1 hour. Slides were rinsed in xylene twice for 5 min each and then washed for 5 minutes each in the following duplicate alcohol solutions: 100%, 95%, and 70%. Sections were transferred to distilled water for duplicate, 5 minute washes. Antigen retrieval was then performed by microwaving two times for 6 min each in 10 mM Sodium Citrate, pH 6, with 0.005% Tween 20, and then cooled for 10 min in ice cold water with 0.2% Tween 20. Sections were blocked by incubating in a humidified chamber for 10 min in PBS with 0.1% Triton X-100 (Sigma-Aldrich, cat#: X-100) and 1% BSA with gentle rocking on a Fisher Scientific Orbital Shaker at 40 rpm. Slides were incubated in the humidified chamber overnight at 4°C in PBS with 0.1% Tween 20, 1% BSA, and 1:25 vWF or 1:200 CD31 and 1:100 αSMA. On the next day, sections were washed three times in water with 0.2% Tween 20 for 5 min each, and then incubated for 30 min in the humidified chamber at room temperature on an orbital shaker in PBS with 0.1% Tween 20, 1% BSA, 2.5–5 μg/ml DAPI, and 1:250 goat anti-mouse IgG TRITC and 1:250 goat anti-rabbit IgG FITC. Slides were washed three times in water with 0.2% Tween 20 for 5 min each, dipped in water for 5 min, and incubating for 5–8 min in 0.5 mM CuSO4 in 50 mM ammonium acetate, pH 5, to quench auto-fluorescence. After quenching, slides were rinsed in water, re-equilibrated for 5 min in PBS, and then coverslipped with Fluoromount G. Images of tissue sections were taken with an Olympus BX50 fluorescence microscope or Zeiss 880 confocal microscope.
In vitro tube formation
Growth Factor Reduced Matrigel (Corning, cat#: 356231) was thawed overnight on ice at 4°C. Matrigel was diluted 1:1 with EGM-2MV Bullet Kit Media, and 150 μL of the diluted matrigel was aliquoted into wells of a 48-well plate. The plate was incubated in a 37°C, 5% CO2 incubator for approximately 30–45 min. HAMVEC were then incubated with 1 μg/ml calcein AM in growth media for 30 min at 37°C, and the excess dye was washed out with PBS. After calcein AM incubation, each well was seeded with 45,000 HAMVEC, or HAMVEC treated with PIC for 1 or 6 days, and allowed to grow in a 37°C, 5% CO2 incubator for 6 hours. To assess extracellular vesicle effect on tube formation, 105 cells were grown overnight in 24-well plates and treated with 109 EV-C or EV-PIC for 24 hours. Subsequently cells were seeded in Matrigel with control cells without EV treatment and handled as described above for control cells without EV treatment. Cells were imaged using an Olympus 72 fluorescent microscope and the number of branches and the tube lengths were assessed using Image J Angiogenesis Analyzer software.
Endothelial cell migration
Approximately 60,000 HAMVEC were seeded and allowed to grow in 8-well electrode arrays obtained from Applied Biophysics (cat#: 8W1E). When cells reached confluency, they were stimulated with PIC for 24 hours. Electrodes were pulsed with 5 volts for 30 sec to induce a wound on the cell monolayer. Cell behavior was monitored using electric cell-substrate impedance sensing (ECIS) using an ECIS Model 1600R. Endothelial migratory responses were determined in real-time by measuring the recovery of electrical impedance in wells with untreated and PIC treated cells, respectively.
Permeability Assay
Approximately 60,000 HAMVEC were seeded and allowed to grow in 8-well electrode arrays from Applied Biophysics. When cells reached confluency, they were stimulated with PIC for 24 hours. Cell behavior was monitored using electric cell-substrate impedance sensing (ECIS) using an ECIS Model 1600R. Experiments were conducted on wells that achieved >800 Ω of baseline, steady-state resistance. Trans-endothelial electrical resistance (TER) was normalized to time point 0.
Extracellular vesicles isolation and characterization
HAMVEC were seeded on fibronectin coated T150 flasks until approximately 60–70% confluency was reached. FBS from the EGM-2MV Bullet Kit was 0.2-μm filtered to remove potential EV contamination. HAMVEC were then stimulated with PIC for 3 days to induce EndoMT. The cell culture media from control and PIC-treated HAMVEC were collected and centrifuged at 500 × g for 10 min to remove dead cells, and supernatant was collected. The sample was then centrifuged at 3,000 × g for 20 min to remove cytoplasmic organelles, and the supernatant was transferred and centrifuged at 10,000 × g for 40 min to remove cellular material and protein. The supernatant was transferred again and extracellular vesicles (EV) were pelleted for isolation by spinning samples at 100,000 × g for 90 min. Supernatant was removed and pelleted EV were washed by resuspending in PBS, followed by centrifugation at 100,000 × g for 90 min. After the EV wash, supernatant was discarded and the pellet containing EVs was resuspended in 500 μL of PBS. For EVs that were used for proteomic analysis the second PBS wash was replaced by a sodium carbonate wash. To determine concentration and size distribution, EVs were diluted 1:100 in PBS and nanoparticle tracking analysis was performed using NanoSight 300 [Camera Level: 12–15, Screen Gain: 1, Capture Number: 3, Capture Time Length: 30-seconds, Temperature: 25°C, Detection Threshold: 5].
Extracellular vesicles protein extraction and digestion
Approximately 20 μl of the EV in PBS were dissolved in RIPA buffer (25 mM Tris-HCl, pH 7.6, 150mM NaCl, 0.1% SDS, 1% NP-40, 0.5% sodium deoxycholate, 1mM EDTA, 1x Halt protease inhibitor cocktail (Thermo Fisher Scientific, cat#: 1861279)) and the protein concentration was quantitated by BCA assay (Thermo Fisher Scientific, cat#: 23225). For protein digestion, 20 μg EV protein was extracted by equal volume of 50% trifluoroethanol (TFE; Thermo Fisher Scientific, cat#: 28903) in 50mM NH4HCO3 (final 25% TFE) with intermittent waterbath sonication, reduced with 10 mM DTT (45 min, 56°C; Thermo Fisher Scientific, cat#: 20291), and alkylated with 20 mM iodoacetamide (30 min, room temperature, in the dark; Sigma-Aldrich, cat#: A-3221). The solution was diluted five times to 5% TFE and trypsin (with enzyme/protein =1:20; Promega, cat#: V511A) was added for digestion overnight at 37°C. After trypsin digestion, peptides were subjected to deglycosylation with 1000 Unit PNGase F (New England Biolabs, cat#: P0709S) for 6 hrs at 37°C. Digested peptides were desalted and purified using C18 pipette tips (Thermo Fisher Scientific, cat#: 87784) and concentrated by speed vac. Tryptic peptides was reconstituted to a volume of 20 μl using HPLC water/0.1% formic acid and the concentration of peptides was determined using a microBCA assay (Thermo Fisher Scientific, cat#: 23235).
LC-MS/MS
Peptide mixtures were analyzed by LC/ESI-MS/MS using a Q-Exactive (Thermo Fisher Scientific) mass spectrometer coupled to an Easy NanoLC-1000 system (Thermo Fisher Scientific) operating in data dependent acquisition mode. Three technical replicates were run for each sample. 2 μg peptide samples were loaded on a 15 cm analytical column (PepMap C18, 5 μm particles, 100 Å pore size; Thermo Fisher Scientific). Elution buffers used for reverse phase chromatography consisted of 0.1% (v/v) formic acid as solvent A and 100% acetonitrile with 0.1% (v/v) formic acid as solvent B. Peptides were separated over a total 120 min stepped linear gradient (2%B in 0–2min; 2–40% B in 112 min followed by 95% B in the next 3 min and hold at 95% B for 5 min) at a flow rate of 400 nl/min. Electrospray settings for the LC-MS/MS run was set at 1.9kV in positive ion mode with the S-lens set at 60 volts; capillary temperature at 250°C. All MS full scan spectra were acquired at a resolution of 70,000 and scan range of 400–1600 m/z, while MS/MS spectra were acquired at a resolution of 17,500 for the top 12 peaks resulting from the full MS scan. The AGC target settings for the full MS and MS2 ions were at 3E6 and 2E5, respectively. The Orbitrap fill times were set at 120 ms and HCD energy values were set at 27eV. Three blank runs using 0.1% formic acid buffer A were included before every sample injection to eliminate carry-over between the runs.
Data Analysis
For qualitative analysis, Thermo .raw files were converted to *.mgf using MSConvert (v3.0, ProteoWizard) and submitted to Mascot (v2.5.1, Matrix Science Ltd) and searched against Homo sapiens entries in the Swissprot database (release 09/2016; 20161entrices). The following settings were used for all searches: 20 ppm precursor tolerance, 0.08 Da fragment tolerance, carbamidomethylation of cysteine as a fixed modification, and oxidation (M) as well as N-terminal acetylation as variable modifications. The enzyme specificity was set to trypsin, and two missed cleavages were tolerated. Mascot search results were imported into Scaffold (v4.8.4, Proteome Software Inc.) and X! Tandem (version CYCLONE 2010.12.01.1) to facilitate MS/MS-based peptide and protein identifications. Protein probabilities were assigned by Protein Prophet. Protein identifications were accepted, if they reached greater than 99% probability and contained at least 2 identified peptides. These identification criteria established <0.01% false discovery rate based on a decoy database search strategy. Proteins that contained similar peptides and could not be differentiated based on MS/MS analysis alone were grouped to satisfy the principles of parsimony. Identified proteins were searched in the extracellular vesicle database Vesiclepedia version 3 and used for GO enrichment and functional category analysis in FunRich (version 3.0, http://funrich.org/index.html) using FunRich human database and Reactome human database. FunRich statistically analyzed the identified proteins with hypergeometric test using the corresponding human genome database as the background. A p value < 0.05 indicates a sub-group of genes that is significantly enriched in the sample against the background genome. Proteins with signal peptides, including transmembrane domains, were identified using ProteINSIDE’s basic analysis26 and SignalP 4.1 set to default thresholds27.
Mitochondrial Stress Test
50,000 HAMVEC were seeded into a 24-well Seahorse XFe24 microplate. Cells were allowed to adhere to the plate for 4 hours in a 37°C, 5% CO2 incubator. Wells that were assigned to assess EV effect on endothelial metabolism received 5 × 10⁹ EV-C or EV-PIC from 6 days untreated or PIC-treated HAMVEC cultures, respectively. The plate was incubated overnight to allow for uptake of the EVs by the cells. At the time of the assay the cells were 70–80% confluent. Oligomycin, trifluoromethoxy carbonylcyanide phenylhydrazone (FCCP), and rotenone/antimycin drugs were removed from the Mitochondrial Stress Test Kit (Agilent, cat#: 103015–100) and allowed to come to room temperature before use. The Agilent XFe24 Seahorse instrument was allowed to heat up to 37°C prior to start of the assay. The Agilent Hydrobooster Plate (cat#: 102342–100) was set up the night before running the assay in which 1 mL of Agilent XF Calibrant Solution (cat#: 103059–000) was added to the utility plate and allowed to incubate at 37°C in a non-CO2 incubator. 100 mL of Agilent Seahorse assay media (cat#: 102365–100) was prepared with the following ingredients: 25 mM D-glucose, 2 mM glutamine, and 2 mM sodium pyruvate. The Seahorse microplate was removed from the incubator and all of the wells were washed twice with seahorse assay media. The wells were checked via an inverted microscope to ensure that cells were still adherent to the plate. Each well of the Seahorse microplate was supplemented with 525 μL of assay media and allowed to incubate at 37°C in a non-CO2 incubator for 1.5-hours. A stock of 8, 9, and 5 μM concentration of oligomycin, FCCP, and rotenone/antimycin, respectively, was prepared according to the manufacturer’s instructions. 75 uL of oligomycin, FCCP, and rotenone/antimycin were added to ports A, B, and C, respectively, of the Hydrobooster plate. The XFe24 Seahorse instrument was calibrated by inserting the drug cartridge attached to the utility plate with the XF calibrant solution. Once the calibration of the instrument was completed, the Seahorse microplate was loaded onto the instrument. The settings utilized for the analysis on the Wave Controller were as follows: 2 min mixing, 3 min measuring, and 2 min waiting before proceeding to the next measurement. Cells were normalized to total amount of protein in each well, which was determined by collecting 100 μL RIPA lysates and performing a BCA Assay. All normalized data was extracted to Prism version 8 through Wave Software version 2.6 for further statistical and graphing analysis.
Glycolytic Rate Assay
50,000 HAMVEC were seeded into a 24-well Seahorse XFe24 microplate. Cells were allowed to adhere to the plate overnight in a 37°C, 5% CO2 incubator. At the time of the assay the cells were 70–80% confluent. Rotenone/antimycin and 2-deoxy-D-glucose drugs were removed from the Glycolysis Rate Test Kit (Agilent, cat#: 103344–100) and allowed to come to room temperature before use. The Agilent XFe24 Seahorse instrument was allowed to heat up to 37°C prior to start of the assay. The Agilent Hydrobooster Plate (cat#: 102342–100) was set up the night before running the assay in which 1 mL of Agilent XF Calibrant Solution (cat#: 103059–000) was added to the utility plate and allowed to incubate at 37°C in a non-CO2 incubator. 100 mL of Agilent Seahorse assay media (cat#: 102365–100) was prepared with the following ingredients: 10 mM D-glucose, 2 mM glutamine, and 1 mM pyruvate and 5.0 mM HEPES. The Seahorse microplate was removed from the incubator and all of the wells were washed twice with seahorse assay media. The wells were checked via an inverted microscope to ensure that cells were still adherent to the plate. Each well of the Seahorse microplate was supplemented with 500 μL of assay media and allowed to incubate at 37°C in a non-CO2 incubator for 45 minutes. A stock solution of rotenone/antimycin and 2-deoxy-D-glucose, respectively, was prepared according to the manufacturer’s instructions. 56 and 62 uL of rotenone/antimycin and 2-deoxy-D-glucose, were added to ports A and B of the Hydrobooster plate for a final concentration of 0.5 uM and 50 mM respectivly. The XFe24 Seahorse instrument was calibrated by inserting the drug cartridge attached to the utility plate with the XF calibrant solution. Once the calibration of the instrument was completed, the Seahorse microplate was loaded onto the instrument. The settings utilized for the analysis on the Wave Controller were as follows: 3 min mixing, 2 min waiting, and 3 min measuring before proceeding to the next measurement. Cells were normalized to total amount of protein in each well, which was determined by collecting 60 μL RIPA lysates and performing a BCA Assay. All normalized data was extracted to Prism version 8 through Wave Software version 2.6 for further statistical and graphical analysis.
Palmitate-BSA Fatty Acid Oxidation Assay
80,000 HAMVEC were seeded into a fibronectin-coated 24-well Seahorse XFe24 microplate. Cells were allowed to adhere to the plate overnight and cultured for an additional day in a 37°C, 5% CO2 incubator until they reached 100% confluence. At the time of the assay the cells were 100% confluent and adherent to the plate.100mL substrate-limited media was prepared with the following ingredients: 2.5 mM D-glucose, 1.0 mM glutamine, 0.5 mM carnitine, 1% FBS, EGM-2MV SingleQuots in DMEM. Growth media was removed from each well of the Seahorse plate and cells were supplemented with 500 μL substrate-limited media for 2 hours in a 37°C, 5% CO2 incubator. Oligomycin, trifluoromethoxy carbonylcyanide phenylhydrazone (FCCP), and rotenone/antimycin drugs were removed from the Mitochondrial Stress Test Kit (Agilent, cat#: 103015–100) and allowed to come to room temperature before use. The Agilent XFe24 Seahorse instrument was allowed to heat up to 37°C prior to start of the assay. The Agilent Hydrobooster Plate (cat#: 102342–100) was set up the night before running the assay in which 1 mL of Agilent XF Calibrant Solution (cat#: 103059–000) was added to the utility plate and allowed to incubate at 37°C in a non-CO2 incubator. 200 mL of Fatty Acid Oxidation (FAO) Assay medium was prepared with the following ingredients: 111 mM NaCl, 4.7 mM KCl, 1.25 mM CaCl2, 2.0 mM MgSO4, 1.2 mM NaH2PO4, 2.5 mM D-glucose, 0.5 mM carnitine, 5.0 mM HEPES, and adjusted to pH 7.4. The wells were checked via an inverted microscope to ensure that cells were still confluent and adherent to the plate. Substrate media was removed from each well of the Seahorse plate and cells were washed twice with FAO assay media then supplemented with FAO media and maintained in a non-CO2 incubator for 45 minutes at 37°C. A stock solution of Oligomycin, trifluoromethoxy carbonylcyanide phenylhydrazone (FCCP), and rotenone/antimycin, respectively, was prepared according to the manufacturer’s instructions. 56 and 62, and 75 uL of Oligomycin, trifluoromethoxy carbonylcyanide phenylhydrazone (FCCP), and rotenone/antimycin, were added to ports A, B, and C of the Hydrobooster plate, for final concentrations of 1.0 uM, 1.0 uM, and 0.5 uM. Cells receiving etomoxir were treated with a final well concentration of 4 uM 15 minutes prior to assay. The XF Palmitate-BSA FAO Substrates (Agilent, cat# 102720–100) palmitate-BSA (1.0 mM palmitate conjugated with 0.17 mM BSA) or BSA (0.17 mM BSA) was then added immediately prior to assay. The XFe24 Seahorse instrument was calibrated by inserting the drug cartridge attached to the utility plate with the XF calibrant solution. Once the calibration of the instrument was completed, the Seahorse microplate was loaded onto the instrument. The settings utilized for the analysis on the Wave Controller were as follows: 3 min mixing, 2 min waiting, and 3 min measuring before proceeding to the next measurement. Cells were normalized to total amount of protein in each well, which was determined by collecting 60 μL RIPA lysates and performing a BCA Assay. All normalized data was extracted to Prism version 8 through Wave Software version 2.6 for further statistical and graphical analysis.
Extracellular vesicles labeling
Vybrant DiO label (ThermoFisher Scientific, cat#: V-22886) was diluted 1:200 with PBS containing EVs and incubated for 10–20 min at 37°C. The reaction was stopped by adding an equivalent volume of 1% BSA/PBS to the EV mix, for 5–10 min. The labeled EVs were dialyzed overnight to remove excess unbound dye. Samples were used immediately or stored up to 48 hours at 4°C protected from light.
Extracellular vesicles uptake using fluorescent microscopy and flow cytometry
5 × 10⁴ HAMVEC were seeded on fibronectin coated, 4-well chambered slides and allowed to grow overnight in EGM-2MV complete endothelial growth media. Media was removed the following day and wells were washed once with PBS and allowed to incubate with 1×10¹⁰ DiO-labeled EV-C or EV-PIC for 16–18 hours in EGM-2MV complete media. Media was removed and wells were washed three times with PBS. For fluorescent imaging, cells were fixed with 2% formaldehyde/PBS for 15-minutes, and the wells were washed three times with PBS followed by incubation with 5 μg/ml DAPI for 5–10 min for nuclear staining. Chambers were removed and the slide was coversliped with Fluoromount G. Fluorescent signal was visualized using an Olympus BX50 fluorescence microscope.
For flow cytometry analysis, the cells were trypsinized and filtered into a FACS tube with cell strainer cap (Corning, cat#: 352235). Cells were pelleted at 300 × g, for 5 min, supernatant was discarded and cell pellet was re-suspended in 300 μL of 2% formaldehyde/PBS. PBS dialysate without cells but containing DIO was used as blank and accounted for background fluorescence due to residual unbound dye. Cells were analyzed on a BD Pharmingen upgraded FACS Caliber Flow Cytometer (8-colors) using FlowJo software (v10.3; TreeStar).
Endothelial cell proliferation
5 × 10⁴ HAMVEC were seeded into 4-well chambered slides and allowed to grow up to 50–75% confluency. Endothelial growth media was removed and cells were serum starved in DMEM media and treated with EV-PIC or EV-C for 16–18 hours. In a different set of experiments HAMVEC were incubated for either 1 or 6 days with or without PIC then trypsinized and seeded at a density of 5 ×10⁴ cells in 4-well chamber slides and allowed to grow overnight up to 50–75% confluency. For both experiments, HAMVEC were then incubated with 10 μM BrdU (Abcam, cat#: ab142567) in EGM-2MV media for 16–18 hours. BrdU labeling solution was removed from the wells and cells were washed three times with PBS. HAMVEC were fixed with 2% formaldehyde/PBS at room temperature for 30 min. Wells were washed three times with PBS, and the cells were permeabilized with 0.1% Triton X-100 for 30 min. Wells were then washed three times with PBS, and cells were hydrolyzed with 2 M hydrochloric acid (HCl) for 20 min at 37°C. HCl was removed and sodium tetraborate (0.1 M, pH=8.5) was added for 30 min at room temperature. Wells were washed three times with PBS, and cells were blocked with 10% NGS for 1 hour. After washing three times with PBS, the cells were incubated with anti-BrdU AlexaFluor 488 antibody (1:200; Santa Cruz Biotechnology, cat#: SC-32323 AF488) and 5 μg/ml DAPI prepared in 10% NGS. Wells were washed three times with PBS, and cover-slipped with Fluoromount G. Images were taken with an Olympus BX50 fluorescence microscope.
Flow Cytometry
Counted HAMVEC were incubated for 30 min at room temperature with the following cocktail of fluorophore-conjugated primary antibodies: CD45-FITC (1:100; BioLegend, cat#: 304006), CD31-APC/Cy7 (1:100; BioLegend, cat#: 303119), and CD90-PE (1:100; BD Biosciences, cat#: 555596). Cells were analyzed on a BD Pharmingen-upgraded FACS Caliber Flow Cytometer (8-colors) using FlowJo software (Tree Star Inc., Ashland, OR).
Acridine Orange/Propidium Iodide (AOPI) Cell Viability Staining
4 × 10⁵ HAMVEC were seeded into 100-mm petri dishes and allowed to grow up to 70–80% confluency In endothelial growth media. HAMVEC were stimulated with 5.0 ng/mL of pro-inflammatory cytokines for 1 and 6 days. After PIC stimulation, the growth media was removed and the cells were trypsinized. HAMVEC were resuspended in 1.0 mL of endothelial growth media. 12 μL of the cell suspension was thoroughly mixed with 12 μL of Acridine Orange/Propidium Iodide (Nexcelom Bioscience, cat#: CS2–0106). Cells were counted for viability determination using the automatic cell counter, AutoCellometer 2000 (Nexcelom Bioscience). Living endothelial cells fluoresced green, and dead cells fluoresced red.
Quantitative RT-PCR
Cells on a 6-well plate were lysed in 500 μl of Trizol and moved to 1.5 ml tubes. RNA was then extracted using the Zymo Research Direct-Zol miniprep plus kit (cat#: R2070 or R2072) following the manufacturer’s protocol, including the optional DNAse step, and eluted in 60 μl of nuclease free water (NFW). RNA concentration was measured with a ThermoFisher Scientific Nanodrop 2000 spectrophotometer, and subsequently reverse transcribed into cDNA using the Bio-Rad iScript supermix (cat#: 1708841). PCR mastermixes were made using PCR Buffer N (Sigma-Aldrich, cat#: P2192), 200 mM dNTPs (Promega, cat#: U1515), 3 mM total MgCl2 (Sigma-Aldrich, cat#: M8787), 0.3 U JumpStart Taq Polymerase (Sigma-Aldrich, cat#: D9307), and TaqMan PCR primers for either CD31 (ThermoFisher Scientific, cat#: Hs01065282_m1), vWF (ThermoFisher Scientific, cat#: Hs01109446_m1), Vimentin (ThermoFisher Scientific, cat#: Hs00958111_m1), VE-cadherin (ThermoFisher Scientific, cat#: Hs00170986_m1), FSP1 (ThermoFisher Scientific, cat#: Hs00243202_m1), Twist (Thermo Fisher, cat#: Hs01675818_s1), Snai1 (ThermoFisher Scientific, cat#: Hs00195591_m1), Snai2 (ThermoFisher Scientific, cat#: Hs00161904_m1), or α-SMA (ThermoFisher Scientific, cat#: Hs00426835_g1), ACLY (ThermoFisher Scientific, cat#: Hs00982738_m1), CPT1a (ThermoFisher Scientific, cat#: Hs00912671_m1), CPT2 (ThermoFisher Scientific, cat#: Hs00988962_m1), hsa-miR155–5p (ThermoFisher Scientific, cat#: 483064 mir). Master mixes were combined with 3 μl of NFW diluted cDNA for 10–30 ng total, or 3 μl NFW for no template controls, for 25 μl total volume in 96-well plates (USA Scientific, cat#: 1402–9500) and sealed with optical film (Bio-Rad, cat#: MSB1001). The plate was briefly spun at 1000 × g for 1 minute, followed by PCR with a Bio-Rad CFX96 C1000 thermocycler set to the FAM fluorophore using the following program: 10 min at 95°C, followed by 40 cycles of 15 sec at 95°C and 1 min at 60°C.
Wound healing assay
1 × 10⁵ cells were seeded on 24-well plates for approximately 48 hours until the monolayer was 100% confluent. Each monolayer was gently washed with PBS at least twice. 1 × 10¹⁰ PIC or untreated HAMVEC EVs were added to their respective wells and allowed to incubate for 16–18 hours in a 37°C, 5% CO2 incubator. Three straight scratches were generated perpendicular to marked vertical lines (top, middle, and bottom) using a p200 pipette tip. Images were taken with a 10x objective at time points t=0, t=4, t=8, t=12, and t=24 hours post-scratch. ImageJ (v1.51p; National Institutes of Health) wound healing software was utilized to analyze wound area.
Senescence Assay
100,000 cells were seeded into 6-well plates and allowed to grow to 50–60% confluency, and cells were treated with PIC for 1- and 6-days. Cells were stained for β-galactosidase according to the Senescence β-Galactosidase Staining Kit (Cell Signaling Technology, cat#:9860). Briefly, the endothelial growth media was removed from the plate and washed once with PBS. Wells were incubated with 1X fixative for 15-minutes, and the plate was washed twice with PBS. 1.0 mL of β-galactosidase staining solution (pH 5.8) was added to each well, and the plate was covered and wrapped in parafilm. The plate was stored for 16–18-hours in a non-CO2 incubator. Bright-filed images were taken using an Olympus IX 73 microscope. DAPI nuclear staining was used to count the total number of cells.
Statistical analysis
Statistical analysis was performed using GraphPad Prism Software v7.03 (GraphPad Sofotware). Data is expressed as the mean ± standard deviation. Normality and heterogeneity of variance assumptions were verified using Shapiro-Wilk and Levene tests, respectively. If data passed assumptions, student’s t-test was performed for comparisons of two groups, and ANOVA was performed for comparisons of three or more groups. A Tukey’s HSD test was performed for post-hoc analysis of groups when utilizing ANOVA. If data failed either assumption, non-parametric tests, such as Wilcoxon Rank and Kruskal-Wallis, were conducted to determine significance. The null hypothesis was rejected for p-value < 0.05.
Results
Endothelial-to mesenchymal transition occurs in human AT
Visceral and subcutaneous AT samples were obtained from age-matched lean (BMI 23.3±2.18 kg/m2) (n=8, 3F/5M) and obese (BMI 42.4±1.27 kg/m2) (n=8, 4F/4M) non-diabetic subjects, as documented by medical history and HbA1c levels (Supplemental Table I). Adipose tissue FFPE sections were analyzed for the presence and co-localization of endothelial (CD31 or vWF) and mesenchymal (αSMA) markers using confocal fluorescence microscopy (Figure 1A,D). The presence of EndoMT was defined as at least one co-localization event/vessel. Small arteries/veins (> 200μm diameter), arterioles/venules (25μm −200μm diameter) and capillaries (<25μm diameter) were analyzed separately for presence of EndoMT (Figure 1A,D). Evidence of EndoMT was found throughout the vessel size continuum and in both depots in obese subjects as well as in visceral lean AT (Figure 1). In visceral fat of lean individuals, an average between 4.5–6.2% of the small arteries/veins, arterioles/venules and capillaries, co-expressed vWF and αSMA markers (Figure 1C). This result was consistent with CD31 and αSMA co-localization, with an average of 4.2–7.2% of vessels of all sizes displaying EndoMT (Figure 1E). Analysis of visceral fat from obese subjects showed significantly higher percentages of vessels with co-localization events for vWF and αSMA for each of the small arteries/veins (15± 4.4%), arterioles/venules (15.6±3.1%) and capillaries (29±4.4 %) compared to respective vessel sizes from visceral AT of lean subjects (Figure 1C). Also, the percentage of capillaries positive for EndoMT was ~2-fold higher compared to both small arteries and arterioles in obese visceral fat (Figure 2A, C). This result was consistent with the results obtained from CD31 and αSMA co-localization (Figure 1E). To determine whether EndoMT varied with adipose depot location in obesity, we analyzed vessels from subcutaneous AT samples compared with paired visceral AT samples from same subjects. Small arteries/veins, arterioles/venules and capillaries from obese subcutaneous AT depots showed an average of 6.1–9.5% of vessels with vWF and αSMA co-localization, which was significantly lower compared to paired visceral AT samples, but not significantly different from lean visceral samples (Figure 1C). Similar albeit slightly higher average percentages (5.5–12%) of EndoMT positive vessels were found using CD31 and αSMA co-localization; these too, were significantly lower than paired obese visceral samples (Figure 1E). Interestingly, we found that in visceral AT from obese subjects, 53±7.8% of vessels in the 25–200μm range, that stained positive for αSMA did not express vWF (Figure 1F). This result was unique for the vascular ECs in the visceral depot of obese subjects. The lack of staining is not artifactual since other vessels in proximal areas of the same tissue showed a robust signal for vWF (Figure 1A, middle row, middle panel). While the explanation for selective absence of vWF is not clear, it may indicate a more advanced process of endothelial de-differentiation or secretion of vWF in the media due to local inflammation or oxidative stress. Although obtained from a small number of subjects these results show for the first time the presence of EndoMT in human AT vasculature. We found that the vessels that show most frequent EndoMT are capillaries from visceral AT of obese subjects.
Figure 1. Endothelial-to-Mesenchymal Transition (EndoMT) is present in human lean and obese adipose tissue.

Immunohistochemical analysis of adipose tissue from lean and obese subjects. Visceral peri-pancreatic AT samples from 8 subjects with average BMI of 23.3±2.18 kg/m2 and paired omental visceral and subcutaneous AT samples from 8 subjects with average BMI of 42.4±1.27 kg/m2 were analyzed for presence of EndoMT by staining for vWF (red) and αSMA (green). Nuclei are blue by DAPI staining. Co-localization (EndoMT) shown in yellow is emphasized by magnification boxes or indicated by white arrows. A. Representative pictures of vessels >200μm (top), 25μm-200μm (middle) and <25μm(bottom), corresponding to small arteries, arterioles and capillaries, respectively. Please note the complete loss of vWF staining in an arteriole from visceral fat of an obese subject. Negative controls are shown in B. Quantitative analysis of vessels exhibiting luminal co-localization of vWF and αSMA is chown in C. Positivity for EndoMT was counted when at least one event was observed/vessel. Data was expressed as the number of vessels with positive co-localization normalized to αSMA+ vessels. 40–120 total vessels in each of the size range (including small arteries, arterioles and capillaries) from 3 sections each of 8 patients/group were analyzed. Data is expressed as mean±SD. Samples were analyzed using one-way ANOVA. To confirm the frequency of EndoMT using a different endothelial marker, CD31 and αSMA double positive cells were counted separately in small arteries/veins, arterioles/venules and capillaries. Representative images from obese visceral AT are shown in D. A significant up to 50% percent of vessels between 25–200μm showed complete loss of vWF staining selectively in obese visceral fat, as quantitated in F; a number of 20–80 vessels in each category were counted in 4 subjects/group.
Figure 2. Human adipose microvascular endothelial cells (HAMVECs) treated in vitro with pro-inflammatory cytokines (PIC) show phenotypic and molecular markers of EndoMT.

HAMVECs were plated at a density of 20,000 cells on fibronectin-coated 4-well glass chamber slides and either left untreated or treated with 5.0 ng/mL of each of TNFα, IFNγ and TGFβ (PIC) for either 24 hours or for 6 days to mimic acute and chronic pro-inflammatory conditions. For PIC treated cells, fresh media with PIC was added at the beginning and after 3 days in culture. A. Representative micrographs showing EC cobblestone phenotype of control cells after 1 or 6 days in culture and the spindle-like mesenchymal phenotype of PIC-treated cells at both time points. Magnification 100x. B. Representative western blots showing expression of endothelial markers vWF, CD31, VE-cadherin (CD144) and mesenchymal marker αSMA. Tubulin was used as a housekeeping protein control. Quantification of western blots is shown in C. Data represents the average of densitometric analysis of respective protein bands from 3 independent experiments performed in triplicate with cells from 3 individual donors on passages 4–6. Data represents mean ± SD. Comparisons between untreated and PIC-treated samples separately at day 1 and day 6 were performed using Student’s paired t-test; * = p-value<0.05. D. Representative micrographs of immunocytochemistry for endothelial markers CD31, vWF, VE-cadherin and mesenchymal markers Twist-1, Snail-1, vimentin, N-cadherin and αSMA in untreated and PIC samples after 1 and 6 days in culture with corresponding negative controls. Nuclei are shown blue with DAPI staining. Each of the markers was detected in 3 independent experiments performed in duplicate on cells from 3 different donors on passages 4–6. White box in αSMA panels shows an enlarged nucleus with punctate positive staining. Magnification for all panels is 200x (Scale Bar = 50 μm).
In vitro treatment of human adipose tissue endothelial cells (HAMVEC) with TGFβ and pro-inflammatory cytokines induces progressive EndoMT phenotypes
To model in vitro EndoMT we chose primary human microvascular endothelial cells from adipose tissue (HAMVEC). We confirmed the purity and endothelial characteristics of each batch of cells using flow cytometry for CD31, CD45 and CD91. We found that >95% of EC expressed the endothelial marker CD31 and were virtually negative (<2%) for the hematopoietic and fibroblast markers CD45 and CD91, respectively (Supplemental Figure I). To induce EndoMT, we used a combination of the pro-inflammatory cytokines IFNγ, TNFα and TGFβ (PIC) (5ng/mL each) that are known to be increased in AT of obese humans6, 12, 28. Also, this combination of cytokines was used to induce EndoMT in vitro in EC from other vascular beds, including pulmonary artery EC and dermal EC29. We confirmed that the concentration and duration of treatment with PIC did not induce cytotoxicity or resulted in decreased EC viability (Supplemental Figure II). With this PIC combination, we examined longitudinal protein and gene expression of endothelial and mesenchymal markers after 1 day or 6 days of treatment (Figure 2 and Supplemental Figure III). As early as 24 hours of culture in the presence of PIC, HAMVEC showed a change in morphology consistent with a more mesenchymal spindle-like phenotype that was maintained after 6 days of PIC treatment (Figure 2A). A combination of western blot and immunohistochemistry showed changes in expression and/or localization of various molecular markers following 1 or 6 days of PIC treatment. While neither gene nor protein expression of CD31 were significantly changed in treated cells, the localization of CD31 was dramatically shifted from plasma membrane to a diffuse cytoplasmic signal, especially after 6 days of treatment (Figure 2B,C,D and Supplemental Figure III A,B). While gene expression of vWF was not changed following PIC treatment (Supplemental Figure III A, B), the protein expression was significantly reduced after 6 days of treatment as measured by western blot, consistent with a reduction of the signal in the immunostained cells (Figure 2B, C, D). Importantly, the loss of vWF staining in vitro is consistent with the lack of expression of vWF in some EC from visceral AT vasculature of obese humans, suggesting potentially similar mechanisms (Figure 1A,F). Gene expression of VE-cadherin was reduced in PIC treated cells after 6 days (Supplemental Figure III), however Western blots showed an equal reduction in VE-cadherin expression in controls and PIC treated cells compared to day 1 (Figure 2B, C). Importantly, localization of VE-cadherin shifted dramatically from plasma membrane to cytosolic and nuclear compartments, in PIC treated cells only, especially after 6 days of treatment (Figure 2D). The mesenchymal marker αSMA was significantly increased by 2-fold in PIC treated cells after 6 days of treatment suggesting that at least some of the cells were undergoing active EndoMT (Figure 2C). Interestingly, while the αSMA signal was detectable in both the control and PIC treated cells as punctate nuclear staining, the cytoplasmic filaments were only visible in some of the PIC treated cells, with higher frequency after 6 days of treatment (Figure 2D). The transcription factor Twist-1, known to promote epithelial to mesenchymal transition and EndoMT also showed a shift in localization from a predominantly cytosolic location to a nuclear location in PIC-treated cells, suggesting functional activation, despite no changes in gene expression (Figure 2D, Supplemental Figure III). Snail1, another EMT marker known to act in tandem with Twist-1 showed significantly increased gene expression after 1 and 6 days of treatment consistent with increased protein expression and nuclear localization (Figure 2D, Supplemental Figure III). Also, an increase in expression of vimentin and N-cadherin, were noticeable by immunostaining after 6 days of treatment, although gene expression of vimentin was decreased (Figure 2D and Supplemental Figure III). Collectively, analysis of cellular markers and cell morphology suggest that HAMVEC progressively underwent EndoMT in vitro following PIC treatment. Although the net expression of some proteins was not significantly changed, a re-distribution of such proteins within cellular compartments indicated either a loss of function (for endothelial markers CD31 and VE-cadherin) or functional activation (for Twist1) both consistent with EndoMT. The effects were not merely the result of the cytotoxicity induced by PIC, as the cytotoxic effect was minimal and cell viability was >90% and not significantly different from controls at the concentrations used in these studies (Supplemental Figure II).
In vitro EndoMT induces functional changes in EC
To determine whether PIC treatment results in functional changes in EC behavior we measured endothelial barrier function, migration and proliferation of treated cells. Under normal circumstances the endothelium forms a low and selective permeable barrier that controls molecular trafficking and immune surveillance. Compared to confluent untreated cells, PIC treated EC showed a rapid reduction in the monolayer barrier measured as normalized trans-endothelial resistance (Figure 3A). After 24 hours of PIC treatment, the cell monolayer retains lower resistivity compared to the monolayer of control cells, and the area under curve (AUC) is also significantly lower compared to untreated cells (Figure 3A) which is consistent with increased monolayer permeability. Using a similar approach we determined the speed of wound closure as a measure of migratory ability of cells following PIC treatment. Compared to untreated cells, PIC-treated EC migrated and closed the wound significantly faster (Figure 3B). This behavior is consistent with the change in morphology and the acquired mesenchymal-like phenotype of the PIC treated cells. Using an in vitro scratch assay we also measured the migratory potential of EC after 6 days of treatment with PIC compared to 1-day PIC treatment and untreated controls (Supplemental Figure IV). Results of this experiment confirmed the increased migratory potential of PIC treated cells for 24 hours, which is retained after 6 days of cytokine treatment (Supplemental Figure IV). Proliferation of cells after 1 or 6 days of PIC treatment showed significantly lower proliferation rates, as measured by BrdU incorporation, compared to control cells seeded at similar densities prior to the assay (Figure 3C). Since proliferation may be impacted by cellular senescence possibly due to cytokine treatment, we measured senescence using a β-galactosidase assay. Both after 1 and 6 days of cytokine exposure the EC did not show a change in the number of senescent cells, measured as activity of β-galactosidase (Supplemental Figure V). After 6 days of cytokine exposure only ~12% of the cells showed positivity for β-galactosidase staining, which was comparable to control cells seeded in similar conditions (Supplemental Figure V). This result rules out the impact of cellular senescence on proliferative capacity of PIC-treated EC.
Figure 3. Changes in permeability, migration and proliferation of HAMVEC treated with PIC compared to un-stimulated controls.

A: Averaged curves and quantitation of trans- endothelial electrical resistance (TER) of untreated or PIC treated HAMVECs for 24 hours. TER was monitored in confluent cell monolayers for 24 hours using an electric cell substrate impedance sensor instrument (ECSIS). Data was quantitated using area under curve (AUC) and the results from three different experiments performed in triplicate were presented as average±SD. B: Averaged curves showing the “wound closure” kinetics of untreated and PIC treated cells for 24 hours prior to application of the wound. Wound closure was expressed as speed of closure (μm/hr). Data represent average from three independent experiments performed in duplicate. C: Representative micrographs and quantitation of HAMVEC proliferation using BrDU incorporation assay. Untreated or PIC treated cells for either 1 or 6 days were plated on fibronectin-coated chamber slides and incubated with BrDU for 24 hours. Cell nuclei are stained blue with DAPI. Nuclei of the proliferating cells are stained green using a FITC-labeled BrDU antibody. Overlapping images of the same field show both proliferating cells (light blue nuclei) and non-proliferating cells (dark blue, DAPI only). Magnification is 200x (Scale Bar=50-μm). Quantitation was done by calculation of % of BrDU stained cells to total cells. Data is expressed as % proliferation of PIC treated cells compared to control cells for each of the 1hr and 6 hr time points ± SD. For each experimental condition, three independent experiments with cells from three independent donors were performed in duplicate and 3 different areas for each replicate were imaged and counted. Cells between passages 4–7 were used in all experiments. Statistical analysis was performed using paired Student’s t-test between PIC and control samples.
We further investigated the ability of EC to undergo tube formation in an in vitro matrigel assay. It is known that mesenchymal cells do not have the ability to form tubes in vitro or to undergo angiogenesis in response to growth factors or oxygen gradients. After 1 day of PIC treatment, a slight decrease in tubule length and branching interval was noted however the treated cells showed comparable overall angiogenic potential with controls cells (Figure 4A). However, after 6 days of PIC treatment EC completely lost their ability to mount an angiogenic response in the presence of VEGF (Figure 4B).
Figure 4. In vitro EndoMT reduces angiogenic potential of EC.

HAMVEC with or without PIC treatment for 1day (A) or 6 days (B) were labeled with calcein, seeded in growth factor reduced Matrigel coated plates and incubated for 6 hours before imaging. Representative micrographs (top panels) show reduced formation of branches and reduced tubule length in PIC treated cells, which were totally blunted after 6 days of treatment; Magnification 40x (Scale Bar=200-μm). Angiogenesis was quantified as average numbers of branches and average tubule lengths in three independent experiments performed in triplicate. Three different pictures for each replicate were analyzed using the Image J Angiogenesis software and data was represented as average ±SD. ND = not detectable. Data represents average of three independent experiments performed in duplicate using EC from 3 individual donors on passages 4–7. Data is expressed as the mean+/−SD. Comparisons were performed using paired Student’s t-test.
Next, we measured energy metabolism of EC treated with PIC for 6 days since it is known that EC are more glycolytic compared to mesenchymal-like cells. Using the mitochondrial stress test we found that both the basal respiration and ATP production upon mitochondrial uncoupling using FCCP are significantly reduced in PIC treated cells compared to controls (Figure 5A). Using a glycolytic stress test we found that proton efflux rate derived from glycolysis (glycoPER) was significantly lower by ~50% in the PIC treated EC (Figure 5B). When palmitate-BSA was the only available metabolic substrate, the oxygen consumption rate was dramatically reduced by 5-fold in the PIC treated cells, suggesting that the ability of the later cells to generate ATP via fatty acid oxidation is severely compromised (Figure 5C). Overall, the PIC treated cells appear to be significantly more quiescent under basal conditions, as shown by the energy phenogram in Figure 5D. This metabolic anergy may explain the low proliferative rates and the loss of angiogenic response in these cells.
Figure 5. In vitro EndoMT alters the metabolic profile of EC and reduces expression of enzymes involved in lipid metabolism.

A: Oxygen consumption rate (OCR) was utilized to assess endothelial metabolism in HAMVECs stimulated with PICs for 6 days using a Mitochondrial Stress Test. Cells were seeded into Seahorse XFe24 plates at 50,000 cells/well and allowed to attach and grow for 24 hours until they reached 70–80%confluence. Respiration data was normalized to total cellular protein. B: Proton efflux rate due to glycolysis (GlycoPER) was measured using the glycolysis stress kit in cells seeded in similar conditions as above. Data is normalized to total protein. C: Fatty acid oxidation was measured using palmitate-BSA as a substrate according to a protocol detailed in Methods section. For this assays cells were allowed to reach 100% confluence. Etomoxir (4uM) was used as a positive control for inhibition of beta-oxidation D: Phenogram showing extracellular acidification and oxygen consumption; E: Gene expression of Cpt1, Cpt2 and Acly was measured in control and PIC-treated HAMVEC for 6 days by real-time PCR; F: Western blotting and semi-quantitation of CPT1a expression in HAMVEC treated with PIC for 6 days and untreated controls.G: miR-155–5p measured by real-time PCR in PIC-treated cells for 6 days compared to controls. H: Diagram showing proposed scenario involving down regulation of CPT1, and ACLY via miR-155–5p leading to an overall reduction in HAMVEC metabolism in response to PIC treatment. Data represents average of three independent experiments performed in duplicate using EC from 3 individual donors on passages 4–8. Data is expressed as the mean+/−SD.
To further explore potential causes for the dramatic reduction in fatty acid oxidation we measured gene expression of three key proteins involved in fatty acid oxidation and synthesis, carnitin palmitoyl transferases 1a and 2 (CPT1a, CPT2) and ATP citrate lyase (ACLY). We found that expression of all three genes is significantly reduced following 6 days of PIC treatment (Figure 5E). Also, consistent with gene expression data, protein expression of CPT1a was significantly downregulated in PIC-treated cells (Figure 5F). Using a preliminary high throughput screening for miRNA expression in PIC-treated cells compared to controls, we identified miR-155–5p uniquely expressed in the former cells. We confirmed by real-time PCR that miR-155–5p is borderline detectable in control ECs and robustly expressed in PIC-treated EC (Figure 5G). miR-155–5p, is known to be increased in a variety of cells, including endothelial cells, by pro-inflammatory conditions and CPT1a and ACLY are both its validated gene targets. Overall, the data suggests that miR-155–5p may be key in inhibiting its validated gene targets CPT1a and ACLY, which in turn reduce both the oxidative and lipogenic activities of PIC treated ECs (Figure 5H).
In vitro EndoMT leads to increased production of extracellular vesicles (EV)
EVs are actively released by EC and contain a diverse cargo of proteins, mRNAs, miRNAs and DNA fragments that carry the molecular signature of the originating cell30. We found that PIC treated EC release ~2.5-fold more EV (hereby referred to as EV-PIC) compared to the EV produced by control, untreated cells (EV-C) (Figure 6A). Both EV-PIC and EV-C have similar size distributions with peaks around 150nm (Figure 6C) and their size and morphology were confirmed by negative staining electron microscopy (Figure 6B). Also, some exosome specific biomarkers were found on both EV-PIC and EV-C by western blot. In particular, EV preparations were similarly enriched in Syntenin-1 and CD9 compared to the parent cell homogenates and also contained CD63 (Figure 6D). EVs did not contain calnexin, an endoplasmic reticulum marker or LAMP-1, a lysosomal marker, showing that the EV preparations were not contaminated with intracellular organelles or cellular debris (Figure 6D). Next, we determined the cellular uptake of EV-PIC and EV-C by sub-confluent EC between passages 3–5. The uptake of PKH 67 labeled EV was determined by flow cytometry of cells following incubation with fluorescent EVs for 24 hours. There was no difference in the EV uptake when similar ratios of EV:cell (105 :1) were used, and the uptake did not vary with passage number (Figure 6G). When cells were incubated with EV at RT, the uptake was almost entirely abolished, as shown in the representative micrographs in Figure 6F. This result indicates that the EV uptake is specific and energy dependent.
Figure 6. Production and characterization of HAMVEC particulate secretome (extracellular vesicles -EV) in response to PIC treatment.

A: Nanoparticle size distribution of extracellular vesicles (EV) isolated from untreated control cells (EV-C) and from PIC-treated cells (EV-PIC) shows an average peak size of 140–150-nm for both EV preparations. B: Representative micrographs of negative staining electron microscopy of EV-PIC and EV-C confirms the presence of EVs in the size range calculated by nanoparticle tracking analysis in both preparations; C: Nanosight analysis shows a 3-fold higher number of EV-PIC/cell compared to EV-C. This difference was consistent across 12 different EV preparations from control and PIC treated cells. D: Western blot showing expression of various markers in control and PIC treated cells and in EV-C and EV-PIC extracellular vesicles. Exosomal markers syntenin-1 and CD9 are enriched in both EV-PIC and EV-C compared to parent cells and CD63 and HSP70 were present in both EV preparations; calnexin (microsomal marker) and LAMP1 (lysosomal marker) were not detectable in either one of the EV preparations. E: diagram showing experimental protocol for EV production, isolation and incubation with recipient cells. F: EV-PIC and EV-C were labeled with the fluorescent lipophilic dye Vybrant DiO and incubated with EC overnight; representative micrographs show uptake by HAMVEC at 37°C and show dramatic reduction of uptake at 22°C, suggesting an energy dependent uptake mechanism; magnification 100x (Scale Bar=100-μm); higher magnification inset shows the peri-nuclear distribution of the labeled EVs. G: Quantitative analysis of EV uptake using flow cytometry of the HAMVEC cells after 24 h incubation with labeled EVs. Representative flow cytometry plots show the background control that was subtracted from the uptake data (left panel); negative control (center left) and EV-PIC and EV-C representative uptake plots. Concentration dependent uptake was determined in pilot experiments. Results shown here are from incubation of 105 cells with 1010 EV-C or EV-PIC for 24 hours. Data is expressed as mean of % cell uptake ± SD and shows no difference between uptake of EV-C and EV-PIC. Results are from 3 independent experiments, performed in duplicate, using cells from 3 separate donors, on passages 4–5.
EndoMT leads to production of EV that are anti-angiogenic
Next, we investigated the functional effects of EV-PIC on 70% confluent EC under optimal culture conditions. We compared cells treated for 24 hours with either EV-PIC or EV-C or untreated, as controls. EC treated with EV-C showed very similar behavior with control cells with similar number of branches and branching intervals, tubule length, number of nodes and mesh index (Figure 7A). Treatment of EC with EV-PIC vesicles resulted in a dramatic reduction in all of the network parameters above, closely resembling the data obtained after 6 days of cytokine treatment (Figure 7A). Notably, this effect was produced after only 24 hours incubation with EV-PIC. Since there is no difference in the uptake between EV-PIC and EV-C, the difference in angiogenic response is likely attributable to the specific vesicle cargo.
Figure 7. EV from control and PIC treated cells reduce angiogenesis and selectively impact energy metabolism in recipient HAMVECs A:

HAMVEC were incubated for 24 hours with either EV-C, EV-PIC or were left untreated. Following treatment, cells were labeled with calcein, seeded in growth factor reduced matrigel coated plates and incubated for 6 hours before imaging. Representative micrographs (top panels) showing reduced formation of branches and reduced tubule length in HAMVEC treated with EV-PIC compared to untreated cells; Magnification 40x (Scale Bar=200-μm). Treatment with EV-PIC severely impaired tube network parameters compared to untreated control cells and EV-C treated cells. Angiogenesis was quantified in three independent experiments performed in triplicate. Three different pictures for each replicate were analyzed using the Image J Angiogenesis Analyzer software and data was represented as average ±SD. B: Oxygen consumption rate (OCR) was utilized to assess endothelial metabolism in cells treated with EV-C or EV-PIC using a Mitochondrial Stress Test. Cells were seeded into Seahorse XFe24 plates and allowed to attach and grow for 24 hours until they reached 70–80% confluence . Respiration data was normalized to total cellular protein. B: Proton efflux rate due to glycolysis (GlycoPER) was measured using the glycolysis stress kit in cells seeded in similar conditions as above. Data is normalized to total protein. C: Fatty acid oxidation was measured using palmitate-BSA as a substrate according to a protocol detailed in Methods section. For this assays cells were allowed to reach 100% confluence. Etomoxir (Eto) (4uM) was used as a positive control for inhibition of beta-oxidation Data represents average of three independent experiments performed in duplicate on cells from 3 individual donors on passages 4–6 and are expressed as the mean+/−SD.
We also examined the metabolic profile of the cells that received treatments with EV-PIC compared to EV-C and untreated cells. Using the mitochondrial stress test we found similar maximal respiration and ATP production of EV-C, EV-PIC and control cells (Figure 7B). Also, the proton efflux rate due to glycolysis is similar for the EV-treated and control cells (Figure 7C). Interestingly, measurement of maximal oxygen consumption due to palmitate oxidation was significantly reduced in both EV-C and EV-PIC treated cells (Figure 7D). This result suggests that EV-treated EC rely primarily on glycolysis for generation of ATP and have limited capacity for fatty acid oxidation. Also, this metabolic profile cannot explain the angiostatic effect of EV-PIC. Indeed, treatment of EC with etomoxir, to inhibit fatty acid oxidation only changed some of the angiogenic network parameters, when applied on control cells seeded on Matrigel (Supplemental Figure VI). Remarkably, other functional parameters of EC were unchanged as a result of EV treatment, regardless of the source of EV (EV-PIC or EV-C). Unlike the effects of PIC treatment on EC, the EV-PIC treated cells have similar proliferation rates with EV-C treated and untreated cells, as determined by BrdU incorporation (Supplemental Figure VII). Also, the rate of wound closure is similar between EV-PIC and EV-C cells and shows a slight trend towards faster closer compared to untreated controls; however, the difference is not significant (Supplemental Figure VIII). Lastly, there was no noticeable change in cell morphology following 24-hr incubation with either EV-PIC or EV-C as cells maintained their typical endothelial cobblestone like appearance (Supplemental Figure IX). In conclusion, EV produced by cells under chronic cytokine treatment that undergo EndoMT in vitro have an unique angiostatic effect on naïve EC and reduce the ability of the cells to utilize fatty acid oxidation without affecting their proliferative or migratory capacity.
EndoMT induces release of EV-packaged proteins involved in angiogenesis, metabolism and inflammation
To identify potential candidate protein components of the EV cargo that may be responsible for the observed functional effects on recipient EC, we employed LC/MS/MS proteomics on EV-PIC and EV-C, isolated by ultracentrifugation and washed with alkaline sodium carbonate to remove passenger proteins associated to the EV surface. In total we detected 1,739 proteins at a false discovery rate of 1%, of which 1106 were common to both EV-PIC and EV-C, 469 were specific to EV-PIC and 164 were specific to EV-C (Figure 8A). We observed a large overlap between our data set (98.8% of the detected proteins) and the manually curated EV database Vesiclepedia (Figure 8A). The remaining 1.2% of the cargo (34 proteins) were not previously reported in Vesiclepedia or ExoCarta and 26 of these proteins were unique to the EV-PIC (Figure 8B). All of the previously unreported proteins were identified under high stringency criteria. Interestingly, analysis of the amino acid sequences of all identified proteins using the SignalP server27 revealed only 19% in the EV-C and 17% in EV-PIC had a predicted signal peptide (Figure 8C). This data implies that >80% of the proteins contained in the EV cargo are not known to be released in circulation via a canonical secretory pathway. When carrying out gene ontology (GO) enrichment analysis on proteins unique to either EV-C or EV-PIC, we noted a differential enrichment of proteins associated with various intracellular origins. Proteins unique to EV-C belonged to mitochondria and ER, as well as extracellular matrix (Figure 8F). In EV-PIC the top significantly over-expressed proteins were found to derive from the plasma membrane, Golgi and endosomal compartments (Figure 8F). The GO enrichment analysis also showed that most of the uniquely expressed proteins in EV-C belonged to the oxidation-reduction and oxidative phosphorylation processes, while the uniquely expressed proteins in EV-PIC belonged to biological processes involved in signal transduction, immune and inflammatory responses and angiogenesis (Figure 8E). Also, biological pathways significantly enriched in the uniquely expressed proteins in EV-C were related to metabolism, TCA cycle and electron transport chain while EV-PIC proteins belonged to pathways associated with integrins and cytokine signaling as well as VEGF/VEGFR signaling (Figure 8F). Since angiogenesis was prominently inhibited in EC that received EV-PIC, we looked at the top proteins expressed in the EV-PIC compared to EV-C. We found that thrombospondin-1 which has well documented anti-angiogenic effects was present both in EV-PIC and EV-C (Supplemental Table II). Strikingly, amongst the proteins uniquely found in EV-PIC there are several receptors of the VEGF family – VEGFR-1, VEGFR-2, Neuropilin-2, Tie-1 as well as Notch-2 (Supplemental Table II). We can speculate that the presence of these receptors in the EV may act as circulating decoy receptors that bind VEGF in the media and contribute therefore to the blunted angiogenic response in cells treated with EV-PIC. Collectively these results suggest that EC that undergo varied degrees of EndoMT release endothelial specific proteins and receptors as well as inflammatory and immune modulatory proteins that can induce metabolic and angiostatic effects in healthy endothelium in a paracrine or endocrine fashion.
Figure 8. Proteomic analysis of the EV-C and EV-PIC cargo.
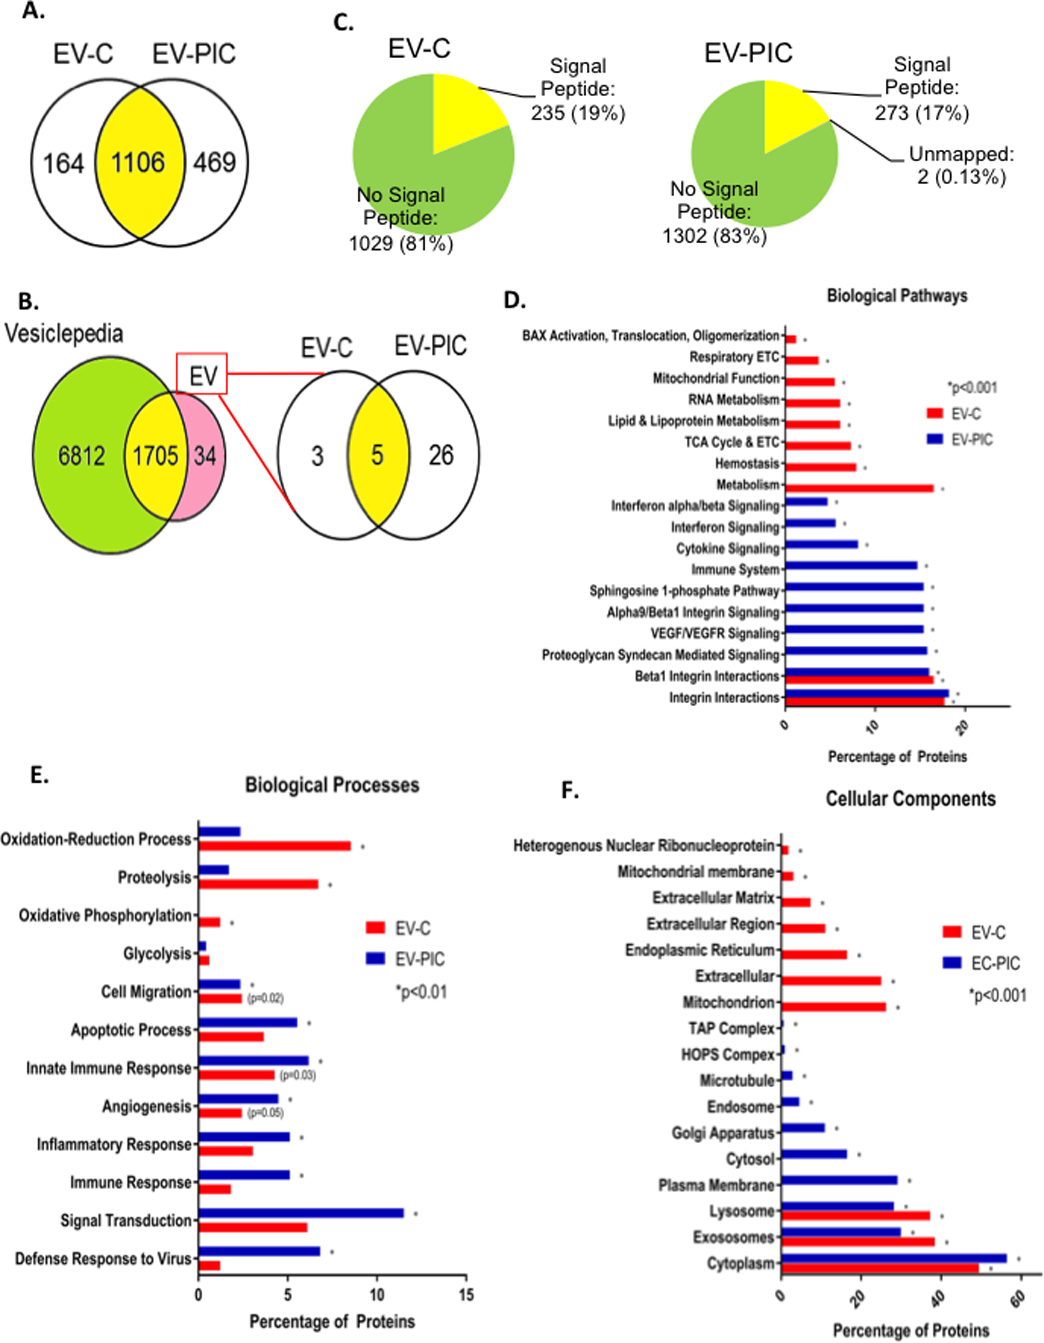
A: Venn diagram of the number of proteins uniquely identified in EV-C and EV-PIC, and the number of shared proteins between both groups. B: Venn diagram showing comparison of proteomic coverage in present data versus manually curated vesicle database Vesiclepedia. Of the 34 proteins previously unreported, 3 were identified only in EV-C and 26 only in EV-PIC. C: Amino acid sequences of all proteins identified were analyzed via the Signal P server to predict the presence or absence of a signal peptide sequence. D-F: Percentage of gene ontology terms significantly enriched in EV-C and EV-PIC by ontology source for biological pathways (D), biological processes (E) and cellular components (F).
Discussion
Endothelial to mesenchymal transition (EndoMT) is a progressive de-differentiation of EC to a mesenchymal, fibroblast-like phenotype31, 32. This process is highly heterogeneous and was shown to occur in vascular endothelium in inflammatory and aging-related pathologies such as atherosclerosis33, 34, pulmonary hypertension18, 35, renal and cardiac fibrosis36–38. It is now well accepted that EC lining the lumen of blood vessels are as varied in their phenotype and function as the tissues in which they reside39. The roles and phenotypes of EC from AT in humans remains poorly understood along with lack of evidence for occurrence of EndoMT in AT vasculature. In the present study, we found EndoMT within the vasculature of lean and obese human AT throughout the size continuum between capillaries and small arteries and veins with capillaries in the visceral obese AT showing the highest percentage of EndoMT of up to ~30%. The reported percentage of EndoMT using similar immunohistochemical approaches varies depending on tissue location and type of EC from ~80% of the luminal EC in transplant settings, to 5–15% in human atherosclerotic plaques33, 34, to 3–7% in neointimal vessels or in vessels from patients with pulmonary hypertension18, 40. EndoMT in such tissues is reportedly confined to arterial or arteriolar beds. While we also found increased EndoMT in obese visceral AT in small arteries and arterioles, the number of capillaries found positive for EndoMT was ~2-fold higher. This may be a specific feature of AT capillaries that are known to undergo extensive remodeling during weigh gain and weight loss and with acute variations in temperature or caloric intake41, 42. Therefore adipose tissue capillaries may have uniquely high rates of EndoMT compared to ones in other tissues due to increased intrinsic plasticity of EC. This in turn may impact on angiogenesis, adipogenesis and adipocyte metabolism rather than increasing local fibrosis as described for other vascular beds.38 Since some of the metabolic dysfunction and local inflammation can be reversed with weight loss it is tempting to speculate that the incidence of EndoMT in the visceral adipose tissue may decrease in humans following sustained weight loss.
We also found in this study a selective absence of vWF in ~47% of the arterioles only within the obese visceral fat. vWF expressional heterogeneity is a known feature in ECs from vessels of different sizes and tissue origins43–45. However, the absence of vWF selectively in the visceral AT depot in obesity and not in lean visceral AT or in obese subcutaneous AT cannot account for the potential physiologic heterogeneity. One caveat of the immunohistochemistry approach used for detection of EndoMT in tissue sections is the assumption that cells that have undergone EndoMT retain their endothelial markers. While in early stages of transition this is likely to be true, at later stages ECs may lose selective markers. The lack of vWF expression in arterioles of obese visceral fat may represent a more advanced stage of EndoMT or it may reflect increased constitutive or stimulated secretion of vWF known to occur in response to various agonists, including TNFα46. Selective loss of vWF as a feature of EndoMT was not reported in other vascular beds, to our knowledge. Whether this may be a specific response of ECs that undergo EndoMT in the arterioles of visceral adipose vasculature remains to be established.
Visceral fat in obesity is a highly fibrotic tissue richly infiltrated by immune and inflammatory cells. Pro-inflammatory cytokines such as TNFα, IFNγ, IL1β and TGFβ are increased in obesity in visceral AT and represent one of the culprits responsible for adipocyte hypertrophy, tissue fibrosis6 and insulin resistance47–49. These cytokines were shown to play a key role in endothelial de-differentiation in vitro in cultured EC from various vascular beds18, 29. We show that in vitro treatment of microvascular EC from adipose tissue with TNFα, IFNγ and TGFβ leads to progressive features of EndoMT, from early changes in the cell morphology to re-location of VE-cadherin and CD31 from plasma membrane to cytosol and an increase in cytoplasmic αSMA. Interestingly, we found a complete loss of vWF expression in cells treated with cytokines for 6 days, consistent with our findings in vasculature of human AT. We also found prominent nuclear expression of Twist-1 and increased expression of Snail 1, vimentin and N-cadherin after prolonged cytokine treatment consistent with activation of transcriptional programs that drive EndoMT33, 50. Also, shear stress is an important driver of EndoMT51, 52 and both Twist-1 and Snail-1 expression are increased in areas of low shear50, 51 Under conditions of low shear flow, such as in arteries or arterioles in AT, Twist-1 and Snail-1 activation may be an important driver of EndoMT. Future investigation of the dominant pathways responsible for EndoMT in AT EC, including but not limited to those described above, will be of prime importance for understanding the specifics of EndoMT in this vascular bed.
We also showed significant changes in EC function in vitro including reduced proliferation, increased permeability and increased cell migration. Interestingly, EC from human visceral fat were shown to display increased permeability5, which may be attributed to local cytokine exposure. The increase in cell permeability may be due to re-location of VE-cadherin from plasma membrane to the cytosol, which we showed to occur progressively after PIC treatment. Although we did not find a significant change in occludins (not shown) the loss of membrane cadherin and CD31 may be sufficient to explain reduced cell-cell contact resulting in increased permeability and EC migration7.
One of the most prominent functional changes was the dramatic impairment of angiogenesis in response to VEGF-A in EC treated with PICs. We found that prolonged cytokine exposure virtually abolishes tube formation in vitro. This effect may be due to VEGFR2, which was shown to be suppressed during EndoMT in solid tumors9, 53. Our finding that tubule formation is impaired and PIC increased monolayer permeability and migration led us to speculate that the latter may be due to a VEGF-A independent effect while reduced VEGFR2 expression or activity is likely responsible for the lack of angiogenic response54. Obesity was found to reduce angiogenic potential of human AT EC55, 56. Our finding that EndoMT is more frequently observed in AT vasculature of obese subjects corroborated with reduced angiogenesis of the adipose EC that underwent EndoMT in vitro suggests that EndoMT may be a significant contributor to impaired angiogenesis in human obesity. Reduced angiogenesis in AT microvasculature has important implications on local inflammation and fibrosis56. Although blocking vessel growth was first proposed to reduce adiposity in animal models of obesity57, this is currently a point of active debate. Targeting expansion of EC during early stages of diet-induced obesity aggravates insulin resistance in mice58 and predisposes towards fibrosis in response to high fat in zebrafish59. Future studies are needed to address the relationship between EndoMT and angiogenesis in AT in humans and their impact on local and systemic metabolic performance and inflammation.
Another important role of the EC in AT is the regulation of metabolic fluxes including glucose and fatty acids60. EC metabolism is crucial for both initiation of angiogenesis and for regulation of fatty acid fluxes towards adipocytes. We showed that in vitro PIC treatment significantly reduced ATP production and basal and maximal respiration. Proton efflux rate due to glycolysis was significantly reduced in EndoMT cells following cytokine exposure. Reduced glycolytic fluxes due to poor activation of PFKFB-3 have been shown to dramatically reduce angiogenic sprouting in tip cells61, 62. The metabolic shift towards lower glycolysis due to EndoMT may explain in part the blunted tubule formation observed in response to VEGF-A in vitro. An even more dramatic reduction in fatty acid oxidation by 5-fold was found in PIC treated EC compared to controls. A recent report showed that activation of the EndoMT program in human pulmonary microvascular EC, in response to TGFβ and IL-1β resulted in a marked reduction in ATP production as a result of reduced fatty acid oxidation, due to a rapid decline in mitochondrial fatty acid transport via CPT1a63. Consistent with this data, we found decreased expression of CPT1a and CPT2 in PIC-treated EC along with reduced expression of ACLY that suggest impairment in both beta-oxidation and lipogenesis. Indeed, reduced fatty acid oxidation was reported as a metabolic consequence of EndoMT63 and our data further substantiates the mesenchymal transition of AT EC in vitro. We also found a dramatic increase in miR-155–5p in PIC treated ECs. Two of the validated targets of miR-155 are CPT1a and ACLY64. Therefore miR-155 may be key for suppression of fatty acid oxidation and lipogenesis in EC undergoing EndoMT. Also, miR-155 was shown to indirectly increase activation of the mesenchymal transcription factors Twist-1, Snail-1 and Slug via c-Ski inhibition in response to TGFβ and to drive EndoMT in coronary artery EC in vitro65. Overall, the metabolic shift found as a result of EndoMT may have significant effects on adipocyte metabolism and AT inflammation due to poor vascular growth and altered metabolic fluxes of glucose and fatty acids.
In this paper, we also showed the effect of extracellular vesicles produced by EC that underwent in vitro EndoMT on function of naïve EC. The paracrine/endocrine effect of EVs have gained significant attention66. Circulating EVs cargo, represented by nucleic acids and proteins are responsible for their biological activities and reflects the cell of origin in its physiologic and/or pathological condition67, 68. We show for the first time the cargo composition of EVs produced by EC undergoing EndoMT (EV-PIC), EVs produced by naïve (unexposed to PIC) EC (EV-C) and compare their effects on recipient naïve EC. We found increased numbers of EV-PIC by ~3-fold compared to EV-C however we did not find a difference in EV uptake, which suggests that the cargo composition rather than the numbers may be responsible for the observed biological effects. A similar observation was recently reported for endothelial-derived EVs that impact on smooth muscle cell apoptosis in diabetes69. In our in vitro experiments we used 1010 EV (or ~4μg EV protein) generated from 5×10⁵ EC. Interestingly, in obese women, endothelial-derived EV in blood were reportedly increased (~3×10⁵/mL of blood) and correlated with endothelial dysfunction70. Although interventional studies in humans using EV are not currently published, several proof of concept experiments in rodent models show that tail vein injections of EV generated from human endothelial cells, adipose tissue or plasma that vary between 3×10⁶ - 1010 EV (or ~4μg EV protein) had measurable and significant effects on atherosclerotic plaque progression, neo-intima formation, neo-vascularization or systemic insulin resistance71–74. Based on such data we speculate that the numbers of EV used for our in vitro studies may have the potential to impact in paracrine or endocrine fashion on EC function in vivo. Future studies are required to substantiate such proposed effects.
We show that, as opposed to the direct effect of PIC on EC, EV-PIC did not change cellular proliferation or migration. Also, the metabolic changes following EV treatment were distinct from the ones following cytokine exposure. In EV-treated EC there was no change in proton producing rate due to glycolysis compared to naïve EC. However cells exposed to EV showed a significant reduction in the oxygen consumption rate due to palmitate oxidation. This is likely due to palmitate fluxes into the cells since CPT1a levels were not decreased in the EV-treated cells (not shown). Since this experiment was done in confluent cells, that did not actively proliferate, the result may suggest that such cells are rendered more vulnerable to the attack of free radicals due to their inability to effectively mount an antioxidant response via glutathione regeneration, as recently shown by Kalucka et al.75
The most prominent effect selectively induced by EV-PIC in naïve EC was a dramatic reduction in angiogenesis after only 24hr incubation. This effect was unique for cells that received EV-PIC, but not EV-C. This effect recapitulated the effects of 6 day treatment of EC with soluble PICs. The metabolic changes alone cannot explain the potent angiostatic effect of EV-PIC. Therefore we interrogated the proteomic cargo of the EVs. A recent paper showed the ability of exosomes produced by cells in the tumor microenvironment to transfer functional glycolytic enzymes to tumor cells76. We analyzed EVs cargo by an unbiased proteomics approach and found non-random associations with a wide array of biological processes that differ between EVs from EndoMT cells and controls. While such differences do not demonstrate causality, previous research does support the contention that EVs are capable to mediate meaningful biological changes in recipient cells76–79. We also found 305 more peptide signatures in EV-PIC compared to EV-C, suggesting that EndoMT cells not only produce more EVs but the protein load of such vesicles is higher compared with EV produced by control ECs. The EV-C are enriched in metabolic enzymes that support the aerobic ATP production while the EV-PIC vesicles have proportionally less of such enzymes. Interestingly, both types of EVs have a large number of angiogenesis-associated proteins. Many of these proteins are shared by both classes of EVs and contain integrins and anti-angiogenic factors such as thrombospondin-1. Thrombospondins are known potent endogenous inhibitors of angiogenesis80 via various mechanisms inducing EC migration, survival, proliferation and by antagonizing the action of VEGF via its interaction with VEGFR281. We found that EVs do not inhibit migration or proliferation of EC and therefore it is conceivable that they exert their anti-angiogenic effects via interfering with VEGFR2 signaling in recipient cells. We also found 24 proteins associated with angiogenesis that are unique to EV-PICs. Remarkably, these include VEGFR1, VEGFR2, Neuropilin-2 and Tie-1, amongst others. We also showed that cells that display EndoMT features release potent angiostatic vesicles that impact on angiogenesis in recipient naïve EC. It is possible that they behave like decoy receptors that either bind circulating VEGF-A or interact with VEGF receptors in recipient cells and reduce VEGFR2 signaling. Future studies are necessary to elucidate these tentative scenarios. We also found enrichment of EV-PIC in inflammatory and immune proteins that carry the signature of the EndoMT cells. All of these can potentially perpetuate inflammation in local or distal vascular beds when EC are exposed to and take up such EVs. A recent paper showed that circulating exosomes have functional, anti-contractile effects on vascular EC via delivery of arginase-125, supporting the notion that proteins contained in EV cargo released in systemic circulation can impact on function of EC in distant vascular beds.
In summary, we showed that EndoMT is present in human AT and that visceral obesity increases such occurrence in vivo. We also showed that AT ECs undergo EndoMT in vitro in response to pro-inflammatory cytokines and that some of the functional consequences that accompany progressive mesenchymal transition of EC include reduced barrier function, increased migration and reduced proliferative capacity. Notably, the ECs also lose their angiogenic response and undergo a metabolic shift towards a metabolically quiescent phenotype. Importantly, the anti-angiogenic response and the metabolic changes are perpetuated by EVs produced by cells undergoing EndoMT to affect naïve ECs. This study is the first to document EndoMT in human AT in obesity and to show that dissemination of the cellular proteome of cells undergoing EndoMT via EV may impact angiogenesis and metabolism of naïve EC. This new paradigm may explain some of the cardiovascular complications linked to obesity in humans.
Supplementary Material
Highlights.
EndoMT was found in human AT vasculature with higher frequency in capillaries of obese visceral AT
AT EC undergo EndoMT in vitro in response to cytokine treatment that mimics the molecular pattern found in vivo
EndoMT induces functional and metabolic changes of EC, prominently reducing angiogenesis
EC undergoing EndoMT secrete EVs that contain a distinct proteome enriched with inflammatory and immune peptide signatures
EVs secreted by cells undergoing EndoMT disseminate the metabolic and anti-angiogenic features of the parent cells into naïve recipient EC
Acknowledgements
We would like to thank Ms. Christina Risi and Dr. Vitold Galkin from Physiological Sciences Department at EVMS for their assistance with electron microscopy of extracellular vesicles.
We would like to thank Dr. Manami Hara for providing human lean visceral fat samples. We extend thanks to Ms. Becky Marquez for providing patient consent from bariatric subjects enrolled at Sentara Surgical Weight Loss Center. We want to acknowledge the Proteomics Core and Flow Cytometry Core at EVMS for their support with this project.
Sources of Funding
This project was funded by NIHR15H114062 to AD, AHA-AIREA grant to AD and a Commonwealth Health Research Board Award to AD.
Abbreviations
- AT
Adipose Tissue
- EndoMT
Endothelial-to-Mesenchymal Transition
- OM
Omental
- SC
Subcutaneous
- EC
Endothelial Cell(s)
- HAMVEC
Human Adipose Microvascular Endothelial Cell(s)
- FFPE
formalin-fixed paraffin-embedded
- IFN-γ
Interferon-gamma
- TNF-α
Tumor Necrosis Factor-alpha
- TGF-β
Tumor Growth Factor-beta
- VEGF
Vascular Endothelial Growth Factor
- VEGFR
Vascular Endothelial Growth Factor Receptor
- EV
Extracellular Vesicle(s)
- EV-C
Extracellular vesicles isolated from conditioned media of control endothelial cells
- EV-PIC
Extracellular vesicles isolated from conditioned media of pro-inflammatory cytokine-treated endothelial cells
- PIC
Pro-inflammatory Cytokines
- ACLY
ATP citrate lyase
- CPT
carnityl palmitoyl transferase
Footnotes
Disclosures
The authors have nothing to disclose.
References
- 1.Sam S and Mazzone T. Adipose tissue changes in obesity and the impact on metabolic function. Transl Res. 2014;164:284–292. [DOI] [PubMed] [Google Scholar]
- 2.Sam S, Haffner S, Davidson MH, D’Agostino RB Sr., Feinstein S, Kondos G, Perez A and Mazzone T. Relation of abdominal fat depots to systemic markers of inflammation in type 2 diabetes. Diabetes Care. 2009;32:932–937. [DOI] [PMC free article] [PubMed] [Google Scholar]
- 3.Sun K, Kusminski CM and Scherer PE. Adipose tissue remodeling and obesity. J Clin Invest. 2011;121:2094–2101. [DOI] [PMC free article] [PubMed] [Google Scholar]
- 4.Sung HK, Doh KO, Son JE, Park JG, Bae Y, Choi S, Nelson SM, Cowling R, Nagy K, Michael IP, Koh GY, Adamson SL, Pawson T and Nagy A. Adipose vascular endothelial growth factor regulates metabolic homeostasis through angiogenesis. Cell Metab. 2013;17:61–72. [DOI] [PubMed] [Google Scholar]
- 5.Villaret A, Galitzky J, Decaunes P, Esteve D, Marques MA, Sengenes C, Chiotasso P, Tchkonia T, Lafontan M, Kirkland JL and Bouloumie A. Adipose tissue endothelial cells from obese human subjects: differences among depots in angiogenic, metabolic, and inflammatory gene expression and cellular senescence. Diabetes. 2010;59:2755–2763. [DOI] [PMC free article] [PubMed] [Google Scholar]
- 6.Reggio S, Rouault C, Poitou C, Bichet JC, Prifti E, Bouillot JL, Rizkalla S, Lacasa D, Tordjman J and Clement K. Increased Basement Membrane Components in Adipose Tissue During Obesity: Links With TGFbeta and Metabolic Phenotypes. J Clin Endocrinol Metab. 2016;101:2578–2587. [DOI] [PubMed] [Google Scholar]
- 7.Medici D and Kalluri R. Endothelial-mesenchymal transition and its contribution to the emergence of stem cell phenotype. Seminars in cancer biology. 2012;22:379–384. [DOI] [PMC free article] [PubMed] [Google Scholar]
- 8.Medici D, Shore EM, Lounev VY, Kaplan FS, Kalluri R and Olsen BR. Conversion of vascular endothelial cells into multipotent stem-like cells. Nat Med. 2010;16:1400–1406. [DOI] [PMC free article] [PubMed] [Google Scholar]
- 9.Xiao L, Kim DJ, Davis CL, McCann JV, Dunleavey JM, Vanderlinden AK, Xu N, Pattenden SG, Frye SV, Xu X, Onaitis M, Monaghan-Benson E, Burridge K and Dudley AC. Tumor Endothelial Cells with Distinct Patterns of TGFbeta-Driven Endothelial-to-Mesenchymal Transition. Cancer Res. 2015;75:1244–1254. [DOI] [PMC free article] [PubMed] [Google Scholar]
- 10.Lamouille S, Subramanyam D, Blelloch R and Derynck R. Regulation of epithelial-mesenchymal and mesenchymal-epithelial transitions by microRNAs. Curr Opin Cell Biol. 2013;25:200–207. [DOI] [PMC free article] [PubMed] [Google Scholar]
- 11.Lumeng CN, Deyoung SM, Bodzin JL and Saltiel AR. Increased inflammatory properties of adipose tissue macrophages recruited during diet-induced obesity. Diabetes. 2007;56:16–23. [DOI] [PubMed] [Google Scholar]
- 12.Mathis D Immunological goings-on in visceral adipose tissue. Cell Metab. 2013;17:851–859. [DOI] [PMC free article] [PubMed] [Google Scholar]
- 13.Jimenez SA. Role of endothelial to mesenchymal transition in the pathogenesis of the vascular alterations in systemic sclerosis. ISRN rheumatology. 2013;2013:835–948. [DOI] [PMC free article] [PubMed] [Google Scholar]
- 14.Wermuth PJ and Jimenez SA. The significance of macrophage polarization subtypes for animal models of tissue fibrosis and human fibrotic diseases. Clinical and translational medicine. 2015;4:2. [DOI] [PMC free article] [PubMed] [Google Scholar]
- 15.Rieder F, Kessler SP, West GA, Bhilocha S, de la Motte C, Sadler TM, Gopalan B, Stylianou E and Fiocchi C. Inflammation-induced endothelial-to-mesenchymal transition: a novel mechanism of intestinal fibrosis. Am J Pathol. 2011;179:2660–2673. [DOI] [PMC free article] [PubMed] [Google Scholar]
- 16.Kovacic JC, Mercader N, Torres M, Boehm M and Fuster V. Epithelial-to-mesenchymal and endothelial-to-mesenchymal transition: from cardiovascular development to disease. Circulation. 2012;125:1795–1808. [DOI] [PMC free article] [PubMed] [Google Scholar]
- 17.Kanasaki K, Shi S, Kanasaki M, He J, Nagai T, Nakamura Y, Ishigaki Y, Kitada M, Srivastava SP and Koya D. Linagliptin-mediated DPP-4 inhibition ameliorates kidney fibrosis in streptozotocin-induced diabetic mice by inhibiting endothelial-to-mesenchymal transition in a therapeutic regimen. Diabetes. 2014;63:2120–2131. [DOI] [PubMed] [Google Scholar]
- 18.Good RB, Gilbane AJ, Trinder SL, Denton CP, Coghlan G, Abraham DJ and Holmes AM. Endothelial to Mesenchymal Transition Contributes to Endothelial Dysfunction in Pulmonary Arterial Hypertension. Am J Pathol. 2015;185:1850–1858. [DOI] [PubMed] [Google Scholar]
- 19.Imaizumi T, Itaya H, Nasu S, Yoshida H, Matsubara Y, Fujimoto K, Matsumiya T, Kimura H and Satoh K. Expression of vascular endothelial growth factor in human umbilical vein endothelial cells stimulated with interleukin-1alpha--an autocrine regulation of angiogenesis and inflammatory reactions. Thromb Haemost. 2000;83:949–955. [PubMed] [Google Scholar]
- 20.Hood JL, Pan H, Lanza GM, Wickline SA, Consortium for Translational Research in Advanced I and Nanomedicine. Paracrine induction of endothelium by tumor exosomes. Laboratory investigation; a journal of technical methods and pathology. 2009;89:1317–1328. [DOI] [PMC free article] [PubMed] [Google Scholar]
- 21.de Jong OG, Verhaar MC, Chen Y, Vader P, Gremmels H, Posthuma G, Schiffelers RM, Gucek M and van Balkom BW. Cellular stress conditions are reflected in the protein and RNA content of endothelial cell-derived exosomes. Journal of extracellular vesicles. 2012;1. [DOI] [PMC free article] [PubMed] [Google Scholar]
- 22.Boulanger CM, Loyer X, Rautou PE and Amabile N. Extracellular vesicles in coronary artery disease. Nature reviews Cardiology. 2017;14:259–272. [DOI] [PubMed] [Google Scholar]
- 23.Nguyen MA, Karunakaran D, Geoffrion M, Cheng HS, Tandoc K, Perisic Matic L, Hedin U, Maegdefessel L, Fish JE and Rayner KJ. Extracellular Vesicles Secreted by Atherogenic Macrophages Transfer MicroRNA to Inhibit Cell Migration. Arterioscler Thromb Vasc Biol. 2018;38:49–63. [DOI] [PMC free article] [PubMed] [Google Scholar]
- 24.Wang Q and Lu Q. Plasma membrane-derived extracellular microvesicles mediate non-canonical intercellular NOTCH signaling. Nature communications. 2017;8:709. [DOI] [PMC free article] [PubMed] [Google Scholar]
- 25.Zhang H, Liu J, Qu D, Wang L, Wong CM, Lau CW, Huang Y, Wang YF, Huang H, Xia Y, Xiang L, Cai Z, Liu P, Wei Y, Yao X, Ma RCW and Huang Y. Serum exosomes mediate delivery of arginase 1 as a novel mechanism for endothelial dysfunction in diabetes. Proc Natl Acad Sci U S A. 2018; 115:E6927–E6936. [DOI] [PMC free article] [PubMed] [Google Scholar]
- 26.Kaspric N, Picard B, Reichstadt M, Tournayre J and Bonnet M. ProteINSIDE to Easily Investigate Proteomics Data from Ruminants: Application to Mine Proteome of Adipose and Muscle Tissues in Bovine Foetuses. PLoS One. 2015;10:e0128086. [DOI] [PMC free article] [PubMed] [Google Scholar]
- 27.Petersen TN, Brunak S, von Heijne G and Nielsen H. SignalP 4.0: discriminating signal peptides from transmembrane regions. Nature methods. 2011;8:785–786. [DOI] [PubMed] [Google Scholar]
- 28.Lumeng CN, Bodzin JL and Saltiel AR. Obesity induces a phenotypic switch in adipose tissue macrophage polarization. J Clin Invest. 2007;117:175–184. [DOI] [PMC free article] [PubMed] [Google Scholar]
- 29.Pinto MT, Covas DT, Kashima S and Rodrigues CO. Endothelial Mesenchymal Transition: Comparative Analysis of Different Induction Methods. Biol Proced Online. 2016;18:10. [DOI] [PMC free article] [PubMed] [Google Scholar]
- 30.Curtis AM, Edelberg J, Jonas R, Rogers WT, Moore JS, Syed W and Mohler ER 3rd. Endothelial microparticles: sophisticated vesicles modulating vascular function. Vascular medicine. 2013;18:204–214. [DOI] [PMC free article] [PubMed] [Google Scholar]
- 31.Dejana E, Hirschi KK and Simons M. The molecular basis of endothelial cell plasticity. Nature communications. 2017;8:14361. [DOI] [PMC free article] [PubMed] [Google Scholar]
- 32.Sanchez-Duffhues G, Garcia de Vinuesa A and Ten Dijke P. Endothelial-to-mesenchymal transition in cardiovascular diseases: Developmental signaling pathways gone awry. Dev Dyn. 2018;247:492–508. [DOI] [PubMed] [Google Scholar]
- 33.Chen PY, Qin L, Baeyens N, Li G, Afolabi T, Budatha M, Tellides G, Schwartz MA and Simons M. Endothelial-to-mesenchymal transition drives atherosclerosis progression. J Clin Invest. 2015;125:4514–4528. [DOI] [PMC free article] [PubMed] [Google Scholar]
- 34.Evrard SM, Lecce L, Michelis KC, Nomura-Kitabayashi A, Pandey G, Purushothaman KR, d’Escamard V, Li JR, Hadri L, Fujitani K, Moreno PR, Benard L, Rimmele P, Cohain A, Mecham B, Randolph GJ, Nabel EG, Hajjar R, Fuster V, Boehm M and Kovacic JC. Endothelial to mesenchymal transition is common in atherosclerotic lesions and is associated with plaque instability. Nature communications. 2016;7:11853. [DOI] [PMC free article] [PubMed] [Google Scholar]
- 35.Ranchoux B, Antigny F, Rucker-Martin C, Hautefort A, Pechoux C, Bogaard HJ, Dorfmuller P, Remy S, Lecerf F, Plante S, Chat S, Fadel E, Houssaini A, Anegon I, Adnot S, Simonneau G, Humbert M, Cohen-Kaminsky S and Perros F. Endothelial-to-mesenchymal transition in pulmonary hypertension. Circulation. 2015;131:1006–1018. [DOI] [PubMed] [Google Scholar]
- 36.Zeisberg EM, Tarnavski O, Zeisberg M, Dorfman AL, McMullen JR, Gustafsson E, Chandraker A, Yuan X, Pu WT, Roberts AB, Neilson EG, Sayegh MH, Izumo S and Kalluri R. Endothelial-to-mesenchymal transition contributes to cardiac fibrosis. Nat Med. 2007;13:952–961. [DOI] [PubMed] [Google Scholar]
- 37.He J, Xu Y, Koya D and Kanasaki K. Role of the endothelial-to-mesenchymal transition in renal fibrosis of chronic kidney disease. Clin Exp Nephrol. 2013;17:488–497. [DOI] [PubMed] [Google Scholar]
- 38.Piera-Velazquez S, Li Z and Jimenez SA. Role of endothelial-mesenchymal transition (EndoMT) in the pathogenesis of fibrotic disorders. Am J Pathol. 2011;179:1074–1080. [DOI] [PMC free article] [PubMed] [Google Scholar]
- 39.Potente M and Makinen T. Vascular heterogeneity and specialization in development and disease. Nat Rev Mol Cell Biol. 2017;18:477–494. [DOI] [PubMed] [Google Scholar]
- 40.Chen PY, Qin L, Barnes C, Charisse K, Yi T, Zhang X, Ali R, Medina PP, Yu J, Slack FJ, Anderson DG, Kotelianski V, Wang F, Tellides G and Simons M. FGF regulates TGF-beta signaling and endothelial-to-mesenchymal transition via control of let-7 miRNA expression. Cell Rep. 2012;2:1684–1696. [DOI] [PMC free article] [PubMed] [Google Scholar]
- 41.Cao Y, Wang H, Wang Q, Han X and Zeng W. Three-dimensional volume fluorescence-imaging of vascular plasticity in adipose tissues. Mol Metab. 2018;14:71–81. [DOI] [PMC free article] [PubMed] [Google Scholar]
- 42.Augustin HG and Koh GY. Organotypic vasculature: From descriptive heterogeneity to functional pathophysiology. Science. 2017;357. [DOI] [PubMed] [Google Scholar]
- 43.Muller AM, Skrzynski C, Skipka G and Muller KM. Expression of von Willebrand factor by human pulmonary endothelial cells in vivo. Respiration. 2002;69:526–533. [DOI] [PubMed] [Google Scholar]
- 44.Kawanami O, Jin E, Ghazizadeh M, Fujiwara M, Jiang L, Nagashima M, Shimizu H, Takemura T, Ohaki Y, Arai S, Gomibuchi M, Takeda K, Yu ZX and Ferrans VJ. Heterogeneous distribution of thrombomodulin and von Willebrand factor in endothelial cells in the human pulmonary microvessels. J Nippon Med Sch. 2000;67:118–125. [DOI] [PubMed] [Google Scholar]
- 45.Pusztaszeri MP, Seelentag W and Bosman FT. Immunohistochemical expression of endothelial markers CD31, CD34, von Willebrand factor, and Fli-1 in normal human tissues. J Histochem Cytochem. 2006;54:385–395. [DOI] [PubMed] [Google Scholar]
- 46.Tsai HM, Nagel RL, Hatcher VB, Seaton AC and Sussman, II. The high molecular weight form of endothelial cell von Willebrand factor is released by the regulated pathway. Br J Haematol. 1991;79:239–245. [DOI] [PubMed] [Google Scholar]
- 47.Reilly SM and Saltiel AR. Adapting to obesity with adipose tissue inflammation. Nat Rev Endocrinol. 2017;13:633–643. [DOI] [PubMed] [Google Scholar]
- 48.Caer C, Rouault C, Le Roy T, Poitou C, Aron-Wisnewsky J, Torcivia A, Bichet JC, Clement K, Guerre-Millo M and Andre S. Immune cell-derived cytokines contribute to obesity-related inflammation, fibrogenesis and metabolic deregulation in human adipose tissue. Sci Rep. 2017;7:3000. [DOI] [PMC free article] [PubMed] [Google Scholar]
- 49.Engin A The Pathogenesis of Obesity-Associated Adipose Tissue Inflammation. Adv Exp Med Biol. 2017;960:221–245. [DOI] [PubMed] [Google Scholar]
- 50.Mahmoud MM, Kim HR, Xing R, Hsiao S, Mammoto A, Chen J, Serbanovic-Canic J, Feng S, Bowden NP, Maguire R, Ariaans M, Francis SE, Weinberg PD, van der Heiden K, Jones EA, Chico TJ, Ridger V and Evans PC. TWIST1 Integrates Endothelial Responses to Flow in Vascular Dysfunction and Atherosclerosis. Circ Res. 2016;119:450–462. [DOI] [PMC free article] [PubMed] [Google Scholar]
- 51.Mahmoud MM, Serbanovic-Canic J, Feng S, Souilhol C, Xing R, Hsiao S, Mammoto A, Chen J, Ariaans M, Francis SE, Van der Heiden K, Ridger V and Evans PC. Shear stress induces endothelial-to-mesenchymal transition via the transcription factor Snail. Scientific reports. 2017;7:3375. [DOI] [PMC free article] [PubMed] [Google Scholar]
- 52.Ten Dijke P, Egorova AD, Goumans MJ, Poelmann RE and Hierck BP. TGF-beta signaling in endothelial-to-mesenchymal transition: the role of shear stress and primary cilia. Sci Signal. 2012;5:pt2. [DOI] [PubMed] [Google Scholar]
- 53.Xiao L and Dudley AC. Fine-tuning vascular fate during endothelial-mesenchymal transition. The Journal of pathology. 2017;241:25–35. [DOI] [PMC free article] [PubMed] [Google Scholar]
- 54.Blanco R and Gerhardt H. VEGF and Notch in tip and stalk cell selection. Cold Spring Harb Perspect Med. 2013;3:a006569. [DOI] [PMC free article] [PubMed] [Google Scholar]
- 55.Gealekman O, Guseva N, Hartigan C, Apotheker S, Gorgoglione M, Gurav K, Tran KV, Straubhaar J, Nicoloro S, Czech MP, Thompson M, Perugini RA and Corvera S. Depot-specific differences and insufficient subcutaneous adipose tissue angiogenesis in human obesity. Circulation. 2011;123:186–194. [DOI] [PMC free article] [PubMed] [Google Scholar]
- 56.Corvera S and Gealekman O. Adipose tissue angiogenesis: impact on obesity and type-2 diabetes. Biochim Biophys Acta. 2014;1842:463–472. [DOI] [PMC free article] [PubMed] [Google Scholar]
- 57.Cao Y Adipose tissue angiogenesis as a therapeutic target for obesity and metabolic diseases. Nature reviews Drug discovery. 2010;9:107–115. [DOI] [PubMed] [Google Scholar]
- 58.Sun K, Wernstedt Asterholm I, Kusminski CM, Bueno AC, Wang ZV, Pollard JW, Brekken RA and Scherer PE. Dichotomous effects of VEGF-A on adipose tissue dysfunction. Proc Natl Acad Sci U S A. 2012;109:5874–5879. [DOI] [PMC free article] [PubMed] [Google Scholar]
- 59.Minchin JE, Dahlman I, Harvey CJ, Mejhert N, Singh MK, Epstein JA, Arner P, Torres-Vazquez J and Rawls JF. Plexin D1 determines body fat distribution by regulating the type V collagen microenvironment in visceral adipose tissue. Proc Natl Acad Sci U S A. 2015;112:4363–4368. [DOI] [PMC free article] [PubMed] [Google Scholar]
- 60.Mehrotra D, Wu J, Papangeli I and Chun HJ. Endothelium as a gatekeeper of fatty acid transport. Trends Endocrinol Metab. 2014;25:99–106. [DOI] [PMC free article] [PubMed] [Google Scholar]
- 61.De Bock K, Georgiadou M, Schoors S, Kuchnio A, Wong BW, Cantelmo AR, Quaegebeur A, Ghesquiere B, Cauwenberghs S, Eelen G, Phng LK, Betz I, Tembuyser B, Brepoels K, Welti J, Geudens I, Segura I, Cruys B, Bifari F, Decimo I, Blanco R, Wyns S, Vangindertael J, Rocha S, Collins RT, Munck S, Daelemans D, Imamura H, Devlieger R, Rider M, Van Veldhoven PP, Schuit F, Bartrons R, Hofkens J, Fraisl P, Telang S, Deberardinis RJ, Schoonjans L, Vinckier S, Chesney J, Gerhardt H, Dewerchin M and Carmeliet P. Role of PFKFB3-driven glycolysis in vessel sprouting. Cell. 2013;154:651–663. [DOI] [PubMed] [Google Scholar]
- 62.Schoors S, De Bock K, Cantelmo AR, Georgiadou M, Ghesquiere B, Cauwenberghs S, Kuchnio A, Wong BW, Quaegebeur A, Goveia J, Bifari F, Wang X, Blanco R, Tembuyser B, Cornelissen I, Bouche A, Vinckier S, Diaz-Moralli S, Gerhardt H, Telang S, Cascante M, Chesney J, Dewerchin M and Carmeliet P. Partial and transient reduction of glycolysis by PFKFB3 blockade reduces pathological angiogenesis. Cell Metab. 2014;19:37–48. [DOI] [PubMed] [Google Scholar]
- 63.Xiong J, Kawagishi H, Yan Y, Liu J, Wells QS, Edmunds LR, Fergusson MM, Yu ZX, Rovira II, Brittain EL, Wolfgang MJ, Jurczak MJ, Fessel JP and Finkel T. A Metabolic Basis for Endothelial-to-Mesenchymal Transition. Mol Cell. 2018;69:689–698 e7. [DOI] [PMC free article] [PubMed] [Google Scholar]
- 64.Selbach M, Schwanhausser B, Thierfelder N, Fang Z, Khanin R and Rajewsky N. Widespread changes in protein synthesis induced by microRNAs. Nature. 2008;455:58–63. [DOI] [PubMed] [Google Scholar]
- 65.Wang J, He W, Xu X, Guo L, Zhang Y, Han S and Shen D. The mechanism of TGF-beta/miR-155/c-Ski regulates endothelial-mesenchymal transition in human coronary artery endothelial cells. Biosci Rep. 2017;37. [DOI] [PMC free article] [PubMed] [Google Scholar]
- 66.Ratajczak MZ and Ratajczak J. Horizontal transfer of RNA and proteins between cells by extracellular microvesicles: 14 years later. Clinical and translational medicine. 2016;5:7. [DOI] [PMC free article] [PubMed] [Google Scholar]
- 67.Mause SF and Weber C. Microparticles: protagonists of a novel communication network for intercellular information exchange. Circ Res. 2010;107:1047–1057. [DOI] [PubMed] [Google Scholar]
- 68.Yuana Y, Sturk A and Nieuwland R. Extracellular vesicles in physiological and pathological conditions. Blood Rev. 2013;27:31–39. [DOI] [PubMed] [Google Scholar]
- 69.Togliatto G, Dentelli P, Rosso A, Lombardo G, Gili M, Gallo S, Gai C, Solini A, Camussi G and Brizzi MF. PDGF-BB Carried by Endothelial Cell-Derived Extracellular Vesicles Reduces Vascular Smooth Muscle Cell Apoptosis in Diabetes. Diabetes. 2018;67:704–716. [DOI] [PubMed] [Google Scholar]
- 70.Esposito K, Ciotola M, Schisano B, Gualdiero R, Sardelli L, Misso L, Giannetti G and Giugliano D. Endothelial microparticles correlate with endothelial dysfunction in obese women. J Clin Endocrinol Metab. 2006;91:3676–3679. [DOI] [PubMed] [Google Scholar]
- 71.Jansen F, Yang X, Franklin BS, Hoelscher M, Schmitz T, Bedorf J, Nickenig G and Werner N. High glucose condition increases NADPH oxidase activity in endothelial microparticles that promote vascular inflammation. Cardiovasc Res. 2013;98:94–106. [DOI] [PubMed] [Google Scholar]
- 72.Jansen F, Stumpf T, Proebsting S, Franklin BS, Wenzel D, Pfeifer P, Flender A, Schmitz T, Yang X, Fleischmann BK, Nickenig G and Werner N. Intercellular transfer of miR-126–3p by endothelial microparticles reduces vascular smooth muscle cell proliferation and limits neointima formation by inhibiting LRP6. J Mol Cell Cardiol. 2017;104:43–52. [DOI] [PubMed] [Google Scholar]
- 73.Leroyer AS, Rautou PE, Silvestre JS, Castier Y, Leseche G, Devue C, Duriez M, Brandes RP, Lutgens E, Tedgui A and Boulanger CM. CD40 ligand+ microparticles from human atherosclerotic plaques stimulate endothelial proliferation and angiogenesis a potential mechanism for intraplaque neovascularization. Journal of the American College of Cardiology. 2008;52:1302–1311. [DOI] [PubMed] [Google Scholar]
- 74.Jansen F, Li Q, Pfeifer A and Werner N. Endothelial- and Immune Cell-Derived Extracellular Vesicles in the Regulation of Cardiovascular Health and Disease. JACC Basic Transl Sci. 2017;2:790–807. [DOI] [PMC free article] [PubMed] [Google Scholar]
- 75.Kalucka J, Bierhansl L, Conchinha NV, Missiaen R, Elia I, Bruning U, Scheinok S, Treps L, Cantelmo AR, Dubois C, de Zeeuw P, Goveia J, Zecchin A, Taverna F, Morales-Rodriguez F, Brajic A, Conradi LC, Schoors S, Harjes U, Vriens K, Pilz GA, Chen R, Cubbon R, Thienpont B, Cruys B, Wong BW, Ghesquiere B, Dewerchin M, De Bock K, Sagaert X, Jessberger S, Jones EAV, Gallez B, Lambrechts D, Mazzone M, Eelen G, Li X, Fendt SM and Carmeliet P. Quiescent Endothelial Cells Upregulate Fatty Acid beta-Oxidation for Vasculoprotection via Redox Homeostasis. Cell Metab. 2018;28:881–894 e13. [DOI] [PubMed] [Google Scholar]
- 76.Zhao H, Yang L, Baddour J, Achreja A, Bernard V, Moss T, Marini JC, Tudawe T, Seviour EG, San Lucas FA, Alvarez H, Gupta S, Maiti SN, Cooper L, Peehl D, Ram PT, Maitra A and Nagrath D. Tumor microenvironment derived exosomes pleiotropically modulate cancer cell metabolism. Elife. 2016;5:e10250. [DOI] [PMC free article] [PubMed] [Google Scholar]
- 77.Thomou T, Mori MA, Dreyfuss JM, Konishi M, Sakaguchi M, Wolfrum C, Rao TN, Winnay JN, Garcia-Martin R, Grinspoon SK, Gorden P and Kahn CR. Adipose-derived circulating miRNAs regulate gene expression in other tissues. Nature. 2017;542:450–455. [DOI] [PMC free article] [PubMed] [Google Scholar]
- 78.Ying W, Riopel M, Bandyopadhyay G, Dong Y, Birmingham A, Seo JB, Ofrecio JM, Wollam J, Hernandez-Carretero A, Fu W, Li P and Olefsky JM. Adipose Tissue Macrophage-Derived Exosomal miRNAs Can Modulate In Vivo and In Vitro Insulin Sensitivity. Cell. 2017;171:372–384 e12 [DOI] [PubMed] [Google Scholar]
- 79.Whitham M, Parker BL, Friedrichsen M, Hingst JR, Hjorth M, Hughes WE, Egan CL, Cron L, Watt KI, Kuchel RP, Jayasooriah N, Estevez E, Petzold T, Suter CM, Gregorevic P, Kiens B, Richter EA, James DE, Wojtaszewski JFP and Febbraio MA. Extracellular Vesicles Provide a Means for Tissue Crosstalk during Exercise. Cell Metab. 2018;27:237–251 e4. [DOI] [PubMed] [Google Scholar]
- 80.Lawler PR and Lawler J. Molecular basis for the regulation of angiogenesis by thrombospondin-1 and −2. Cold Spring Harb Perspect Med. 2012;2:a006627. [DOI] [PMC free article] [PubMed] [Google Scholar]
- 81.Zhang X, Kazerounian S, Duquette M, Perruzzi C, Nagy JA, Dvorak HF, Parangi S and Lawler J. Thrombospondin-1 modulates vascular endothelial growth factor activity at the receptor level. FASEB J. 2009;23:3368–3376. [DOI] [PMC free article] [PubMed] [Google Scholar]
Associated Data
This section collects any data citations, data availability statements, or supplementary materials included in this article.