Abstract
The extensive prenatal developmental growth period of the cerebellum renders it vulnerable to unhealthy environmental agents, especially alcohol. Fetal alcohol spectrum disorders (FASD) is marked by neurodysmorphology including cerebral and cerebellar volume deficits, but the cerebellar lobular deficit profile has not been delineated. Legacy MRI data of 115 affected and 59 unaffected adolescents and young adults were analyzed for lobular gray matter volume and revealed graded deficits supporting a spectrum of severity. Graded deficits were salient in intracranial volume (ICV), where the fetal alcohol syndrome (FAS) group was smaller than the fetal alcohol effects (FAE) group, which was smaller than the controls. Adjusting for ICV, volume deficits were present in VIIB and VIIIA of the FAE group and were more widespread in FAS and included lobules I, II, IV, V, VI, Crus II, VIIB, and VIIIA. Graded deficits (FAS < FAE) were consistently present in lobules VI; neither group showed volume deficits in Crus I or IX. Neuroradiological readings blind to diagnosis identified 20 anomalies, 8 involving the cerebellum, 5 of which were in the FAS group. We speculate that the regional cerebellar FASD-related volume deficits may contribute to diagnostically characteristic functional impairment involving emotional control, visuomotor coordination, and postural stability.
Keywords: alcohol, cerebellum, FASD, gray matter, MRI
Introduction
The cerebellum has an extensive developmental growth period, which spans the early embryonic stages with growth spurts in the second and third trimester of fetal development (Sillitoe and Joyner 2007; Dudek et al. 2018; Lerman-Sagie et al. 2018; Haldipur et al. 2019). Postpartum, the cerebellum continues growth through neurogenesis and fiber tract extension, measured in vivo with MRI (Archibald et al. 2001; Tiemeier et al. 2010; Wierenga et al. 2014; Mankiw et al. 2017; Sullivan et al. 2019a), contributing to far-reaching cerebello-cerebral neurocircuitry (Kelly and Strick 2003). Presumably, at each developmental juncture, the ensuing cerebellum faces risk of genetic miscoding and unhealthy environmental agents. Among environmental hazards to prenatal development is prenatal alcohol exposure, the cause of fetal alcohol spectrum disorders (FASD) (Hoyme et al. 2005, 2016) and the most prevalent preventable cause of intellectual disability (for reviews, McGee and Riley 2006; Wozniak et al. 2019). Of brain structures affected in FASD, the cerebellum ranks second after the corpus callosum as the most frequently afflicted regions (Roebuck et al. 1998; Bookstein et al. 2002a; Boronat et al. 2017; Nguyen et al. 2017). Although the cerebellum had traditionally been relegated to noncognitive, sensory, and motor functions, its contribution to higher-order cognitive and affective functions is now widely accepted (E et al. 2014; Schmahmann 2019). Further, structural (Stoodley et al. 2016) and functional imaging (Krienen and Buckner 2009; Stoodley et al. 2012; Guell et al. 2018) studies have identified differential relations between selective functions and lobules also observed in FASD youth, for example, between Crus I/II activation and a spatial working memory task (Gautam et al. 2015). A seminal study of eyeblink conditioning found that children with FAS were unable to learn the conditioned response despite successful performance by a comparison group in which three of four children with microcephaly were able to be conditioned (Jacobson et al. 2008). Thus, disruption of cerebellar integrity may contribute to cognitive, motor, and affective sequelae of FASD (du Plessis et al. 2015; Cheng et al. 2017).
The cerebellum is a complex structure, comprising a bihemispheric cortex featuring 10 laterally oriented lobules and a midline vermis. Although clearly visible on MR images, the dense foliation of the gray matter presents a challenge for distinguishing gray matter and white matter tissue and for quantification of the individual lobules. Consequently, a common approach to account for potential regional differences in structure and function in the face of image resolution challenges has been to aggregate the lobules into three regions: anterior superior comprising lobules I–V; posterior comprising lobules VI, VIIB, Crus I, and Crus II; and inferior comprising lobules VIIA/B, IX, and X. This parcellation approach has yielded consistent findings, where the anterior region (Sowell et al. 1996; O'Hare et al. 2005; Cardenas et al. 2014) showed the greatest volume deficits in FASD compared with controls, leaving the posterior and possibly the inferior regions relatively spared. The anterior region also subtends the lobules and vermis most often affected in adolescent heavy alcohol consumption (Sullivan et al. 2019a) and adult alcohol use disorder (Sullivan et al. 2000, 2019b; Sawyer et al. 2016). In FASD studies, cerebellar volume deficits occurred even in cases of prenatal alcohol exposure without facial dysmorphology, albeit exhibiting more modest deficits than observed in full-blown fetal alcohol syndrome (FAS) (Sowell et al. 1996) (for review, Nguyen et al. 2017).
Seminal studies of FASD brain dysmorphology emanated from the efforts of the University of Washington Fetal Alcohol and Drug Unit directed by Dr. Ann Streissguth and analyzed by Dr. Fred Bookstein. Several of those quantitative MRI studies were based on three age- and sex-matched groups of unaffected controls, FAS, and fetal alcohol effects (FAE) (affected individuals without full-blown FAS signs—although this terminology is no longer used, this was the accepted nomenclature at the time these subjects were scanned), ages 13–37 years (e.g., Bookstein et al. 2002a). Observations included diagnostically graded shape or volume anomalies of the corpus callosum (Bookstein et al. 2002a, 2002b) and a nongraded diagnostic (FAE + FAS=FASD) difference in morphology of the cerebellum, which resulted in a 75% accurate classification and correlated strongly with cerebellar size (Bookstein et al. 2006). The cerebellar shape measurements used a set of landmarks derived from midsagittal images of the vermis that were projected to create a 3D rendering of triangulated surface points. The shape profiles of the cerebellar hemispheres were similarly measured. As concluded, the rate of cerebellar dysmorphology in this sample comported well with cerebellar and vermian dysplasia identified postmortem (Clarren et al. 1978).
Recently, this MRI dataset collected at the University of Washington was made available to us for reanalysis with currently available, automated quantification methods for more refined quantification of selective brain structures based on T1-weighted images. An initial paper from this second analysis wave used the FreeSurfer pipeline and atlas to quantify volumes of subcortical structures and the total cerebellum (Inkelis et al. 2020). Analysis identified volume deficits in the FASD group in corpus callosum, basal ganglia, and total cerebellum even following correction for differences in intracranial volume (ICV). Yet to be measured, however, were the individual cerebellar lobules, which differ in prenatal (Sillitoe and Joyner 2007; Haldipur et al. 2019) and postnatal (Mankiw et al. 2017; Sullivan et al. 2019a) developmental allometry and function (Moore et al. 2017). Thus, the current effort used the University of Washington MRI data to segment the tissue constituents and parcellate the lobules of the cerebellum to question whether the FAE and FAS exhibited different patterns and extents of volume deficits of these cerebellar subregions.
Accordingly, we tested the following hypotheses: volume deficits would follow a stepwise pattern, where both the FAS and FAE groups would have deficits relative to controls; the FAS group would have deficits in more regions than the FAE group; the FAS volume deficits would be greater than those in the FAE group; and the pattern of deficits in the combined FAE + FAS groups would be greater in earlier (anterior superior) than later (posterior) developing lobules. To assure replicability (cf., Sullivan et al. 2019b), we used two different cerebellar atlases to parcellate and measure lobular volumes: Ceres from volBrain [http://volbrain.upv.es] (Manjon and Coupe 2016; Romero et al. 2017; Carass et al. 2018) and spatially unbiased infratentorial template (SUIT), an open-source SPM toolbox [http://www.diedrichsenlab.org/imaging/propatlas.htm] (Diedrichsen et al. 2009). Exploratory correlations examined relations of regional volumes among each other and with IQ scores. In addition, we summarize the findings from clinical radiological review of all MRIs.
Methods
Participants
The full cohort comprised three groups matched in age and sex: 59 controls, 59 FAE, and 61 FAS. All cohort members were identified, recruited, clinically and neuropsychologically examined, and diagnosed with informed consent under the direction of Dr. Ann Streissguth through the FAS follow-up study at the University of Washington (Bookstein et al. 2001, 2002a, 2002b; Streissguth et al. 1991). About half of the sample was clinically ascertained, and the rest were recruited through the FAS screening study conducted on four Indian reservations (Streissguth et al. 1991, p. 1961). Of the FASD participants, systematic diagnosis (conducted mainly by Dr. David Smith or Dr. Sterling Clarren), using 1994 criteria resulted in 61 meeting criteria for FAS and 59 meeting criteria for FAE. The data reported herein were collected between 1997 and 2000. Numerous other reports based on the full or partial cohort have been published (e.g., Bookstein et al. 2002a; Inkelis et al. 2020).
As described by Bookstein et al. (2002a, p. 163), “A diagnosis of FAS entailed evidence of a compromised central nervous system (CNS), growth deficiency of prenatal origin, and the uniquely characteristic facial stigmata subsequent to heavy fetal alcohol exposure: short palpebral fissures, flat philtrum, thin upper vermilion, and flat midface. The related diagnosis of FAE was typically applied to patients with CNS compromise and a history of exposure without the full set of physical findings.”
Further, “All potential subjects/patients were excluded who had AIDS, were taking neurotoxic medications, were legally blind, wore dental braces, had had psychological testing within the past year, or did not have English as their primary language. Additionally, potential normal subjects were excluded who had alcohol or drug problems, neurological problems, birth defects involving the brain, who reported hearing voices or seeing visions, who had a bachelor’s degree or higher education, or whose biological mothers had a history of alcohol or drug problems or had a history of binge drinking around the time of their pregnancy with the subject” (Bookstein et al. 2002a, p. 165). It is likely that these exclusions were used to establish the control group to minimize the presence of neurodysmorphology attributable to known causes and to match the control group as closely as possible to the FAE and FAS groups.
Quality review of the MRI data for cerebellar quantification identified significant artifacts in five datasets precluding valid quantification: one male FAE, one male FAS, and two female FAS showed excessive movement; one female FAS had anomalous intensity contrast due to presence of numerous heterotopias. The final dataset used for cerebellar quantification comprised 59 controls (29 male, 30 female), 58 FAE (28 male, 30 female), and 57 FAS (29 male, 28 female) (Table 1). Although earlier reports on this dataset divided the groups by sex into two age cohorts (13.7–17.9-years old vs. 18.0–37.3 years), we considered this division arbitrary and treated age as a continuous variable in each diagnostic group.
Table 1.
Demographic data for the three groups: mean ± SD or N

|
Full scale, verbal, and performance intelligence quotients (IQ) from the Wechsler Adult Intelligence Scale-Revised (WAIS-R) (Wechsler 1981) were available for all but one participant with FAE and one with FAS. The FAE and FAS groups achieved significantly lower scores than controls on all three IQ measures; although the scores were lower in the FAS than FAE group, the differences were not significant (Table 1), a finding that is consistent with prior neuropsychological studies in children of this population (Mattson et al. 1997).
MRI Acquisition and Analysis
MRI analysis was performed objectively by computer and without supervision and thus blind to diagnosis. After processing, the images were reviewed blind for quantification quality. Native T1-weighted MRI legacy data were acquired on a 1.5 T GE Signa system (sagittal SPGR, TR = 29 ms, TE = 8 ms, flip angle = 45°, FOV = 220 mm, thick = 1.5 mm, slices = 124, matrix = 256 x 256) (Bookstein et al. 2002a). Native data (preserved as flat files without header information) were converted to nifti format for processing.
Each subject’s data were analyzed online with Ceres from volBrain [http://volbrain.upv.es], which yielded total ICV plus segmentation of total cerebellar tissue volume, gray matter cerebellar volumes, a derived volume of white matter (total − gray matter = white matter) and parcellation of the gray matter into 12 lobules (I + II, III, IV, V, VI, Crus I, Crus II, VIIB, VIIIA, VIIIB, IX, and X) plus the sum of volumes of I–IV for comparison with the SUIT atlas. In-house software extracted volumetric data from the downloaded Ceres result tables; rendering of Ceres fits was inspected for quality, and all images were acceptable. Included in the Ceres downloads were estimates of signal-to-noise ratio (SNR). In addition, Ceres provided an asymmetry index for each measure that was calculated as the difference between the right and left volumes divided by their mean (in percent).
After skull-stripping, inhomogeneity-correction, and ICV computation with the SRI24 pipeline (Rohlfing et al. 2010, 2014; Pfefferbaum et al. 2016), the T1 data were similarly analyzed with SUIT. The SUIT label atlas enabled identification and volumetry of total cerebellar tissue, gray matter, and white matter. Regional parcellation yielded volumes of the vermis and 10 lobules of the cerebellar hemispheres: I–IV, V, VI, Crus I, Crus II, VIIB, VIIIA, VIIIB, IX, and X.
To examine the extent of difference in ICV resulting from the Ceres and SUIT/SRI24 brain stripping, we correlated the ICVs estimated from each method. The correlations were nearly perfect: r = 0.997, confidence interval = 0.997 to 0.998.
Statistical Analysis
Statistical analysis was performed using R 3.5.1 [htpp://www.r-project.org/] on bilateral volumes, which were the sums of the left and right regional volumes. The primary statistic was a general linear model (lm) separately predicting the volume of each region as a function of diagnosis (control, FAE, and FAS) + ICV + sex + age with stepwise model selection by AIC to simplify the model. In addition, the estimated marginal means were extracted, and the model’s residual values for each subject (adjusting for contributions of ICV, sex, and age but without the contribution of diagnosis) were retained. The mean value of the controls was added to each individual’s residual for plotting on a meaningful scale. Interactions were also examined with the model including the 24-, 2-way (group by sex and group by age), and 3-way (group by sex by age) interactions. The model outputs produced t and p significance values for each diagnostic group relative to the controls. To compare FAE to FAS, the model was rerun with FAS as the index level.
The model was applied to the Ceres- and SUIT-derived volumes separately. Family-wise Bonferroni corrections were applied for α = 0.05 with directional (one-tailed) testing of the overarching hypothesis predicting a graded effect: control > FAE > FAS for all tissue measures, and control < FAE < FAS for CSF measures. For the three total tissue volumes of Ceres, correction required P ≤ 0.03; for the 13 Ceres lobules, P ≤ 0.008. For the four total volumes of SUIT, correction required P ≤ 0.025; for the 11 SUIT lobules, P ≤ 0.009.
Group differences in ICV were examined with an lm predicting ICV as a function of diagnosis + sex + age. Exploratory correlations examined relations of age and IQ with regional cerebellar volumes.
Results
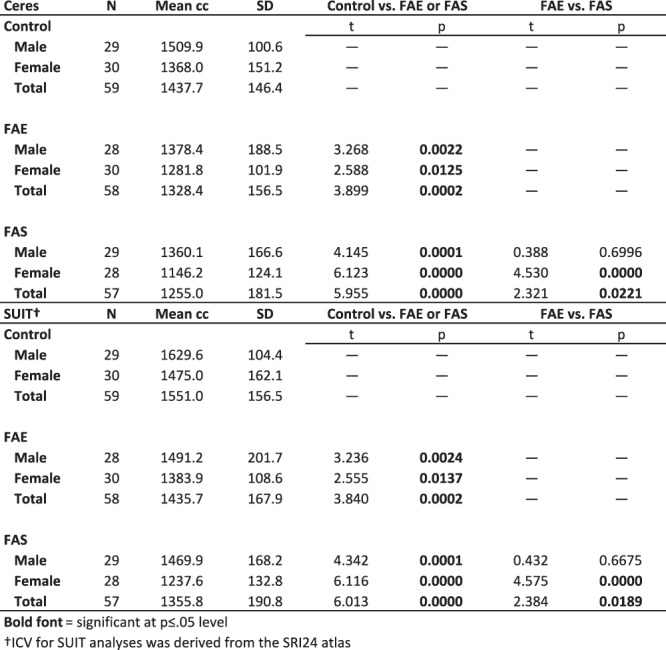
ICV measures showed a diagnostically graded effect, where control volumes were larger than FAE and FAS volumes (P < 0.0002) and FAE volumes were larger than FAS volumes (P = 0.023). Notably, the mean ± SD ICV derived from Ceres of the total control group was 1437.7 ± 146.4 cc, which comported with the ICV of 1430.5 ± 145.3 cc (t = 0.463, P = 0.645) in another sample of 283 male and 282 female, no-to-low alcohol drinking adolescents, and young adults (mean ± age = 16.0 ± 3.0, range = 12.0–24.3 years) (Sullivan et al. 2019a). Relevantly, the total cerebellar volume was highly correlated with ICV in each group: with the Ceres approach, control r = 0.744, P = 0.000; FAE r = 0.804, P = 0.000; FAS r = 0.666, P = 0.000; with the SUIT/SRI 24 approach, control r = 0.804, P = 0.000; FAE r = 0.851, P = 0.000; and FAS r = 0.753, P = 0.000.
Adjusting for group differences in ICV of the current diagnostic FAE and FAS groups by including ICV as a factor in the lm was effective in attenuating the influence of this diagnostic difference on the dependent variable as exemplified by the removal of the correlations between residual total cerebellar volumes and ICV for each group: with the Ceres approach, control r = 0.086, P = 0.500; FAE r = 0.051, P = 0.703; FAS r = −0.087, P = 0.520; with the SUIT/SRI 24 approach, control r = 0.084, P = 0.618; FAE r = 0.019, P = 0.889; and FAS r = −0.068, P = 0.618. Further, as expected, ICVs were larger in male than female participants in each group (Table 2; Fig. 1). Consequently, ICV, sex, and age were entered as factors in all lm analyses testing for group differences, which were considered significant with correction for multiple comparisons. Tables and figures provide specific statistical test results.
Table 2.
ICV from Ceres and SUIT analyses by diagnostic group and sex
|
Figure 1.
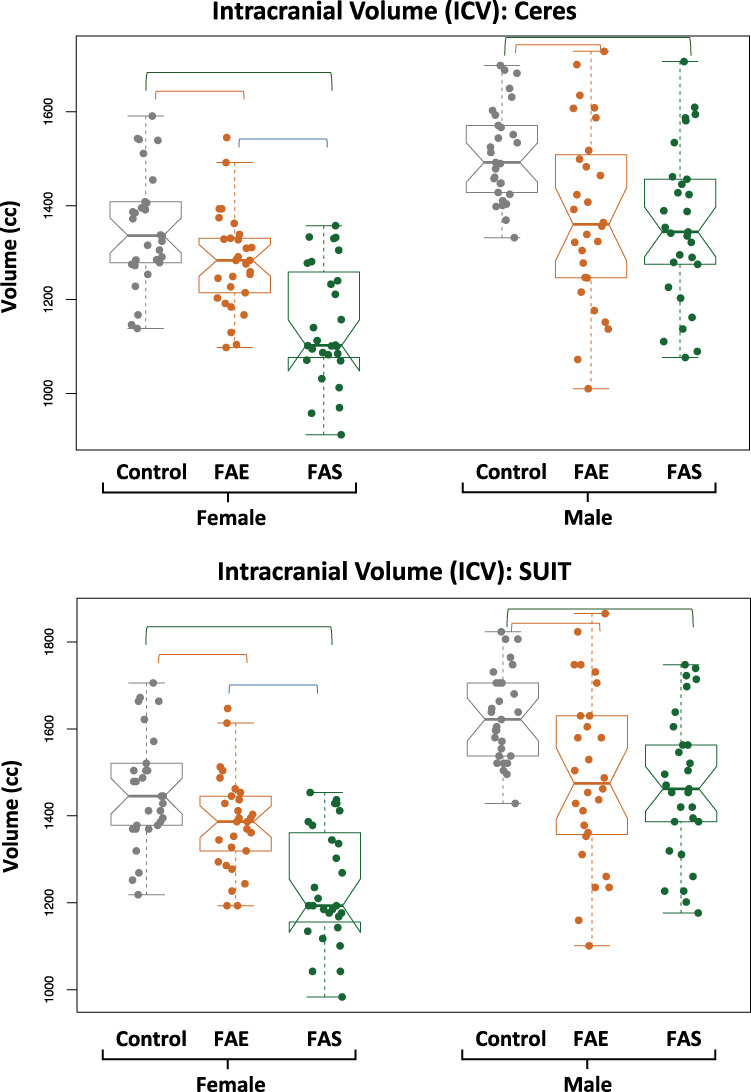
Violin plots of the ICV measured with Ceres (top) and with the SRI24 atlas used for the SUIT analysis (bottom) for each group by sex. Both analysis approaches identified graded effects, such that the ICVs of the controls were the largest, the FAS were the smallest, and the FAE fell between the extremes. Further, the female groups were smaller than the male groups. The overlying bars indicate significant differences, as noted in Table 2.
Group Differences Based on Ceres Quantification
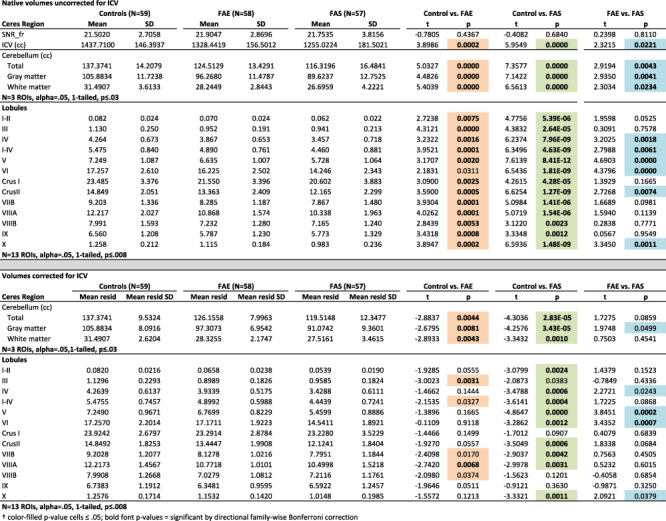
On average, the three groups did not differ in SNR estimates (Table 3). Native volumes unadjusted for ICV, age, or sex differences indicated marked deficits in the FAE and FAS groups separately in all cerebellar regions relative to controls (P = 0.008–8.14e-12) with all but one comparison meeting Bonferroni correction for multiple comparisons (FAE vs. control VI, P = 0.0311). Graded deficits (FAE > FAS P ≤ 0.008) were present in total cerebellar and total gray matter volumes (Fig. 2) and gray matter volumes of lobules I-IV, IV, Crus II, and X with trends in lobules IV and V (Table 3).
Table 3.
Ceres-derived volumes: mean ± SD raw volume and residual volume of ICV for each group and results from the full lm comparisons†
|
Figure 2.
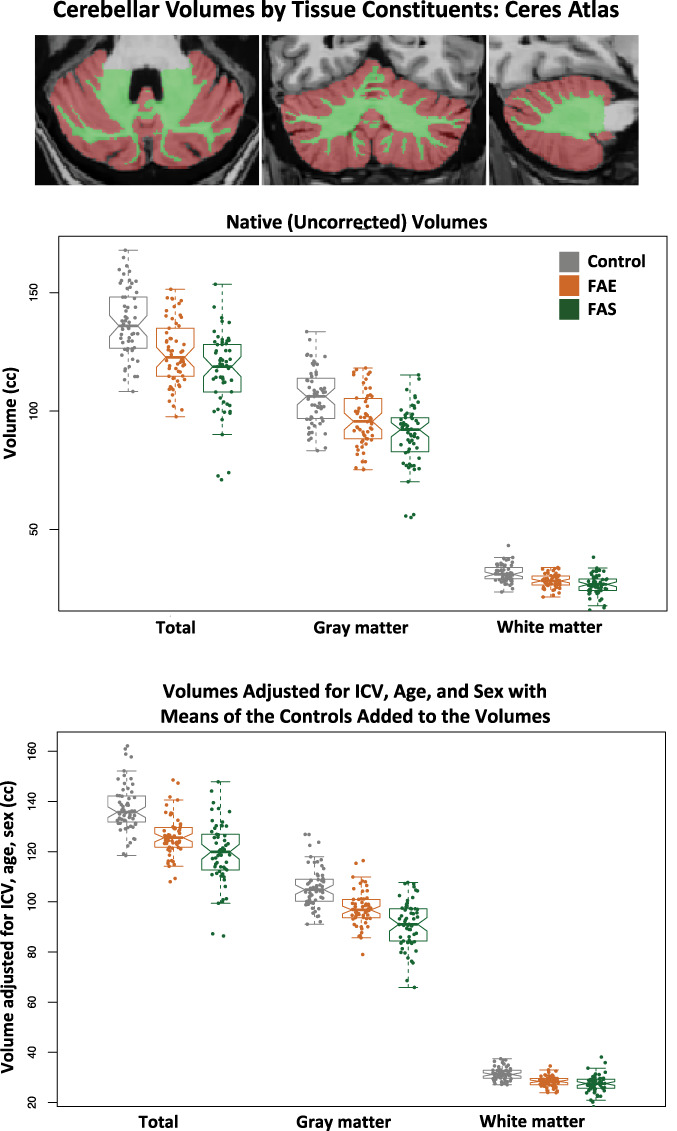
Top MRI example: axial, coronal, and sagittal slices of the cerebellum segmented using the Ceres atlas; brown = gray matter, green = white matter. Data plots: Violin plots of the total, gray matter, and white matter cerebellar volumes for the three groups. The top data are native (uncorrected) volumes, and the bottom data are volumes adjusted for ICV, age, and sex with the means of the controls added to the volumes for display. In general, each measure showed a graded effect: control > FAE > FAS. See Table 3 for statistics.
Despite corrections for ICV, age, and sex, both the FAE and the FAS groups had significantly smaller, whole cerebellar volumes of gray matter, white matter, and total cerebellum than the control group (P ≤ 0.044–0.0004; Fig. 2). Although the FAS volumes were on average smaller than the FAE volumes, the differences between them were not significant, nor were any interactions with group and factors. Regional analyses identified significant gray matter volume deficits in the FAS group compared with controls in lobules I–II, IV, I–IV, V, VI, Crus II, VIIB, VIIIA, and X. Volume deficits in the FAE group were in lobules III and VIIIA. Further comparisons revealed significantly smaller volumes (with ICV adjustment) in FAS than FAE in lobules V and VI (Table 3; Fig. 3).
Figure 3.
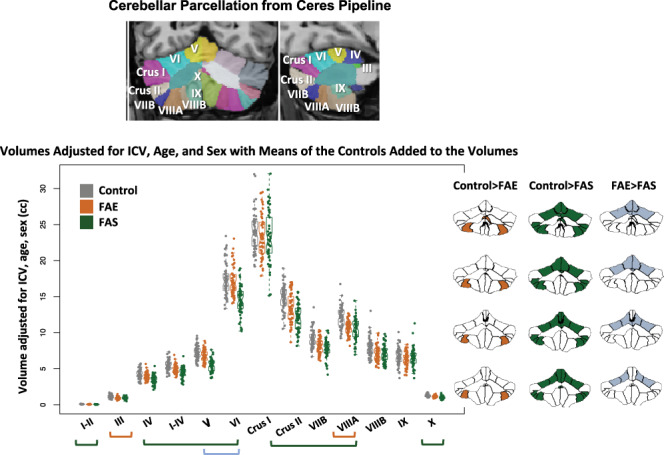
Top MRI example: coronal and sagittal views of the cerebellum parcellated using the Ceres atlas and pipeline. Data plot: Violin plots display volumes adjusted for ICV, age, and sex with the means of the controls added to the volumes for display. The greatest differences were between the control and FAS groups (green bars and green fills in the parcellated examples); additional differences were identified between controls and FAE (orange bar and orange fills in the parcellated examples); a few lobules were significantly smaller in the FAS than FAE group (blue bars and blue fills in the parcellated examples). See Table 3 for statistics.
The Ceres asymmetry index revealed no group differences in regional asymmetry. On average, for all three groups, right hemisphere volumes were larger than the left of lobules I–II, Crus I, IX, and X, whereas left hemisphere volumes were larger than the right for VI, Crus II, VIIB, VIIIA, and the total cerebella (Fig. 4).
Figure 4.
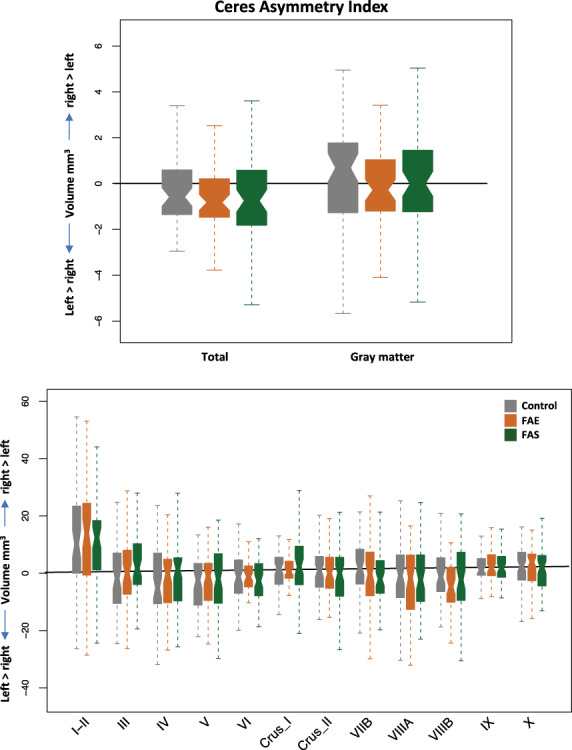
Asymmetry measures produced by the Ceres pipeline of total (top) and lobular (bottom) volumes by group.
Group Differences Based on SUIT Quantification
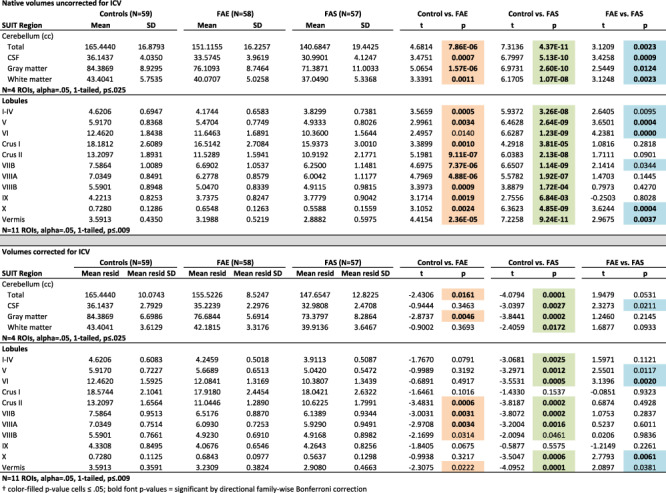
Native volumes using the SUIT analysis unadjusted for ICV, age, or sex differences revealed a similar pattern of volume deficits identified with the Ceres approach. The SUIT approach indicated marked deficits in the FAE and FAS groups separately in all cerebellar regions relative to controls (P = 0.0011–4.37e-11) with all contrasts meeting Bonferroni correction for multiple comparisons. Graded deficits for tissue (control > FAE > FAS) and CSF volumes (control > FAE > FAS) were present in the four (gray matter, white matter, CSF, and total) whole cerebellar volumes (P ≤ 0.125) (Fig. 5). Regionally, gray matter volumes of lobules V, VI, and X exhibited deficits (Table 4).
Figure 5.
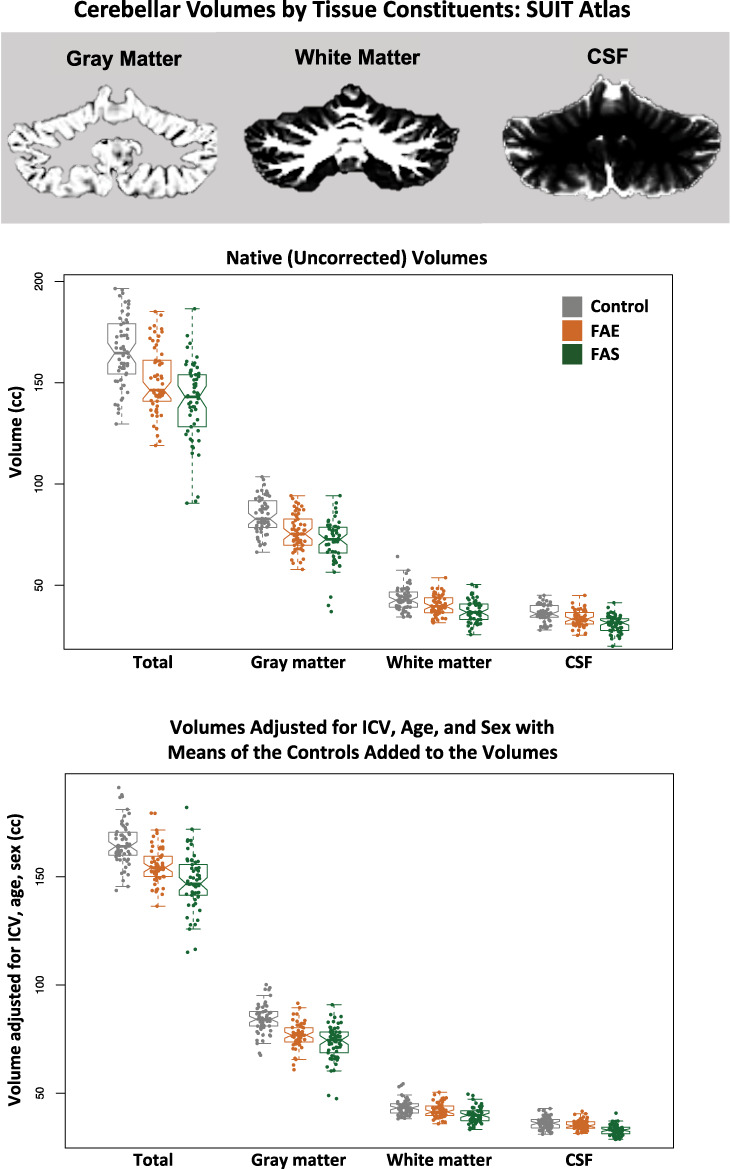
Top MRI example: a coronal slice of the cerebellum segmented for gray matter, white matter, and CSF using the SRI24 atlas for SUIT analysis. Data plots: Violin plots of the total, gray matter, white matter, and CSF cerebellar volumes for the three groups. The top data are native (uncorrected) volumes, and the bottom data are volumes adjusted for ICV, age, and sex with the means of the controls added to the volumes for display. In general, each measure showed a graded effect: control > FAE > FAS. See Table 4 for statistics.
Table 4.
SUIT-derived volumes: mean ± SD raw volume and residual volume of ICV for each group and results from the full lm comparisons†
|
With adjustment for ICV, sex, and age, analysis based on the SUIT atlas revealed deficits in tissue volumes and CSF volumes in the FAS group in all four whole cerebellar volume measures. Deficits in the FAE group were for gray matter and total volumes. The CSF measure was unique to SUIT and revealed a graded effect trend, where FAS had smaller volumes than FAE (P = 0.0414; Table 4; Fig. 5).
Regional gray matter volumes, adjusted for ICV, sex, and age, were smaller in FAS than controls in all but two lobules (Crus I and IX) and were smaller than FAE in lobules VI and X. FAE volume deficits relative to controls were present in Crus II, VIIB, and VIIIA. In addition, volume deficits of the vermis were greatest for FAS but showed only a trend toward a graded effect of FAS < FAE (P = 0.0688) (Table 4; Fig. 6).
Figure 6.
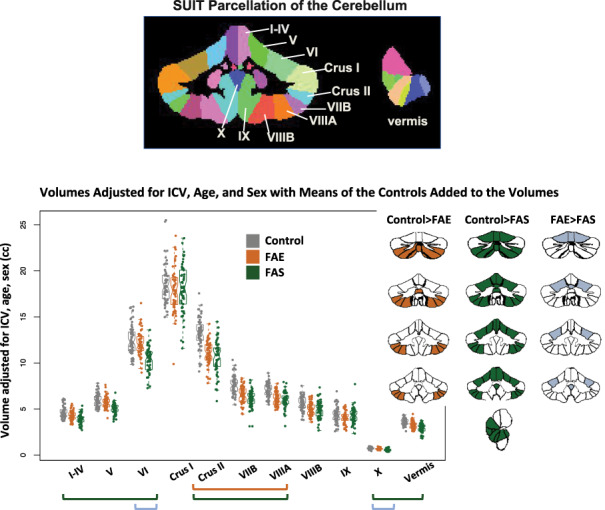
Top MRI example: coronal and sagittal views of the cerebellum parcellated using the SUIT pipeline. Data plot: Violin plots display volumes adjusted for ICV, age, and sex with the means of the controls added to the volumes for display. The greatest differences were between the control and FAS groups (green bars and green fills in the parcellated examples); additional differences were identified between controls and FAE (orange bar and orange fills in the parcellated examples); a few lobules were significantly smaller in the FAS than FAE group (blue bars and blue fills in the parcellated examples). See Table 4 for statistics.
Correlations Between IQ and Cerebellar Metrics
Exploratory analyses examined potential relations between any of the three IQ scores (VIQ, PIQ, and FSIQ) and regional cerebellar volumes in the combined FAE + FAS group and considered only correlations P ≤ 0.017 (two-tailed, required by Bonferroni correction for three comparisons). Only the PIQ-VIIB Ceres-based correlation reached significance (p=.0149). For SUIT, higher VIQs correlated with larger X volumes (r = 0.236, P = 0.0110), higher PIQs correlated with larger VIIB volumes (r = 0.305, P = 0.0010), and higher FSIQs correlated with larger VIIB volumes (r = 0.275, P = 0.0032) (Fig. 7; see Supplemental Table S1).
Figure 7.
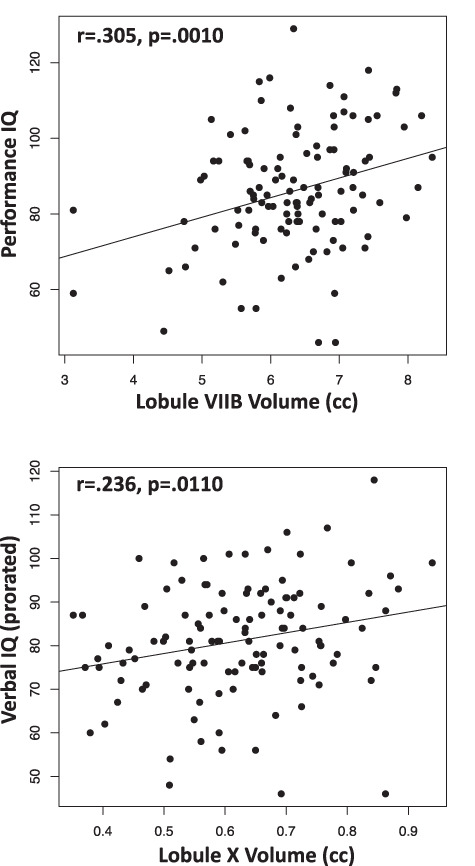
Correlations between performance IQ scores and SUIT-based lobule VIIB volumes (top) and between verbal IQ scores and SUIT-based lobule X volumes (bottom).
Multiple regression using SUIT VIIB and X volumes to seek selective relations with PIQ yielded a significant R2 of 0.098 (P = 0.0035) and indicated a significant relation with VIIB (t = 3.032, P = 0.0030) accounting for 6.5% of the variance over and above that observed with X (t = 0.762, P = 0.448), which accounted for 0.4%. Conversely, a multiple regression seeking a selective relation between VIIB or X and VIQ yielded an R2 of 0.072 (P = 0.0155) and indicated a significant relation with X (t = 2.162, P = 0.328), which accounted for 5.0% of the variance over and above that observed with VIIB (t = 1.386, P = 0.1686), which accounted for 1.6%.
Neuroradiological Readings
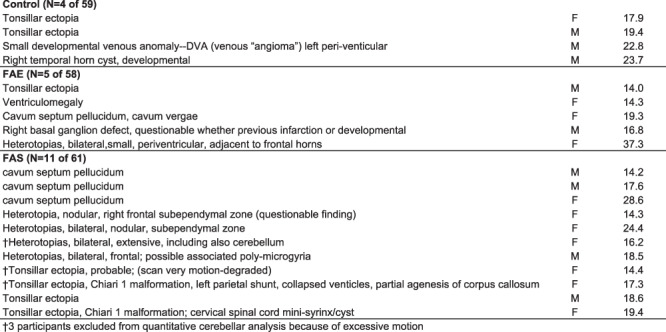
A clinical neuroradiologist (B.L.) reviewed all 179 MRI studies blind to diagnosis, including the five cases with excessive motion precluding unsupervised quantitative analysis. Review of the analyzed images indicated that the structural anomalies did not interfere with automatic parcellation of the cerebellar lobules. Visually identifiable structural abnormalities were detected in 4 of 59 control, 5 of 59 FAE, and 11 of 61 FAS cases (control vs. FAS χ2 = 3.472, P = 0.031, one-tailed). Table 5 lists the abnormalities for each positive reading; Figure 8 displays examples of anomalies of cases included in quantitative analysis. The most common abnormalities were gray matter heterotopias and tonsillar ectopia. Of the 20 identified anomalies, 8 involved the cerebellum, with 5 of 11 in the FAS group 1 in the FAE group, and 2 of 4 in the controls.
Table 5.
Participants with structural anomalies identified on clinical neuroradiological reading
|
Figure 8.
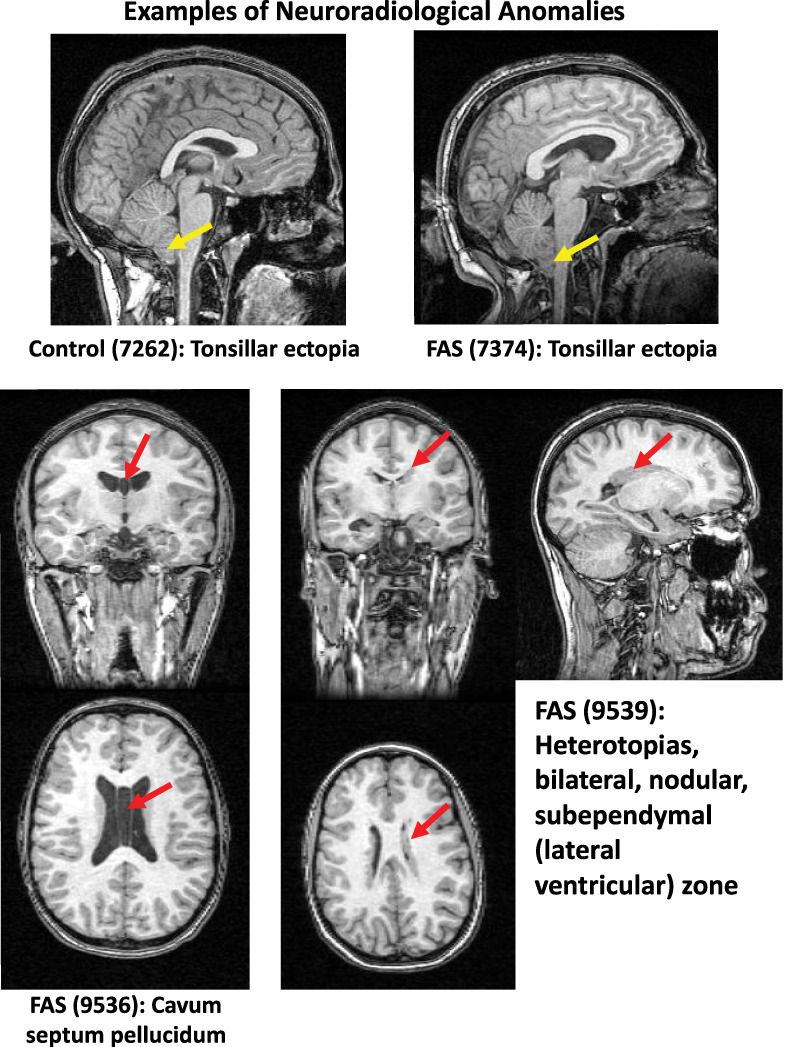
Examples of structural anomalies listed in Table 5 identified by a clinical neuroradiologist (B.L.).
Discussion
In general, the groups exposed to alcohol during prenatal development exhibited graded effects of cerebellar volume deficits, providing support for a spectrum based on severity and a diagnostic distinction of this legacy cohort. Compared with unaffected controls, both the FAE and the FAS groups had widespread cerebellar volume deficits, which extended to gray matter and white matter and to all hemispheric lobules without correction for their abnormally small ICVs. With ICV correction, the regional volume deficits were limited to lobules traditionally associated with gait and motor disturbance and cognitive and emotional processing, with evidence for selective regionally graded volume deficits. These findings refine previous reports on these data and provide novel results regarding regional and graded effects of prenatal alcohol exposure on this highly complex structure in adolescence and middle adulthood (cf., Steele and Chakravarty 2018) and potential substrates of impaired cognitive and motor functioning.
Because the analysis was based on legacy data, we had no control over any data acquisition parameters, which were suboptimal by today’s standards yet adequate for analysis. A measurement complication stemmed from the highly foliated anatomy of the cerebellum, the quantification of which was challenged by image resolution. Consequently, we chose two leading cerebellar quantification approaches and atlases (Ceres: Manjon and Coupe 2016; Romero et al. 2017) (SUIT: Diedrichsen et al. 2009, 2011) to seek converging results to enhance confidence in the findings and interpretations. Indeed, we recently compared these approaches along with a third, the Johns Hopkins atlas (Yang et al. 2016), and found that all three approaches yielded similar results (Sullivan et al. 2019b). For the current analysis, we chose to use the Ceres and SUIT approaches, which we considered would provide adequate opportunity for testing overlap and disparity. As observed, the two approaches yielded similar, albeit not perfectly overlapping, results noted in the following sections.
Graded Effects of Fetal Alcohol Exposure on ICV and Cerebellar Lobular Volumes
One of the major signs of FAS is abnormally small head size with extreme cases considered microcephalic. The current analysis indicated that the ICV of the FAE group was, on average, 92.4% (using the Ceres pipeline) to 92.6% (using the SRI24 atlas with SUIT) of the ICV of the controls, and FAS was 87.3% (Ceres) to 87.4% (SRI24/SUIT) of the controls. These volume estimates comport well with reports on other FASD cohorts of varying ages and subjected to a variety of analysis approaches, which indicated ICV deficits ranging from 11% (Astley et al. 2009) to 13% (Cardenas et al. 2014) to 15% (McGee and Riley 2006). Earlier analysis of cerebellar morphometry on the current FASD cohort found deficits in its total volume that were greater in FAS than in nondysmorphic FASD cases (cf., McGee and Riley 2006; Norman et al. 2009). Also consistent with other reports (Archibald et al. 2001; Roldan-Valadez et al. 2015; Zhou et al. 2018), asymmetry indices of the cerebellar hemispheres measured in the current cohort by the Ceres analysis did not differ between the affected groups and from controls.
In recognition of the challenges to delineate the highly foliated cerebellar lobules with further refinement by tissue constituent, we subjected these legacy data to two independent analysis approaches. Despite the lower magnet strength of 1.5 T compared with current standards of 3.0 T, the adequate image acquisition resolution enabled both analysis approaches to parcellate the cerebellum successfully. The resulting widespread volume deficits with graded effects subtended all measured lobules in both the FAE and FAS groups before applying ICV correction. With ICV correction, both approaches identified more affected lobules in the FAS than the FAE group, indicating graded volume deficit effects over and above global brain volume deficits. Regionally, both Ceres and SUIT found anterior superior volume deficits in the lobule complex of I–IV in the FAS group not present in the FAE group; deficits in lobules VIIB, VIIIA, VIIIB, and X in FAS; and absence of volume deficits in Crus I of either group. For FAE, both methods identified volume deficits in VIIIA and unexpectedly FAE > FAS graded effects in VI. Nonetheless, a few analysis approach measurement differences also emerged with correction for ICV and multiple comparisons: Ceres found a graded effect in lobule V, whereas SUIT found a graded effect in lobule X.
Taken together, the anterior superior and inferior lobular volume deficits of the FAS group reflected two earlier studies of a prenatal alcohol exposure group ages 10–18 (Cardenas et al. 2014) and 8–22-years old at MRI (Sowell et al. 1996). Longitudinal ultrasound investigation found that the cerebellum grows a surprising 500% from prenatal week 24 to 40 (Koning et al. 2017; Dudek et al. 2018; Lerman-Sagie et al. 2018). While the greatest growth occurs in the third trimester, the cerebellum is speculated to be vulnerable to teratogens throughout its prenatal development. The rhombic lip, a primary progenitor zone of the cerebellum, appears about 30 days after conception and continues the development and cell proliferation to the end of the second postnatal year (Haldipur et al. 2019). Thus, we speculate that heavy alcohol exposure occurring during the first embryonic month, that is, prior to initiation of cerebellar development, could cause severe deletion or hypoplasia and suggest that insult severity is linked to timing of alcohol exposure, as is supported by the rodent literature (Clarren et al. 1988, 1992; Sulik 2005). Regionally selective vermian damage, however, does also occur in later cerebellar development. Depending on the timing and dose of alcohol exposure in early postnatal development, a period of rapid brain growth in rodents equivalent to that seen in the third trimester in humans, Purkinje apoptosis (Dikranian et al. 2005) was more likely to occur in cells that tended to mature early and were found in early-developing lobules, notably I, IX, and X (Bonthius and West 1990). In other words, lobules showing the greatest alcohol-related damage were more mature at the time of exposure than the lobules (i.e., VI and VII) evidencing the least effects. Drawing from rodent studies, a speculation from a nonhuman primate model of FAS proffered that, given the prolonged development of Purkinje cells, the third trimester of pregnancy may be the most vulnerable to high alcohol exposure (Bonthius et al. 1996). Further, in an ovine model of intermittent binge drinking that compared the first and third trimester of alcohol exposures, relative to controls, fetal sheep with the earlier insult had fewer Purkinje cells across all cerebellar vermis lobules, while the fetal sheep with third trimester exposure had fewer Purkinje cells only in the earlier maturing region of the vermis (Sawant et al. 2013).
These prenatal injuries endure throughout postnatal life (Limperopoulos et al. 2014; Moore and Riley 2015) and are likely to cause, or at least contribute to, developmental cognitive and motor delay (Bolduc et al. 2011) or behavioral problems associated with autism (Bolduc et al. 2012) and attention deficit hyperactivity disorder (Coffin et al. 2005; Peadon and Elliott 2010) that occur in FASD with greater than normal prevalence (Weyrauch et al. 2017; Lange et al. 2018).
Graded Effects in Clinically Detected Neurodysmorphology
Clinical neuroradiological readings of FASD cases commonly describe midline anomalies, most notably partial or complete agenesis of the corpus callosum, cavum septum pellucidum or vergae, or ventriculomegaly (e.g., Swayze et al. 1997; Meintjes et al. 2014). An association of these midline features with facial features of FASD is consistent with those reported in animal models (Lipinski et al. 2012; Birch et al. 2015). Remarkably, however, structural anomalies occur with high prevalence even in otherwise healthy, asymptomatic study participants and are commonly referred to as “normal variants.” Indeed, recent studies reported 4–19% incidence of structural anomalies in youth and young adults screened for neurological or psychiatric conditions (reviewed in Sullivan et al. 2017) (Morris et al. 2009; Gur et al. 2013; Kaiser et al. 2015). An example is from the National Consortium on Alcohol and Neurodevelopment in Adolescence (NCANDA) cohort of 833 youth, age 12–21-years old at baseline MRI (Brown et al. 2015; Pfefferbaum et al. 2016). Clinical readings revealed an 11.5% incidence of anomalies with 32.7% involving the cerebellum or cisterna magna (Sullivan et al. 2017). In the current study, 8 of the 20 identified anomalies involved the cerebellum, mostly tonsillar ectopia, with the same percentage of positive readings in the FAS group (5 of 11) as in the controls (2 of 4). Although the genesis of tonsillar ectopia and even Chiari I malformations have been presumed to be a result of anomalous neurodevelopment, recent work provides evidence that elevated intracranial pressure could cause herniation of an otherwise normally developing tonsil (Ganesan et al. 2009; Aiken et al. 2012). By contrast, the greater incidence of gray matter heterotopias in the FAS (N = 4) and FAE (N = 1) groups compared with none in the controls is consistent with errant neuronal migration likely owing to excessive prenatal alcohol exposure, possibly compounded by tobacco or other drug use by the mother (for review, Koning et al. 2017).
Cognitive and Motor Correlates of Lobular Volume Deficits
Abnormal cerebellar morphometry occurs in a number of neurodevelopmental disorders in addition to FASD, including autism (Allen et al. 2004) and fragile X syndrome (Wang et al. 2017; Sandoval et al. 2018) and has been associated with selective cognitive (O'Hare et al. 2005), cerebellar-mediated timing of finger tapping (du Plessis et al. 2015), classical eyeblink conditioning (Jacobson et al. 2008), and affect (Hoche et al. 2018) disturbances in FASD. In functional imaging contexts, the finger tapping timing test and eyeblink conditioning implicated lateralized involvement of lobule VI, and finger tapping implicated Crus I among other cortical and cerebellar regions. In the current study, however, Crus I showed no volume deficit in either the FAE or FAS group, whereas VI showed a volume deficit but only in the more severely affected, FAS group. Thus, to the extent that the structural data of the current study are generalizable and apply to functional findings, it would suggest that a volume deficit in lobule VI may also have been associated with the functional activation deficits previously reported with that lobule.
In the current study, we found suggestive evidence for a double dissociation between smaller lobule VIIB volume and poorer PIQ scores and between smaller lobule X volume and poorer VIQ scores, and not the converse. Observations from lesion studies reveal associations between deficits in spatial orientation and construction as arising from lesions of the inferior cerebellum including lobule VIIB (Stoodley et al. 2016). The modest VIQ relation with lobule X, the floccular nodulus lobule often associated with balance, presents a greater interpretation challenge. Although lobule X is traditionally associated with vestibular functioning (reviewed in Stoodley and Schmahmann 2010), a recent study (Jung et al. 2019) found that larger volumes of right and vermian lobule X, among other regions, correlated significantly with several measures from the Wisconsin Card Sorting Test, which traditionally had been considered a classical test of prefrontal cortical function.
Limitations
Few studies are without limitations; ours have three salient ones. Firstly, as already discussed, the analysis used legacy data acquired two decades ago with desirable acquisition parameters of that time. Despite suboptimal acquisition by today’s standards, postprocessing methods produced sound imaging data. Secondly, diagnostic and physiognomic criteria for identifying FAS and FAE have evolved since the original diagnoses were conducted. That said, the criteria applied 20 years ago were strict, and the graded effects detected in selective lobular volumes provide assurance for the FAE/FAS distinction. Nonetheless, the analysis would have been enhanced if specific facial and other diagnostic features were available for correlation. Thirdly, access to neuropsychological data was limited to the main indices of the WAIS, thereby restricting opportunities for testing associations and double dissociations between selective functions and specific lobular volumes.
Conclusion
In general, the groups exposed to alcohol during fetal development exhibited graded effects of cerebellar volume deficits, providing support for a spectrum based on severity and a diagnostic distinction. Further, the regional cerebellar FAE/FAS-related volume deficits may well contribute to diagnostically characteristic functional impairment involving emotional control, visuomotor coordination, and postural stability (for review Mattson et al. 2001). That most of the affected participants ranged from midadolescence to young adulthood of this legacy cohort provides evidence that the presumed prenatally alcohol-induced neuroanomalies are enduring (Moore and Riley 2015), putting the FASD cohort at risk for exacerbated age-related declines (Lebel et al. 2012; Hendrickson et al. 2018).
Supplementary Material
Notes
The National Institute on Alcohol Abuse and Alcoholism (grants AA010723, AA021697, AA014811, AA026994). The original funding that supported participant recruitment, diagnosis, clinical interview and testing, and MRI scanning, conducted under the direction of Drs. Ann P. Streissguth, Fred L. Bookstein, P.D. Sampson, and P.D. Connor, was from the National Institutes of Health grants (AA010836 to A.S. and GM037251 to F.B.). The authors of the current paper are grateful to Drs. Streissguth, Bookstein, Sampson, and Connor because only through their generosity in data sharing of their carefully collected and archived data could the analyses presented herein have been conducted. We also thank Dr. Therese Grant who was instrumental in providing the data to us. Conflict of Interest: All authors contributed significantly to this research project, and none has any conflict with this work. This work is not being considered for publication elsewhere.
References
- Aiken AH, Hoots JA, Saindane AM, Hudgins PA. 2012. Incidence of cerebellar tonsillar ectopia in idiopathic intracranial hypertension: a mimic of the Chiari I malformation. AJNR Am J Neuroradiol. 33:1901–1906. [DOI] [PMC free article] [PubMed] [Google Scholar]
- Allen G, Muller RA, Courchesne E. 2004. Cerebellar function in autism: functional magnetic resonance image activation during a simple motor task. Biol Psychiatry. 56:269–278. [DOI] [PubMed] [Google Scholar]
- Archibald SL, Fennema-Notestine C, Gamst A, Riley EP, Mattson SN, Jernigan TL. 2001. Brain dysmorphology in individuals with severe prenatal alcohol exposure. Dev Med Child Neurol. 43:148–154. [PubMed] [Google Scholar]
- Astley SJ, Aylward EH, Olson HC, Kerns K, Brooks A, Coggins TE, Davies J, Dorn S, Gendler B, Jirikowic T et al. 2009. Magnetic resonance imaging outcomes from a comprehensive magnetic resonance study of children with fetal alcohol spectrum disorders. Alcohol Clin Exp Res. 33:1671–1689. [DOI] [PMC free article] [PubMed] [Google Scholar]
- Birch SM, Lenox MW, Kornegay JN, Shen L, Ai H, Ren X, Goodlett CR, Cudd TA, Washburn SE. 2015. Computed tomography assessment of peripubertal craniofacial morphology in a sheep model of binge alcohol drinking in the first trimester. Alcohol. 49:675–689. [DOI] [PMC free article] [PubMed] [Google Scholar]
- Bolduc ME, Du Plessis AJ, Sullivan N, Khwaja OS, Zhang X, Barnes K, Robertson RL, Limperopoulos C. 2011. Spectrum of neurodevelopmental disabilities in children with cerebellar malformations. Dev Med Child Neurol. 53:409–416. [DOI] [PubMed] [Google Scholar]
- Bolduc ME, du Plessis AJ, Sullivan N, Guizard N, Zhang X, Robertson RL, Limperopoulos C. 2012. Regional cerebellar volumes predict functional outcome in children with cerebellar malformations. Cerebellum. 11:531–542. [DOI] [PubMed] [Google Scholar]
- Bonthius DJ, West JR. 1990. Alcohol-induced neuronal loss in developing rats: increased brain damage with binge exposure. Alcohol Clin Exp Res. 14:107–118. [DOI] [PubMed] [Google Scholar]
- Bonthius DJ, Bonthius NE, Napper RM, Astley SJ, Clarren SK, West JR. 1996. Purkinje cell deficits in nonhuman primates following weekly exposure to ethanol during gestation. Teratology. 53:230–236. [DOI] [PubMed] [Google Scholar]
- Bookstein FL, Sampson PD, Streissguth AP, Connor PD. 2001. Geometric morphometrics of corpus callosum and subcortical structures in the fetal-alcohol-affected brain. Teratology. 64:4–32. [DOI] [PubMed] [Google Scholar]
- Bookstein FL, Sampson PD, Connor PD, Streissguth AP. 2002a. Midline corpus callosum is a neuroanatomical focus of fetal alcohol damage. Anat Rec. 269:162–174. [DOI] [PubMed] [Google Scholar]
- Bookstein FL, Streissguth AP, Sampson PD, Connor PD, Barr HM. 2002b. Corpus callosum shape and neuropsychological deficits in adult males with heavy fetal alcohol exposure. Neuroimage. 15:233–251. [DOI] [PubMed] [Google Scholar]
- Bookstein FL, Streissguth AP, Connor PD, Sampson PD. 2006. Damage to the human cerebellum from prenatal alcohol exposure: the anatomy of a simple biometrical explanation. Anat Rec B New Anat. 289:195–209. [DOI] [PubMed] [Google Scholar]
- Boronat S, Sanchez-Montanez A, Gomez-Barros N, Jacas C, Martinez-Ribot L, Vazquez E, Del Campo M. 2017. Correlation between morphological MRI findings and specific diagnostic categories in fetal alcohol spectrum disorders. Eur J Med Genet. 60:65–71. [DOI] [PubMed] [Google Scholar]
- Brown SA, Brumback T, Tomlinson K, Cummins K, Thompson WK, Nagel BJ, De Bellis MD, Hooper SR, Clark DB, Chung T et al. 2015. The national consortium on alcohol and neurodevelopment in adolescence (NCANDA): a multisite study of adolescent development and substance use. J Stud Alcohol Drugs. 76:895–908. [DOI] [PMC free article] [PubMed] [Google Scholar]
- Carass A, Cuzzocreo JL, Han S, Hernandez-Castillo CR, Rasser PE, Ganz M, Beliveau V, Dolz J, Ben Ayed I, Desrosiers C et al. 2018. Comparing fully automated state-of-the-art cerebellum parcellation from magnetic resonance images. Neuroimage. 183:150–172. [DOI] [PMC free article] [PubMed] [Google Scholar]
- Cardenas VA, Price M, Infante MA, Moore EM, Mattson SN, Riley EP, Fein G. 2014. Automated cerebellar segmentation: validation and application to detect smaller volumes in children prenatally exposed to alcohol. Neuroimage Clin. 4:295–301. [DOI] [PMC free article] [PubMed] [Google Scholar]
- Cheng DT, Meintjes EM, Stanton ME, Dodge NC, Pienaar M, Warton CMR, Desmond JE, Molteno CD, Peterson BS, Jacobson JL et al. 2017. Functional MRI of human eyeblink classical conditioning in children with fetal alcohol spectrum disorders. Cereb Cortex. 27:3752–3767. [DOI] [PMC free article] [PubMed] [Google Scholar]
- Clarren SK, Alvord EC Jr, Sumi SM, Streissguth AP, Smith DW. 1978. Brain malformations related to prenatal exposure to ethanol. J Pediatr. 92:64–67. [DOI] [PubMed] [Google Scholar]
- Clarren SK, Astley SJ, Bowden DM. 1988. Physical anomalies and developmental delays in nonhuman primate infants exposed to weekly doses of ethanol during gestation. Teratology. 37:561–569. [DOI] [PubMed] [Google Scholar]
- Clarren SK, Astley SJ, Gunderson VM, Spellman D. 1992. Cognitive and behavioral deficits in nonhuman primates associated with very early embryonic binge exposures to ethanol. J Pediatr. 121:789–796. [DOI] [PubMed] [Google Scholar]
- Coffin JM, Baroody S, Schneider K, O'Neill J. 2005. Impaired cerebellar learning in children with prenatal alcohol exposure: a comparative study of eyeblink conditioning in children with ADHD and dyslexia. Cortex. 41:389–398. [DOI] [PubMed] [Google Scholar]
- Diedrichsen J, Balsters JH, Flavell J, Cussans E, Ramnani N. 2009. A probabilistic MR atlas of the human cerebellum. Neuroimage. 46:39–46. [DOI] [PubMed] [Google Scholar]
- Diedrichsen J, Maderwald S, Kuper M, Thurling M, Rabe K, Gizewski ER, Ladd ME, Timmann D. 2011. Imaging the deep cerebellar nuclei: a probabilistic atlas and normalization procedure. Neuroimage. 54:1786–1794. [DOI] [PubMed] [Google Scholar]
- Dikranian K, Qin YQ, Labruyere J, Nemmers B, Olney JW. 2005. Ethanol-induced neuroapoptosis in the developing rodent cerebellum and related brain stem structures. Brain Res Dev Brain Res. 155:1–13. [DOI] [PubMed] [Google Scholar]
- du Plessis L, Jacobson SW, Molteno CD, Robertson FC, Peterson BS, Jacobson JL, Meintjes EM. 2015. Neural correlates of cerebellar-mediated timing during finger tapping in children with fetal alcohol spectrum disorders. Neuroimage Clin. 7:562–570. [DOI] [PMC free article] [PubMed] [Google Scholar]
- Dudek K, Nowakowska-Kotas M, Kedzia A. 2018. Mathematical models of human cerebellar development in the fetal period. J Anat. 232:596–603. [DOI] [PMC free article] [PubMed] [Google Scholar]
- E K-H, Chen SH, Ho MH, Desmond JE. 2014. A meta-analysis of cerebellar contributions to higher cognition from PET and FMRI studies. Hum Brain Mapp. 35:593–615. [DOI] [PMC free article] [PubMed] [Google Scholar]
- Ganesan D, Hayward RD, Thompson DN. 2009. Evolution of tonsillar ectopia associated with frontal encephalocoele. Childs Nerv Syst. 25:889–893. [DOI] [PubMed] [Google Scholar]
- Gautam P, Nunez SC, Narr KL, Mattson SN, May PA, Adnams CM, Riley EP, Jones KL, Kan EC, Sowell ER. 2015. Developmental trajectories for visuo-spatial attention are altered by prenatal alcohol exposure: a longitudinal fMRI study. Cereb Cortex. 25:4761–4771. [DOI] [PMC free article] [PubMed] [Google Scholar]
- Guell X, Schmahmann JD, Gabrieli J, Ghosh SS. 2018. Functional gradients of the cerebellum. Elife. 7:e36652. [DOI] [PMC free article] [PubMed] [Google Scholar]
- Gur RE, Kaltman D, Melhem ER, Ruparel K, Prabhakaran K, Riley M, Yodh E, Hakonarson H, Satterthwaite T, Gur RC. 2013. Incidental findings in youths volunteering for brain MRI research. AJNR Am J Neuroradiol. 34:2021–2025. [DOI] [PMC free article] [PubMed] [Google Scholar]
- Haldipur P, Aldinger KA, Bernardo S, Deng M, Timms AE, Overman LM, Winter C, Lisgo SN, Razavi F, Silvestri E et al. 2019. Spatiotemporal expansion of primary progenitor zones in the developing human cerebellum. Science. 366:454–460. [DOI] [PMC free article] [PubMed] [Google Scholar]
- Hendrickson TJ, Mueller BA, Sowell ER, Mattson SN, Coles CD, Kable JA, Jones KL, Boys CJ, Lee S, Lim KO et al. 2018. Two-year cortical trajectories are abnormal in children and adolescents with prenatal alcohol exposure. Dev Cogn Neurosci. 30:123–133. [DOI] [PMC free article] [PubMed] [Google Scholar]
- Hoche F, Guell X, Vangel MG, Sherman JC, Schmahmann JD. 2018. The cerebellar cognitive affective/Schmemann syndrome scale. Brain. 141:248–270. [DOI] [PMC free article] [PubMed] [Google Scholar]
- Hoyme HE, May PA, Kalberg WO, Kodituwakku P, Gossage JP, Trujillo PM, Buckley DG, Miller JH, Aragon AS, Khaole N et al. 2005. A practical clinical approach to diagnosis of fetal alcohol spectrum disorders: clarification of the 1996 institute of medicine criteria. Pediatrics. 115:39–47. [DOI] [PMC free article] [PubMed] [Google Scholar]
- Hoyme HE, Kalberg WO, Elliott AJ, Blankenship J, Buckley D, Marais AS, Manning MA, Robinson LK, Adam MP, Abdul-Rahman O et al. 2016. Updated clinical guidelines for diagnosing fetal alcohol spectrum disorders. Pediatrics. 138:e20154256. [DOI] [PMC free article] [PubMed] [Google Scholar]
- Inkelis SM, Moore EM, Bischoff-Grethe A, Riley RP. 2020. Neurodevelopment in adolescents and adults with fetal alcohol spectrum disorders (FASD): a magnetic resonance region of interest analysis. Brain Research. 1732:146654. [DOI] [PMC free article] [PubMed] [Google Scholar]
- Jacobson SW, Stanton ME, Molteno CD, Burden MJ, Fuller DS, Hoyme HE, Robinson LK, Khaole N, Jacobson JL. 2008. Impaired eyeblink conditioning in children with fetal alcohol syndrome. Alcohol Clin Exp Res. 32:365–372. [DOI] [PubMed] [Google Scholar]
- Jung KI, Park MH, Park B, Kim SY, Kim YO, Kim BN, Park S, Song CH. 2019. Cerebellar gray matter volume, executive function, and insomnia: gender differences in adolescents. Sci Rep. 9:855. [DOI] [PMC free article] [PubMed] [Google Scholar]
- Kaiser D, Leach J, Vannest J, Schapiro M, Holland S, MRIoNAC C. 2015. Unanticipated findings in pediatric neuroimaging research: prevalence of abnormalities and process for reporting and clinical follow-up. Brain Imaging Behav. 9:32–42. [DOI] [PubMed] [Google Scholar]
- Kelly RM, Strick PL. 2003. Cerebellar loops with motor cortex and prefrontal cortex of a nonhuman primate. J Neurosci. 23:8432–8444. [DOI] [PMC free article] [PubMed] [Google Scholar]
- Koning IV, Tielemans MJ, Hoebeek FE, Ecury-Goossen GM, Reiss IKM, Steegers-Theunissen RPM, Dudink J. 2017. Impacts on prenatal development of the human cerebellum: a systematic review. J Matern Fetal Neonatal Med. 30:2461–2468. [DOI] [PubMed] [Google Scholar]
- Krienen FM, Buckner RL. 2009. Segregated fronto-cerebellar circuits revealed by intrinsic functional connectivity. Cereb Cortex. 19:2485–2497. [DOI] [PMC free article] [PubMed] [Google Scholar]
- Lange S, Rehm J, Anagnostou E, Popova S. 2018. Prevalence of externalizing disorders and autism spectrum disorders among children with fetal alcohol spectrum disorder: systematic review and meta-analysis. Biochem Cell Biol. 96:241–251. [DOI] [PubMed] [Google Scholar]
- Lebel C, Mattson SN, Riley EP, Jones KL, Adnams CM, May PA, Bookheimer SY, O'Connor MJ, Narr KL, Kan E et al. 2012. A longitudinal study of the long-term consequences of drinking during pregnancy: heavy in utero alcohol exposure disrupts the normal processes of brain development. J Neurosci. 32:15243–15251. [DOI] [PMC free article] [PubMed] [Google Scholar]
- Lerman-Sagie T, Prayer D, Stocklein S, Malinger G. 2018. Fetal cerebellar disorders. Handb Clin Neurol. 155:3–23. [DOI] [PubMed] [Google Scholar]
- Limperopoulos C, Chilingaryan G, Sullivan N, Guizard N, Robertson RL, du Plessis AJ. 2014. Injury to the premature cerebellum: outcome is related to remote cortical development. Cereb Cortex. 24:728–736. [DOI] [PMC free article] [PubMed] [Google Scholar]
- Lipinski RJ, Hammond P, O'Leary-Moore SK, Ament JJ, Pecevich SJ, Jiang Y, Budin F, Parnell SE, Suttie M, Godin EA et al. 2012. Ethanol-induced face-brain dysmorphology patterns are correlative and exposure-stage dependent. PLoS One. 7:e43067. [DOI] [PMC free article] [PubMed] [Google Scholar]
- Manjon JV, Coupe P. 2016. Volbrain: an online MRI brain volumetry system. Front Neuroinform. 10:30. [DOI] [PMC free article] [PubMed] [Google Scholar]
- Mankiw C, Park MTM, Reardon PK, Fish AM, Clasen LS, Greenstein D, Giedd JN, Blumenthal JD, Lerch JP, Chakravarty MM et al. 2017. Allometric analysis detects brain size-independent effects of sex and sex chromosome complement on human cerebellar organization. J Neurosci. 37:5221–5231. [DOI] [PMC free article] [PubMed] [Google Scholar]
- Mattson SN, Riley EP, Gramling L, Delis DC, Jones KL. 1997. Heavy prenatal alcohol exposure with or without physical features of fetal alcohol syndrome leads to IQ deficits. J Pediatr. 131:718–721. [DOI] [PubMed] [Google Scholar]
- Mattson SN, Schoenfeld AM, Riley EP. 2001. Teratogenic effects of alcohol on brain and behavior. Alcohol Res Health. 25:185–191. [PMC free article] [PubMed] [Google Scholar]
- McGee CL, Riley EP. 2006. Brain imaging and fetal alcohol spectrum disorders. Ann Ist Super Sanita. 42:46–52. [PubMed] [Google Scholar]
- Meintjes EM, Narr KL, van der Kouwe AJ, Molteno CD, Pirnia T, Gutman B, Woods RP, Thompson PM, Jacobson JL, Jacobson SW. 2014. A tensor-based morphometry analysis of regional differences in brain volume in relation to prenatal alcohol exposure. Neuroimage Clin. 5:152–160. [DOI] [PMC free article] [PubMed] [Google Scholar]
- Moore DM, D'Mello AM, McGrath LM, Stoodley CJ. 2017. The developmental relationship between specific cognitive domains and grey matter in the cerebellum. Dev Cogn Neurosci. 24:1–11. [DOI] [PMC free article] [PubMed] [Google Scholar]
- Moore EM, Riley EP. 2015. What happens when children with fetal alcohol spectrum disorders become adults? Curr Dev Disord Rep. 2:219–227. [DOI] [PMC free article] [PubMed] [Google Scholar]
- Morris Z, Whiteley WN, Longstreth WT Jr, Weber F, Lee YC, Tsushima Y, Alphs H, Ladd SC, Warlow C, Wardlaw JM et al. 2009. Incidental findings on brain magnetic resonance imaging: systematic review and meta-analysis. BMJ. 339:b3016. [DOI] [PMC free article] [PubMed] [Google Scholar]
- Nguyen VT, Chong S, Tieng QM, Mardon K, Galloway GJ, Kurniawan ND. 2017. Radiological studies of fetal alcohol spectrum disorders in humans and animal models: an updated comprehensive review. Magn Reson Imaging. 43:10–26. [DOI] [PubMed] [Google Scholar]
- Norman AL, Crocker N, Mattson SN, Riley EP. 2009. Neuroimaging and fetal alcohol spectrum disorders. Dev Disabil Res Rev. 15:209–217. [DOI] [PMC free article] [PubMed] [Google Scholar]
- O'Hare ED, Kan E, Yoshii J, Mattson SN, Riley EP, Thompson PM, Toga AW, Sowell ER. 2005. Mapping cerebellar vermal morphology and cognitive correlates in prenatal alcohol exposure. Neuroreport. 16:1285–1290. [DOI] [PubMed] [Google Scholar]
- Peadon E, Elliott EJ. 2010. Distinguishing between attention-deficit hyperactivity and fetal alcohol spectrum disorders in children: clinical guidelines. Neuropsychiatr Dis Treat. 6:509–515. [DOI] [PMC free article] [PubMed] [Google Scholar]
- Pfefferbaum A, Rohlfing T, Pohl KM, Lane B, Chu W, Kwon D, Nolan Nichols B, Brown SA, Tapert SF, Cummins K et al. 2016. Adolescent development of cortical and white matter structure in the NCANDA sample: role of sex, ethnicity, puberty, and alcohol drinking. Cereb Cortex. 26:4101–4121. [DOI] [PMC free article] [PubMed] [Google Scholar]
- Roebuck TM, Mattson SN, Riley EP. 1998. A review of the neuroanatomical findings in children with fetal alcohol syndrome or prenatal exposure to alcohol. Alcohol Clin Exp Res. 22:339–344. [DOI] [PubMed] [Google Scholar]
- Rohlfing T, Zahr NM, Sullivan EV, Pfefferbaum A. 2010. The sri24 multi-channel atlas of normal adult human brain structure. Hum Brain Mapp. 31:798–819. [DOI] [PMC free article] [PubMed] [Google Scholar]
- Rohlfing T, Cummins K, Henthorn T, Chu W, Nichols BN. 2014. NCANDA data integration: anatomy of an asynchronous infrastructure for multi-site, multi-instrument longitudinal data capture. J Am Med Inform Assoc. 21:758–762. [DOI] [PMC free article] [PubMed] [Google Scholar]
- Roldan-Valadez E, Suarez-May MA, Favila R, Aguilar-Castaneda E, Rios C. 2015. Selected gray matter volumes and gender but not basal ganglia nor cerebellum gyri discriminate left versus right cerebral hemispheres: multivariate analyses in human brains at 3t. Anat Rec (Hoboken). 298:1336–1346. [DOI] [PubMed] [Google Scholar]
- Romero JE, Coupe P, Giraud R, Ta VT, Fonov V, Park MTM, Chakravarty MM, Voineskos AN, Manjon JV. 2017. Ceres: a new cerebellum lobule segmentation method. Neuroimage. 147:916–924. [DOI] [PubMed] [Google Scholar]
- Sandoval GM, Shim S, Hong DS, Garrett AS, Quintin EM, Marzelli MJ, Patnaik S, Lightbody AA, Reiss AL. 2018. Neuroanatomical abnormalities in fragile x syndrome during the adolescent and young adult years. J Psychiatr Res. 107:138–144. [DOI] [PMC free article] [PubMed] [Google Scholar]
- Sawant OB, Lunde ER, Washburn SE, Chen WJ, Goodlett CR, Cudd TA. 2013. Different patterns of regional Purkinje cell loss in the cerebellar vermis as a function of the timing of prenatal ethanol exposure in an ovine model. Neurotoxicol Teratol. 35:7–13. [DOI] [PMC free article] [PubMed] [Google Scholar]
- Sawyer KS, Oscar-Berman M, Mosher Ruiz S, Galvez DA, Makris N, Harris GJ, Valera EM. 2016. Associations between cerebellar subregional morphometry and alcoholism history in men and women. Alcohol Clin Exp Res. 40:1262–1272. [DOI] [PMC free article] [PubMed] [Google Scholar]
- Schmahmann JD. 2019. The cerebellum and cognition. Neurosci Lett. 688:62–75. [DOI] [PubMed] [Google Scholar]
- Sillitoe RV, Joyner AL. 2007. Morphology, molecular codes, and circuitry produce the three-dimensional complexity of the cerebellum. Annu Rev Cell Dev Biol. 23:549–577. [DOI] [PubMed] [Google Scholar]
- Sowell ER, Jernigan TL, Mattson SN, Riley EP, Sobel DF, Jones KL. 1996. Abnormal development of the cerebellar vermis in children prenatally exposed to alcohol: size reduction in lobules i-v. Alcohol Clin Exp Res. 20:31–34. [DOI] [PubMed] [Google Scholar]
- Steele CJ, Chakravarty MM. 2018. Gray-matter structural variability in the human cerebellum: lobule-specific differences across sex and hemisphere. Neuroimage. 170:164–173. [DOI] [PubMed] [Google Scholar]
- Stoodley CJ, Schmahmann JD. 2010. Evidence for topographic organization in the cerebellum of motor control versus cognitive and affective processing. Cortex. 46:831–844. [DOI] [PMC free article] [PubMed] [Google Scholar]
- Stoodley CJ, Valera EM, Schmahmann JD. 2012. Functional topography of the cerebellum for motor and cognitive tasks: an fMRI study. Neuroimage. 59:1560–1570. [DOI] [PMC free article] [PubMed] [Google Scholar]
- Stoodley CJ, MacMore JP, Makris N, Sherman JC, Schmahmann JD. 2016. Location of lesion determines motor vs. cognitive consequences in patients with cerebellar stroke. Neuroimage Clin. 12:765–775. [DOI] [PMC free article] [PubMed] [Google Scholar]
- Streissguth AP, Aase JM, Clarren SK, Randels SP, LaDue RA, Smith DF. 1991. Fetal alcohol syndrome in adolescents and adults. JAMA. 265:1961–1967. [PubMed] [Google Scholar]
- Sulik KK. 2005. Genesis of alcohol-induced craniofacial dysmorphism. Exp Biol Med (Maywood). 230:366–375. [DOI] [PubMed] [Google Scholar]
- Sullivan EV, Deshmukh A, Desmond JE, Lim KO, Pfefferbaum A. 2000. Cerebellar volume decline in normal aging, alcoholism, and Korsakoff's syndrome: relation to ataxia. Neuropsychology. 14:341–352. [DOI] [PubMed] [Google Scholar]
- Sullivan EV, Lane B, Kwon D, Meloy MJ, Tapert SF, Brown SA, Colrain IM, Baker FC, De Bellis MD, Clark DB et al. 2017. Structural brain anomalies in healthy adolescents in the NCANDA cohort: relation to neuropsychological test performance, sex, and ethnicity. Brain Imaging Behav. 11:1302–1315. [DOI] [PMC free article] [PubMed] [Google Scholar]
- Sullivan EV, Brumback T, Tapert SF, Brown SA, Baker FC, Colrain IM, Prouty D, De Bellis MD, Clark DB, Nagel BJ et al. 2019a. Disturbed cerebellar growth trajectories in adolescents who initiate alcohol drinking. Biol Psychiatry . Epub Sep 9. doi: 10.1016/j.biopsych.2019.08.026. [DOI] [PMC free article] [PubMed] [Google Scholar]
- Sullivan EV, Zahr NM, Saranathan M, Pohl KM, Pfefferbaum A. 2019b. Convergence of three parcellation approaches demonstrating cerebellar lobule volume deficits in alcohol use disorder. Neuroimage Clin. 24:101974. [DOI] [PMC free article] [PubMed] [Google Scholar]
- Swayze VW 2nd, Johnson VP, Hanson JW, Piven J, Sato Y, Giedd JN, Mosnik D, Andreasen NC. 1997. Magnetic resonance imaging of brain anomalies in fetal alcohol syndrome. Pediatrics. 99:232–240. [DOI] [PubMed] [Google Scholar]
- Tiemeier H, Lenroot RK, Greenstein DK, Tran L, Pierson R, Giedd JN. 2010. Cerebellum development during childhood and adolescence: a longitudinal morphometric MRI study. Neuroimage. 49:63–70. [DOI] [PMC free article] [PubMed] [Google Scholar]
- Wang JY, Hessl D, Hagerman RJ, Simon TJ, Tassone F, Ferrer E, Rivera SM. 2017. Abnormal trajectories in cerebellum and brainstem volumes in carriers of the fragile x premutation. Neurobiol Aging. 55:11–19. [DOI] [PMC free article] [PubMed] [Google Scholar]
- Wechsler D. 1981. Wechsler adult intelligence scale-revised. New York: Psychological Corporation. [Google Scholar]
- Weyrauch D, Schwartz M, Hart B, Klug MG, Burd L. 2017. Comorbid mental disorders in fetal alcohol spectrum disorders: a systematic review. J Dev Behav Pediatr. 38:283–291. [DOI] [PubMed] [Google Scholar]
- Wierenga L, Langen M, Ambrosino S, van Dijk S, Oranje B, Durston S. 2014. Typical development of basal ganglia, hippocampus, amygdala and cerebellum from age 7 to 24. Neuroimage. 96:67–72. [DOI] [PubMed] [Google Scholar]
- Wozniak JR, Riley EP, Charness ME. 2019. Clinical presentation, diagnosis, and management of fetal alcohol spectrum disorder. Lancet Neurol. 18:760–770. [DOI] [PMC free article] [PubMed] [Google Scholar]
- Yang Z, Ye C, Bogovic JA, Carass A, Jedynak BM, Ying SH, Prince JL. 2016. Automated cerebellar lobule segmentation with application to cerebellar structural analysis in cerebellar disease. Neuroimage. 127:435–444. [DOI] [PMC free article] [PubMed] [Google Scholar]
- Zhou D, Rasmussen C, Pei J, Andrew G, Reynolds JN, Beaulieu C. 2018. Preserved cortical asymmetry despite thinner cortex in children and adolescents with prenatal alcohol exposure and associated conditions. Hum Brain Mapp. 39:72–88. [DOI] [PMC free article] [PubMed] [Google Scholar]
Associated Data
This section collects any data citations, data availability statements, or supplementary materials included in this article.


