

Abstract
Habitat loss is widely regarded as one of the most destructive factors threatening native biodiversity. Because migratory waterbirds include some of the most globally endangered species, information on their sensitivity to landscape would benefit their conservation. While citizen science data on waterbird species occurrence are subjected to various biases, their appropriate interpretation can provide information of benefit to species conservation. We apply a bootstrapping procedure to citizen science data to reduce sampling biases and report the relative sensitivity of waterbird species to natural versus human‐dominated landscapes. Analyses are performed on 30,491 data records for 69 waterbird species referred to five functional groups observed in China between 2000 and 2018. Of these taxa, 30 species (43.5%) are significantly associated with natural landscapes, more so for cranes, geese, and ducks than for shorebirds and herons. The relationship between land association and the threat status of waterbirds is significant when the range size of species is considered as the mediator, and the higher the land association, the higher the threat status. Sensitive species significantly associated with natural landscapes are eight times more likely to be classified as National Protected Species (NPS) Classes I or II than less sensitive species significantly associated with human‐dominated landscapes. We demonstrate the potential for citizen science data to assist in conservation planning in the context of landscape changes. Our methods might assist others to obtain information to help relieve species decline and extinction.
Keywords: China, functional group, human‐dominated landscapes, natural landscapes, sensitivity, waterbirds
We apply a bootstrapping procedure to citizen science data to reduce sampling bias and report on the relative sensitivity of waterbirds species to natural versus human‐dominated landscapes in China.

1. INTRODUCTION
Global biodiversity loss is of worldwide scientific concern (Johnson et al., 2017). Land cover changes caused by human activities represent one of the greatest threats to biodiversity (Pimm et al., 2014). In extreme cases, habitat loss may cause species extinction (Brooks et al., 2010; Lehosmaa et al., 2017). However, habitat loss affects species differently (Lei et al., 2019; Naujokaitis‐Lewis, Curtis, Arcese, & Rosenfeld, 2010), with some species more sensitive to landscapes than others, due to ecological, physiological, or behavioral traits (Callaghan et al., 2019). Populations of more sensitive species are often at higher risk of decline as a consequence of human activities (Todd, Rose, Price, & Dorcas, 2016).
Waterbirds are a significant component of global biodiversity. The East Asian–Australasian Flyway (EAAF) provides habitat to over 50 million migratory waterbirds (EAAF, 2017). China's wetlands are key habitats in this EAAF, yet populations of some species dependent on this region have declined sharply, due to accelerated, recent losses in natural habitats (Si et al., 2018; Studds et al., 2017; Yang, Ma, Thompson, & Flower, 2017), although other factors may also have contributed.
An understanding of the sensitivities of waterbird taxa to landscapes would prove valuable for conservation. Such information could be used to prioritize taxa that are particularly at risk for conservation and to enact taxon‐specific conservation efforts. Unfortunately, detailed information on the vulnerability or sensitivity of waterbird taxa to disturbance is hampered by data deficiency, especially the lack of any large spatial scale long‐term systematic surveys (Johnson & Gillingham, 2008; Todd, Nowakowski, Rose, & Price, 2017). This is where citizen science data might fill the gaps.
Citizen science data are routinely collected over large spatial and temporal scales and have been widely used to inform biodiversity protection (Crall et al., 2011; Soroye, Ahmed, & Kerr, 2018; Xu et al., 2019). Such data can include the likes of, but not be limited to, species records (names), location data (longitude, latitude, and place name), abundance records, behavioral notes, and survey dates. Using these data directly presents challenges for analysis (Devictor, Whittaker, & Beltrame, 2010; Dickinson, Zuckerberg, & Bonter, 2010), particularly because nonsystematic survey methods are often used. Solutions to this problem would enable improved use of these data in conservation and biodiversity assessments (Broms, Johnson, Altwegg, & Conquest, 2014; Higa et al., 2015).
Randomization procedures, which generate comparisons of species occurrence with subsamples of all occurrences in their functional groups, represent one of a number of nonparametric statistical techniques commonly known as resampling methods. Randomization has been used frequently to address the problem of sampling bias in citizen science data, improving the accuracy of interpretations based on such data (Chernick & LaBudde, 2011; Weisshaupt & Rodríguez‐Pérez, 2017).
In the study, we aim to investigate the relative sensitivity of waterbird taxa to landscapes, using citizen science data. We hypothesize that sensitive species that are threatened with extinction will have distributions primarily associated with natural habitats. In contrast, species with distributions primarily associated with human‐dominated areas (or those with no significant land association), that are presumably less sensitive to human activities, will be less likely to be threatened. We focus on 69 waterbird species, of which 14 are considered threatened. We grouped these 69 species to one of five functional groups based on their feeding habits (Cumming, Paxton, King, & Beuster, 2012; Del Hoyo, Elliot, & Christie, 1992). The extent to which each species within a functional group is associated with a habitat type is described based on whether a taxon is: significantly associated with natural landscape, significantly associated with human‐dominated landscape, or whether it shows no significant association with any land‐type use. We evaluate the relationship between land association and threat status of species and also test whether more species that are significantly associated with natural landscapes can be protected by legislation of wildlife conservation.
2. METHODS
2.1. Citizen science data
Waterbird occurrence records in China between 2000 and 2018 were sourced from eBird (https://ebird.org/home), the Global Biodiversity Information Network (GBIF) (http://www.gbifchina.org/), and BirdReport (http://www.birdreport.cn/). Downloaded records include species names, longitudes, latitudes, place names, and survey dates. These online data records have been typically checked and filtered by ornithological enthusiasts and website administrators, so errors, such as mistakes in identification, are uncommon (Chandler et al., 2017; Li, Liang, Gong, Liu, & Liang, 2013; Sullivan et al., 2014). Observations prior to time of 2000 are excluded, as our land use and land cover data (2.2.1) do not cover this period.
To address spatial and temporal biases, raw data were vetted before use. We first manually verified coordinates that deviated significantly from an actual place name using Google Maps 6.5 (https://www.google.com/maps), using the center of the place name as the site coordinate. To assess accuracy, we randomly selected and input 30% of our sites into Google Earth 6.0 for visual verification and determined site accuracy to exceed 90%. Bootstrapping can reduce biases introduced by more data being recorded from popular locations or from people being more likely to report observations of one species than another. We also checked for temporal bias. It was unusual to find a high number of occurrences of a species within a certain time period. We removed duplicate records from sites with the same longitude and latitude from our dataset. Finally, we excluded any species with fewer than 20 observations.
Our cleansed dataset contained 30,491 records for 69 species, comprising: (a) 28 shorebirds (invertebrate eaters, mainly inhabiting muddy areas and shallow water); (b) 4 cranes (tuber eaters, mainly inhabiting shallow water and wet mudflats); (c) 5 geese (short grass foragers, mainly inhabiting wet meadows); (d) 23 ducks (seed and aquatic vegetation eaters, mainly inhabiting shallow water); and (e) 9 herons (fish eaters) (Kear, 2005; Ma, Cai, Li, & Chen, 2010; Wang et al., 2013). Three of 69 species were classified as critically endangered (CR), five as endangered (EN), six as vulnerable (VU), nine as near threatened (NT), and 46 as of least concern (LC) (IUCN, 2019) (Appendix S1).
2.2. Statistical analysis
2.2.1. Natural landscape metric
We use the 2000 National Terrestrial Ecosystem Spatial Distribution Data set to create a natural landscape (NL) metric, which indicates the degree of landscape naturalness. This dataset was mainly obtained by visual interpretation of 873 scenes (resolution 30 m × 30 m) from Landsat Thematic Mapper/Enhanced Thematic Mapper. Land types can be divided into six first‐level classes according to the utilization property of land resources and 24 s‐level classes according to the natural property of land resources, http://www.resdc.cn/Default.aspx.
First, for each 30 m × 30 m cell, we classified “natural landscapes,” represented by forest, grassland, wetland, lake, and canals and gave it a raster value of 1; seminatural landscapes, represented by farmland, saltpans, and that used for aquaculture, were given a raster value of 0.5; human‐dominated landscapes, represented by urban areas or built‐up land and roads, were given a raster value of 0.
Second, we defined corresponding Ij as the proportion of natural land cover at each raster cell location and using an inverse distance‐weighted nearest‐neighbor approach by Equation (1). The proportion of natural land cover at a raster cell location can be regarded as the probability that it is natural.
| (1) |
The Ij represents the proportion of natural land cover at a raster location; the Pc and Pi are the cell values in the center and neighboring cells, respectively, at raster scale j. For this study, j = 1 is set to 0.27 km, so the central cell is surrounded by 81 neighborhood cells (n = 81). The other six scales are 0.76 km, 2.43 km, 7.19 km, 21.86 km, 64.70 km, and 197.41 km (Riitters et al., 2002) (Figure 1). The operation will stop when the distance from the cell at the center to the edge of the largest raster scale reaches 109 km (the alphabet “m” in the Figure 1) (Theobald, 2010).
FIGURE 1.
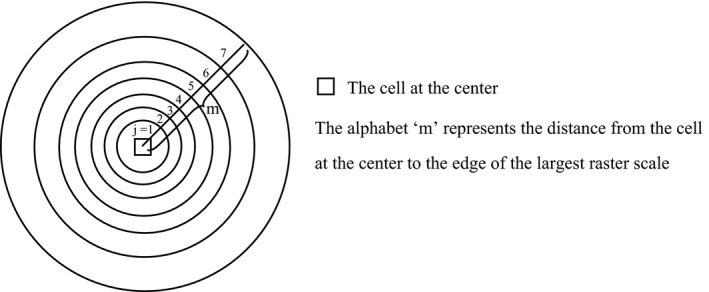
Calculating natural landscape values by calculating the proportion of natural cover at seven raster scales using neighborhoods of 0.27 km (j = 1), 0.76 km (j = 2), 2.43 km (j = 3), 7.19 km (j = 4), 21.86 km (j = 5), 64.70 km (j = 6), and 197.41 km (j = 7)
Finally, we used the average Ij of seven scales as the natural landscape value (Equation 2). Using this classification scheme, at each raster scale, if a cell at the center is composed entirely of natural landscape, with all adjacent cells also natural landscape, it receives an NL value of 1; if a cell at the center is composed entirely of human‐dominated landscape, with all adjacent cells also human‐dominated landscape, it receives an NL value of 0.
| (2) |
NL represents the natural landscape value, and the k is the number of raster scale, k = 7.
2.2.2. Bootstrapping procedure
A bootstrapping approach was used to minimize sample bias and clarify the relative sensitivity of waterbirds to natural versus human‐dominated landscapes (Phillips et al., 2009). This method reduces possible sampling bias by comparing the mean NL value of targeted species' occurrence records with the 1,000 averages of randomly selected 1,000 background samples in the buffer area of targeted species. For example, if occurrence data for a species are extracted only from easily surveyed regions, then background data should be extracted from these same regions also (Todd et al., 2016, 2017).
We assumed that species within each functional group would be more likely found with similar search effort and have a similar likelihood of being reported. Using the occurrence records of species in the same functional group as background data can decrease sample bias. For targeted species, we first extracted the NL value for each occurrence of it according to the real distribution in each cell. Then, for background data, we considered all occurrence records of the target species as the centers of the circles and selected the 20 km (a distance that covers most occurrence records of species in the same functional group, according to the real distributions of species studied) as the radius of each circle to create buffers. We then extracted all NL values for unduplicated occurrences (i.e., occurrences at different longitudes and latitudes) of all species in the same functional group within the buffers as the background data for the targeted species. We randomly selected 1,000 samples of these NL values: The number of unduplicated occurrences of each sample was the same as the number of occurrences of targeted species.
We calculated the mean NL value of each sample and acquired 1,000 averages and then ordered them from lowest to highest. We then compared the real mean NL value of targeted species with the 0.025 and 0.975 quantiles of the 1,000 averages and assigned species found in the lower or upper 2.5% of the distribution as significantly associated with natural or with human‐dominated landscapes, respectively. Otherwise, there was no significant association with landscape type. For example, for 1,603 unduplicated occurrences of the heron Ardea alba (Figure 2, left image), we first calculated the mean NL value based on the 1,603 occurrence records of targeted species. Then, we considered 1,603 occurrence records of A. alba as the centers of the circles and selected the 20 km as the radius of each circle to create buffers. Finally extracted the NL value of all unduplicated occurrences of all species of herons located within buffers (Figure 2, right image), of which there were 3,530 records. We randomly selected 1,603 occurrence records from 3,530 occurrence records and repeated this 1,000 times. For each time, we calculated the mean NL of 1,603 occurrence records, and acquired 1,000 averages and then ordered the 1,000 averages from lowest to highest. Finally, we compared the mean NL value for A. alba with the 975th or 25th of the 1,000 averages, according to the bootstrapping procedure.
FIGURE 2.
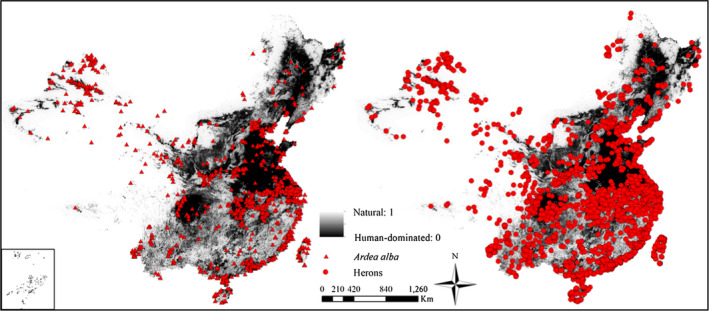
Natural landscape metric layer for China. Occurrences of only Ardea alba (left); all heron occurrences (right)
A standardized effect size (SES) was calculated as a measure of the extent to which the actual mean NL value of a target species was above or below the mean NL value of the 1,000 averages, based on the bootstrapping iteration (Cooke, Bates, & Eigenbrod, 2019). A higher SES indicates a higher association with natural landscapes. The specific function is:
| (3) |
where represents the actual mean NL of a target species, and and represent the mean NL value and standard deviation of the 1,000 averages, respectively.
We performed bootstrapping procedures at the functional group level in a manner similar to that we performed at the species level. For example, we used all occurrences of four species of cranes to calculate a mean NL for the presence of this functional group. Then, considered all occurrence records of four species of cranes as the centers of the circles and selected the 20 km as the radius of each circle to create buffers. Finally extracted the NL value of all unduplicated occurrences of all species of five functional groups located within buffers and repeated this 1,000 times. For each time, the number of selected occurrences was the same as the number of occurrences of four species of cranes. We then calculated the SES for crane species. These steps were followed to calculate the SES for other groups also. NL values were calculated in ArcGIS 10.5, and the bootstrapping procedure in Matlab 2016a.
2.2.3. Relationship between standardized effect size (SES) and threat status
SES was used to represent relative habitat association. The IUCN threat status categories CR, EN, and VU were considered threatened (threat) and those ranked NT and LC as unthreatened (nonthreat) species (Hu et al., 2017). We considered range size (RS) of each waterbird species as mediator because it accurately predicts threat status (TS) of waterbirds (IUCN, 2016; Ramesh, Gopalakrishnac, Barved, & Melnick, 2017), and we expect to know how SES is related to TS once RS is accounted for. Range sizes were based on the distribution range of species in China as defined by BirdLife International (http://datahzone.birdlife.org/home). Also, species are not phylogenetically independent, and threat status or SES may vary across the different functional groups we analyze, which could generate spurious associations (or lack of association) between SES and TS. We consider functional group (FG) to be a random effect in analysis.
We first test whether the relationship between SES and RS is significant and then determine whether RS can accurately predict TS. We consider that SES can predict threat status if SES can accurately predict RS, and RS can accurately predict TS. Specific analytical steps are as follows:
-
1
We first used an ordinary least squares (OLS) in Stata 15 to test whether SES can accurately predict RS. We considered FG to be a random variable (Equation 4)
| (4) |
α is a constant term, β 1 is a regression coefficient of SES, and ε is a stochastic error term.
-
2
We then use a generalized linear model (GLM) in Stata 15 to test whether RS can accurately predict TS. We consider FG to be a random variable (Equation 5). The threat status of a threatened species was assigned a value of 1 and an unthreatened species a value of 0.
| (5) |
α is a constant term, β 1 is a regression coefficient of RS, and ε is a stochastic error term.
-
3
We used the Sobel–Goodman mediation tests (Sobel) in Stata 15 to check whether the mediating effect of RS is significant for influencing the relationship between SES and TS.
2.2.4. Analysis of protection status
All species were divided into one of two categories: (a) those significantly associated with natural landscapes and (b), those significantly associated with human‐dominated landscapes or without any significant land association. We then assigned the protection status of each species in five functional groups following the National Protected Species (NPS) list of Key Protected Wildlife, of the Wildlife Protection Law of China (Ministry of Forestry in the People's Republic of China, 1988), including NPS Classes I and II (a checklist is presented in Appendix S2); species in NPS Class I or II were assigned as protected and others as not protected (Hu et al., 2017). Finally, we used a Mann–Whitney U test in SPSS 22.0 to compare for differences in mean number of species protected in five functional groups of two categories.
3. RESULTS
3.1. Bootstrapping procedure
Of the 69 waterbird species analyzed, 30 (43.5%) were significantly associated with natural landscapes, including 11 shorebird species, 2 crane species, 2 geese species, 11 duck species, and 4 heron species. A further 9 (13.0%) species were significantly associated with human‐dominated landscapes, including 6 shorebird species and 3 duck species. The remaining 30 (43.5%) species were not significantly associated with landscape types, comprising 11 shorebird species, 2 crane species, 3 geese species, 9 duck species, and 5 heron species (Figure 3, Appendix S2). SES values for the functional groups of geese (7.20), cranes (5.32), and ducks (4.12) were higher than those of shorebirds (1.99) and herons (0.18), indicating that geese and cranes are more dependent on natural landscapes than are other functional groups.
FIGURE 3.
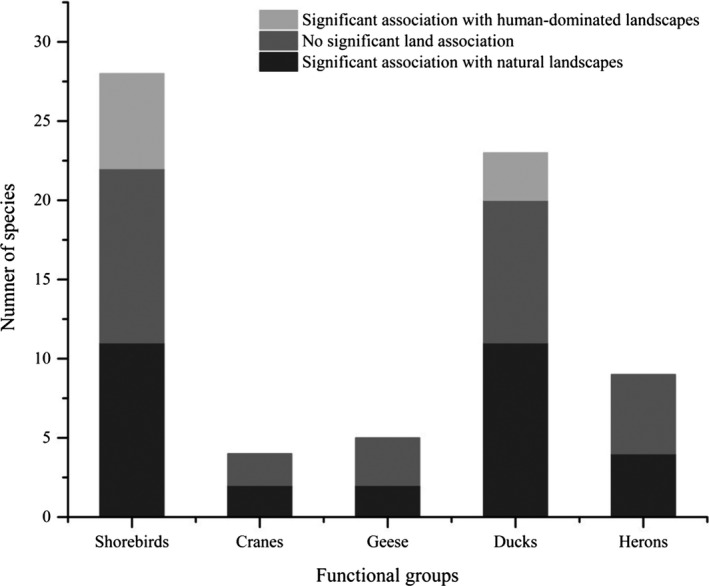
Numbers of species in different functional groups significantly associated with human‐dominated landscapes, no significant land association, or significantly associated with natural landscapes
3.2. Relationship between standardized effect size (SES) and threat status
Results for OLS revealed the relationship between SES and range size (RS) to be significant (N = 69, β 1 = −318.05, t = −3.28, p = .002); the higher SES, the lower the RS. GLM results indicated the relationship between RS and threat status to be significant (N = 61, β 1 = −1.66, t = 3.19, p = .001); the lower the RS, the higher the threat status. Sobel results indicate RS significantly mediates the relationship between SES and threat status (Z = 2.498, p = .012). We conclude that the relationship between SES and threat status was significant when the factor “range size” is considered as the mediator, and that the higher the SES, the higher the threat status.
3.3. Analysis of protection status
Of species significantly associated with natural landscapes, 26.7% were afforded NPS protection, compared to only 3.33% of species that were significantly associated with human‐dominated landscapes or were not significantly associated with any particular land type. The difference between the two categories was significant (Z = −1.972, p = .049) (Figure 4; Appendix S2).
FIGURE 4.

Mean number of species protected between five functional groups in categories significantly associated with natural landscapes and significantly associated with human‐dominated landscapes or lacking significant land association. Letters (a, b) above standard error bars indicate a significant difference between categories
4. DISCUSSION
Identifying the sensitivity of waterbirds to landscape in China can reduce unnecessary effort to protect species that are more dependent on human‐dominated landscapes. Of our 69 species, 43.5% were significantly associated with natural landscapes. The higher the association was with natural landscapes, the higher the threat status of a species when considering range size as the mediator. This implies that loss of associated habitat will increase risks for these species, compared to others (Dolman & Sutherland, 2010; Galbraith et al., 2002). Many of these species (Numenius madagascariensis, Charadrius mongolus, Xenus cinereus, Grus vipio) are highly dependent on natural landscapes, which have declined dramatically in China since 1960 (Barter, 2002; Burger, Niles, & Clark, 1997; Chen, Yang, & Lu, 2015; Li et al., 2019). The populations of these species have all declined in recent years, due largely to habitat loss (Studds et al., 2017; Wang, Fraser, & Chen, 2017).
Associations with natural landscapes were higher for cranes, geese, and ducks than for shorebirds and herons. To some extent, this suggested that shorebirds and herons were less sensitive of natural habitat loss than other functional groups. In recent decades, the conversion of tidal flats in China has forced the majority of shorebirds to use alternative habitats (Basso, Fonseca, Drever, & Navedo, 2017; Jackson et al., 2019). A growing number of studies have also demonstrated shorebirds now exploit artificial fish ponds and saltpans for stopovers during their migration (Jackson et al., 2019; Sripanomyom, Round, Savini, Trisurat, & Gale, 2011; Yasué & Dearden, 2009). Some large shorebird species even prefer to feed in artificial habitats (Lei et al., 2018; Yasué & Dearden, 2009).
Species significantly associated with natural landscapes were eight times more likely to be legally protected or regarded as of conservation concern by wildlife protection law than species significantly associated with human‐dominated landscapes or species with no significant land association. However, 73.3% of species significantly associated with natural landscapes were not listed in existing wildlife protection law, such as the globally threatened Calidris pygmaea and N. madagascariensis. We suggested that governmental conservation agencies should pay more attention to the species associated with natural landscapes, to prevent further decline in their populations and habitats.
The method of bootstrapping procedures only reveals the relative sensitivity of species to landscape. This does not mean that the less sensitive species are absolutely insensitive to landscapes changes, but that some are more likely to occur in human‐dominated environments than ecologically similar species. For example, the ducks Melanitta fusca, Mergellus albellus, and Anas poecilorhyncha were significantly associated with human‐dominated landscapes, while Mergus squamatus and Aythya ferina were significantly associated with natural landscapes. Even though the first three of these species are often found in artificial lakes and reservoirs (Kloskowski, Green, Polak, Bustamante, & Krogulec, 2010), this did not mean them insensitive to natural landscapes loss, but it does imply that the latter two species are more sensitive to natural habitat loss. In addition, bootstrapping procedures can only conduct this analysis within group of similar habit due to our assumption was that species within in a group of similar habits would have a similar likelihood of being reported.
5. CONCLUSIONS
Among 69 waterbird species studied in China, 30 sensitive species were significantly associated with natural landscapes, and associations with natural landscapes were higher for cranes, geese, and ducks than for shorebirds and herons. The higher the association was with natural landscapes, the higher the threat status of a species when considering range size as the mediator. Sensitive species significantly associated with natural landscapes can acquire more protection than less sensitive species significantly associated with human‐dominated landscapes. We suggest taxonomic targets for conservation, particularly species that are more dependent on natural landscapes than others. We also suggest that more citizen science data need to be collected with improvement of standardization and protocol, so as to benefit to conservation and management of waterbirds and their habitats with higher scientific value of these data.
CONFLICT OF INTEREST
None declared.
AUTHOR CONTRIBUTIONS
Houlang Duan: Data curation (lead); Formal analysis (lead); Investigation (lead); Methodology (lead); Software (lead); Supervision (lead); Writing‐original draft (lead); Writing‐review & editing (lead). Shaoxia Xia: Writing‐review & editing (supporting). Xiubo Yu: Conceptualization (lead); Supervision (lead); Writing‐review & editing (supporting). Yu Liu: Supervision (supporting). Jiakun Teng: Software (supporting). Yuehan Dou: Writing‐review & editing (supporting).
Supporting information
Appendix S1‐S2
ACKNOWLEDGMENTS
This research was jointly supported by the Earth Big Data Scientific Engineering project of the Chinese Academy of Sciences (Grant No. XDA19020305), National Natural Science Foundation of China (Grant No. 41701212), and Developing China's Coastal WaterBirds and Habitats Database Project, launched by The Paulson Institute and funded by the Lao Niu Foundation. We thank the eBird (https://ebird.org/home), the Global Biodiversity Information Network (GBIF) (http://www.gbifchina.org/), and Bird Watching Network website (http://www.birdreport.cn/) for providing data collection support.
Duan H, Xia S, Yu X, Liu Y, Teng J, Dou Y. Using citizen science data to inform the relative sensitivity of waterbirds to natural versus human‐dominated landscapes in China. Ecol Evol. 2020;10:7233–7241. 10.1002/ece3.6449
DATA AVAILABILITY STATEMENT
The records of species supporting this study can be acquired in the websites of eBird in the USA (https://ebird.org/home), the Global Biodiversity Information Network (GBIF) (http://www.gbifchina.org/), and from BirdReport in China (http://www.birdreport.cn/). The land use and land cover data are available from the Data Center for Resources and Environmental Sciences at the Chinese Academy of Sciences (RESDC) (http://www.resdc.cn).
REFERENCES
- Barter, M. A. (2002). Shorebirds of the Yellow sea: Importance, threats and conservation status. Wetlands International‐Oceana. [Google Scholar]
- Basso, E. , Fonseca, J. , Drever, M. C. , & Navedo, J. G. (2017). Effects of intertidal habitat availability on the use of anthropogenic habitats as foraging grounds by shorebirds: A case study on semi‐intensive shrimp farms. Hydrobiologia, 809, 19–29. 10.1007/s10750-017-3394-x [DOI] [Google Scholar]
- Broms, K. M. , Johnson, D. S. , Altwegg, R. , & Conquest, L. L. (2014). Spatial occupancy models applied to atlas data show Southern Ground Hornbills strongly depend on protected areas. Ecological Applications, 24, 363–374. 10.1890/12-2151.1 [DOI] [PubMed] [Google Scholar]
- Brooks, T. M. , Mittermeier, R. A. , Mittermeier, C. G. , da Fonseca, G. A. B. , Rylands, A. B. , Konstant, W. R. , … Hilton‐Taylor, C. (2010). Habitat loss and extinction in the hotspots of biodiversity. Conservation Biology, 16, 909–923. 10.1046/j.1523-1739.2002.00530.x [DOI] [Google Scholar]
- Burger, J. , Niles, L. , & Clark, K. E. (1997). Importance of beach, mudflat and marsh habitats to migrant shorebirds on Delaware Bay. Biological Conservation, 79, 283–292. 10.1016/S0006-3207(96)00077-8 [DOI] [Google Scholar]
- Callaghan, C. T. , Major, R. E. , Wilshire, J. H. , Kingsford, J. M. , Cornwell, R. T. , & William, K. (2019). Generalists are the most urban‐tolerant of birds: A phylogenetically controlled analysis of ecological and life history traits using a novel continuous measure of bird responses to urbanization. Oikos, 128, 845–858. 10.1111/oik.06158 [DOI] [Google Scholar]
- Chandler, M. , See, L. , Copas, K. , Bonde, A. M. Z. , López, B. C. , Danielsen, F. , … Turak, E. (2017). Contribution of citizen science towards international biodiversity monitoring. Biological Conservation, 213, 280–294. 10.1016/j.biocon.2016.09.004 [DOI] [Google Scholar]
- Chen, K. L. , Yang, X. Z. , & Lu, Y. (2015). Vital stopover of shorebirds migration on the East Asian‐Australasian flyway: Wetlands of yellow sea and Bohai Sea. Wetland Science, 13, 1–6. [Google Scholar]
- Chernick, M. R. , & LaBudde, R. A. (2011). An introduction to bootstrap methods with applications to R. Hoboken, NJ: John Wiley & Sons Inc. [Google Scholar]
- Cooke, R. S. C. , Bates, A. E. , & Eigenbrod, F. (2019). Global trade‐offs of functional redundancy and functional dispersion for birds and mammals. Global Ecology and Biogeography, 28, 484–495. 10.1111/geb.12869 [DOI] [Google Scholar]
- Crall, A. W. , Newman, G. J. , Stohlgren, T. J. , Holfelder, K. A. , Graham, J. , & Waller, D. M. (2011). Assessing community science data quality: An invasive species case study. Conservation Letters, 4, 433–442. [Google Scholar]
- Cumming, G. S. , Paxton, M. , King, J. , & Beuster, H. (2012). Foraging group membership explains variation in waterbird responses to the hydrological regime of an arid‐region flood‐pulse river in Namibia. Freshwater Biology, 57, 1202–1213. [Google Scholar]
- Del Hoyo, J. , Elliot, A. , & Christie, D. (1992). Handbook of the birds of the world. Barcelona, Spain: Lynx Editions. [Google Scholar]
- Devictor, V. , Whittaker, R. J. , & Beltrame, C. (2010). Beyond scarcity: Citizen science programmes as useful tools for conservation biogeography. Diversity and Distributions, 16, 354–362. 10.1111/j.1472-4642.2009.00615.x [DOI] [Google Scholar]
- Dickinson, J. L. , Zuckerberg, B. , & Bonter, D. N. (2010). Citizen science as an ecological research tool: Challenges and benefits. Annual Review of Ecology & Systematics, 41, 149–172. 10.1146/annurev-ecolsys-102209-144636 [DOI] [Google Scholar]
- Dolman, P. M. , & Sutherland, W. J. (2010). The response of bird populations to habitat loss. Ibis, 137, S38–S46. [Google Scholar]
- East Asian‐Australasian Flyway Partnership (EAAFP) (2017). Retrieved from https://eaaflyway.net
- Galbraith, H. , Jones, R. , Park, R. , Clough, J. , Herrod‐Julius, S. , Harrington, B. , … Page, G. (2002). Global climate change and sea level rise: Potential losses of intertidal habitat for shorebirds. Waterbirds the International Journal of Waterbird Biology, 25, 173–183. 10.1675/1524-4695(2002)025[0173:GCCASL]2.0.CO;2 [DOI] [Google Scholar]
- Higa, M. , Yamaura, Y. , Koizumi, I. , Yabuhara, Y. , Senzaki, M. , & Ono, S. (2015). Mapping large‐scale bird distributions using occupancy models and citizen data with spatially biased sampling effort. Diversity and Distributions, 21, 46–54. [Google Scholar]
- Hu, R. , Wen, C. , Gu, Y. , Wang, H. , Gu, L. , Shi, X. , … Lu, Z. (2017). A bird's view of new conservation hotspots in China. Biological Conservation, 211, 47–55. 10.1016/j.biocon.2017.03.033 [DOI] [Google Scholar]
- IUCN (2019). The IUCN red list of threatened species. Version 2019‐1. Retrieved from https://www.iucnredlist.org [Google Scholar]
- IUCN Standards, Petitions Subcommittee (2016). Guidelines for using the IUCN Red List categories and criteria. Version 12. Prepared by the Standards and Petitions Subcommittee. Downloadable from http://www.iucnredlist.org/documents/RedListGuidelines.pdf [Google Scholar]
- Jackson, M. V. , Carrasco, L. R. , Choi, C.‐Y. , Li, J. , Ma, Z. , Melville, D. S. , … Fuller, R. A. (2019). Multiple habitat use by declining migratory birds necessitates joined‐up conservation. Ecology and Evolution, 9, 2505–2515. 10.1002/ece3.4895 [DOI] [PMC free article] [PubMed] [Google Scholar]
- Johnson, C. N. , Balmford, A. , Brook, B. W. , Buettel, J. C. , Galetti, M. , Lei, G. C. , & Wilmshurst, J. M. (2017). Biodiversity losses and conservation responses in the Anthropocene. Science, 356, 270–275. 10.1126/science.aam9317 [DOI] [PubMed] [Google Scholar]
- Johnson, C. J. , & Gillingham, M. P. (2008). Sensitivity of species‐distribution models to error, bias, and model design: An application to resource selection functions for woodland caribou. Ecological Modeling, 213, 143–155. 10.1016/j.ecolmodel.2007.11.013 [DOI] [Google Scholar]
- Kear, J. (2005). Ducks, geese and swans: Species accounts (Cairina to Mergus). Oxford, UK: Oxford University Press. [Google Scholar]
- Kloskowski, J. , Green, A. J. , Polak, M. , Bustamante, J. , & Krogulec, J. (2010). Complementary use of natural and artificial wetlands by waterbirds wintering in doñana, south‐west Spain. Aquatic Conservation Marine & Freshwater Ecosystems, 19, 815–826. [Google Scholar]
- Lehosmaa, K. , Jyväsjärvi, J. , Virtanen, R. , Ilmonen, J. , Saastamoinen, J. , & Muotka, T. (2017). Anthropogenic habitat disturbance induces a major biodiversity change in habitat specialist bryophytes of boreal springs. Biological Conservation, 215, 169–178. 10.1016/j.biocon.2017.09.010 [DOI] [Google Scholar]
- Lei, J. , Jia, Y. , Wang, Y. , Lei, G. , Lu, C. , Saintilan, N. , & Wen, L. I. (2019). Behavioural plasticity and trophic niche shift: How wintering geese respond to habitat alteration. Freshwater Biology, 64, 1183–1195. 10.1111/fwb.13294 [DOI] [Google Scholar]
- Lei, W. P. , Masero, J. A. , Piersma, T. , Zhu, B. R. , Yang, H. Y. , & Zhang, Z. W. (2018). Alternative habitat: The importance of the Nanpu Saltpans for migratory waterbirds in the Chinese Yellow Sea. Bird Conservation International, 28, 549–566. 10.1017/S0959270917000508 [DOI] [Google Scholar]
- Li, N. , Wang, Z. , Xia, L. U. , Yan, F. , Xu, L.‐Q. , Qiao, Y.‐J. , … Fang, S.‐B. (2019). Effects of long‐term coastal reclamation on suitable habitat and wintering population size of the endangered Red‐crowned Crane, Grus japonensis . Hydrobiologia, 827, 21–29. 10.1007/s10750-017-3341-x [DOI] [Google Scholar]
- Li, X. Y. , Liang, L. , Gong, P. , Liu, Y. , & Liang, F. F. (2013). Bird watching in China reveals bird distribution changes. Chinese Science Bulletin, 58, 649–656. 10.1007/s11434-012-5458-7 [DOI] [Google Scholar]
- Ma, Z. J. , Cai, Y. T. , Li, B. , & Chen, J. K. (2010). Managing wetland habitats for waterbirds: An international perspective. Wetlands, 30, 15–27. 10.1007/s13157-009-0001-6 [DOI] [Google Scholar]
- Ministry of Forestry in the People's Repubic of China and Ministry of Agriculture of the People's Republic of China , 1988. The Checklist of National Protected Animal of China. (in Chinese).
- Naujokaitis‐Lewis, I. R. , Curtis, J. M. , Arcese, P. , & Rosenfeld, J. (2010). Sensitivity analyses of spatial population viability analysis models for species at risk and habitat conservation planning. Conservation Biology, 23, 225–229. 10.1111/j.1523-1739.2008.01066.x [DOI] [PubMed] [Google Scholar]
- Phillips, S. J. , Dudik, M. , Elith, J. , Graham, C. H. , Lehmann, A. , Leathwick, J. , & Ferrier, S. (2009). Sample selection bias and presence‐only distribution models: Implications for background and pseudo‐absence data. Ecological Applications, 19, 181–197. 10.1890/07-2153.1 [DOI] [PubMed] [Google Scholar]
- Pimm, S. L. , Jenkins, C. N. , Abell, R. , Brooks, T. M. , Gittleman, J. L. , Joppa, L. N. , … Sexton, J. O. (2014). The biodiversity of species and their rates of extinction, distribution, and protection. Science, 344, 1–10. 10.1126/science.1246752 [DOI] [PubMed] [Google Scholar]
- Ramesh, V. , Gopalakrishnac, T. , Barved, S. , & Melnick, D. J. (2017). IUCN greatly underestimates threat levels of endemic birds in the Western Ghats. Biological Conservation, 210, 205–221. 10.1016/j.biocon.2017.03.019 [DOI] [Google Scholar]
- Riitters, K. H. , Wickham, J. D. , O'Neill, R. V. , Jones, K. B. , Smith, E. R. , Coulston, J. W. , … Smith, J. H. (2002). Fragmentation of continental United States forests. Ecosystems, 5, 815–822. 10.1007/s10021-002-0209-2 [DOI] [Google Scholar]
- Si, Y. , Xu, Y. , Xu, F. , Li, X. , Zhang, W. , Wielstra, B. , … Gong, P. (2018). Spring migration patterns, habitat use, and stopover site protection status for two declining waterfowl species wintering in China as revealed by satellite tracking. Ecology and Evolution, 8, 1–10. 10.1002/ece3.4174 [DOI] [PMC free article] [PubMed] [Google Scholar]
- Soroye, P. , Ahmed, N. , & Kerr, J. T. (2018). Opportunistic community science data transform understanding of species distributions, phenology, and diversity gradients for global change research. Global Change Biology, 24, 1–37. [DOI] [PubMed] [Google Scholar]
- Sripanomyom, S. , Round, P. D. , Savini, T. , Trisurat, Y. , & Gale, G. A. (2011). Traditional saltpans hold major concentrations of overwintering shorebirds in Southeast Asia. Biological Conservation, 144, 526–537. 10.1016/j.biocon.2010.10.008 [DOI] [Google Scholar]
- Studds, C. E. , Kendall, B. E. , Murray, N. J. , Wilson, H. B. , Rogers, D. I. , Clemens, R. S. , … Fuller, R. A. (2017). Rapid population decline in migratory shorebirds relying on Yellow Sea tidal mudflats as stopover sites. Nature Communication, 8, 14895 10.1038/ncomms14895 [DOI] [PMC free article] [PubMed] [Google Scholar]
- Sullivan, B. L. , Aycrigg, J. L. , Barry, J. H. , Bonney, R. E. , Bruns, N. , Cooper, C. B. , … Kelling, S. (2014). The eBird enterprise: An integrated approach to development and application of citizen science. Biological Conservation, 169, 31–40. 10.1016/j.biocon.2013.11.003 [DOI] [Google Scholar]
- Theobald, D. M. (2010). Estimating natural landscape changes from 1992 to 2030 in the conterminous US. Landscape Ecology, 25, 999–1011. 10.1007/s10980-010-9484-z [DOI] [Google Scholar]
- Todd, B. D. , Nowakowski, A. J. , Rose, J. P. , & Price, S. J. (2017). Species traits explaining sensitivity of snakes to human land use estimated from community science data. Biological Conservation, 206, 31–36. [Google Scholar]
- Todd, B. D. , Rose, J. P. , Price, S. J. , & Dorcas, M. E. (2016). Using citizen science data to identify the sensitivity of species to human land use. Conservation Biology, 30, 1266–1276. 10.1111/cobi.12686 [DOI] [PubMed] [Google Scholar]
- Wang, W. J. , Fraser, J. D. , & Chen, J. K. (2017). Distribution and long‐term population trends of wintering waterbirds in Poyang Lake, China. Wetlands, 39, 1–11. [Google Scholar]
- Wang, Y. Y. , Jia, Y. F. , Guan, L. , Lu, C. , Lei, G. C. , Wen, L. , & Liu, G. H. (2013). Optimising hydrological conditions to sustain wintering waterbird populations in Poyang Lake National Natural Reserve: Implications for dam operations. Freshwater Biology, 58, 2366–2379. 10.1111/fwb.12216 [DOI] [Google Scholar]
- Weisshaupt, N. , & Rodríguez‐Pérez, J. (2017). Habitat use of the Wood Warbler Phylloscopus sibilatrix during spring migration versus breeding season based on citizen science data. Bird Study, 64, 386–392. [Google Scholar]
- Xu, Y. , Si, Y. , Yin, S. , Zhang, W. , Grishchenko, M. , Prins, H. H. T. , … de Boer, W. F. (2019). Species‐dependent effects of habitat degradation in relation to seasonal distribution of migratory waterfowl in the East Asian‐Australasian Flyway. Landscape Ecology, 34, 243–257. 10.1007/s10980-018-00767-7 [DOI] [Google Scholar]
- Yang, H. , Ma, M. , Thompson, J. R. , & Flower, R. J. (2017). Protect coastal wetlands in China to save endangered migratory birds. Proceedings of the National Academy of Sciences of the United States of America, 114, E5491–E5492. 10.1073/pnas.1706111114 [DOI] [PMC free article] [PubMed] [Google Scholar]
- Yasué, M. , & Dearden, P. (2009). The importance of supratidal habitats for wintering shorebirds and the potential impacts of shrimp aquaculture. Environmental Management, 43, 1108–1121. 10.1007/s00267-008-9255-7 [DOI] [PubMed] [Google Scholar]
Associated Data
This section collects any data citations, data availability statements, or supplementary materials included in this article.
Supplementary Materials
Appendix S1‐S2
Data Availability Statement
The records of species supporting this study can be acquired in the websites of eBird in the USA (https://ebird.org/home), the Global Biodiversity Information Network (GBIF) (http://www.gbifchina.org/), and from BirdReport in China (http://www.birdreport.cn/). The land use and land cover data are available from the Data Center for Resources and Environmental Sciences at the Chinese Academy of Sciences (RESDC) (http://www.resdc.cn).