

Abstract
Shifting cultivation is a widespread land‐use in the tropics that is considered a major threat to rainforest diversity and structure. In the Philippines, a country with rich biodiversity and high rates of species endemism, shifting cultivation, locally termed as kaingin, is a major land‐use and has been for centuries. Despite the potential impact of shifting cultivation on forests and its importance to many people, it is not clear how biodiversity and forest structure recover after kaingin abandonment in the country, and how well these post‐kaingin secondary forests can complement the old‐growth forests. We investigated parameters of forest diversity and structure along a fallow age gradient in secondary forests regenerating after kaingin abandonment in Leyte Island, the Philippines (elevation range: 445–650 m asl). We first measured the tree diversity and forest structure indices in regenerating secondary forests and old‐growth forest. We then measured the recovery of tree diversity and forest structure parameters in relation to the old‐growth forest. Finally, using linear mixed effect models (LMM), we assessed the effect of different environmental variables on the recovery of forest diversity and structure. We found significantly higher species density in the oldest fallow sites, while Shannon’s index, species evenness, stem number, basal area, and leaf area index were higher in the old‐growth forest. A homogeneous species composition was found across the sites of older fallow age. Multivariate analysis revealed patch size as a strong predictor of tree diversity and forest structure recovery after shifting cultivation. Our study suggests that, secondary forests regenerating after shifting cultivation abandonment can recover rapidly. Although recovery of forest structure was not as rapid as the tree diversity, our older fallow sites contained a similar number of species as the old‐growth forest. Many of these species are also endemic to the Philippines. Novel and emerging ecosystems like tropical secondary forests are of high conservation importance and can act as a refuge for dwindling tropical forest biodiversity.
Keywords: kaingin, reforestation, restoration, secondary forest, Southeast Asia, succession, tree diversity
We investigated parameters of forest diversity and structure along a shifting cultivation fallow gradient in Leyte island, the Philippines. Regenerating secondary forests following shifting cultivation abandonment can exhibit high resilience and recover rapidly. Novel and emerging ecosystems like tropical secondary forests are of high conservation importance and can act as a refuge for dwindling tropical forest diversity.

1. INTRODUCTION
Large areas of tropical forest have been modified by human activity, mainly logging and shifting cultivation, and the persistence of forest in the tropics relies on the effective management of such human‐modified landscapes (Chazdon, 2008, 2014; Gardner et al., 2009). In recent years, secondary or second‐growth forests in the tropics have become a key concern for scientists and policy makers due to their recognized potential to offset the unprecedented loss of tropical forest biodiversity (Chazdon et al., 2009; Laurance, 2007; Pichancourt, Firn, Chades, & Martin, 2014). It is also increasingly acknowledged that regenerating secondary forests in the tropics can provide environmental benefits equivalent to primary forests, although the role they have played in biodiversity conservation just recently begun to understand (see—Mukul, Herbohn, & Firn, 2016a; Bonner, Schmidt, & Shoo, 2013; van Breugel et al., 2013; Chazdon et al., 2009; Norden, Chazdon, Chao, Jiang, & Vilchez‐Alvarado, 2009; Rozendaal et al., 2019).
In Southeast Asia, shifting cultivation or slash‐and‐burn agriculture has been considered a primary agent of forest loss and degradation (Geist & Lambin, 2002; Houghton, 2012; Ziegler et al., 2012). Shifting cultivation is a dominant land use in this region with deforestation rates still remaining high (Dalle, Pulido, & de Blois, 2011; Sodhi et al., 2010). In recent years, although the extent of land under shifting cultivation has declined in many countries (van Vliet et al., 2012), this traditional land use still forms a central part of the livelihoods of millions of upland rural smallholders in Southeast Asia (Dalle et al., 2011; Mertz et al., 2009). At the same time, significant debate persists among policy makers and the scientific community over the impact of shifting cultivation on forest dynamics from both a management and conservation perspective (Mukul & Herbohn, 2016; van Vliet et al., 2012).
Negative perceptions of shifting cultivation's impacts on forest diversity and structure mainly center around comparisons with primary or less‐disturbed forests with yet very limited studies from Southeast Asia (see—Castro‐Luna, Castillo‐Campos, & Sosa, 2011; Ding, Zang, Liu, He, & Letcher, 2012; Do et al., 2011; Klanderud et al., 2010). Due to the dynamic nature of the landscapes, including differences in site management and spatial heterogeneity, research into the impacts of shifting cultivation on secondary forest dynamics has always been challenging (Mukul & Herbohn, 2016). In the tropics, the intensity of shifting cultivation and past land use is an important factor in determining the capacity of regenerating forests to recover in terms of species diversity, composition, and forest structure, although a large variation exists in the recovery of different forest attributes and the time required for recovery (Jakovac, Peña‐Claros, Kuyper, & Bongers, 2015; Lawrence, 2004; Lawrence, Radel, Tully, Scmook, & Schneider, 2010; Villa, Martins, Oliveira Neto, Rodrigues, Martorano, et al., 2018; Villa, Martins, Oliveira Neto, Rodrigues, Vieira, et al., 2018). For example, some research suggests it can take at least ten years for woody species to become prominent in secondary forests following shifting cultivation (Raharimalala et al., 2010) and 60 years to achieve the biodiversity levels of an old‐growth forest (Do et al., 2011). Others have reported the recovery of specific stand structure indices, such as stand density, can be rapid in young fallow areas (McNamara, Erskine, Lamb, Chantalangsy, & Boyle, 2012), although the recovery of other forest structure parameters may take as long as 40 years (Piotto, Montagnini, Thomas, Ashton, & Oliver, 2009). In many cases, an active forest management strategy has been found to support a more rapid restoration of tree diversity and forest structure (Bonilla‐Moheno & Hol, 2010).
The Philippines maintain about 5% of the world's plant diversity with a high level of species endemism (Lasco, Veridiano, Habito, & Pulhin, 2013; Sodhi et al., 2010). The forest cover in the country declined from 50% in 1950s to 24% in 2004 (Lasco et al., 2013), with the majority of the remaining forests being severely degraded (Chokkalingam et al., 2006). Shifting cultivation, locally known as kaingin, is a common, yet controversial land use in the country (Saurez & Sajise, 2010). Kaingin has been blamed for much of the country's deforestation and forest degradation, and it is not a recognized land use in government policies (Kummer, 1992; Lasco, Visco, & Pulhin, 2001). After post‐logging secondary forest, post‐kaingin secondary forest represents the second largest group of secondary forests in the Philippines (Lasco et al., 2001). In the Philippine, as in other Southeast Asian countries, secondary forests regenerating after shifting cultivation abandonment are becoming more common (Chokkalingam & Perera, 2001). At the same time, it is not clear how well these post‐kaingin secondary forests can complement the old‐growth forests, and how biodiversity and forest structure recover after kaingin abandonment in the country.
We investigated the recovery of tree species diversity and forest structure along a fallow gradient in secondary forests regenerating after shifting cultivation abandonment in an upland area of the Philippines—a global biodiversity hotspot and a megadiverse country (Posa, Diesmos, Sodhi, & Brooks, 2008). Species diversity was measured in terms of tree species density, Shannon–Wiener index, and species evenness index, while forest structure was measured in terms of stem density, basal area, and leaf area index (LAI). We also examined the factors that may expedite the recovery process in regenerating secondary forest ecosystems. We believe our study is useful to not only recognize the recovery potential of regenerating forests after shifting cultivation abandonment but also to better understand the prospect of such landscapes to support forest restoration and conservation in the Philippines and other Southeast Asian countries.
2. MATERIALS AND METHODS
2.1. Study area
We conducted our study in Barangay (the smallest administrative unit in the Philippines and the native Filipino term for a village, Brgy. in short) Gaas in Ormoc city—located in the west part of Leyte Island in the Philippines. Leyte is the eighth largest island in the country with an area of about 800,000 ha. Geographically, it is situated between 124°17' and 125°18' East longitude and between 9°55' and 11°48' North latitude (Figure 1). Forest cover on the island is about 10%, although the once dipterocarp‐rich rainforests of the island are now represented by patches of old‐growth and secondary forests intermixed with coconut (Cocos nucifera) and abaca (Musa textilis) plantations (Asio, Jahn, Stahr, & Margraf, 1998). The relatively flat lowlands are used for agricultural production, mainly rice, corn, and sweet potatoes (Asio et al., 1998). There have been many attempts to support reforestation on Leyte Island, and there are numerous smallholder and community forests scattered across the island, including “rainforestation plantings” which were designed to reduce kaingin activity (Nguyen, Lamb, Herbohn, & Firn, 2014).
FIGURE 1.

Map showing the location of our study area on Leyte Island and the study sites in Gaas
Leyte has a “type IV” climate based on the Coronas Classification of Climate (Mukul, 2016). The island enjoys a relatively even distribution of rainfall throughout the year with an annual rainfall of about 4,000 mm (Jahn & Asio, 2001). Although there is no distinct dry season, between March and May the area experiences its lowest rainfall. Mean monthly temperature is 28°C which remains relatively constant throughout the year (Navarrete, Tsutsuki, & Asio, 2013). Relative humidity ranges between 75% and 80% during the dry and the wettest months (Jahn & Asio, 2001).
2.2. Site selection criteria
Olofson (1980) categorized the kaingin systems in the Philippines into three distinct types based on the sites where they have been practiced. These are as follows: (a) the tubigan system; (b) the katihan system; and (c) the dahilig system. The tubigan system involves the use of irrigation water and work animals in lowland areas, the katihan system is common in gently sloping land with limited facilities for irrigation, whereas the dahilig system is widely practiced on steeper slopes (Olofson, 1980). For the present study, we sampled only the dahilig system as it is comparable to the most common form of shifting cultivation found in much of Southeast Asia.
We purposively chose Brgy. Gaas (hereafter Gaas only) for our study. It is situated in an area of relatively high elevation (between 445 and 650 m asl) with a low population density and high forest cover, two essential conditions for the successful regeneration of kaingin fallow secondary forests (Chokkalingam et al., 2006). Smallholders living in the area usually grow abaca or coconut in their kaingin fallow land in order to receive some cash benefits during the time of abandonment. Our study was, however, confined to the areas where farmers planted only abaca since coconut plantations generally lead to a more intensive land management and as such secondary forest regrowth generally does not result.
2.3. Sampling protocol and vegetation survey
Chronosequence studies (a time for space replacement) are popular as an alternative to long‐term ecological research and have been widely used to investigate successional trends in tropical forests (Johnson & Miyanishi, 2008; Norden et al., 2015; Pickett, 1989). We categorized our secondary forest sites into four different fallow age categories; that is, fallow less than (or equal to) 5 years old, hereafter referred to as new; 6‐ to 10‐year‐old fallow, hereafter referred to as young; 11‐ to 20‐year‐old fallow, hereafter referred to as middle‐aged; and 21‐ to 30‐year‐old fallow, hereafter referred to as oldest fallow. Additionally, old‐growth forest sites without any history of kaingin and logging and located close to the fallow sites were sampled as the control. Our control old‐growth forest sites were indispensable references against which we compare fallow sites in order to properly assess the forest recovery and resilience (Norden et al., 2009).
Vegetation surveys in our 25 sites (4 fallow age category + old‐growth forest × 5 replicates; total sample area 2.5 ha) were undertaken from May to October 2013. In the secondary forests, we sampled from the sites that were at least 1 ha in size (Piotto et al., 2009). Four transects of 50 m × 5 m (parallel to each other and a minimum of 5 m distance from each other) were established at each of our sites. We recorded diameter of each tree ≥5 cm at diameter at breast height (dbh) using a diameter tape.
Where possible trees were identified to the species level with the help of a local expert from Visayas State University (VSU). In the case of unknown species, we used the most common Filipino name of that species. Additional information, like global (as per IUCN, 2014) and local (as per DENR, 2007) conservation status, biogeographic origin, and successional guild were also collected.
2.4. Site environmental parameters
Both fallow age and the number of fallow cycles are known to influence vegetation and soil parameters and their recovery (Klanderud et al., 2010; Lawrence, Suma, & Mogea, 2005). Here, we are only able to consider fallow age and not the number of fallow cycles because reliable information was not available from the smallholders. Other site attributes collected were—elevation, patch size, slope, LAI, distance from the nearest old‐growth forest, and soil organic carbon (SOC %) (Table 1). We used a digital plant canopy imager (Model: CID Bio‐Science) for LAI and a hand‐held GPS (Model: Garmin eTrex) for site elevation.
TABLE 1.
Environmental attributes of our fallow sites and old‐growth forest on Leyte Island, the Philippines
| Site attributes | Fallow age category | Old‐growth forest | F‐value a | |||
|---|---|---|---|---|---|---|
| New | Young | Middle‐aged | Oldest | |||
| Elevation (m asl) | 600.8 ± 22.19 | 549.0 ± 72.41 | 567.2 ± 49.24 | 574.8 ± 35.35 | 512.4 ± 54.77 | 2.18 |
| Slope (degree) | 33 ± 5.7 | 32.4 ± 9.4 | 32.6 ± 9.2 | 38.2 ± 7.98 | 36.4 ± 9.71 | 0.47 |
| Patch area (ha) | 1.16 ± 0.21 | 1.14 ± 0.13 | 1.34 ± 0.24 | 1.14 ± 0.22 | na | — |
| Distance (m) | 290 ± 74.16 | 540 ± 114.01 | 162 ± 198.17 | 256 ± 153.88 | 0 | 11.97 a |
| SOCǂ (%) | 6.17 ± 0.68 | 6.54 ± 2.05 | 5.21 ± 0.69 | 6.79 ± 1.92 | 4.77 ± 1.11 | 1.87 |
F‐value significant at p < .01 level as indicated from ANOVA.
2.5. Diversity and forest structure indices
Species diversity was described in terms of species density (S), Shannon–Wiener's diversity index (H) and species evenness index (J). Shannon's diversity index and species evenness index were calculated as described in Magurran (2004) while species density was the number of unique tree species per site. We used stem density (N), basal area (BA), and LAI as the measure of forest structure. Both stem density and basal area (m2) were expressed on a per site (0.1 ha) basis. Stem density or number was the number of tree individuals (≥5 cm dbh) per site while basal area (m2) was the total cross‐sectional area of all stems (≥5 cm dbh) in each site. LAI was measured as the ratio between total leaf area and ground area.
2.6. Species composition and similarities
We used importance value index (IVI) to compare the patterns of tree species dominance in each of the secondary forest of different fallow age categories and in our control old‐growth forest. IVI was the sum of relative density, relative dominance, and relative frequency of species (Magurran, 2004). Permutational multivariate analysis of variance (PERMANOVA) was also performed to test whether species composition differed among different site categories, and a nonmetric multi‐dimensional scaling (NMDS) to assess species compositional similarities between secondary forest of different fallow age and control old‐growth forest.
2.7. Recovery of tree species diversity and forest structure
Recovery of tree diversity and forest structure were compared against the control old‐growth forest. We calculated recovery as the percentage of tree diversity and forest structure compared to our control forest sites using the following equation.
where X fallow is the measure of a diversity and/or forest structure parameter of the fallow site, and X s is the mean of corresponding biodiversity and/or forest structure parameter in the control forest sites.
2.8. Data analysis
Statistical analysis was performed using the R package (version 3.0.1; R Development Core Team, 2014). Analysis of variance (ANOVA) and Tukey post hoc test were performed to test for significant differences between the variables. We used “Biodiversity R” (version 2.4‐1; Kindt & Coe, 2005) and “vegan” (version 2.0‐10; Oksanen et al., 2010) for calculating species richness and other community diversity indices. For PERMANOVA and NMDS, we used the Bray–Curtis similarity metric with 1,000 iterations, starting with a random configuration using the “vegan” package (Oksanen et al., 2010).
Linear mixed effect models (hereafter referred to as LMM) were developed to examine the effect of fallow age and site environmental attributes on tree diversity and forest structure recovery, using the package “nlme” (Pinheiro, Bates, Roy, & Sarkar, 2011). In our LMM, fallow age (FA), slope (SL), distance from nearest old‐growth forest (DIS), patch size (PS), and soil organic carbon (SOC) were used as explanatory variables (i.e., fixed factors), and site diversity (i.e., species density, Shannon's index, Species evenness) and forest structure indices (i.e., stem density, basal area, LAI) were the response variables. We used sites nested in fallow categories as the random effect in our models. Due to its collinearity with other explanatory variables, “elevation” was excluded from the final LMM (Appendix 1). We considered Akaike information criterion (AICc) corrected for small sample sizes for the selection of our top models, where the best models had the lowest AICc scores (Johnson & Omland, 2004). For our model selection and to evaluate the contribution different fixed effects had on explaining the variation in the response variables, we used the “MuMin” package in R (Bartoń, 2011). Models within four AICc units were considered equally supported among competing models (Grueber, Nakagawa, Laws, & Jamieson, 2011).
3. RESULTS
3.1. Species and characteristics
Altogether, we censused 2,918 tree individuals belonging to 131 species, 86 genera, and 46 families with six species remaining unidentified (see Appendix 2). There were no standing trees in two of our new fallow sites. Among the species, 14 belonged to the family Moraceae, followed by Dipterocarpaceae (10 species), Phyllanthaceae (8 species), Fabaceae (6 species), Euphorbiaceae (5 species), Lamiaceae (5 species), and Rubiaceae (5 species). At the landscape level, 106 species were recorded alone from our oldest fallow sites, followed by our middle‐aged fallow sites (95 species), and 79 species from the old‐growth forest. We found 40 species that were endemic to the Philippines. The highest number of endemic species was recorded in the oldest fallow sites (37 species), followed by the middle‐aged sites (30 species), the young fallow sites (29 species), and the old‐growth forest (27 species). Six exotic species were also recorded from the sites, although there were no exotic species in the old‐growth forest or in the young fallow sites. The highest number of pioneer (49), secondary (46), and climax (11) species were recorded in the oldest fallow sites (Table 2). We found nine tree species that are critically endangered globally (according to the IUCN Red List) in our oldest fallow sites, and eight species in both the young fallow sites and the middle‐aged fallow sites (Table 2; Appendix 2).
TABLE 2.
Distribution and characteristics of species recorded from secondary forest and old‐growth forest sites on Leyte Island, the Philippines
| Parameter | Fallow age category | Old‐growth forest | |||
|---|---|---|---|---|---|
| New | Young | Middle‐aged | Oldest | ||
| Biogeographic origin | |||||
| Endemic | 4 (±1.10) | 21 (±9.36) | 20 (±13.16) | 27 (±7.35) | 21 (±7.31) |
| Native | 23 (±12.32) | 63 (±24.12) | 71 (±29.34) | 75 (±9.04) | 58 (±13.44) |
| Exotic | 1 (±0.45) | 0 | 4 (±3.83) | 4 (±3.11) | 0 |
| Successional guild | |||||
| Pioneer | 12 (±3.44) | 36 (±1.82) | 47 (±3.42) | 49 (±3.9) | 35 (±3.83) |
| Secondary | 12 (±3.71) | 38 (±3.54) | 40 (±4.92) | 46 (±3.54) | 35 (±1.64) |
| Climax | 4 (±0.84) | 10 (±1.79) | 8 (±2.19) | 11 (±1.52) | 9 (±1.48) |
| Conservation status (Global) | |||||
| Critically endangered | 3 (±0.89) | 8 (±0.71) | 8 (±2.07) | 9 (±1.82) | 6 (±1.22) |
| Endangered | 0 | 0 | 1 (±0.45) | 0 | 0 |
| Vulnerable | 2 (±0.89) | 9 (±2.07) | 10 (±2.68) | 10 (±1.3) | 11 (±1.34) |
| Conservation status (Local) | |||||
| Critically endangered | 0 | 3 (±0.84) | 3 (±0.55) | 3 (±0.84) | 3 (±0.71) |
| Endangered | 1 (±0.55) | 2 (±0.55) | 2 (±0.55) | 1 (±0.55) | 1 (±0.55) |
| Vulnerable | 2 (±0.45) | 5 (±0.89) | 5 (±1.52) | 6 (±1.0) | 5 (±0.45) |
Values in the parenthesis indicates the standard deviation (SD) of mean.
3.2. Biodiversity and forest structure in regenerating secondary forests
Tree diversity and forest structure varied significantly across our sites. This was the case whether these attributes were measured as species density (F 4, 24 = 30.79, p < .01), Shannon's diversity index (F 4, 24 = 12.39, p < .01), species evenness (F 4, 24 = 1.66, p < .05), stem density (F 4, 24 = 54.1, p < .01), basal area (F 4, 24 = 12.51, p < .01), or LAI (F 4, 24 = 26.48, p < .01). Post hoc analysis using Tukey's HSD showed species density to be significantly higher (p < .01) in the oldest fallow secondary forest sites followed by old‐growth forest (45.2 ± 4.21) and the middle‐aged secondary forest sites (39.2 ± 9.52) (Figure 2). The Shannon's diversity index (3.37 ± 0.11), species evenness (0.88 ± 0.02), stem number (145.8 ± 16.53), tree basal area (7.81 ± 2.23), and LAI were all significantly (p < .001) higher in our old‐growth forest.
FIGURE 2.

Within and between variations of tree diversity (left) and forest structure (right) indices across the sites on Leyte Island, the Philippines. Note the differences in scale on Y‐axes
3.3. Species composition in regenerating secondary forests after shifting cultivation abandonment
Climax species had the highest IVI in the old‐growth forest and all secondary forests of different fallow age categories except in the young fallow secondary forests (Appendix 3). Shorea polysperma showed the highest IVI (44.34) in new fallow sites, whereas in young fallows Lithocarpus llanosil had the highest IVI (15.4). Parashorea malannoan had the highest IVI in the old‐growth forest (53.07), and in the middle‐aged (22.90), and oldest fallow sites (24.63).
We found a homogeneous pattern of tree species richness in our ordination. In NMDS, species abundance in secondary forests of different fallow age was clustered together with our old‐growth forest sites. There was no distinct pattern in secondary forests of older fallow age and our control forest sites (Figure 3). However, our new and young fallow secondary forest sites demonstrated different species composition as in ordination several sites were spread out. Ordination using species of global and local conservation concern also provided a similar outcome (Figures 4 and 5). PERMANOVA using site category as the main effect showed significant differences (F 4, 24 = 1.88; p < .001) in species composition across the sites. Tukey's HSD also confirmed significantly different species composition between our old‐growth forest and the secondary forests of different fallow age categories except the oldest fallow secondary forest sites.
FIGURE 3.
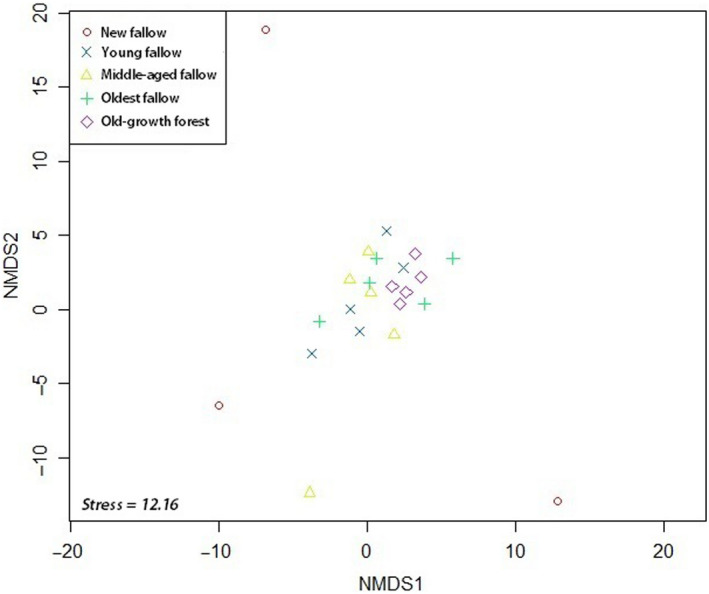
NMDS ordination of our sites using species abundance on Leyte Island, the Philippines using Bray–Curtis distance
FIGURE 4.

NMDS ordination of our sites using species of global conservation concern (according to IUCN Red List) on Leyte Island, the Philippines
FIGURE 5.

NMDS ordination of our sites using species of local conservation concern (according to DENR) on Leyte Island, the Philippines
3.4. Tree diversity and forest structure recovery along a fallow age gradient
The degree of recovery of tree diversity and forest structure with respect to the old‐growth forest were significantly different across secondary forests of different fallow age categories as measured by species density (F 3, 19 = 17.39; p < .00), Shannon's index (F 3, 19 = 9.52; p < .001), stem density (F 3, 19 = 36.06; p < .00), and LAI (F 3, 19 = 16.28; p < .00). There were, however, no significant differences in the recovery of species evenness (F 3, 19 = 2.43; p = .10) and basal area (F 3, 19 = 2.34; p < .11) across our sites (Figure 6). Recovery of tree diversity in terms of species density (101.33 ± 13.13) and Shannon's diversity index (98.87 ± 4.78) was highest in the oldest fallow secondary forest. Recovery of forest structure parameters, including stem density (98.49 ± 3.05) and basal area (50.15 ± 17.80) was also highest in the oldest fallow sites. Our post hoc analysis using Tukey's HSD revealed a significantly lower (p < .05) recovery of species density, Shannon's index, stem density, and LAI in new fallow sites compared to the secondary forest sites of other fallow age categories.
FIGURE 6.

Recovery of tree diversity (left) and forest structure (right) in relation to old‐growth forest on Leyte Island, the Philippines. Note the differences in scales on Y‐axes
3.5. Environmental controls on the recovery of secondary forest diversity and structure
Our multiple candidates LMM models explained the differences in species diversity and forest structure recovery in regenerating secondary forests after shifting cultivation abandonment (Table 3). For all response variables, models that included patch size explained as much variation as other more complex models that included interactions (all models within ∆AICc = 4 were considered equivalent). Other than patch size, soil organic carbon and fallow age were also found to explain variation in the recovery of different biodiversity and forest structure parameters (Table 4). Distance from old‐growth forest was not retained in any of the best supported candidate models.
TABLE 3.
Summary of linear mixed effect models within ∆ AICc = 4 obtained using MuMin package in R (Bartoń, 2011). Where S = species density, H = Shannon's index, J = species evenness, N = stem density, BA = basal area, LAI = leaf area index, FA = fallow age, DIS = distance from the nearest old‐growth forest, SL = slope, PS = patch size, SOC = soil organic carbon
| Response variable | Site environmental attribute | df | LL | AICc | ∆AICc | Weight | ||||
|---|---|---|---|---|---|---|---|---|---|---|
| FA | DIS | SL | PS | SOC | ||||||
| S | X | X | 6 | −69.93 | 159.50 | 0.0 | 0.36 | |||
| X | 5 | −72.59 | 160.19 | 0.69 | 0.26 | |||||
| X | X | 6 | −70.52 | 160.68 | 1.18 | 0.20 | ||||
| X | X | X | 7 | −67.85 | 160.9 | 1.4 | 0.18 | |||
| H | X | 5 | −65.48 | 145.96 | 0.0 | 0.39 | ||||
| X | X | 6 | −63.67 | 146.97 | 1.02 | 0.23 | ||||
| X | X | 6 | −63.68 | 146.99 | 1.03 | 0.23 | ||||
| X | X | X | 7 | −61.84 | 148.89 | 2.93 | 0.09 | |||
| X | X | 6 | −64.98 | 149.6 | 3.64 | 0.06 | ||||
| J | X | X | 6 | −49.31 | 118.26 | 0.0 | 0.57 | |||
| X | 5 | −51.9 | 118.8 | 0.55 | 0.43 | |||||
| N | X | X | 6 | −68.1 | 155.83 | 0.0 | 0.29 | |||
| X | X | X | 7 | −65.69 | 156.58 | 0.76 | 0.2 | |||
| X | X | 6 | −68.83 | 156.91 | 1.08 | 0.17 | ||||
| X | 5 | −71.06 | 157.12 | 1.3 | 0.15 | |||||
| X | X | 6 | −69.53 | 158.7 | 2.87 | 0.07 | ||||
| X | 5 | −71.94 | 158.89 | 3.06 | 0.06 | |||||
| X | X | 6 | −69.69 | 159.01 | 3.19 | 0.06 | ||||
| BA | X | X | 6 | −69.76 | 159.17 | 0.0 | 0.18 | |||
| X | 5 | −72.27 | 159.53 | 0.37 | 0.15 | |||||
| X | X | 6 | −70.05 | 159.73 | 0.56 | 0.14 | ||||
| X | X | X | 7 | −67.37 | 159.94 | 0.77 | 0.12 | |||
| X | X | X | 7 | −67.39 | 159.99 | 0.82 | 0.12 | |||
| X | X | 6 | −70.36 | 160.35 | 1.19 | 0.1 | ||||
| X | X | X | 7 | −68.22 | 161.65 | 2.48 | 0.05 | |||
| X | X | 6 | −71.26 | 162.16 | 2.99 | 0.04 | ||||
| X | X | 6 | −71.47 | 162.57 | 3.41 | 0.03 | ||||
| X | X | X | X | 8 | −65.3 | 162.6 | 3.43 | 0.03 | ||
| X | 5 | −73.91 | 162.82 | 3.65 | 0.03 | |||||
| LAI | X | 5 | −70.67 | 156.35 | 0.0 | 0.35 | ||||
| X | X | 6 | −68.72 | 157.07 | 0.72 | 0.25 | ||||
| X | X | 6 | −68.72 | 157.08 | 0.74 | 0.24 | ||||
| X | X | X | 7 | −66.76 | 158.71 | 2.37 | 0.11 | |||
| X | X | 6 | −70.31 | 160.25 | 3.9 | 0.05 | ||||
Abbreviations: AICc, Akaike information criterion corrected for small sample size; df, degree of freedom; LL, log likelihood.
TABLE 4.
The relative importance of site environmental attributes in the final LMM. Where S = species density, H = Shannon's index, J = species evenness, N = stem density, BA = basal area, LAI = leaf area index, FA = fallow age, PS = patch size, SL = slope, DIS = distance from the nearest old‐growth forest, SOC = soil organic carbon
| Site indices | Site environmental attribute a | Number of models | ||||
|---|---|---|---|---|---|---|
| FA | PS | DIS | SL | SOC | ||
| S | 0.54 (2) | 1.0 (4) | — | — | 0.38 (2) | 4 |
| H | 0.32 (2) | 1.0 (5) | — | 0.06 (1) | 0.32 (2) | 5 |
| J | — | 1.0 (2) | — | — | 0.57 (1) | 2 |
| N | 0.44 (3) | 0.87 (5) | — | 0.06 (1) | 0.62 (4) | 7 |
| BA | 0.49 (6) | 0.9 (8) | — | 0.35 (5) | 0.45 (6) | 11 |
| LAI | 0.35 (2) | 1.0 (5) | — | 0.05 (1) | 0.35 (2) | 5 |
Values in the parenthesis indicates the number of models containing a respective explanatory variable.
4. DISCUSSION
4.1. Biodiversity conservation and secondary forest development after shifting cultivation abandonment
Our study has revealed rapid recovery of secondary forests regenerating after shifting cultivation abandonment in the study area and the important role of these forests in species conservation at the landscape level. Recovery of tree diversity was more rapid than forest structure. Although there was a substantial decrease in biodiversity in the first five years, our older fallow secondary forest sites exhibited similar levels of biodiversity to that of old‐growth forest in the area. Our study approach and measures of biodiversity (i.e., species density, Shannon's index, and species evenness) have been widely used to investigate the successional development of forest after disturbance cessation (see—Jakovac et al., 2015; Letcher & Chazdon, 2009; Martin, Newton, & Bullock, 2013; Norden et al., 2015; Villa, Martins, Oliveira Neto, Rodrigues, Martorano, et al., 2018; Villa, Martins, Oliveira Neto, Rodrigues, Vieira, et al., 2018). We found that Shannon's index and species evenness index were higher in old‐growth forest and that species density was higher in the oldest fallow secondary forest. Recently, abandoned new fallow sites demonstrated a very distinct pattern of species diversity compared to the secondary forest sites of much older fallow age categories in our study. A similar observation was made by Klanderud et al. (2010) in Madagascar who found shrub dominance after the abandonment of shifting cultivation was inhibiting tree diversity in the area. Young fallow areas have less diversity of adult tree species (Miller & Kauffman, 1998; Schmook, 2010), and woody species become prominent in secondary fallow forests after about ten years (Gemerden, Shu, & Olff, 2003; Klanderud et al., 2010; Raharimalala et al., 2010). Some studies suggest that secondary forest, for example, after selective logging, can exhibit greater forest structure in terms of basal area than undisturbed forest (e.g., Castro‐Luna et al., 2011; Ding et al., 2012), although the conservation value of such landscapes are not always high when considering the diversity of forest specialist or climax species (Fredericksen & Mostacedo, 2000; Mo, Zhu, Zhang, Slik, & Liu, 2011). Despite a comparable stem density in the older fallow secondary forests sites and the old‐growth forest, tree basal area was significantly higher our control old‐growth forest sites. This may be attributed to the presence of large diameter trees in the area, as also experienced by Mo et al. (2011).
Despite a relatively homogeneous species composition in our old‐growth forest sites and secondary forests of older fallow age, the new fallow sites showed a limited overlap in species composition with our control old‐growth forest. Species composition is regarded as a key aspect of the study of forest recovery after disturbance (Slik, Bernard, Beek, Breman, & Eichhorn, 2008), and several studies have reported that the similarity between undisturbed forests and regenerating secondary forests will increase with an increase in the abandonment age (see—Lawrence, 2004; Norden et al., 2009; Piotto et al., 2009; Rozendaal et al., 2019). In NMDS ordination, two of our new fallow sites were wholly spread out, which may be a consequence of the intensity of past land use represented by fallow cycles that we were not able to incorporate into our analysis. Interestingly, when considering IVI of species, some dipterocarp species (e.g., Parashorea malaanoan) were found to be dominant across all sites. This may be attributed to such remnant large‐canopy trees not interfering during the time of agricultural use (Häger, Otárola, Stuhlmacher, Castillo, & Arias, 2014; Sandor & Chazdon, 2014).
Recovery of species density and Shannon's index was rapid in our older fallow secondary forests sites, although we found no significant difference in the recovery of species evenness. Recovery of stem density increased gradually with the fallow age. Recovery of stand basal area was distinct across the sites and was more inclined to our older fallow secondary forests sites, which is an indication of the greater number of large and mature trees in those sites. In tropical regions, the degree to which a forest recovers after disturbance is uncertain (Ding et al., 2012), although it is known that following disturbance tropical forests can recover well in terms of tree diversity and stand structure (see—Cannon, Peart, & Leighton, 1998; Letcher & Chazdon, 2009; Rozendaal et al., 2019). Unlike Slik et al. (2008), Letcher and Chazdon (2009) and Martin et al. (2013) who found rapid recovery of forest structure parameters over diversity during secondary forest succession, we found rapid recovery of forest diversity parameters in our secondary forest sites.
4.2. Controls of site environmental factors in forest recovery after shifting cultivation abandonment
Patch size influences the recovery of species diversity and composition in our study sites, and patch size on its own was found to have a similar variable importance for recovery of forest diversity and structure as more complicated models that include interactions of fallow age, slope, and soil organic carbon. Echeverría, Newton, Lara, Benayas, and Comes, 2007 also found patch size as the single most important factor influencing both species composition and stand structure in terms of basal area and stem density. Both fallow age and fallow cycles influence the intensity of past forest use and their ability to recover (Lawrence, 2004; Schmook, 2010; Villa, Martins, Oliveira Neto, Rodrigues, Martorano, et al., 2018), and however, in our analysis we only included fallow age. Biodiversity recovery in tropical secondary forests may depend on the remaining forest cover (Arroyo‐Rodriguez et al., 2016; Arroyo‐Rodriguez, Pineda, Escobar, & Benitez‐Malvido, 2008), although the intensity of past land use is a stronger predictor of forest recovery than edaphic environmental variables, highlighting the importance of humans in shaping tropical forest dynamics (Castro‐Luna et al., 2011; Ding et al., 2012; Klanderud et al., 2010; Mukul, Herbohn, & Firn, 2016b).
Our study's investigation of soil parameters was limited to soil organic carbon, which is an important indicator of soil fertility. Despite this limitation, our findings agree with those of Paoli, Curran, and Slik (2008) and Poorter et al. (2016), who found soil nutrients positively influence the recovery of forest structure parameters like basal area. We, however, found no significant effect of distance from the nearest old‐growth forest on the recovery of any of the parameters investigated in our study as also reported by Piotto et al. (2019) in Brazil. Studies on secondary forest dynamics have demonstrated that diversity of woody species increases gradually with time, although the rate of recovery differs depending on the geographic location of the site and the associated environmental parameters (see—Chazdon, 2014; Ehrlen & Morris, 2015; Klanderud et al., 2010; Lawrence et al., 2010; Martin et al., 2013; Piotto et al., 2009; Poorter et al., 2016; Read & Lawrence, 2003; Sovu, Tigabu, Savadogo, Odén, & Xayvongsa, 2009; Uddin, Steinbauer, Jentsch, Mukul, & Beierkuhnlein, 2013). Previous studies (e.g. Ding et al., 2012; N'Dja & Decocq, 2008; Schmook, 2010) have reported that secondary forests may require different durations to attain the diversity and structure of an undisturbed forest after they have been abandoned. Fallow age, however, may not affect the recovery of forest diversity measures when a common species pool occurs across the sites (Sovu et al., 2009). Connectivity to primary forests increases forest regeneration by influencing natural processes like pollination and seed dispersal (Echeverría et al. (2007); Häger et al., 2014) although in our study it was not important. A declining trend in species richness with increasing distance to primary forest edges, however, may be found (Sovu et al., 2009).
4.3. Implications for forest and landscape restoration and conservation
Our study confirms that regenerating forests in the tropics have the ability to recover after shifting cultivation, although site factors (patch size in our case) may be important during this recovery process. Throughout the tropics, secondary forests are expanding dramatically, and in many countries, they have already exceeded the total area covered by remaining primary or old‐growth forests (Chazdon, 2014; McNamara et al., 2012). Such forests have emerged following intensive human land use, and management interventions are being increasingly considered because these emerging “novel” regrowth ecosystems commonly have a different composition and structure than the original forest type (Hobbs, Higgs, & Harris, 2009). The successful maintenance of tree diversity in such ecosystems offers important synergies for conservation, as high plant diversity is associated with higher wildlife diversity (Chazdon et al., 2009). In the case of the Philippines, secondary forest covers a large area and represents a highly dynamic ecosystem, making biodiversity conservation a daunting challenge in the country (Lasco et al., 2001; Posa et al., 2008).
We found that secondary forests regenerating after kaingin abandonment can also support relatively high numbers of rare and endangered species and thus can play an important role in their conservation. This is contrary to previous views that fallow landscapes are unfavorable for the maintenance forest biodiversity (see—Gemerden et al., 2003; Mo et al., 2011). The population status of rare and endemic species is highly relevant to the prioritization of conservation efforts globally (Kier et al., 2009). Tropical forest‐agriculture frontiers also provide important clues for conservation in complex, heterogeneous landscapes (Kumaraswamy & Kunte, 2013). We found that the number of endemics, climax and red‐listed species was greater in relatively older fallow sites. A number of dipterocarp species, including Hopea philippinensis, Shorea polysperma, and Shorea contorta—that are of both local and global conservation significance, were shared among secondary forests of different fallow age categories and in control old‐growth forest, indicating a high conservation value of regenerating secondary forests.
5. CONCLUSIONS
It is clear that forests regenerating following the abandonment of shifting cultivation have the potential to mitigate the loss of tropical forest biodiversity. It is also clear that these secondary forests have a high resilience or capacity to recover. In our study, we found that species composition in secondary forests with fallow ages of more than five years were similar to the less‐disturbed old‐growth forest, indicating a continuous accumulation of tree species after abandonment. Recovery of tree diversity was rapid compared to the forest structure, and in all cases, new fallow secondary forest showed a more divergent pattern of forest structure and diversity compared to that of our older fallow secondary forest categories. Although shifting cultivation has a negative reputation for causing the degradation and loss of tropical rainforests, little attention has been paid to studying secondary forest dynamics in complex, human‐modified landscapes. Our study indicates that novel ecosystems such as fallow secondary forests that arise after deliberate human intervention can recover rapidly after disturbance and can act as a low‐cost refuge for biodiversity conservation. Such forests can also serve as a low‐cost ecosystem restoration measure in tropical developing countries where shifting cultivation is common.
CONFLICT OF INTEREST
The authors declare no conflict of interest.
AUTHOR CONTRIBUTION
Sharif A. Mukul: Conceptualization (equal); Data curation (equal); Formal analysis (equal); Investigation (equal); Methodology (equal). John Herbohn: Conceptualization (equal); Funding acquisition (equal); Methodology (equal); Project administration (equal). Jennifer Firn: Conceptualization (equal); Formal analysis (equal); Investigation (equal); Methodology (equal); Project administration (equal).
ACKNOWLEDGMENTS
We would like to thank Drs Nestor Gregorio (USC), Arturo Pasa (VSU), Angela Ferreran (VSU) and VSU‐ACIAR field staff for their assistance in the field. Thanks are due to Professors Robin Chazdon (USC/UConn), David Lamb (UQ/USC), and L.A. Bruinjeel (King's College London, UK) for their valuable feedback at different stages of this work. This work was made possible by an International Postgraduate Research Scholarship provided to Sharif A. Mukul from the Australian Government, and support to Professor John Herbohn from the Australian Centre for International Agricultural Research (ACIAR) through project ASEM/2010/50 (Improving watershed rehabilitation outcomes in the Philippines using a systems approach).
APPENDIX 1.
Pearson correlation between environmental attributes of our sites on Leyte Island, the Philippines.
| Fallow age | Elevation | Slope | Patch size | Distance | SOC | |
|---|---|---|---|---|---|---|
| Fallow age | 1 | |||||
| Elevation | −0.09 | 1 | ||||
| Slope | 0.25 | 0.52* | 1 | |||
| Patch size | 0.07 | −0.01 | −0.16 | 1 | ||
| Distance | −0.35 | −0.12 | 0.07 | −0.09 | 1 | |
| SOC | 0.05 | 0.53* | 0.43 | −0.325 | −0.005 | 1 |
*Correlations significant at p < 0.05 level.
APPENDIX 2.
List of tree species recorded from our sites on Leyte Island, the Phillipines.
| Family | Botanical namea | Local name | Abundance | Originb | Conservation status | Successional guilde | |||||
|---|---|---|---|---|---|---|---|---|---|---|---|
| New fallow | Young fallow | Middle‐aged fallow | Oldest fallow | Old‐growth forest | IUCNc | DENRd | |||||
| Alangiaceae | Alangium javanicum (Bl.) Wang | Putian | — | 4 | 3 | 3 | 5 | Native | LR | NA | Secondary |
| Anacardiaceae | Dracontomelon dao (Blanco) Merr. & Rolfe | Dao | — | 2 | 3 | 1 | 2 | Native | NA | V | Secondary |
| Dracontomelon edule (Blanco) Skeels. | Lamio | — | 2 | 1 | 1 | Native | NA | V | Secondary | ||
| Annonaceae | Cananga odorata (Lam.) Hook. f. & Thomson | Ilang‐ilang | — | 1 | — | — | — | Native | NA | NA | Secondary |
| Polyalthia oblongifolia Burck | Lapnisan | — | 6 | 2 | 6 | 1 | Native | NA | NA | Secondary | |
| Polyalthia flava | Yellow lanutan | — | 7 | 4 | 1 | 8 | Endemic | NA | NA | Secondary | |
| Apocynaceae | Alstonia macrophylla G. Don | Batino | — | 5 | 4 | 5 | — | Native | LR | NA | Pioneer |
| Alstonia parvifolia Merr. | Batino‐liitan | — | — | 3 | — | — | Endemic | NA | NA | Pioneer | |
| Wrightia pubescens R.Br. | Lanete | 1 | 9 | 13 | 9 | 2 | Native | NA | NA | Pioneer | |
| Kibatalia gitingensis (Elmer) Woodson | Laneteng‐gubat | — | 1 | 1 | 17 | 8 | Endemic | V | CE | Secondary | |
| Araliaceae | Arthrophyllum cenabrei Merr. | Bingliu | — | — | 9 | — | — | Endemic | NA | NA | Pioneer |
| Polyscias nodosa (Blume) Seem. | Malapapaya | 2 | 51 | 83 | 97 | 14 | Native | NA | NA | Pioneer | |
| Arecaceae | Areca cathecu L | Bunga | — | — | 5 | 8 | — | Native | NA | NA | Secondary |
| Cocos nucifera L. | Coconut | — | — | — | 5 | — | Native | NA | NA | Pioneer | |
| Caryota cumingii Lodd. ex Mart. | Pugahan | — | 43 | 25 | 26 | 83 | Native | NA | NA | Pioneer | |
| Heterospathe elata Scheff. | Sagisi | — | 6 | 6 | 2 | 15 | Native | NA | NA | Pioneer | |
| Bignoniaceae | Radermachera pinnate (Blanco) Seem. | Banai‐Banai | 2 | 28 | 24 | 11 | 2 | Native | NA | NA | Secondary |
| Burseraceae | Canarium hirsutum | Milipili | — | — | 2 | 6 | 1 | Native | NA | NA | Secondary |
| Canarium calophyllum Perkins. | Pagsahingin‐bulog | 1 | 11 | 10 | 8 | 12 | Native | NA | NA | Secondary | |
| Canarium luzonicum (Blume) A.Gray | Piling‐liitan | — | 2 | 3 | 6 | 28 | Endemic | V | NA | Pioneer | |
| Calophyllaceae | Calophyllum blancoi Planch. & Triana | Bitanghol | — | 7 | 7 | 22 | 9 | Native | NA | NA | Secondary |
| Calophyllum lancifolium Elmer. | Bitanghol‐sibat | 2 | 3 | — | 2 | — | Native | NA | NA | Secondary | |
| Cannabaceae | Trema orientalis (L.) Bl. | Anabiong | 1 | — | — | — | 2 | Native | NA | NA | Pioneer |
| Celtis philippensis Blanco | Malaikmo | — | — | — | 1 | 4 | Native | NA | NA | Secondary | |
| Casuarinaceae | Casuarina equisetifolia L. | Agoho | 1 | — | 1 | — | — | Exotic | NA | NA | Pioneer |
| Gymnostoma rumphianum (Miq.) L.A.S. Johnson | Mountain agoho | 1 | — | — | 1 | — | Native | NA | NA | Secondary | |
| Combretaceae | Terminalia microcarpa Decne. | Kalumpit | — | — | 2 | — | — | Native | NA | NA | Secondary |
| Cycadaceae | Cycas circinalis L. | Pitogo | — | — | 1 | — | — | Native | E | NA | Pioneer |
| Datiscaceae | Octomeles sumatrana Miq. | Binuang | — | — | — | 1 | — | Native | LR | NA | Secondary |
| Dilleniaceae | Dillenia indica L. | Handapara | — | 2 | — | 4 | — | Native | NA | NA | Secondary |
| Dillenia philippinensis Rolfe | Katmon | — | 2 | 6 | 5 | 6 | Endemic | V | NA | Secondary | |
| Dipterocarpaceae | Shorea almon Foxw. | Almon | — | 2 | — | 3 | Endemic | CE | V | Climax | |
| Parashorea malaanonan (Blanco) Merr. | Bagtikan | 4 | 11 | 19 | 32 | 61 | Native | NA | NA | Climax | |
| Dipterocarpus eurynchus Miq. | Basilanapitong | — | — | 1 | — | — | Endemic | CE | E | Secondary | |
| Hopea philippinensis Dyer | Gisok‐gisok | — | 7 | 3 | 2 | 20 | Endemic | CE | CE | Pioneer | |
| Shorea guiso (Blanco) Blume | Guijo | — | 15 | 8 | 4 | 31 | Native | CE | NA | Pioneer | |
| Shorea palosapis (Blanco) Merr. | Mayapis | — | 3 | 9 | 5 | 12 | Endemic | CE | NA | Climax | |
| Anisoptera thurifera | Palosapis | — | — | — | 1 | — | Native | NA | NA | Secondary | |
| Shorea polysperma (Blanco) Merr. | Tangile | 2 | 6 | 8 | 14 | 5 | Endemic | CE | V | Climax | |
| Shorea contorta Vidal | White lauan | 2 | 5 | 16 | 6 | 4 | Endemic | CE | V | Climax | |
| Hopea malibato | Yakal‐kaliot | — | — | — | 1 | — | Native | CE | CE | Climax | |
| Ebenaceae | Diospyros pilosanthera Blanco | Bolong‐eta | — | 1 | 4 | 9 | 3 | Native | NA | E | Secondary |
| Diospyros blancoi A.DC. | Kamagong | — | 1 | 3 | — | 1 | Native | V | CE | Climax | |
| Euphorbiaceae | Neotrewia cumingii (Müll.Arg.) Pax & K.Hoffm. | Apanang | — | 3 | 3 | 2 | 4 | Native | NA | NA | Pioneer |
| Mallotus philippensis (Lam.) Müll.Arg. | Banato | — | 2 | — | — | — | Native | NA | NA | Secondary | |
| Macaranga tanarius (L.) Müll.Arg. | Binunga | — | 5 | 4 | 2 | 7 | Native | NA | NA | Pioneer | |
| Macaranga bicolor Muell. ‐Arg. | Hamindang | — | 9 | 1 | 8 | 5 | Endemic | V | NA | Pioneer | |
| Mallotus ricinoides (Pers.) Müll.Arg. | Hinlaumo | 1 | 5 | 12 | 5 | — | Native | NA | NA | Pioneer | |
| Fabaceae | Ormosia calavensis Blanco | Bahai | — | 34 | 3 | 19 | 2 | Endemic | NA | NA | Climax |
| Albizia falcataria (L.) Fosberg. | Falcata | — | 5 | 6 | — | Exotic | NA | NA | Secondary | ||
| Leucaena leucaephala (Lam.) de Wit. | Ipil‐ipil | — | — | 7 | 3 | — | Exotic | NA | NA | Pioneer | |
| Pterocarpus indicus Willd. | Narra | 8 | — | — | — | — | Native | V | NA | Secondary | |
| Albizia saponaria(Lour.) Blume ex Miq. | Salingkugi | — | 4 | — | 3 | 8 | Native | NA | NA | Secondary | |
| Senna siamea (Lam.) Irwin et Barneby | Thailand shower | — | — | 2 | 1 | — | Native | NA | NA | Secondary | |
| Fagaceae | Lithocarpus llanosii (A.DC.) Rehder | Ulaian | 2 | 17 | 28 | 27 | 16 | Native | NA | NA | Pioneer |
| Hypericaceae | Cratoxylum celebicum Bl. | Paguriagon | — | 4 | 2 | 11 | 4 | Native | NA | NA | Secondary |
| Lamiaceae | Vitex quinata (Lour.) F. N. Williams | Kalipapa | — | — | 1 | — | 10 | Native | NA | NA | Pioneer |
| Vitex turczaninowii (Turcz.) Merr. | Lingo‐lingo | — | — | — | — | 1 | Endemic | NA | NA | Secondary | |
| Premna cumingiana Schauer | Magilik | 1 | — | — | — | 2 | Native | NA | NA | Secondary | |
| Tectona grandis L. f. | Teak | — | — | — | 1 | — | Exotic | NA | NA | Pioneer | |
| Callicarpa elegans Hayek | Tigau‐ganda | — | — | — | 2 | — | Endemic | NA | NA | Pioneer | |
| Lauraceae | Cinnamomum cebuense Kostermans | Kaningag | — | 2 | 2 | 2 | — | Endemic | CE | NA | Pioneer |
| Litsea perrottetii (Bl.) Villar. | Marang | ‐ | 5 | 2 | 8 | 4 | Native | NA | NA | Secondary | |
| Neolitsea vidalii Merr. | Puso‐puso | — | 7 | 3 | 6 | Endemic | V | NA | Secondary | ||
| Lecythidaceae | Barringtonia racemosa Spreng. | Putat | — | 3 | 4 | 6 | 11 | Native | NA | NA | Pioneer |
| Petersianthus quadrialatus (Merr.) Merr. | Toog | — | — | — | 1 | 8 | Endemic | NA | NA | Pioneer | |
| Malvaceae | Diplodiscus paniculatus Turcz. | Balobo | — | 9 | 5 | 7 | 5 | Endemic | V | NA | Secondary |
| Pterospermum obliquum Blanco | Kulatingan | — | — | — | 1 | 2 | Endemic | NA | NA | Pioneer | |
| Melastomataceae | Astronia cumingiana S.Vidal | Badling | — | 4 | 8 | 7 | 3 | Native | CE | NA | Pioneer |
| Meliaceae | Dysoxylum decandrum Merrill. | Igyo | — | 2 | 3 | 2 | 6 | Native | NA | NA | Pioneer |
| Toona philippinensis Elmer. | Lanigpa | — | 1 | 3 | 5 | 4 | Native | NA | NA | Pioneer | |
| Dysoxylum cumingianum C. DC. | Tara‐tara | — | 4 | 6 | 13 | 10 | Native | NA | NA | Pioneer | |
| Moraceae | Artocarpus blancoi (Elmer) Merr. | Antipolo | 1 | 6 | 5 | 4 | 7 | Endemic | V | NA | Pioneer |
| Artocarpus ovatus Blanco | Anubing | — | — | — | 2 | — | Endemic | NA | NA | Pioneer | |
| Ficus irisana Elmer. | Aplas | — | 5 | 9 | 7 | 1 | Native | NA | NA | Pioneer | |
| Ficus balete Merr. | Balete | 1 | 9 | 10 | — | 4 | Native | NA | NA | Pioneer | |
| Ficus gul K. Schum. & Lauterb. | Butli | 3 | 41 | 19 | 32 | 18 | Native | NA | NA | Secondary | |
| Ficus minahassae (Teijsm. & De Vriese) Miq. | Hagimit | 4 | 19 | 15 | 4 | 4 | Native | NA | NA | Secondary | |
| Ficus septica Burm. f. | Hauili | 2 | 3 | 18 | — | Native | NA | NA | Secondary | ||
| Ficus ulmifolia Lam. | Is‐is | — | 3 | 1 | 2 | 1 | Endemic | V | NA | Pioneer | |
| Ficus callosa Willd. | Kalukoi | — | — | 2 | 1 | — | Native | NA | NA | Pioneer | |
| Ficus magnoliifolia Blume | Kanapai | — | 6 | 2 | 1 | — | Native | NA | NA | Secondary | |
| Ficus odorata (Blanco) Merr. | Pakiling | — | 1 | 1 | 5 | — | Endemic | NA | NA | Climax | |
| Ficus vrieseana Miq. | Tagitig | — | — | — | 1 | 1 | Native | NA | NA | Secondary | |
| Ficus nota Merr. | Tibig | 1 | 21 | 17 | 2 | 7 | Native | NA | NA | Pioneer | |
| Ficus ampelas Burm. f | Upling‐gubat | 12 | 1 | — | 6 | Native | NA | NA | Pioneer | ||
| Myricaceae | Myrica javanica Reinw. ex Bl. | Hindang | 1 | — | — | — | 3 | Native | NA | NA | Secondary |
| Myristicaceae | Knema mindanaensis (Warb.) comb. nov. | Bunod | — | 1 | 3 | 5 | — | Endemic | NA | NA | Secondary |
| Parartocarpus venenosus (Zoll. & Morr.) Becc. ssp. papuanus (Becc.) Jarr. | Malanangka | 1 | 2 | 2 | 2 | 4 | Native | NA | NA | Pioneer | |
| Horsfieldia costulata (Miq.) Warb. | Yabnob | — | 33 | 36 | 26 | 38 | Native | NA | NA | Pioneer | |
| Myrtaceae | Syzygium surigaense (Merr.) Merr. | Kagagko | — | — | — | 2 | 3 | Endemic | NA | NA | Secondary |
| Syzygium crassilimbum (Merr.) Merr. | Kaitatanag | — | 1 | 1 | 2 | — | Endemic | NA | NA | Secondary | |
| Syzygium gigantifolium (Merr.) Merr. | Malatalisai | — | 4 | 4 | 4 | Endemic | NA | NA | Secondary | ||
| Syzygium hutchinsonii (C.B.Robinson) Merr. | Malatambis | 1 | 10 | 11 | 12 | 5 | Endemic | NA | NA | Secondary | |
| Xanthostemon verdugonianus Naves | Mangkono | — | — | — | 2 | 2 | Endemic | V | NA | Pioneer | |
| Olacaceae | Strombosia philippinensis (Baill.) Rolfe | Tamayuan | — | 12 | 14 | 14 | 16 | Endemic | NA | NA | Secondary |
| Pandanaceae | Pandanus radicans Blanco | Ulangong‐ugatan | — | — | — | 2 | — | Endemic | NA | NA | Pioneer |
| Phyllanthaceae | Securinega fIexuosa (Muell. ‐Arg.) | Anislag | — | 6 | 4 | 6 | — | Endemic | NA | NA | Pioneer |
| Antidesma ghaesembilla Gaertn. | Binayuyu | — | 13 | — | 3 | 3 | Native | NA | NA | Climax | |
| Glochidion camiguinense Merr. | Bunot‐Bunot | — | 8 | 3 | 10 | 2 | Endemic | NA | NA | Pioneer | |
| Glochidion album (Blanco) Boerl. | Malabagang | — | 1 | 1 | 2 | 3 | Native | NA | NA | Pioneer | |
| Breynia rhamnoides Müll.Arg. | Matang‐hipon | — | 3 | 2 | 2 | — | Native | NA | NA | Pioneer | |
| Cleistanthus venosus C.B. Rob. | Sarimisim | — | 2 | 1 | — | Endemic | NA | NA | Secondary | ||
| Bridelia penangiana Hook.f.Bridelia insulana Hance | Subiang | — | 3 | 1 | 1 | 8 | Native | N | N | Secondar | |
| Bischofia javanica Blume | Tuai | — | 24 | 20 | 26 | 58 | Native | NA | NA | Secondary | |
| Piperaceae | Piper anduncum L. | Spiked pepper | 3 | — | 3 | 1 | 5 | Native | NA | NA | Pioneer |
| Primulaceae | Ardisia pyramidalis (Cav.) Pers. ex A. DC. | Aunasin | — | 8 | 6 | 4 | 12 | Native | NA | NA | Secondary |
| Rhizophoraceae | Carallia brachiata (Lour.) Merr. | Bakauan‐gubat | — | 4 | 2 | 1 | 1 | Native | NA | NA | Secondary |
| Rubiaceae | Neonauclea formicaria (Elmer) Merr. | Hambabalud | — | 6 | 7 | 7 | 2 | Endemic | NA | NA | Pioneer |
| Mussaenda philippica A.Rich. | Kahoi‐dalaga | 1 | 1 | — | — | — | Native | NA | E | Secondary | |
| Neonauclea bartlingii (DC.) Merr. | Lisak | — | 1 | 6 | 4 | 5 | Endemic | NA | NA | Secondary | |
| Canthium fenicis (Merr.) Merr. | Mapugahan | — | 2 | — | 4 | — | Endemic | NA | NA | Pioneer | |
| Canthium monstrosum (A. Rich.) Merr. | Tadiang‐anuang | — | 4 | 1 | 1 | — | Native | NA | NA | Pioneer | |
| Rutaceae | Melicope triphylla (Lam.) Merr. | Matang‐arau | — | 4 | 4 | 3 | 1 | Endemic | NA | NA | Pioneer |
| Sapindaceae | Nephelium lappaceum | Rambutan | — | — | 1 | — | — | Native | LR | NA | Pioneer |
| Sapotaceae | Planchonella nitida (Blume) Dubard. | Duklitan | — | — | 1 | 9 | — | Exotic | NA | NA | Secondary |
| Palaquium luzoniense (Fern.‐Vill.) Vidal | Nato | — | 11 | 2 | 8 | 16 | Endemic | V | V | Secondary | |
| Sterculiaceae | Pterospermum diversifolium Bl. | Bayok | — | — | 4 | 1 | 1 | Native | NA | NA | Pioneer |
| Tiliaceae | Trichospermum involucratum (Merr.) Elmer | Langosig | — | — | 1 | — | — | Endemic | NA | NA | Pioneer |
| Urticaceae | Leucosyke capitellata (Pair.) Wedd. | Alagasi | 3 | 46 | 60 | 5 | 7 | Native | NA | NA | Pioneer |
| Pipturus arborescens (Link) C. B. Rob. | Dalunot | — | — | 1 | 8 | — | Native | NA | NA | Pioneer | |
| Dendrocnide stimulans (L. f) Chew | Lingaton | — | — | — | 1 | — | Native | NA | NA | Pioneer | |
| Verbenaceae | Premna odorata Blanco | Alagau | 1 | — | 2 | — | — | Native | NA | NA | Secondary |
| Premna stellate Merr. | Manaba | — | — | 1 | — | — | Native | NA | NA | Secondary | |
| Vitaceae | Leea aculeata Bl. | Amamali | — | 1 | 3 | — | 5 | Native | NA | NA | Pioneer |
| Unknown | Anungo | — | 8 | 2 | 4 | 18 | — | — | Secondary | ||
| Nandamai | — | — | — | 1 | — | — | — | Pioneer | |||
| Pandukaki | — | — | — | 1 | — | — | — | Pioneer | |||
| Pegonngon | — | — | — | 1 | — | — | — | Secondary | |||
| Poelig | — | 13 | 1 | 1 | — | — | Pioneer | ||||
| Siyao | 1 | — | — | — | — | — | Pioneer | ||||
aWhenever possible species name was followed as per Species 2000 & ITIS catalogue of Life, Annual Checklist (available online at: www.catalogueoflife.org/annual‐checklist/).
bWhere Endemic ‐ refers to a species found only in the Philippines, Native – refers to a species naturally occurring in the Philippines and Exotic – refers to a species that has been introduced in the Philippines.
cAs per IUCN Red List of Threatened Species (available online at: http://www.iucnredlist.org), where: CE or Critically endangered – refers to a species or subspecies facing extremely high risk of extinction in the wild in the immediate future. Endangered ‐ refers to a species or subspecies that is not critically endangered but whose survival in the wild is unlikely if the causal factors continue operating. V or Vulnerable ‐ refers to a species or subspecies that is not critically endangered nor endangered but is under threat from adverse factors throughout its range and is likely to move to the endangered category in the future. LR or Lower risk – refers to a species that has been evaluated, but does not satisfy the criteria for any of the categories Critically Endangered, Endangered or Vulnerable. NA or Not available/Not assessed – refers to a species that has not yet been assessed against the criteria.
dAs per DENR Adminsitrative Order No. 2007.01, where: CE or Critically endangered ‐ refers to a species or subspecies facing extremely high risk of extinction in the wild in the immediate future. This shall include varieties, I formae or other infraspecific categories; E or Endangered ‐ refers to a species or subspecies that is not critically endangered but whose survival in the wild is unlikely if the causal factors continue operating. This shall include varieties, formag or other infraspecific categories; V or Vulnerable ‐ refers to a species or subspecies that is not critically endangered nor endangered but is under threat from adverse factors throughout its range and is likely to move to the endangered category in the future. This shall include varieties, formae or other infraspecific categories;
eBased on experts opinion from the Philippines.
APPENDIX 3.
Top ten species with highest importance value in sites of different fallow categories and in old‐growth forest on Leyte Island, the Philippines.
| Site category | Species | Relative density | Relative frequency | Relative dominance | IVI |
|---|---|---|---|---|---|
| New fallow | Shorea polysperma | 3.71 | 3.33 | 37.30 | 44.34 |
| Parashorea malaanonan* | 7.41 | 3.33 | 23.30 | 34.04 | |
| Pterocarpus indicus | 14.82 | 6.67 | 8.47 | 29.95 | |
| Calophyllum lancifolium | 3.71 | 3.33 | 7.34 | 14.37 | |
| Siyaoǂ | 1.85 | 3.33 | 9.12 | 14.30 | |
| Polyscias nodosa** | 3.71 | 6.67 | 0.65 | 11.02 | |
| Ficus minahassae | 7.41 | 3.33 | 0.23 | 10.97 | |
| Lithocarpus llanosii** | 3.71 | 3.33 | 3.17 | 10.20 | |
| Shorea contorta | 3.71 | 3.33 | 2.85 | 9.88 | |
| Piper anduncum | 5.56 | 3.33 | 0.16 | 9.05 | |
| Young fallow | Lithocarpus llanosii** | 2.39 | 1.56 | 11.39 | 15.34 |
| Polyscias nodosa** | 7.15 | 2.08 | 3.90 | 13.13 | |
| Caryota cumingii*** | 6.03 | 1.56 | 4.30 | 11.89 | |
| Ficus gul | 5.75 | 2.61 | 3.23 | 11.58 | |
| Radermachera pinnate | 3.93 | 2.08 | 4.50 | 10.51 | |
| Leucosyke capitellata | 6.45 | 1.56 | 2.12 | 10.13 | |
| Ormosia calavensis | 4.77 | 1.56 | 3.29 | 9.62 | |
| Parashorea malaanonan* | 1.54 | 2.61 | 4.85 | 8.10 | |
| Horsfieldia costulata** | 4.63 | 2.08 | 1.80 | 8.51 | |
| Bischofia javanica** | 3.37 | 2.08 | 2.93 | 8.38 | |
| Middle‐aged fallow | Parashorea malaanonan* | 2.70 | 2.04 | 18.16 | 22.90 |
| Polyscias nodosa** | 11.79 | 2.55 | 4.33 | 18.67 | |
| Shorea contorta | 2.27 | 2.04 | 9.47 | 13.78 | |
| Leucosyke capitellata | 8.52 | 2.55 | 1.78 | 12.85 | |
| Lithocarpus llanosii** | 3.98 | 2.04 | 6.43 | 12.45 | |
| Bischofia javanica** | 2.84 | 1.02 | 6.34 | 10.20 | |
| Horsfieldia costulata** | 5.12 | 2.04 | 2.19 | 9.34 | |
| Ficus balete | 1.42 | 1.02 | 6.68 | 9.12 | |
| Ficus minahassae | 2.13 | 1.53 | 5.17 | 8.83 | |
| Radermachera pinnate | 3.41 | 2.04 | 2.30 | 7.75 | |
| Oldest fallow | Parashorea malaanonan* | 4.46 | 2.18 | 17.99 | 24.63 |
| Polyscias nodosa** | 13.51 | 2.18 | 5.80 | 21.50 | |
| Shorea polysperma | 1.95 | 1.31 | 10.03 | 13.29 | |
| Calophyllum blancoi | 3.07 | 2.18 | 7.97 | 13.22 | |
| Lithocarpus llanosii** | 3.76 | 1.75 | 5.74 | 11.25 | |
| Bischofia javanica** | 3.62 | 1.75 | 4.47 | 9.84 | |
| Ficus gul | 4.46 | 1.75 | 1.43 | 7.63 | |
| Horsfieldia costulata** | 3.62 | 2.18 | 1.51 | 7.31 | |
| Caryota cumingii *** | 3.62 | 1.75 | 1.42 | 6.78 | |
| Ormosia calavensis | 2.65 | 1.75 | 1.67 | 6.07 | |
| Old‐growth forest | Parashorea malaanonan* | 8.37 | 2.21 | 42.49 | 53.07 |
| Bischofia javanica** | 7.96 | 2.21 | 5.96 | 16.13 | |
| Caryota cumingii*** | 11.39 | 2.21 | 1.50 | 15.10 | |
| Shorea guiso | 4.25 | 2.21 | 2.85 | 9.32 | |
| Horsfieldia costulata** | 5.21 | 2.21 | 1.74 | 9.16 | |
| Ficus balete | 0.55 | 0.89 | 5.83 | 7.27 | |
| Petersianthus quadrialatus | 1.10 | 1.33 | 4.61 | 7.04 | |
| Calophyllum blancoi | 1.24 | 1.77 | 3.99 | 7.00 | |
| Canarium luzonicum | 3.84 | 2.21 | 0.79 | 6.85 | |
| Palaquium luzoniense | 2.20 | 2.21 | 2.19 | 6.60 |
Where: * ‐ species common across all site categories, ** ‐ species common across at least four site categories, and ***species common across at least three site categories, ǂ ‐ local name
Mukul SA, Herbohn J, Firn J. Rapid recovery of tropical forest diversity and structure after shifting cultivation in the Philippines uplands. Ecol Evol. 2020;10:7189–7211. 10.1002/ece3.6419
DATA AVAILABILITY STATEMENT
Additional data related to this study is available at Dryad Data Repository (https://doi.org/10.5061/dryad.nvx0k6dph).
REFERENCES
- Arroyo‐Rodriguez, V. , Melo, F. P. L. , Martinez‐Ramos, M. , Bongers, F. , Chazdon, R. L. , Meave, J. A. , … Tabarelli, M. (2016). Multiple successional pathways in human‐modified tropical landscapes: New insights from forest succession, forest fragmentation and landscape ecology research. Biological Reviews, 00, 1–23. 10.1111/brv.12231 [DOI] [PubMed] [Google Scholar]
- Arroyo‐Rodriguez, V. , Pineda, E. , Escobar, F. , & Benitez‐Malvido, J. (2008). Value of small patches in the conservation of plant‐species diversity in highly fragmented rainforest. Conservation Biology, 23, 729–739. 10.1111/j.1523-1739.2008.01120.x [DOI] [PubMed] [Google Scholar]
- Asio, V. B. , Jahn, R. , Stahr, K. , & Margraf, J. (1998). Soils of the tropical forests of Leyte, Philippines II: Impact of different land uses on status of organic matter and nutrient availability In Schulte A., & Ruhiyat D. (Eds.), Soils of Tropical Forest Ecosystems: Characteristics, ecology and management (pp. 37–44). New York, NY: Springer. [Google Scholar]
- Bartoń, K. (2011). Package ‘MuMin’. Retrieved from http://cran.r‐project.org/web/packages/MuMIn/MuMIn.pdf [Google Scholar]
- Bonilla‐Moheno, M. , & Hol, K. D. (2010). Direct seeding to restore tropical mature forest species in areas of slash‐and‐burn agriculture. Restoration Ecology, 18, 438–445. 10.1111/j.1526-100X.2009.00580.x [DOI] [Google Scholar]
- Bonner, M. T. L. , Schmidt, S. , & Shoo, L. P. (2013). A meta‐analytical global comparison of aboveground biomass accumulation between tropical secondary forests and monoculture plantations. Forest Ecology and Management, 291, 73–86. 10.1016/j.foreco.2012.11.024 [DOI] [Google Scholar]
- Cannon, C. H. , Peart, D. R. , & Leighton, M. (1998). Tree species diversity in commercially logged Bornean rainforest. Science, 281, 1366–1368. 10.1126/science.281.5381.1366 [DOI] [PubMed] [Google Scholar]
- Castro‐Luna, A. A. , Castillo‐Campos, G. , & Sosa, V. J. (2011). Effects of selective logging and shifting cultivation on the structure and diversity of a tropical evergreen forest in south‐eastern Mexico. Journal of Tropical Forest Science, 23, 17–34. [Google Scholar]
- Chazdon, R. L. (2008). Beyond deforestation: Restoring forests and ecosystem services on degraded lands. Science, 320, 1458–1460. 10.1126/science.1155365 [DOI] [PubMed] [Google Scholar]
- Chazdon, R. L. (2014). Second growth: The promise of tropical forest regeneration in an age of deforestation. Chicago, IL: University of Chicago Press. [Google Scholar]
- Chazdon, R. L. , Peres, C. A. , Dent, D. , Sheil, D. , Lugo, A. E. , Lamb, D. , … Miller, S. E. (2009). The potential for species conservation in tropical secondary forests. Conservation Biology, 23, 1406–1417. 10.1111/j.1523-1739.2009.01338.x [DOI] [PubMed] [Google Scholar]
- Chokkalingam, U. , Carandang, A. P. , Pulhin, J. M. , Lasco, R. D. , Peras, R. J. J. , & Toma, T. (2006). One century of forest rehabilitation in the Philippines: Approaches, outcomes and lessons. Bogor, Indonesia: Center for International Forestry Research (CIFOR). [Google Scholar]
- Chokkalingam, U. W. U. , & Perera, G. A. D. (2001). The evolution of swidden fallow secondary forests in Asia. Journal of Tropical Forest Science, 13, 800–815. [Google Scholar]
- Dalle, S. P. , Pulido, M. T. , & de Blois, S. (2011). Balancing shifting cultivation and forest conservation: Lessons from a "sustainable landscape" in Southeastern Mexico. Ecological Applications, 21, 1557–1572. 10.1890/10-0700.1 [DOI] [PubMed] [Google Scholar]
- DENR (Department of Environment and Natural Resources) . (2007). The national list of threatened Philippine plants and their categories, and the list of other wildlife species. Administrative Order 2007.01. DENR, Republic of the Philippines. [Google Scholar]
- Ding, Y. , Zang, R. , Liu, S. , He, F. , & Letcher, S. G. (2012). Recovery of woody plant diversity in tropical rain forests in southern China after logging and shifting cultivation. Biological Conservation, 145, 225–233. 10.1016/j.biocon.2011.11.009 [DOI] [Google Scholar]
- Do, T. V. , Osawa, A. , Thang, N. T. , Van, N. B. , Hang, B. T. , Khanh, C. Q. , … Tuan, D. X. (2011). Population changes of early successional forest species after shifting cultivation in Northwestern Vietnam. New Forests, 41, 247–262. 10.1007/s11056-010-9225-9 [DOI] [Google Scholar]
- Echeverría, C. , Newton, A. C. , Lara, A. , Benayas, J. M. R. , & Comes, D. A. (2007). Impact of forest fragmentation on species composition and forest structure in the temperate landscape of Southern Chile. Global Ecology and Biogeography, 16, 426–439. 10.1111/j.1466-8238.2007.00311.x. [DOI] [Google Scholar]
- Ehrlen, J. , & Morris, W. F. (2015). Predicting changes in the distribution and abundance of species under environmental change. Ecology Letters, 18, 303–314. 10.1111/ele.12410 [DOI] [PMC free article] [PubMed] [Google Scholar]
- Fredericksen, T. S. , & Mostacedo, B. (2000). Regeneration of timber species following selection logging in a Bolivian tropical dry forest. Forest Ecology and Management, 131, 47–55. 10.1016/S0378-1127(99)00199-1 [DOI] [Google Scholar]
- Gardner, T. A. , Barlow, J. , Chazdon, R. L. , Ewers, R. , Harvey, C. A. , Peres, C. A. , & Sodhi, N. (2009). Prospects for tropical forest biodiversity in a human‐modified world. Ecology Letters, 12, 561–582. 10.1111/j.1461-0248.2009.01294.x [DOI] [PubMed] [Google Scholar]
- Geist, H. J. , & Lambin, E. F. (2002). Proximate causes and underlying driving forces of tropical deforestation. BioScience, 52, 143–150. [Google Scholar]
- Gemerden, B. S. V. , Shu, G. N. , & Olff, H. (2003). Recovery of conservation values in Central African rain forest after logging and shifting cultivation. Biodiversity and Conservation, 12, 1553–1570. [Google Scholar]
- Grueber, C. E. , Nakagawa, S. , Laws, R. J. , & Jamieson, I. G. (2011). Multimodel inference in ecology and evolution: Challenges and solutions. Journal of Evolutionary Biology, 24, 699–711. 10.1111/j.1420-9101.2010.02210.x [DOI] [PubMed] [Google Scholar]
- Häger, A. , Otárola, M. F. , Stuhlmacher, M. F. , Castillo, R. A. , & Arias, A. C. (2014). Effects of management and landscape composition on the diversity and structure of tree species assemblages in coffee agroforests. Agriculture, Ecosystems & Environment, 199, 43–51. [Google Scholar]
- Hobbs, R. J. , Higgs, E. , & Harris, J. A. (2009). Novel ecosystems: Implications for conservation and restoration. Trends in Ecology and Evolution, 24, 599–605. 10.1016/j.tree.2009.05.012 [DOI] [PubMed] [Google Scholar]
- Houghton, R. A. (2012). Carbon emissions and the drivers of deforestation and forest degradation in the tropics. Current Opinion in Environmental Sustainability, 4, 597–603. 10.1016/j.cosust.2012.06.006 [DOI] [Google Scholar]
- IUCN (World Conservation Union) (2014). The IUCN red list of threatened species. Version 2013.2. Gland, Switzerland: IUCN; Retrieved from http://www.iucnredlist.org [Google Scholar]
- Jahn, R. , & Asio, V. B. (2001). Climate, geology, geomorphology and soils of the tropics with special reference to Leyte Islands (Philippines) In 8th International Seminar and Worshop on Tropical Ecology (pp. 25–43). Visaya State College of Agroculture, Baybay, Leyte. [Google Scholar]
- Jakovac, C. C. , Peña‐Claros, M. , Kuyper, T. W. , & Bongers, F. (2015). Loss of secondary‐forest resilience by land‐use intensification in the Amazon. Journal of Ecology, 103, 67–77. 10.1111/1365-2745.12298 [DOI] [Google Scholar]
- Johnson, E. A. , & Miyanishi, K. (2008). Testing the assumptions of chronosequences in succession. Ecology Letters, 11, 419–431. 10.1111/j.1461-0248.2008.01173.x [DOI] [PubMed] [Google Scholar]
- Johnson, J. B. , & Omland, K. S. (2004). Model selection in ecology and evolution. Trends in Ecology and Evolution, 19, 101–108. 10.1016/j.tree.2003.10.013 [DOI] [PubMed] [Google Scholar]
- Kier, G. , Kreft, H. , Lee, T. M. , Jetz, W. , Ibisch, P. I. , Nowicki, C. , … Barthlott, W. (2009). A global assessment of endemism and species richness across Island and mainland regions. Proceedings of the National Academy of Sciences of the United States of America, 106, 9322–9327. [DOI] [PMC free article] [PubMed] [Google Scholar]
- Kindt, R. , & Coe, R. (2005). Tree diversity analysis. A manual and software for common statistical methods for ecological and biodiversity studies. Nairobi, Kenya: World Agroforestry Centre (ICRAF). [Google Scholar]
- Klanderud, K. , Mbolatiana, H. Z. H. , Vololomboahangy, M. N. , Radimbison, M. A. , Roger, E. , Totland, Ø. , & Rajeriarison, C. (2010). Recovery of plant species richness and composition after slash‐and‐burn agriculture in a tropical rainforest in Madagascar. Biodiversity and Conservation, 19, 187–204. 10.1007/s10531-009-9714-3 [DOI] [Google Scholar]
- Kumaraswamy, S. , & Kunte, K. (2013). Integrating biodiversity and conservation with modern agricultural landscapes. Biodiversity Conservation, 22, 2735–2750. 10.1007/s10531-013-0562-9 [DOI] [Google Scholar]
- Kummer, D. M. (1992). Upland agriculture, the land frontier and forest decline in the Philippines. Agroforestry Systems, 18, 31–46. [Google Scholar]
- Lasco, R. D. , Veridiano, R. K. A. , Habito, M. , & Pulhin, F. B. (2013). Reducing emissions from deforestation and forest degradation plus (REDD+) in the Philippines: Will it make a difference in financing forest development? Mitigation and Adaptation Strategies for Global Change, 18, 1109–1124. 10.1007/s11027-012-9411-5 [DOI] [Google Scholar]
- Lasco, R. D. , Visco, R. G. , & Pulhin, J. M. (2001). Secondary forests in the Philippines: Formation and transformation in the 20th century. Journal of Tropical Forest Science, 13, 652–670. [Google Scholar]
- Laurance, W. F. (2007). Have we overstated the tropical biodiversity crisis? Trends in Ecology and Evolution, 22, 65–70. 10.1016/j.tree.2006.09.014 [DOI] [PubMed] [Google Scholar]
- Lawrence, D. (2004). Erosion of tree diversity during 200 years of shifting cultivation in Bornean rain forest. Ecological Applications, 14, 1855–1869. 10.1890/03-5321 [DOI] [Google Scholar]
- Lawrence, D. , Radel, C. , Tully, K. , Scmook, B. , & Schneider, L. (2010). Untangling a decline in tropical forest resilience: Constraints on the sustainability of shifting cultivation across the globe. Biotropica, 42, 21–30. 10.1111/j.1744-7429.2009.00599.x [DOI] [Google Scholar]
- Lawrence, D. , Suma, V. , & Mogea, J. P. (2005). Change in species composition with repeated shifting cultivation: Limited role of soil nutrients. Ecological Applications, 15, 1952–1967. 10.1890/04-0841 [DOI] [Google Scholar]
- Letcher, S. G. , & Chazdon, R. L. (2009). Rapid recovery of biomass, species richness, and species composition in a secondary forest chronosequence in northeastern Costa Rica. Biotropica, 41, 608–617. [Google Scholar]
- Magurran, A. E. (2004). Measuring biological diversity. Oxford, UK: Blackwell. [Google Scholar]
- Martin, P. A. , Newton, A. C. , & Bullock, J. M. (2013). Carbon pools recover more quickly than plant biodiversity in tropical secondary forests. Proceedings of the Royal Society B: Biological Sciences, 280, 20132236 10.1098/rspb.2013.2236 [DOI] [PMC free article] [PubMed] [Google Scholar]
- McNamara, S. , Erskine, P. D. , Lamb, D. , Chantalangsy, L. , & Boyle, S. (2012). Primary tree species diversity in secondary fallow forests of Laos. Forest Ecology and Management, 281, 93–99. 10.1016/j.foreco.2012.06.004 [DOI] [Google Scholar]
- Mertz, O. , Padoch, C. , Fox, J. , Cramb, R. A. , Leisz, S. J. , Nguyen, T. L. , & Tran, D. V. (2009). Swidden Change in Southeast Asia: Understanding causes and consequences. Human Ecology, 37, 259–264. 10.1007/s10745-009-9245-2 [DOI] [Google Scholar]
- Miller, P. M. , & Kauffman, J. B. (1998). Seedling and sprout response to slash‐and‐burn agriculture in a tropical deciduous forest. Biotropica, 30, 538–546. [Google Scholar]
- Mo, X. , Zhu, H. , Zhang, Y. J. , Slik, J. W. F. , & Liu, J. X. (2011). Traditional forest management has limited impact on plant diversity and composition in a tropical seasonal rainforest in SW China. Biological Conservation, 144, 1832–1840. 10.1016/j.biocon.2011.03.019 [DOI] [Google Scholar]
- Mukul, S. A. (2016). Shifting cultivation in the upland secondary forests of the Philippines: Biodiversity and carbon stock assessment, and ecosystem services trade‐offs in land‐use decisions. PhD thesis: The University of Queensland, Australia. [Google Scholar]
- Mukul, S. A. , & Herbohn, J. (2016). The impacts of shifting cultivation on secondary forests dynamic in tropics: A synthesis of the key finding and spatio temporal distribution of research. Environmental Science & Policy, 55, 167–177. [Google Scholar]
- Mukul, S. A. , Herbohn, J. , & Firn, J. (2016a). Co‐benefits of biodiversity and carbon sequestration from regenerating secondary forests in the Philippine uplands: Implications for forest landscape restoration. Biotropica, 48, 882–889. 10.1111/btp.12389 [DOI] [Google Scholar]
- Mukul, S. A. , Herbohn, J. , & Firn, J. (2016b). Tropical secondary forests regenerating after shifting cultivation in the Philippines uplands are important carbon sinks. Scientific Reports, 6, 22483 10.1038/srep22483 [DOI] [PMC free article] [PubMed] [Google Scholar]
- Navarrete, I. A. , Tsutsuki, K. , & Asio, V. B. (2013). Characteristics and fertility constraints of degraded soils in Leyte, Philippines. Archives of Agronomy and Soil Science, 59, 625–639. 10.1080/03650340.2012.663908 [DOI] [Google Scholar]
- N'Dja, J. K. K. , & Decocq, G. (2008). Successional patterns of plant species and community diversity in a semi‐deciduous tropical forest under shifting cultivation. Journal of Vegetation Science, 19, 809–820. 10.3170/2008-8-18453 [DOI] [Google Scholar]
- Nguyen, H. , Lamb, D. , Herbohn, J. , & Firn, J. (2014). Designing mixed species tree plantations for the tropics: Balancing ecological attributes of species with landholder preferences in the Philippines. PLoS One, 9, e95267 10.1371/journal.pone.0095267 [DOI] [PMC free article] [PubMed] [Google Scholar]
- Norden, N. , Angarita, H. A. , Bongers, F. , Martínez‐Ramos, M. , Granzow‐de la Cerda, I. , van Breugel, M. , … Chazdon, R. L. (2015). Successional dynamics in Neotropical forests are as uncertain as they are predictable. Proceedings of the National Academy of Sciences of the United States of America, 112, 8013–8018. [DOI] [PMC free article] [PubMed] [Google Scholar]
- Norden, N. , Chazdon, R. L. , Chao, A. , Jiang, Y. H. , & Vilchez‐Alvarado, B. (2009). Resilience of tropical rain forests: Tree community reassembly in secondary forests. Ecology Letters, 12, 385–394. 10.1111/j.1461-0248.2009.01292.x [DOI] [PubMed] [Google Scholar]
- Oksanen, J. , Blanchet, F. G. , Kindt, R. , Legendre, P. , O’Hara, B. , Simpson, G. L. , … Wagner, H. (2010). Vegan: Community ecology package. R package version 2.0‐10. [Google Scholar]
- Olofson, H. (1980). Swidden and kaingin among the southern Tagalog: A problem in Philippine upland ethno‐agriculture. Philippine Quarterly of Culture and Society, 8, 168–180. [Google Scholar]
- Paoli, G. D. , Curran, L. M. , & Slik, J. W. F. (2008). Soil nutrients affect spatial patterns of aboveground biomass and emergent tree density in southwestern Borneo. Oecologia, 155, 287–299. 10.1007/s00442-007-0906-9 [DOI] [PubMed] [Google Scholar]
- Pichancourt, J. B. , Firn, J. , Chades, I. , & Martin, T. G. (2014). Growing biodiverse carbon‐rich forests. Global Change Biology, 20, 382–393. 10.1111/gcb.12345 [DOI] [PubMed] [Google Scholar]
- Pickett, S. T. A. (1989). Space for time substitution as an alternative to long term studies In Liken G. E. (Ed.), Long‐term studies in ecology (pp. 71–88). Chichester, UK: Wiley. [Google Scholar]
- Pinheiro, J. , Bates, D. , Roy, S. D. , & Sarkar, D. (2011). Package ‘nlme’. Retrieved from http://cran.r‐project.org/web/packages/nlme/nlme.pdf [Google Scholar]
- Piotto, D. , Craven, D. , Montagnini, F. , Ashton, M. , Oliver, C. , & Thomas, W. W. (2019). Successional, spatial, and seasonal changes in seed rain in the Atlantic forest of southern Bahia, Brazil. PLoS One, 14, e0226474 10.1371/journal.pone.0226474 [DOI] [PMC free article] [PubMed] [Google Scholar]
- Piotto, D. , Montagnini, F. , Thomas, W. , Ashton, M. , & Oliver, C. (2009). Forest recovery after swidden cultivation across a 40‐year chronosequence in the Atlantic forest of southern Bahia, Brazil. Plant Ecology, 205, 261–272. [Google Scholar]
- Poorter, L. , Bongers, F. , Aide, T. M. , Almeyda Zambrano, A. M. , Balvanera, P. , Becknell, J. M. ,… Rozendaal, D. M. A. (2016). Biomass resilience of tropical secondary forests. Nature, 530, 211–214. [DOI] [PubMed] [Google Scholar]
- Posa, M. R. , Diesmos, A. C. , Sodhi, N. S. , & Brooks, T. M. (2008). Hope for threatened tropical biodiversity: Lessons from the Philippines. BioScience, 58, 231–240. 10.1641/B580309 [DOI] [Google Scholar]
- R Development Core Team . (2014). R: A language and environment for statistical computing. Vienna, Austria: R Foundation for Statistical Computing. [Google Scholar]
- Raharimalala, O. , Buttler, A. , Ramohavelo, C. D. , Razanaka, S. , Sorge, J. P. , & Gobat, J. M. (2010). Soil‐vegetation patterns in secondary slash and burn successions in Central Menabe, Madagascar. Agriculture, Ecosystems & Environment, 139, 150–158. [Google Scholar]
- Read, L. , & Lawrence, D. (2003). Recovery of biomass following shifting cultivation in dry tropical forests of the Yucatan. Ecological Applications, 13, 85–97. [Google Scholar]
- Rozendaal, D. M. A. , Bongers, F. , Aide, T. M. , Alvarez‐Dávila, E. , Ascarrunz, N. , Balvanera, P. , … Poorter, L. (2019). Biodiversity recovery of Neotropical secondary forests. Science Advances, 5, eaau3114. [DOI] [PMC free article] [PubMed] [Google Scholar]
- Sandor, M. E. , & Chazdon, R. L. (2014). Remnant trees affect species composition but not structure of tropical second‐growth forest. PLoS One, 9, e83284 10.1371/journal.pone.0083284 [DOI] [PMC free article] [PubMed] [Google Scholar]
- Saurez, R. K. , & Sajise, P. E. (2010). Deforestation, swidden agriculture and Philippine biodiversity. Philippine Science Letters, 3, 91–99. [Google Scholar]
- Schmook, B. (2010). Shifting maize cultivation and secondary vegetation in the Southern Yucatan: Successional forest impacts of temporal intensification. Regional Environmental Change, 10, 233–246. [Google Scholar]
- Slik, J. W. F. , Bernard, C. S. , Beek, M. V. , Breman, F. C. , & Eichhorn, K. A. O. (2008). Tree diversity, composition, forest structure and aboveground biomass dynamics after single and repeated fire in a Bornean rain forest. Oecologia, 158, 579–588. [DOI] [PubMed] [Google Scholar]
- Sodhi, N. S. , Koh, L. P. , Clements, R. , Wanger, T. C. , Hill, J. K. , Hamer, K. C. , … Lee, T. M. (2010). Conserving Southeast Asian forest biodiversity in human‐modified landscapes. Biological Conservation, 143, 2375–2384. 10.1016/j.biocon.2009.12.029 [DOI] [Google Scholar]
- Sovu, Tigabu, M. , Savadogo, P. , Odén, P. C. , & Xayvongsa, L. (2009). Recovery of secondary forests on swidden cultivation fallows in Laos. Forest Ecology and Management, 258, 2666–2675. 10.1016/j.foreco.2009.09.030 [DOI] [Google Scholar]
- Uddin, M. B. , Steinbauer, M. J. , Jentsch, A. , Mukul, S. A. , & Beierkuhnlein, C. (2013). Do environmental attributes, disturbances, and protection regimes determine the distribution of exotic plant species in Bangladesh forest ecosystem? Forest Ecology and Management, 303, 72–80. [Google Scholar]
- van Breugel, M. , Hall, J. S. , Craven, D. , Bailon, M. , Hernandez, A. , Abbene, M. , & van Breugel, P. (2013). Succession of ephemeral secondary forests and their limited role for the conservation of floristic diversity in a human‐modified tropical landscape. PLoS One, 8, e82433 10.1371/journal.pone.0082433 [DOI] [PMC free article] [PubMed] [Google Scholar]
- van Vliet, N. , Mertz, O. , Heinimann, A. , Langanke, T. , Pascual, U. , Schmook, B. , … Ziegler, A. D. (2012). Trends, drivers and impacts of changes in swidden cultivation in tropical forest‐agriculture frontiers: A global assessment. Global Environmental Change, 22, 418–429. [Google Scholar]
- Villa, P. M. , Martins, S. V. , Oliveira Neto, S. N. , Rodrigues, A. C. , Martorano, L. , Delgado, L. , … Gastauerg, M. (2018). Intensification of shifting cultivation reduces forest resilience in the northern Amazon. Forest Ecology and Management, 430, 312–320. 10.1016/j.foreco.2018.08.014 [DOI] [Google Scholar]
- Villa, P. M. , Martins, S. V. , Oliveira Neto, S. N. , Rodrigues, A. C. , Vieira, N. , Delgado, L. , & Cancio, N. M. (2018). Woody species diversity as an indicator of forest recovery after shifting cultivation disturbance in the northern Amazon. Ecologcal Indicators, 95, 687–694. [Google Scholar]
- Ziegler, A. D. , Phelps, J. , Yuen, J. Q. I. , Webb, E. L. , Lawrence, D. , Fox, J. M. , … Koh, L. P. (2012). Carbon outcomes of major land‐cover transitions in SE Asia: Great uncertainties and REDD+ policy implications. Global Change Biology, 18, 3087–3099. 10.1111/j.1365-2486.2012.02747.x [DOI] [PubMed] [Google Scholar]
Associated Data
This section collects any data citations, data availability statements, or supplementary materials included in this article.
Data Availability Statement
Additional data related to this study is available at Dryad Data Repository (https://doi.org/10.5061/dryad.nvx0k6dph).