

Abstract
Food safety criteria for Listeria monocytogenes in ready‐to‐eat (RTE) foods have been applied from 2006 onwards (Commission Regulation (EC) 2073/2005). Still, human invasive listeriosis was reported to increase over the period 2009–2013 in the European Union and European Economic Area (EU/EEA). Time series analysis for the 2008–2015 period in the EU/EEA indicated an increasing trend of the monthly notified incidence rate of confirmed human invasive listeriosis of the over 75 age groups and female age group between 25 and 44 years old (probably related to pregnancies). A conceptual model was used to identify factors in the food chain as potential drivers for L. monocytogenes contamination of RTE foods and listeriosis. Factors were related to the host (i. population size of the elderly and/or susceptible people; ii. underlying condition rate), the food (iii. L. monocytogenes prevalence in RTE food at retail; iv. L. monocytogenes concentration in RTE food at retail; v. storage conditions after retail; vi. consumption), the national surveillance systems (vii. improved surveillance), and/or the bacterium (viii. virulence). Factors considered likely to be responsible for the increasing trend in cases are the increased population size of the elderly and susceptible population except for the 25–44 female age group. For the increased incidence rates and cases, the likely factor is the increased proportion of susceptible persons in the age groups over 45 years old for both genders. Quantitative modelling suggests that more than 90% of invasive listeriosis is caused by ingestion of RTE food containing > 2,000 colony forming units (CFU)/g, and that one‐third of cases are due to growth in the consumer phase. Awareness should be increased among stakeholders, especially in relation to susceptible risk groups. Innovative methodologies including whole genome sequencing (WGS) for strain identification and monitoring of trends are recommended.
Keywords: ready‐to‐eat food products, Listeria monocytogenes, human listeriosis, time series analysis, quantitative microbiological risk assessment
Short abstract
This publication is linked to the following EFSA Supporting Publications article: http://onlinelibrary.wiley.com/doi/10.2903/sp.efsa.2018.EN-1352/full
Summary
Despite the application of the food safety criteria (FSC) for Listeria monocytogenes in ready‐to‐eat (RTE) foods from 2006 onwards (Commission Regulation (EC) 2073/20051), a statistically significant increasing trend of human invasive listeriosis was reported in the European Union and European Economic Area (EU/EEA) over the period 2009–2013 (EFSA and ECDC, 2015). In 2010–2011, an EU‐wide baseline survey (BLS) estimated the prevalence and concentration of L. monocytogenes in RTE foods at retail: packaged (not frozen) smoked or gravad fish, packaged heat‐treated meat products and soft or semi‐soft cheese. The EU‐level estimate of the proportion of samples with L. monocytogenes counts > 100 colony forming units (CFU) per gram at the end of shelf life was 1.7% for ‘RTE fish,’ 0.43% for ‘RTE meat’ and 0.06% for ‘RTE cheese.’
Therefore, the Panel on Biological Hazards of the European Food Safety Authority (EFSA) initiated a self‐tasking mandate to deliver a Scientific Opinion on L. monocytogenes contamination of RTE foods and the risk for human health in the EU. The Opinion draws conclusions on the two terms of reference (ToR): (1) to summarise and critically evaluate the most recent information on L. monocytogenes in RTE foods and (2) to discuss and evaluate the factors related to contamination in the food chain and the consumption patterns that may contribute to the reported trend of listeriosis incidence rates in the EU. The focus was on the time period after the adoption of the previous Scientific Opinion of the BIOHAZ Panel at the end of 2007, i.e. 2008–2015 (EFSA BIOHAZ Panel, 2008). The steps of a common risk assessment were used to structure the evidence in response to ToR 1.
For the ToR 1 in particular, the following sources were to be considered: (a) the above‐mentioned BLS and the monitoring data and (b) the three EFSA outsourcing activities under ‘Closing gaps for performing a risk assessment on L. monocytogenes in RTE foods,’ i.e. (i) the presence of, and risk factors for, L. monocytogenes in RTE foods in the EU, (ii) the estimation of the public health risks from consumption of various RTE food categories contaminated with L. monocytogenes and (iii) the comparison of L. monocytogenes isolates from different compartments along the food chain, and in humans using whole genome sequencing (WGS).
It is concluded that the overall pattern of listeriosis epidemiology has not changed since the previous Scientific Opinion. Despite an increase in confirmed invasive listeriosis cases during 2008–2015, fewer than 2,300 cases per year were reported in the EU/EEA. The notification rates of invasive listeriosis in the EU/EEA generally increased with increasing age, and were highest in the age groups over 65 years and in children below 1 year of age (i.e. mainly pregnancy‐related cases). In addition to age/susceptibility, medical practices for other ailments have been associated with increased risk factors for human listeriosis, such as treatments with proton pump inhibitors (PPI). Bloodstream infections were the most commonly reported clinical forms of invasive L. monocytogenes infections (71.8% of confirmed cases), followed by meningitis (19.4% of cerebrospinal fluid samples), and the overall annual case fatality rates (CFR) ranged from 12.7 to 20.5%.
There is ample evidence for a high variability regarding the virulence potential and pathogenicity of L. monocytogenes isolates. Epidemiological data combined with genetic sequencing information and results from animal models (> 6,000 isolates from clinical specimens and food items) indicate that 12 clonal complexes (CC) make up almost 80% of all isolates, and that different levels of virulence may be associated with these. Listeriosis is a food‐borne illness, but CCs have been termed, according to one study, ‘infection‐associated,’ ‘food‐associated’ or ‘intermediate’ depending on the relative proportion of isolates from clinical cases, food or both. Uncertainty may be associated with this classification due to knowledge gaps about factors influencing the isolation and detectability of different strains from different matrices. ‘Infection‐associated’ CCs are most commonly associated with central nervous system (CNS) and maternal–neonatal (MN) infections as opposed to bacteraemia alone, while ‘food‐associated’ CCs are rarely isolated from invasive form clinical samples but, when recovered from clinical specimens, usually isolated from blood. In addition, ‘food‐associated’ CCs are more frequently associated with highly immunocompromised patients or patients showing a higher number of severe comorbidities. Based on humanised mouse models, it appears that these predominately ‘food‐associated’ CCs are less invasive (hypovirulent) than the ‘infection‐associated’ CCs. However, despite the observed variability in their virulence potential, almost every L. monocytogenes strain has the ability to result in human listeriosis because of the complex interaction between the pathogen, food and host. When more data become available, e.g. on occurrence, virulence and dose response, it may be considered appropriate to carry out a risk assessment for different CCs of L. monocytogenes.
As most listeriosis cases appear to be sporadic, and reported outbreaks are usually small, it is difficult to establish links between human cases and causative foods. However, it has been shown that WGS techniques, when combined with epidemiological information, have the potential to attribute relatedness among L. monocytogenes strains and thus establish stronger links between human listeriosis cases and causative foods. Results from the outsourced study to attribute human cases to different animal sources are limited, as for source attribution in general, by the representativeness of isolates from all relevant sources but also by difficulties of identifying their origin, since contamination during processing is so important. Persistence of L. monocytogenes in food processing environments is still considered to be the major source of RTE food contamination. Persistence appears to be the result both of improper hygiene conditions and the high adaptive capacity of these bacteria against physical–chemical factors, for example, biofilm‐forming capacity.
The RTE food categories typically associated with human listeriosis, i.e. ‘meat and meat products,’ ‘fish and fish products,’ and ‘milk and milk products’ continue to be of significance from a food safety perspective. In addition, food of plant‐derived origin or even frozen foods have been implicated in outbreaks (e.g. cantaloupe, caramel apples, ice cream) illustrating that almost all RTE foods under certain conditions may support growth and/or that when consumed by highly susceptible people, have the potential to contribute to the burden of disease. During the period 2008–2015, reported annual non‐compliance of L. monocytogenes in RTE foods at processing sites was highest in ‘RTE fishery products’ (3–10%), followed by ‘RTE products of meat origin other than fermented sausage’ (1–7%). Non‐compliance in the remaining RTE food subcategories was 2% or less. The lower level of annual non‐compliance at retail (below 1% for most years) than at processing is at least partly explained by the application of different limits of FSC at retail and processing.
According to the BLS, as presented above, L. monocytogenes was more prevalent in ‘RTE fish’: 10.3% (1.7% above 100 CFU/g) than in ‘RTE meat’: 2.07% (0.43% above 100 CFU/g) and ‘RTE cheese’: 0.47% (0.06% above 100 CFU/g) at the end of their shelf life. Cooked meat and heat‐treated sausages were the RTE food subcategories with most consumed servings per person and per year in the EU/EEA. Combining the BLS data with consumption data indicates that approximately 55 million servings of RTE meat and meat products contaminated with more than 100 CFU/g may be consumed per year by the population over 75 years old in the EU/EEA.
It was noted that unsafe practices (including storage time and temperatures) are not uncommon within the elderly group (> 10% of persons studied), and have a potential impact on the human listeriosis risk. There is a wide variation within the broadly defined consumer groups and it is thus problematic to generalise about the food handling behaviours of these groups and in different Member States and on how this may contribute to trends of human listeriosis. In addition, the temperature of domestic refrigerators is highly variable as shown through a review of 23 available survey studies from 1991 to 2016. The mean, minimum and maximum temperatures ranged from < 5 to 8.1°C, −7.9 to 3.8°C and 11.4 to 20.7°C, respectively. The extent of different behaviours among risk groups between Member States may vary to the same extent that socioeconomic factors, traditions and types of food vary. There is uncertainty on the actual distribution in the EU because the studies were developed in a few countries only.
The average probability of a single L. monocytogenes CFU to cause illness in a specific host (the r value), reflects the strain virulence and host susceptibility, and ranges three orders of magnitude, from the least (i.e. under 65 years old without underlying condition) to the most susceptible (i.e. haematological cancer) subpopulations. Reported r values for specific outbreaks with highly susceptible populations increase the range by another five orders of magnitude. This means that the probability of a single CFU to cause illness may range 100 million times depending on variability in host susceptibility and L. monocytogenes virulence. This suggests that the impact of the health status of a consumer is equally important to consider as the level of L. monocytogenes in the ingested food. A US study applying a lognormal‐Poisson extension of the exponential dose–response (DR) model, incorporating the virulence and susceptibility variability for 11 population groups, suggests that most cases are. expected to be caused by highly contaminated food items (Pouillot et al., 2015b).
Most risk characterisations considered three risk populations (i.e. pregnant women/perinatals, the elderly (> 60 or > 65 years old), and the intermediate population that does not belong to either of these categories) and have not addressed gender differences. This limitation can be addressed in future EU/EEA risk assessments with DR data and other input data developed at a finer resolution in recent publications and in this Scientific Opinion. Developments to improve the capability to provide realistic predictions for growth initiation and changes in levels of L. monocytogenes growth in RTE foods include validated growth models, progress on cardinal growth, probability of growth, and non‐thermal inactivation models, together with data on strain variability and stochastic modelling.
Based on the quantitative risk characterisation of L. monocytogenes in various RTE food categories (heat‐treated meat; smoked and gravad fish; and soft and semi‐soft cheese) in the EU (outsourcing activity 2), it was concluded that most of the cases were predicted to occur in the elderly population (≥ 65 years old) (48% of cases) followed by the pregnant population (41%) and the healthy population < 65 years old (11%). The attribution of cases to the pregnant population appears to be an overestimation compared to the distribution of cases during the period, where about 8% of reported cases were related to the 25–44 year female age group. The overestimation is partially a result of the scope of the risk assessment and the application of a DR model considering only these three populations. Of the foods considered, the food subcategory associated with the largest number of cases per year was cooked meat (863 cases), followed by sausage (541 cases), gravad fish (370 cases), cold‐smoked fish (358 cases), pâté (158 cases), soft and semi‐soft cheese (19 cases) and hot‐smoked fish (7 cases). Estimated risks expressed as the median number of cases per 106 servings was in general highest for the pregnant population, followed by the elderly and last the healthy (< 65 years) population. Cases due to other food categories were not considered.
To address ToR 2, for the time period 2008–2015, time series analyses (TSA) of 14,002 confirmed human invasive listeriosis cases in the EU/EEA were carried out at different levels of aggregation, i.e. aggregated by total confirmed cases, and disaggregated by 14 age–gender groups. The aggregated TSA did not show an increasing trend while trends were shown in the disaggregated analyses (by age and gender). The discrepancy is partly a consequence of the presence of changing dynamics, autocorrelation and seasonality in the aggregated analysis.
For females, the incidence rate of confirmed human invasive listeriosis significantly increased for the 25–44 and ≥ 75 age groups in this time period with a monthly increase estimated at 0.64% and 0.70%, respectively. For the female age groups 45–64 and 65–74, the increasing trend was borderline significant with a monthly increase estimated at 0.43% and 0.30%, respectively. For males, the incidence rate of confirmed human invasive listeriosis cases increased significantly for the ≥ 75 age group only with a monthly increase estimated at 0.50%. In 2015, the invasive listeriosis incidence rate was higher for males than for females in the age groups over 45 years old. The opposite was true for the female age groups 15–24 and 25–44 believed to largely reflect pregnancy‐related listeriosis. The highest incidence rate was seen in the ≥ 75 age group in 2015, resulting in an incidence rate of 2.20 and 1.30 cases per month per million persons for males and females, respectively. There are several sources of uncertainty, which can lead to under‐ or overestimation of the observed trends. Because of the limitations of the available data, the analysis and understanding of trends were carried out using age and gender as proxies for susceptible populations or pregnant women and did not include countries as a covariate. This is a limitation and means that the observed trends may hide different trends among subgroups or be true for only a subset of the age–gender–country population.
Potential factors related to the human host, the food, the national surveillance systems, or the bacterium, to be addressed in ToR 2 to explain the epidemiological trend were identified via a conceptual model. The selected factors were evaluated as assessment questions (AQs) in three steps. First, an importance analysis was used to evaluate the most important factors and their potential impact on the number of predicted cases using a developed L. monocytogenes generic quantitative microbiological risk assessment (gQMRA) model. Second, the empirical evidence, i.e. the indicator data, was evaluated to investigate the support for a change in the factor during the time period. Third, an evidence synthesis of the TSA, the importance analysis, indicator data and the uncertainty analyses was made.
The gQMRA model was developed to reflect a generic RTE food consumed in the EU/EEA. Contamination of the RTE food at the moment of consumption was based on consumption data, growth properties, packaging, and empirical data on initial L. monocytogenes concentrations of the considered foods ‘RTE smoked and gravad fish,’ ‘RTE heat‐treated meat’ and ‘RTE soft and semi‐soft cheese’. The gQMRA model can be updated with additional food categories when data become available.
Based on this gQMRA model, 92% of invasive listeriosis cases for all age–gender groups are attributable to doses above 105 CFU per serving. Assuming an average serving size of 50 g, this would correspond to an average L. monocytogenes concentration in RTE foods above 2,000 CFU/g at the time of consumption. Still, a smaller proportion of cases are associated with the more frequently occurring RTE foods having a higher L. monocytogenes prevalence and lower L. monocytogenes levels. The frequency of exposure (i.e. the prevalence of L. monocytogenes in RTE food) over 25 years old appears to increase with age for both genders, due to differences in consumption patterns. Based on predictions of the gQMRA model, the expected number of invasive listeriosis cases per year is reduced by 37% (from 1,523 to 953) in the absence of growth after retail (i.e. at the consumer phase). This points to the possibility to control 63% of listeriosis cases via control prior to the retail phase.
Factors that may have contributed to the trends of human invasive listeriosis cases/incidence rates in the EU/EEA during 2008–2015 were classified, based on the potential impact when changing the factor according to modelling or other information, the degree of support from indicator data, and expert opinion, into probability scales as defined in the draft EFSA guidance on uncertainty (EFSA Scientific Committee, 2016).
The first likely (66–90%) factor was an increased proportion of susceptible persons in age groups over 45 years for both genders. The increasing trend in the female 25–44 age group (mainly pregnancy‐related) suggests that a factor other than susceptibility must have contributed since susceptibility is not expected to have changed in this population during the time period. The additional factor may be any of those evaluated and would likely contribute to the trend in all age groups but possibly to a varying degree. The second likely factor is an increased population size of the elderly and susceptible population (except in the female 25–44 age group which has decreased). This factor would only contribute to the number of invasive listeriosis cases but not the increase in incidence rates.
The factors considered as likely as not (33–66%) were an increased consumption (number of servings per person) of RTE foods in the EU/EEA as there is some support in the indicator data for an increase in the consumption frequency of RTE foods, e.g. cooked RTE foods and smoked salmon, but this is based on limited data and an improved surveillance of human invasive listeriosis in the EU/EEA as there have been some changes in the surveillance systems, in particular for some countries with a relatively high level of reporting.
Inconclusive factors were: (1) L. monocytogenes concentration in the three considered RTE food categories at retail; (2) L. monocytogenes prevalence in the three considered RTE food categories at retail; (3) L. monocytogenes virulence potential; (4) storage conditions (time and temperature) after retail of the three considered RTE food categories.
Thus, the increasing trend of listeriosis for some population groups may potentially be attributed to numerous factors which not only include the contamination levels in food, but also other factors, such as consumption, strain virulence, health status of consumer and demographic changes. This indicates the need for continuous review of the food safety management system in EU to achieve the appropriate level of protection.
Due to data limitations, the present evaluation of contributing factors was based on only three RTE categories which is a limitation of the assessment. The impact of this depends on the degree that the non‐considered foods would differ in terms of prevalence, initial contamination, growth, storage, consumption, etc., to those considered. Furthermore, since the analysis is carried out at EU/EEA level, and because there are many data gaps and wide variations between countries, the outcome at EU/EEA level may not be representative for all countries. Thus, MS are encouraged to apply the gQMRA model with their specific data.
Uncertainty is associated with the gQMRA model because of data and knowledge gaps. An important source of uncertainty is the DR relationship since it is dependent on the same data as used in the exposure assessment and the epidemiological data. However, the impact of uncertainty is expected to be lower for the importance analysis when the relative effects of factors were evaluated than for the absolute number predictions. Data gaps to conclude on contributing factors include representative data collected across the EU/EEA using a harmonised sampling strategy suitable for surveillance over time on: (1) prevalence and concentration of L. monocytogenes in RTE foods; (2) consumption of RTE foods; (3) prevalence of underlying conditions in different risk groups by age and gender; (4) retail and home storage temperatures and (5) L. monocytogenes virulence.
It was recommended that awareness be raised among all stakeholders in the food chain, including vulnerable groups, people supplying food to vulnerable groups, caterers, RTE producers and authorities, about the potentially increasing problem of L. monocytogenes in RTE foods since the proportion of citizens in high‐risk groups is expected to increase in the EU/EEA. The implementation of innovative programmes to generate data (i.e. prevalence and concentration, preferably coupled with sequencing) on L. monocytogenes in RTE foods (not only the classical food categories) that are comparable across Member States and time in the EU was also recommended; existing monitoring has other objectives and is not appropriate for evaluating trends over time. To enable a better assessment of compliance by food business operators (FBO) with the FSC for L. monocytogenes of RTE food categories according to Commission Regulation (EC) No 2073/2005, it is recommended to improve the monitoring and/or surveillance data reporting at EU level. A further recommendation is to address the need for data to evaluate changes over time in the consumption of RTE foods and other food categories in the EU. Also, improvement of the information for risk assessment and risk management was recommended. This can be achieved by improving the collection and reporting of data on human listeriosis including underlying conditions (e.g. pregnancy, different types of cancer, renal or liver failure) and by collection of data on consumption habits and food handling practices of susceptible populations, especially the elderly, as well as socioeconomic–demographic data. The use of next generation sequencing (NGS)/WGS should be promoted in routine epidemiological surveillance of food and humans to improve the detection of outbreaks, the understanding of the distribution of different virulent strains in food and to enable better source attribution. Finally, the gQMRA model should be applied with additional food categories when data become available and MS are encouraged to apply the gQMRA model and TSA model with their specific data.
1. Introduction
1.1. Background and Terms of Reference (ToR) as provided by the requestor
On 1 January 2006, Commission Regulation (EC) 2073/20051 became effective for all European Union (EU) Member States defining, among others, new food safety criteria (FSC) for Listeria monocytogenes in ready‐to‐eat (RTE) foods.
An EU‐wide baseline survey (BLS) was conducted in 2010 and 2011 to estimate the prevalence and contamination levels of L. monocytogenes in three RTE foods at retail in accordance with Decision 2010/678/EU2: packaged (not frozen) smoked or gravad fish (3,053 samples), packaged heat‐treated meat products (3,530 samples) and soft or semi‐soft cheese (3,452 samples). This survey showed levels of compliance with the FSC for the selected groups of RTE foods as follows: 98.3%, 99.5% and 99.9% for fish, meat and cheese samples, respectively (EFSA, 2013, 2014a).
Despite the application of the new FSC for L. monocytogenes from 2006 onwards and the level of compliance for certain RTE foods in the BLS, 27 Member States reported 1,763 confirmed human cases of listeriosis and 191 deaths in 2013. The EU notification rate was 0.44 cases per 100,000 population in 2013 which represented an 8.6% increase compared with 2012. A statistically significant increasing trend of listeriosis was reported in the European Union and European Economic Area (EU/EEA) over the period 2009–2013 (with 1,615, 1,663, 1,515, 1,644, 1,763 confirmed cases reported in 2009, 2010, 2011, 2012 and 2013, respectively (EFSA and ECDC, 2015)). The surveillance report from the European Centre for Disease Prevention and Control (ECDC) provides an overview of the epidemiological situation during the period 2010–2012 of the seven food‐ and waterborne diseases in the EU, including listeriosis. The notification rates of listeriosis increased rapidly by age in the older age groups (over 65 years). It was noted that male cases were predominant in groups over 45 years of age. Their risk of infection was twice as high as the risk for women in the same age group (ECDC, 2015). In 2013, a total of 12 Listeria outbreaks were reported by seven Member States. This was more than in previous years (eight and nine outbreaks in 2011 and 2012, respectively, EFSA and ECDC (2015)).
Three EFSA outsourcing activities are currently ongoing3 under ‘Closing gaps for performing a risk assessment on L. monocytogenes in RTE foods.’ The first activity aims to perform a systematic review on L. monocytogenes in a wide range of RTE foods to gain knowledge on the available evidence on the presence of L. monocytogenes in RTE foods in the EU and the risk factors for contamination of RTE foods. In the second activity, a quantitative risk characterisation on L. monocytogenes in RTE foods, starting from the retail stage, will be developed to estimate the public health risks from consumption of various RTE food categories contaminated with L. monocytogenes. In the third activity, whole genome sequencing (WGS) will be applied to compare isolates from different compartments along the food chain and from humans.
The Panel on Biological Hazards (BIOHAZ Panel) is requested by EFSA to issue a Scientific Opinion on L. monocytogenes contamination of RTE foods and the risk for human health in the EU. In particular, the BIOHAZ Panel is requested:
To summarise and critically evaluate the most recent information on L. monocytogenes in RTE foods, and in particular from the following sources: (a) EU‐wide baseline survey and monitoring data and (b) the three ongoing EFSA outsourcing activities, i.e. (i) the presence of, and risk factors for, L. monocytogenes in RTE in the EU, (ii) an estimation of the public health risks from consumption of various RTE food categories contaminated with L. monocytogenes and (iii) the comparison of isolates from different compartments along the food chain, and in humans using whole genome sequencing (ToR 1).
To discuss and evaluate the factors related to the contamination in the food chain and the consumption patterns that may contribute to the reported trend of listeriosis incidence (rates) in the EU (ToR 2).
1.2. Interpretation of the ToR
The definition of RTE food in Commission Regulation (EC) No 2073/20054 on microbiological criteria for foodstuffs was used: ‘Food intended by the producer or the manufacturer for direct human consumption without the need for cooking or other processing effective to eliminate or reduce to acceptable level microorganisms of concern’.
The focus of this Scientific Opinion is on invasive listeriosis and the time period after the adoption of the previous Scientific Opinion of the BIOHAZ Panel at the end of 2007 (EFSA BIOHAZ Panel, 2008), i.e. 2008–2015. For the ToR 2, it was decided to consider the EU/EEA instead of the EU. Control and intervention measures are outside the scope of the mandate.
Trend is defined as a monthly change in the number of human invasive listeriosis cases or invasive human listeriosis incidence rates over time, not just a change of the incidence rates between the start and the end of the time period considered.
1.3. Additional information
1.3.1. Additional background information
Transmission routes of Listeria monocytogenes in RTE foods
Listeria monocytogenes is a ubiquitous organism that is widely distributed in the environment. As shown in the overview of the transmission routes and the food safety control system of L. monocytogenes in RTE foods (Figure 1), there are a number of contamination routes whereby L. monocytogenes can enter the RTE food chain.
Figure 1.
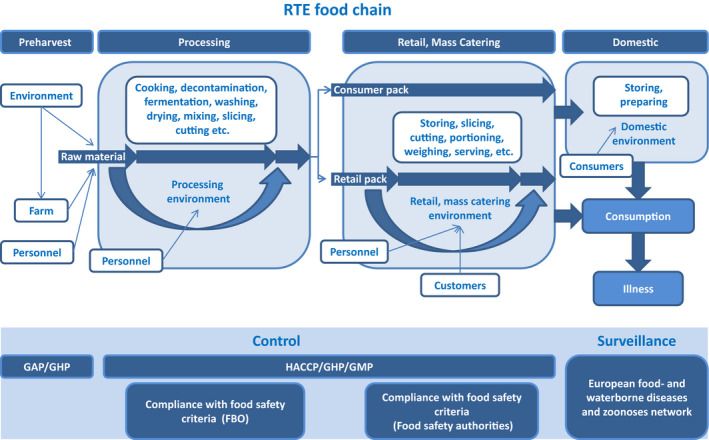
- FBO: food business operator; GAP: good agricultural practice; GHP: good hygiene practices; GMP: good manufacturing practices; HACCP: hazard analysis and critical control points; RTE: ready‐to‐eat.
- Consumer pack: food packs that are not processed during retail; retail pack: food packs that are further processed (i.e. sliced) during retail.
Soil and water are considered to be the primary sources of L. monocytogenes for transmission to plant material, feed, animals and the food chain (Linke et al., 2014). The pathogens can survive in the soil for months and even grow in favourable conditions (Dowe et al., 1997). The farm environment is frequently contaminated with L. monocytogenes, and is an important natural source for raw material contamination (Nightingale et al., 2004). The raw material from primary production entering the process is considered of great importance for the presence of the pathogen in the finished product. Indeed, the higher the pathogen concentration in the raw material, the more effective the control processes need to be in order to reduce concentrations to acceptable levels. In addition, the potential for contamination and persistence in the processing environment increases with increasing concentration of L. monocytogenes in the raw material entering the process.
RTE food processing may involve, among other processes, comminution, addition of flavourings, binders, extenders and emulsifiers, etc., addition of preservatives (e.g. lactate, sodium nitrite), decontamination (water, acid), heating (e.g. pasteurising, cooking, baking, boiling, steaming), curing, smoking (hot or cold), fermentation and drying. Most of these steps have the potential to reduce pathogen loads on the RTE food at the time of consumption through microbial inactivation or inhibition of growth. The effectiveness of the control measures depends on the type of food and design of the process. In the case of a mild process (i.e. washing), the pathogen may survive while more intense or severe processes (i.e. sufficient heating) may lead to the elimination of the pathogen. RTE foods may also become re‐contaminated during further processing and handling. In the latter case, increased handling leads to a higher probability of contamination (Angelidis and Koutsoumanis, 2006). Sources of contamination may be food contact surfaces, processing machinery and workers. Contamination with L. monocytogenes after heat processing during further handling is one of the most important occasions of contamination. This is due to the capability of L. monocytogenes to form biofilms which may result in enhanced resistance to disinfectants and antimicrobial agents.
RTE foods can be packed aerobically, under vacuum or modified atmosphere conditions. Packaging atmosphere can affect the growth of the pathogen during storage and hence the final risk. In addition, the amount of growth of L. monocytogenes can be affected by the assigned use‐by date since this is likely to affect the storage time of the product.
Following packaging, RTE foods are transported to retail or mass catering stores. Contamination of RTE food in packages that are opened and handled in retail stores (chubs, bricks, etc.) can also happen. According to Lakicevic and Nastasijevic (2017), food retail and mass catering ‘establishments are very different from food processing plants. They are open to the public, with customers, sales people, employees, and deliveries coming into the establishment’. This may trigger ‘the introduction of L. monocytogenes at various points and times of the day’. L. monocytogenes strains are regularly found and often widely distributed in retail facilities (Gombas et al., 2003; Pradhan et al., 2011). Retail practices may result in cross‐contamination from one RTE product to another, through contamination from the retail environment, or from both (FSIS and FDA, 2013). The persistence of L. monocytogenes in a particular environmental site (i.e. slicing machine) at retail can be a ‘niche’ that may facilitate continued cross‐contamination of products from environmental sources. Survey studies reported that RTE deli meats handled at retail stores have, in general, higher contamination than prepackaged products, indicating the possibility of cross‐contamination at retail level (Gombas et al., 2003; Pradhan et al., 2011; FSIS and FDA, 2013).
Food can also become contaminated at the domestic level. Sources may be open RTE packages that are often stored for extended periods in the home refrigerator or other niches in the kitchen. This suggestion is supported by isolations of L. monocytogenes from different kitchen environments (Evans and Redmond, 2016a).
Growth of L. monocytogenes is among the most important factors affecting the risk of human listeriosis associated with consumption of RTE foods. Growth may occur both in foods and in the environment (biofilms). RTE foods are a broad and diverse food category, some of which support growth of L. monocytogenes and others that do not support growth or even result in microbial inactivation in specific storage and shelf life conditions. Factors affecting L. monocytogenes growth mainly include the product characteristics (pH, aw, concentration of antimicrobials), storage temperature and time. The microstructure of the food matrix can also affect the growth by imposing physical constraints on microorganisms, by limiting the diffusion of essential nutrients and oxygen or by preventing the diffusion of metabolic products (Aspridou et al., 2014). The concentration of the pathogen at the time of consumption can be significantly affected by the lag phase duration. The latter is affected by the physiological state of the cells and is determined both by the growth environment (food) and the environment where cells were exposed before the contamination event (Robinson et al., 1998). The presence of competitive microflora is an additional factor that can affect growth (Mejlholm and Dalgaard, 2015). Indeed, several studies have shown that the presence of lactic acid bacteria have an inhibiting effect on L. monocytogenes. For example, in Norway, a study found that indigenous lactic acid bacteria acted as a protective culture in cooked meat products that were sliced and either vacuum or gas packed (Bredholt et al., 1999). Winkowski et al. (1993) describe the inhibitory effect of Lactobacillus bavaricus in three beef foods. The effect is based on the production of bacteriocin and less to the acidification. Inhibition of L. monocytogenes by lactic acid bacteria may also be the result of their competition due to the so‐called Jameson effect, which is expressed as growth cessation of L. monocytogenes when lactic acid bacteria reach a critical population density markedly higher than L. monocytogenes (Lardeux et al., 2015). Finally, growth of L. monocytogenes can also be strain dependent and contamination with a faster‐growing strain can lead to higher concentration of the pathogen at the time of consumption (Whiting and Golden, 2002). Variability both in the growth rate and growth limits of strains may influence the growth potential of L. monocytogenes in foods (Aryani et al., 2015a). Nonetheless, existing reports on ranking the factors that affect the variation of L. monocytogenes levels at the time of consumption, by global sensitivity analysis, have ranked the impact of the variability in growth limits lower than that of temperature and duration of storage, product characteristics, initial contamination levels and physiological state of cells (Ellouze et al., 2010; Duret et al., 2014).
Control of Listeria monocytogenes in ready‐to‐eat foods
Many of the processes, routes and factors described above are monitored and controlled throughout the food chain (Figure 1). The public health risk from L. monocytogenes in RTE food also depends on the effectiveness of the control and monitoring procedures which include good agricultural practice at the farm stage and the hazard analysis and critical control points (HACCP) programme and good hygiene practices (GHP) at the processing and retail stages as well as sampling procedures to evaluate compliance with the FSC for L. monocytogenes. These are laid down in Commission Regulation (EC) No 2073/20051 on microbiological criteria for foodstuffs. This Regulation came into force in January 2006 and requires the following:
In RTE products intended for infants and for special medical purposes, L. monocytogenes must not be present in 25 g of sample (10 sample units);
L. monocytogenes must not be present in levels exceeding 100 colony forming units per gram (CFU/g) during the shelf life of other RTE products (five sample units); and
In RTE foods that are able to support the growth of the bacterium, L. monocytogenes must not be present in 25 g of sample at the time of leaving the production plant (five sample units); however, if the producer can demonstrate, to the satisfaction of the Competent Authority (CA), that the product will not exceed the limit of 100 CFU/g throughout its shelf life, this criterion does not apply.
For more information, see Appendix A. In this Regulation, RTE food is defined, as mentioned in Section 1.2) as ‘Food intended by the producer or the manufacturer for direct human consumption without the need for cooking or other processing effective to eliminate or reduce to acceptable level microorganisms of concern’.
There are several guidance documents available on L. monocytogenes in RTE foods. The guidance document on L. monocytogenes shelf life studies for RTE foods5 aims to guide RTE producers in identifying the L. monocytogenes‐associated risk in their RTE foods and to provide general principles on when and which shelf life studies are needed. It may also be used by CAs to verify the implementation of shelf life studies. The EU Reference Laboratory for Listeria monocytogenes (EURL Lm) technical guidance document on shelf life studies for L. monocytogenes in RTE foods6 provides specialised laboratories with detailed and practical information on how to conduct shelf life studies (especially durability studies and challenge tests) for L. monocytogenes in RTE foods. The EURL Lm guidelines on sampling the food processing area and equipment for the detection of L. monocytogenes 7 describe sampling procedures to be performed by food business operators manufacturing RTE food which may pose an L. monocytogenes risk for public health in order to detect L. monocytogenes on the surfaces of RTE food processing areas and equipment.
The EURL Lm Guidance Document to evaluate the competence of laboratories implementing challenge tests and durability studies related to L. monocytogenes in RTE foods is being revised. The aim of this guidance document is to set up a harmonised approach to evaluate the competence of laboratories conducting shelf‐life studies (challenge tests and durability studies) and it is intended for use by CAs, NRLs and other organisations that are involved in assessing whether laboratories are competent to conduct shelf‐life studies related to L. monocytogenes. This document will serve as a tool to implement footnote 5 to criterion 1.2 of the abovementioned regulation, which specifies that manufacturer shall be able to demonstrate, to the satisfaction of the CA, that the product will not exceed the limit 100 CFU/g throughout the shelf‐life.
Previous Scientific Opinion of the BIOHAZ Panel
The previous Scientific Opinion of the BIOHAZ Panel was prepared in response to a request from the European Commission to update the scientific literature from a former Opinion of the Scientific Committee on Veterinary Measures relating to Public Health on the L. monocytogenes risk related to RTE foods, and to provide scientific advice on different levels of L. monocytogenes in RTE foods and the related risk for human illness (EFSA BIOHAZ Panel, 2008). The Panel concluded that, after a general decline in the 1990s, the number of human listeriosis cases in Europe had increased since 2000. The disease was found to be associated with pregnancy, but it was predominantly associated with immunocompromised persons among those over 60 years old. No routine methods permitted the differentiation between virulent and avirulent L. monocytogenes strains. The foods which could be associated with transmission of human listeriosis were mostly RTE foods that support L. monocytogenes growth. Surveys of foods had not only collected data on the prevalence and contamination levels of L. monocytogenes in different food types, but also revealed associations with other parameters including: food packaging type, preparation practices (e.g. the use of slicing machines for meat products), storage temperatures, the stage of sampling with respect to shelf life, the lack of an effective HACCP system, and the lack of education and training for food handlers. Growth of L. monocytogenes was pointed out to be a function of the type of food and the storage time and temperature. Storage temperature in retail and domestic refrigerators was found to vary significantly, especially for the latter. Application of microbiological criteria was considered as one of several management activities to ensure that RTE foods presented a low risk to public health. The Panel concluded that such criteria would assist the control of L. monocytogenes levels, e.g. absence in 25 g or ≤ 100 CFU/g at the point of consumption. The available risk assessments at that time had concluded that most human listeriosis cases were due to foods markedly above the latter limit. The most recent Codex document on microbiological criteria for L. monocytogenes in RTE foods suggested a zero tolerance throughout the shelf life of the RTE foods in which growth can occur. The Opinion raised a concern that the application of a zero‐tolerance criterion close to the end of shelf life could classify products as unsatisfactory, although they would be of low risk. An additional option proposed in the Codex document was to tolerate 100 CFU/g throughout the shelf life provided that the manufacturer is able to demonstrate that the product will not exceed this limit throughout the shelf life. For RTE foods that support L. monocytogenes growth, the Opinion stated that it is impossible to predict with a high degree of certainty that the level will or will not exceed 100 CFU/g during their shelf life. Thus, applying this option may result in accepting a probability that those foods with > 100 CFU/g will be consumed. The impact on public health would depend on whether levels markedly higher than 100 CFU/g were reached. The Opinion identified a need for more thorough investigations of sporadic and outbreak cases of human listeriosis, as well as for consumption data on RTE foods that support growth of L. monocytogenes, in order to better assess the risk and improve knowledge of the foods associated with human listeriosis. It was recommended that comparisons between studies (e.g. surveys) should only be made when similar sampling strategies had been applied and that studies should focus on RTE foods able to support L. monocytogenes growth. In addition to microbiological criteria, the consistent application of GHP in combination with HACCP was stressed as important to minimise the initial contamination at manufacturing level, and/or to reduce the potential for L. monocytogenes growth. The integrity of the chill chain, especially at the domestic level, as well as advice on diets and food storage (particularly for the elderly) were identified as areas for improvement to reduce the risk of human listeriosis.
Outsourcing activities under ‘Closing gaps for performing a risk assessment on L. monocytogenes in RTE foods’
In 2014, EFSA decided to outsource three activities under ‘Closing gaps for performing a risk assessment on L. monocytogenes in RTE foods’:
activity 1: an extensive literature search and study selection with data extraction on L. monocytogenes in a wide range of RTE foods;
activity 2: a quantitative risk characterisation on L. monocytogenes in RTE foods, starting from the retail stage; and
activity 3: the comparison of isolates from different compartments along the food chain, and in humans using whole genome sequencing (WGS) analysis.
The first activity had as general objective to perform an extensive literature search to describe:
the occurrence and levels of contamination of L. monocytogenes in RTE foods (review question 1); and
the risk factors for the L. monocytogenes contamination in different RTE foods (review question 2).
The contract resulting from a negotiated procedure was awarded to a consortium with the Institut de Recerca i Tecnologia Agroalimentàries (IRTA) as leader and the University of Cordoba (UCO) as partner (NP/EFSA/BIOCONTAM/2015/04 – CT1). A report was published as the outcome of this activity and will be referred to throughout this document as Jofré et al. (2016). This activity followed up the work of a former procurement containing a protocol that included the literature search strategy and study selection criteria (at level 1 relevance screening) used for both review questions (RC/EFSA/BIOCONTAM/2014/01).
The overall objective of the second activity was to provide EFSA with a quantitative risk characterisation of L. monocytogenes in various RTE food categories in the EU, starting from the retail stage. The contract resulting from an open call for tender was awarded to a consortium with UCO as leader and IRTA as partner (OC/EFSA/BIOCONTAM/2014/02 – CT1). A report was published as the outcome of this activity and will be referred to throughout this document as Pérez‐Rodríguez et al. (2017). The specific objectives were:
to carry out a search and critically review data and existing microbial risk assessments on listeriosis and L. monocytogenes in RTE foods (hazard identification);
to determine the exposure of humans in the EU to L. monocytogenes from consumption of various RTE food categories (exposure assessment);
to assess the potential for L. monocytogenes to cause illness in human populations (hazard characterisation/dose–response (DR)); and
to apply an appropriate model, integrating exposure and DR models, in order to estimate the public health risks from consumption of various RTE food categories contaminated with L. monocytogenes (risk characterisation).
The third activity had as overall objective to compare L. monocytogenes isolates collected in the EU from RTE foods, compartments along the food chain and humans using WGS analysis. The contract resulting from an open call for tender was awarded to a consortium with the Statens Serum Institut (Copenhagen, Denmark) as leader with three partners (French Agency for Food, Environmental and Occupational Health and Safety (ANSES), Maisons‐Alfort, France; Public Health England, London, United Kingdom and the University of Aberdeen, Aberdeen, United Kingdom) (OC/EFSA/BIOCONTAM/2014/01 – CT 1). A report was published as the outcome of this activity and will be referred to throughout this document as Møller Nielsen et al. (2017). The specific objectives were:
to carry out the molecular characterisation of a selection of L. monocytogenes isolates from different sources, i.e. RTE foods, stages along the food chain (e.g. food‐producing animals, food processing environments) and humans, employing WGS analysis.
-
to analyse the WGS typing data of the selected L. monocytogenes isolates with three goals:
-
–
to explore the genetic diversity of L. monocytogenes within and between the different sources and human origin;
-
–
to assess the epidemiological relationship of L. monocytogenes from the different sources and of human origin considering the genomic information and the metadata available for each isolate; and
-
–
to identify the presence of putative markers conferring the potential to survive/multiply in the food chain and/or cause disease in humans (e.g. virulence and antimicrobial resistance).
-
–
to perform a retrospective analysis of outbreak strains (i.e. using a subset of epidemiologically linked human and food isolates) to investigate the suitability of WGS as a tool in outbreak investigations.
1.3.2. Approach to answer the ToR
The approach to answer the ToRs is presented in Figure 2.
Figure 2.
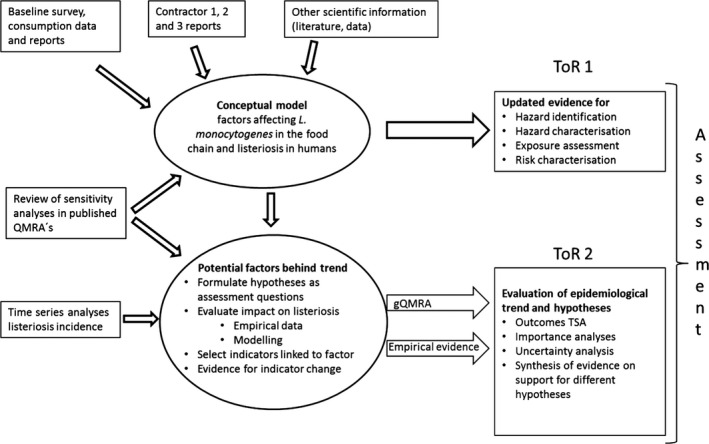
- gQMRA: generic quantitative microbiological risk assessment; ToR: terms of reference; TSA: time series analyses.
Terms of reference 1
The approach taken to answer to ToR 1 was to provide an update of the previous Scientific Opinion of the BIOHAZ Panel (EFSA BIOHAZ Panel, 2008) with a focus on new information, especially from the sources mentioned in the mandate. The new information was critically evaluated and summarised into descriptions of current knowledge so as to be able to support conclusions and to identify knowledge gaps. In addition, the contractors supplying the information were given feedback during their work to support their efforts and to ensure that useful information was obtained as input to the present Scientific Opinion.
Terms of reference 2
The approach taken to answer to ToR 2 was to analyse the trend of human invasive listeriosis ‘notification rates’ (i.e. notified incidence rates) in the EU/EEA in detail and to evaluate key factors and hypotheses that may contribute to this trend. A time series analysis (TSA) of human invasive listeriosis in the EU/EEA was carried out at different levels of aggregation, e.g. aggregated by total confirmed cases, and disaggregated by age–gender groups. Based on the new information highlighted in the ToR 1, and other relevant information, a conceptual model of factors and processes of relevance for transmission of L. monocytogenes in the food chain and for the reported incidence rates of human illness via RTE foods was developed. The outcome of the TSA analysis, combined with the conceptual model, a review of sensitivity analyses from published risk assessments, and the reports of the three outsourcing activities, was the basis for identifying factors in the food chain to address in ToR 2 as possibly important drivers for L. monocytogenes contamination of RTE foods and reported human listeriosis illness. The identified factors/hypotheses were formulated as assessment questions (AQs)8 and were then evaluated either qualitatively or quantitatively by combining evidence from risk assessment modelling, indicator data (i.e. empirical data linked to explanatory factors and that indicate any changes in the factor of interest), and the TSA. The partial food chain from retail to consumption was modelled and the influence of factors earlier in the chain was considered through their effects on prevalence and concentration at retail.
2. Data and methodologies
2.1. Data
2.1.1. Human data
ECDC data on cases of human listeriosis
Human cases of invasive listeriosis are reported by EU Member States and EEA countries in accordance with Decision No 1082/2013 on serious cross‐border threats to health, repealing Decision No 2119/98/EC9. The cases are reported annually to The European Surveillance System (TESSy) in accordance with the EU case definition for listeriosis.10 Due to differences in national surveillance systems, the level of under‐reporting and under‐ascertainment by diseases is not known. Therefore, ECDC prefers to calculate notification rates per 100,000 population, which are based on the reporting of official national data to TESSy. The notification rate is the closest estimate to a population‐based incidence rate in the EU/EEA. In this Scientific Opinion, the wording ‘notification rate’ is used when references are made to the published EU‐wide data originating from TESSy, while the wording ‘notified incidence rate’ or simply ‘incidence rate’ is used in the TSA.
The number of reporting countries increased from 29 to 30 in 2013 when Croatia joined the EU and started to report data from 2012. Between 2008 and 2015, the national surveillance systems were comprehensive in 27 countries (28 from 2012). Partial population coverage was reported in Spain and Belgium throughout the whole 8‐year period. The partial population coverage improved in Spain from 25% in 2008–2012 to 45% in 2015 (EFSA and ECDC, 2015). The human data are published annually in the EU summary reports11 and are available in the interactive Surveillance Atlas12 on the ECDC website. In addition, annual epidemiological reports are published on the ECDC website.13
For the TSAs, monthly data on human invasive listeriosis cases by country, age groups (< 1, 1–4, 5–14, 15–24, 25–44, 45–64, 65–74, ≥ 75) and gender were extracted from TESSy for the period 2008–2015 (N = 15,026). Bulgaria reported only aggregated data for all years, and thus could not be included in the TSA data set. Three countries (Croatia, Lithuania and Portugal) were excluded due to incomplete year‐coverage of reported case‐based data for the whole 8‐year study period (72 cases excluded). Cases with missing data for age group, gender and/or month were excluded (N = 169). Cases below one year were excluded from the TSA because they were mainly assumed to be related to pregnancies, i.e. diagnosed within one month after delivery, and the reporting of mother‐child pairs varied largely by countries (N = 633 cases). A revision of the EU case definition is ongoing and in the proposed EU case definition, the pregnancy‐related cases will be better distinguished from other cases. Finally, remaining cases reported as ‘probable,’ ‘possible’ or with ‘unknown’ classification were excluded (N = 150). The final data set for the TSA consisted of 14,002 confirmed human listeriosis cases for 2008–2015 from 24 EU Member States and two EEA countries (Iceland and Norway).
For serogroup–outcome (death/alive) analyses, case‐based TESSy data from 2007 to 2015 were used. The reporting of serogroups by polymerase chain reaction (PCR) typing was introduced to EU‐level surveillance in 2012. Between 2012 and 2015, an increasing number of countries have moved from conventional serotyping to PCR‐ based genoserogrouping. To address this reporting change in the data set, the serotypes were grouped under the four serogroups following the published and accepted scheme and the term ‘serogroup’ in this Scientific Opinion covers both conventional and PCR‐based serogrouping (Doumith et al., 2004):
1/2a + 3a = IIa;
1/2b + 3b = IIb;
1/2c + 3c = IIc; and
4b + 4d,e = IVb.
The case numbers with serogroups IIb and IIc were relatively low which did not make it possible to perform meaningful analyses. As the serogroups IIa and IVb constituted 87% of all reported serogroups, the outcome analyses were performed with these two serogroups only. The final pooled data set for ‘outcome’ and serogroup IIa and IVb analyses consisted of 3,308 confirmed cases from 15 countries (14 EU Member States and Norway).
Trends by serogroup were analysed for IIa and IVb over the period 2008–2015. Inclusion criteria required that a Member State had reported serotype or serogroup data throughout the whole study period. The trends of serogroups were described by year with a mean and 95% confidence interval (CI) for four Member States.
Data on food‐borne outbreaks caused by Listeria
Within the framework of the EU Zoonoses Directive 2003/99/EC14, the EU Member States are required to submit data on the occurrence of zoonoses, zoonotic agents, antimicrobial resistance and food‐borne outbreaks. EFSA, in collaboration with ECDC, coordinates the collation and analysis of these data to produce the annual EU summary reports11 which include data on food‐borne outbreaks. The latter represents the most comprehensive set of data available at an EU level for assessing the burden of food‐borne outbreaks in the EU/EEA and the related contributing risk factors. Data on ‘strong evidence’ food‐borne outbreaks caused by Listeria from 2008 to 2015 were extracted from the EFSA zoonoses database. For these ‘strong evidence’ outbreaks, more detailed information is collected than for the ‘weak evidence’ food‐borne outbreaks, including food vehicle and its origin, nature of evidence linking the outbreak cases to the food vehicle, extent of the outbreak, place of exposure, place of origin of the problem and contributory factors. The technical specifications for harmonised reporting of food‐borne outbreaks through the EU reporting system, in accordance with the abovementioned EU Zoonoses Directive can be found in EFSA (2014b).
Eurostat data on European demographic statistics
The Statistical Office of the EU (Eurostat) collects data from EU Member States in relation to populations as of 1 January each year under Regulation 1260/201315 on European demographic statistics. The recommended definition is the ‘usually resident population’ and represents the number of inhabitants of a given area on 1 January of the year in question (or, in some cases, on 31 December of the previous year). However, the population provided by the countries can also be based either on data from the most recent census adjusted by the components of population change produced since the last census, or on population registers. Data were extracted from the ‘Population on 1 January by age and gender’ (demo_pjan16) database on 16 August 2016. Data were selected considering ‘AGE’ by selection of all ages (less than one year, 1 year, 2 years, 3 years, …, 99 years, open‐ended age class), ‘GEO’ by selection of the EU Member States, ‘SEX’ by selecting males and females and ‘TIME’ by selecting years 2008–2015. Then, these data have been aggregated to derive the gender–age groups corresponding to those selected for the ECDC data on cases of human listeriosis (see above). The open‐ended age class contains all the people aged more than the last single age for which a country can report. For example, if a country can provide data on its population by single year of age up to 94 years old, the open‐ended age class contains the population 95 years old and over. There were only open‐ended age classes over 75 years reported, and hence, this did not have an impact on the aggregated data. Data were extracted from the ‘Fertility’ (t_demo_fer16) database on 17 November 2017.
EU/EEA data on underlying conditions
The number of adults (> 15 years) living with human immunodeficiency virus infection (HIV) in the EU/EEA was estimated by ECDC using their modelling tool17 and HIV and acquired immune deficiency syndrome (HIV/AIDS) surveillance data on newly diagnosed cases through 2015 which is published in the annual surveillance reports18 (Pharris et al., 2016). The number of women and men or persons within age groups has been estimated by ECDC for the purposes of this Scientific Opinion by applying the proportions of all cumulative cases diagnosed within the EU (i.e. proportions of males and females by age group 15–64 and ≥ 65 years) to the overall figure.
Data on reported type‐2 diabetes in the EU/EEA stratified by age from 20–79 in the years 2011, 2013 and 2015 has been provided by the International Diabetes Federation19 (Brussels, Belgium).
The absolute number of live births (births of children that showed any sign of life) was extracted from the ‘t_demo_fer’ database20 on 17 November 2016. The proportion of pregnant women was derived by calculating the number of live births × 9/12.
The Global Health Data Exchange website21 was used to extract data on neoplasms, cirrhosis and other chronic liver diseases, chronic kidney disease, and HIV/AIDS in western Europe by gender and for the following age classes: < 5 years, 5–14 years, 15–49 years, 50–69 years and over 70 years old.
2.1.2. Data on Listeria monocytogenes contamination of ready‐to‐eat (RTE) foods
EU‐wide baseline survey data
An EU‐wide baseline survey was conducted in 2010 and 2011 to estimate the EU prevalence (and contamination levels) of L. monocytogenes in three RTE food categories, in samples selected at random at retail level in accordance with Decision 2010/678/EU2: packaged (not frozen) smoked or gravad fish (3,053 samples), packaged heat‐treated meat products (3,530 samples) and soft or semi‐soft cheese (3,452 samples). The survey specifications defined particular subsets of food products to be sampled, specifically (i) RTE fish which were hot smoked or cold smoked or gravad, were not frozen, and were vacuum, or modified atmosphere, packaged; (ii) RTE meat products which had been subjected to heat treatment, and were then vacuum, or modified atmosphere, packaged; (iii) RTE soft or semi‐soft cheese, excluding fresh cheese. This category includes smear‐ripened, mould‐ripened, brine‐matured or otherwise ripened cheese, and concerns cheese made from raw, thermised or pasteurised milk of any animal species. The cheese could be packaged, or unpackaged at retail but packaged at the point of sale for the consumer. Only packaged and intact (sealed) packages, packaged by the manufacturer, were to be collected for sampling. Samples had to be taken at random from the customer display and must weigh at least 100 g each. However, in the case of cheese and meat products, products packaged at the retail outlet could also be collected for sampling. A proportionate stratified sampling scheme was followed to allocate the number of samples to each Member State approximately according to the size of their human population. It should be noted that when reference is made in this Scientific Opinion to ‘RTE fish,’ ‘RTE meat’ and ‘RTE cheese,’ the above specifications apply.
Detailed information about the study can be found in two reports describing the results of this survey (EFSA, 2013, 2014a). In the latter, multiple‐factor analysis (generalised estimating equations) was used to investigate the statistical association between several factors on which information was gathered during the BLS, and two outcomes: prevalence of L. monocytogenes and proportion of samples with counts exceeding 100 CFU/g, in the surveyed fish and meat products.
EFSA monitoring data
The monitoring data collected by EFSA on L. monocytogenes in food originate from the reporting obligations of Member States under the EU Regulation on microbiological criteria (see Section 1.3.1). It should be noted that, according to Boelaert et al. (2016), L. monocytogenes belongs to a second category of monitoring data. As stated in this paper, these data are less harmonised compared to a first category of fully harmonised and comparable data, because, although the matrices sampled are harmonised and the sampling and analytical methods are harmonised to a certain extent, the sampling objectives, the place of sampling and the sampling frequency vary or are interpreted differently between Member States and according to food types. As such, these data are not comparable across Member States. The majority of these data are food chain control data (official monitoring) and are collected by the National Competent Authorities conducting investigations to verify whether food business operators implement correctly the legal framework of own‐control programmes as well as the analyses in the framework of HACCP (industry monitoring) according to the General Food Law principles. Industry data are seldom reported to EFSA because of data ownership sensitivities. In essence, food chain control data are compliance checks and are collected with the aim to install an early warning and initiate control measures. In addition, the data sources are not transparently documented, as industry IT‐based traceability solutions are currently not mandatory and companies may store data in arbitrary formats, including non‐digital ones, as evidenced during food‐borne disease outbreaks.
Thus, since information from different investigations is not necessarily directly comparable between Member States or for the same Member State across years, findings must be interpreted with care.
In the EU summary reports (e.g. EFSA and ECDC (2015)), the reported results of L. monocytogenes testing in RTE food samples are evaluated in accordance with the L. monocytogenes microbiological criteria indicated in Commission Regulation (EC) No 2073/2005 (≤ 100 CFU/g for RTE products on the market) applying certain assumptions, where appropriate. For many of the reported data, it was not evident whether the RTE food tested was able to support the growth of L. monocytogenes or not. For the non‐compliance analysis of samples collected at processing, the criterion of absence in 25 g was applied, except for samples from hard cheese and fermented sausages (assumed to be unable to support the growth of L. monocytogenes), where the limit ≤ 100 CFU/g was applied. For samples collected at retail, the limit ≤ 100 CFU/g was applied, except for RTE products intended for infants and for special medical purposes, where the presence of L. monocytogenes must not be detected in 25 g of the sample. The results from qualitative examinations using the detection method have been used to analyse the compliance with the criterion of absence in 25 g of the sample, and the results from quantitative analyses using the enumeration method have been used to analyse compliance with the criterion ≤ 100 CFU /g. These data should be considered in the light of certain assumptions and decisions made by EFSA because of some underlying uncertainties and limitations in the reported data. These assumptions/decisions and related data uncertainties/limitations have been listed in EFSA and ECDC (2016).
EU Rapid Alert System for Food and Feed data
Commission Regulation (EU) No 16/201122 lays down the implementing measures for the requirements of Regulation (EC) No 178/2002 around the Rapid Alert System for Food and Feed (RASFF)23. This is established as a system facilitating the notification of food and feed safety alerts among the CAs of Member States. RASFFs might typically deal with notification of food batches where sampling and analysis as a result of companies’ own checks, border control, official control on the market, etc., has detected non‐conformance with regard to the L. monocytogenes microbial criterion or other criteria; or where food batches have been implicated in illnesses. The RASFF system is primarily a communication facility enabling many food safety risks to be averted before they could be harmful to European consumers. It is not an epidemiological surveillance system but provides some understanding of the types of hazards typically detected in particular foods. It should be noted that RASFF notifications are not based on fully harmonised notification criteria and are not statistically representative, neither of the occurrence of L. monocytogenes in specific food products nor of the distribution of food‐borne outbreaks associated with L. monocytogenes or a specific food. Moreover, it is important to note that information from different investigations is not necessarily directly comparable between Member States owing to differences in sampling strategies and the analytical methods applied and may not accurately represent the national situations across the EU. The purpose of using RASFF data for this assessment was to investigate the types and ranges of RTE foods where L. monocytogenes has been recovered during the period, to compare this in a qualitative manner with foods implicated in food‐borne outbreaks, and to extract information on the concentrations of L. monocytogenes in these foods. For the purpose of this assessment, a search was conducted on 13 December 2016 of the RASFF database using as product category ‘food’ and the hazard ‘Listeria monocytogenes.’ The search was restricted to the time period from 2008 onwards. The notifications were screened in duplicate and only those foods considered as RTE were included for further analysis.
The data for a selected number of RTE food categories were further analysed for the concentration of this pathogen. Only notifications with a reported concentration were considered and those notifications reporting a concentration range or only the presence of the pathogen were excluded from the analysis. For notifications providing concentrations of more than one sample, the average value was used for the analysis.
Data from scientific literature and outsourcing activities
An extensive literature search was conducted in December 2015 by Jofré et al. (2016) to gather information on the occurrence and levels of contamination of L. monocytogenes in RTE foods (i.e. RTE foods, leafy greens and melons and traditional meat products) and risk factors for L. monocytogenes contamination of various RTE foods. The searches were done on SCI‐EXPANDED and MEDLINE databases within the time span 1990–2015. Relevance of the records was screened from the title and abstract (level 1), resulting in 1,448 unique records. After level 2 screening for eligibility, 308 records were identified as eligible for data extraction. Information was extracted about the study, RTE product (population) and analytical methodology, risk factors (exposure and comparators) and results (outcomes) about prevalence and concentration of L. monocytogenes. More information can be found in Jofré et al. (2016).
To assess the change in prevalence over time per food category, i.e. ‘indicator data,’ data were selected considering ‘survey’ as the aim of the study and ‘retail’ as the sampling location. In all food categories, the distribution of the prevalence values was asymmetric, with several outliers as well as extreme values. The high diversity in the type of products within each of the three major categories, the number of samples surveyed per study, the sampling locations in the farm‐to‐retail continuum and within the retail sub‐sector (e.g. supermarkets, catering services, canteens, vendors) as well as in the duration of the survey (from one year up to 10 years), makes it difficult to draw conclusions on clear trends with time. For these reasons, the following selection criteria were applied to generate prevalence plots over time: (i) for surveys with duration greater than a year, the middle year was considered as the year of survey, (ii) different products were aggregated together into the major RTE food category, e.g. meat, seafood and dairy, (iii) the various sampling locations at retail were grouped and (iv) only surveys were considered. Studies for testing the performance of in‐house detection methods, or studies involving challenge testing that aimed to test the efficiency of a decontamination intervention in reducing L. monocytogenes numbers, were excluded. Studies assessing the performance of in‐house methods for detecting L. monocytogenes in the main three RTE food categories, were excluded to minimise sampling bias, and because most of them lacked a clearly reported sampling period. These studies constitute the minority (18 out of 952) of the total studies meeting the above three criteria for inclusion in the analysis.
For the analysis of the epidemiological relationship of L. monocytogenes isolates collected in the EU from RTE foods, compartments along the food chain and humans using WGS analysis, results from the third outsourcing activity by Møller et al. (2017) were also considered. A total of 1,143 L. monocytogenes isolates were selected for the study and these included 333 human clinical isolates and 810 isolates from the food chain. The food chain isolates were acquired as part of the BLS conducted in 2010 and 2011 (353 isolates), obtained as part of national surveys, control programmes or research projects (423 isolates) or in connection to outbreak investigations (34 isolates). It was required to include the isolates from the BLS. As most of the available BLS isolates were from fishery products, additional isolates from RTE meat products and cheeses from the same period and as many different EU Member States as possible were added to generate a more balanced representation of the three RTE food categories sampled in the BLS. The human clinical isolates were supplied by national public health laboratories and represented sporadic cases (262 isolates) and outbreak‐related isolates (71 isolates) from 11 European countries, mainly in the years 2010–2011.
2.1.3. Data on consumption of RTE foods
EFSA consumption data on RTE foods
The EFSA Comprehensive European Food Consumption Database24 contains data on food consumption habits and patterns across the EU. It provides detailed information for a number of European countries in refined food categories and specific population groups. Summary food consumption statistics (chronic and acute) are available for each country, survey, age group (from infants to the elderly) and FoodEx125 food group (over 1,500) in g/day and g/kg body weight per day.
The consumption data for the three RTE food categories sampled in the EU‐wide BLS were extracted from the database. More specifically FoodEx1 categories were used to identify eating occasions for semi‐soft and soft cheese, cooked meat, sausage and pâté. As FoodEx1 was not detailed enough, the original national food descriptors were used to identify eating occasions for smoked and gravad fish. The same RTE foods in the three RTE food categories as considered by Pérez‐Rodríguez et al. (2017) were selected.
Information related to the surveys included:
country;
survey;
survey starting date and end date;
total number of subjects; and
total number of days for which consumption events were reported.
Summary statistics were reported for the following population strata and food groups:
age class: 1–4, 5–14, 15–24, 25–44, 45–64, 65–74, ≥ 75 years old;
gender; and
food group: smoked fish, gravad fish, cooked meat, heat‐treated sausages, pâté, soft and semi‐soft cheese.
Food consumption summary statistics extracted from the Comprehensive Database:
total number of eating occasions;
total amount (g) consumed on all eating occasions;
mean number of eating occasions per day in all days;
mean, medium, 25th percentile and 75th percentile for the number of eating occasions per day in consuming days only; and
mean, medium, 25th percentile and 75th percentile for the amount (g) per eating occasion in consuming days only.
Data were available from 23 Member States and 51 surveys. The most recent survey per Member State and age class was considered to estimate summary statistics. Thus, data were considered from the 23 Member States and from 40 surveys. The survey starting date ranged from 1997 to 2012. The mean of the mean, medium, 25th percentile and 75th percentile amount (g) per eating occasion on consuming days only was calculated for the various food groups and by gender and age class. Also, the mean of the mean number of eating occasions per day on all days was calculated for the various food groups by gender and age class. The latter was multiplied by 365 to estimate the mean yearly number of eating occasions for the various food groups. By considering the population size in the EU/EEA in 2015, the total number of servings per year per age group and gender was derived. The reason for including surveys prior to the period of interest was the consideration that for descriptive purposes it was more important to capture variation among countries than to capture the exact time period of interest.
Variation in consumption over time in the elderly population (≥ 65 years old) was estimated based on surveys from countries reporting more than once during the 1997–2015 time period, i.e. Denmark, Finland, the Netherlands and Sweden. This information was used as ‘indicator data’ for any change in consumption. Mean serving sizes and the number of servings per year were estimated for each survey as described above, and any differences were presented as differences in mean serving size or number of servings per country for the two occasions (survey year).
Food and Agriculture Organization data on smoked salmon consumption in the EU
In order to get a rough estimate of the possible smoked salmon consumption in the EU for a recent period (2003–2013), data from the Food and Agriculture Organization of the United Nations (FAO) were accessed, through the application FishstatJ and the workspace FAO Fishery and Aquaculture Statistics, (v.2016.1.2) – data set: ‘Global commodities production and trade’ (date: 26‐2‐2016) – Commodity: ‘Salmons, smoked’ (FAO, 2016).26 Production, import and export data (weight in tonnes) were obtained for the EU countries for the years 2003–2013 (production data were not available for all countries). Subsequently, a calculation was made in which production and import weights were added for each year/country and export weights were subtracted from this sum.
2.1.4. Literature review on consumer behaviour including storage and handling
For information relating to consumer behaviour when dealing with food, a literature search was done in the Web of Science database on 13 September 2016. No language or time restrictions were applied. The search was done in the topics field of the scientific publications using the keywords: (behaviour* OR behavior* OR handling OR attitude* OR kitchen* OR refrigerator* OR home* OR domestic OR practice* OR hygiene) AND (consumer* OR adult* OR elderly OR senior* OR people OR women OR men OR children OR toddler* OR vulnerable OR pregnant OR pregnancy) AND ((food NEAR safety) OR listeria OR listeriosis OR monocytogenes). A total of 2,747 records were retrieved, 2,740 after removal of duplicate records. In total, 218 references were considered potentially relevant. These records were further screened and relevant articles, based on geography (Europe) and scope of the article (behaviour and storage temperatures in relation to gender, age, socioeconomic factors) were selected. This process resulted in 32 records being considered as relevant and were reviewed in detail.
For information relating to the storage temperature of foods, a literature search was done in the Scopus database on 6 December 2016. No language or time restrictions were applied. The search was done in the topics field of the scientific publications using the keywords: temperature AND refrigerator. A total of 698 records were retrieved, from which 35 references were considered relevant and reviewed in detail. Additional records were added based on expert knowledge on relevant literature.
2.1.5. Surveillance of human listeriosis
A short questionnaire was sent to the nominated public health contact points for listeriosis and Listeria isolates in the European Food‐ and Waterborne Diseases and Zoonoses network (FWD‐Net) on changes in diagnostic practices and national surveillance systems for listeriosis in 2008–2015. Separate questionnaires were addressed to the epidemiologists and microbiologists in 31 EU/EEA countries. The response rate was 61% for epidemiologists and 42% for microbiologists. A descriptive analysis of responses was made and the potential impact on EU‐level data was assessed by reflecting the case counts between 2008 and 2015 in countries with notable changes in their national surveillance systems.
2.1.6. Review of quantitative microbiological risk assessment (QMRA) outputs
A systematic review was conducted (with a literature search done in March 2016) by Pérez‐Rodríguez et al. (2017) to retrieve existing microbiological risk assessments on listeriosis and L. monocytogenes in RTE foods. The searches were done in bibliographic databases (Scopus, Web of Science and MEDLINE databases) and other web sources. There were no time restrictions and no language restriction was imposed a priori. Relevance of the records was screened from the title and abstract (level 1), resulting in 122 records. After level 2 screening for eligibility, 47 records remained (40 scientific articles and seven reports, all published between 1996 and 2015). Information was extracted covering aspects such as: scope, approach and technical aspects, hazard characterisation/dose–response information, exposure assessment and risk characterisation. More information can be found in Pérez‐Rodríguez et al. (2017). The 47 records were reviewed for identification of the factors (i.e. prevalence, storage time and temperature, slicing, product formulation, packaging type, serving size, and consumer susceptibility) and their levels (when applicable) that influence the risk of listeriosis, associated with the consumption of different RTE foods, namely deli meats, seafood, dairy products and fresh cut salads.
2.2. Methodologies
2.2.1. Time series analysis (TSA) of human invasive listeriosis trends, 2008–2015
The 2008–2015 L. monocytogenes total number of confirmed cases reported to ECDC was first evaluated using an aggregated analysis. As analysis of aggregated trends may hide existing trends within subgroups of the EU/EEA population – and to gain further insights – data were also analysed in a disaggregated analysis by age–gender subgroups. Additional variables to create even finer subgroups were not available.
As explained in Section 2.1.1, data from countries which had not reported data on cases of human listeriosis for the whole study period 2008–2015 were excluded. In R, data on populations and cases were merged, providing an aggregated data set, with the following variables: ‘date,’ ‘gender,’ ‘age group,’ ‘cases’ and ‘population’. Data for which the information on ‘age group’ and ‘gender’ was reported as ‘unknown’ were dropped, as well as records for which months had ‘NULL’ as an attribute. This resulted in a total of 14,002 invasive listeriosis cases. The data were then transformed into a ‘wide’ data set, with the following variables: ‘year,’ ‘month,’ ‘cases’ for gender–age group combinations, and ‘population’ for gender–age group combinations. The following 14 gender–age group combinations were used: 1–4, 5–14, 15–24, 25–44, 45–64, 65–74, ≥ 75 years old, for both males and females.
Aggregated time series analysis
The aggregate L. monocytogenes series from January 2008–December 2015 is a short time series that exhibits changing dynamics of the outcome variable (i.e. the number of confirmed L. monocytogenes cases). Given these properties, specifying a proper time series model is difficult. As a first step, a series of autoregressive integrated moving average (ARIMA) models were attempted to address the serial correlation and the seasonal components. An ARIMA (1,0,0) (0,1,1) was successfully fit and had white noise residuals. However, these models had parameter estimates at the borderline of being non‐stationary. This means that they are unstable and not good candidates for inference or forecasting. Another alternative to consider here would be a Bai and Perron (Bai and Perron, 1998, 2003) change point regression model. When this model was examined, after accounting for the serial correlation, the optimal number of change points was zero, indicating that there is not a single change point in the time series process. A change point model is also more restrictive than a dynamic linear model (DLM), since it only allows k = finite change points. The DLM allows the mean/variance estimate to change each time period, so it is the least restrictive approach possible.
Furthermore, a changing trend in time was observed. In this case, the commonly accepted approach is to use a trend and seasonal decomposition approach (West and Harrison, 1997; Petris et al., 2009). The simplest model in this class examines a random walk with seasonal dummy variables, αjt for the months. This model is made up of two equations, one for the observed data and the other for the latent random walk. Let Lt be the Listeria time series at time t. The random walk model with seasonal effects with mean m t is then
| (1) |
| (2) |
where the errors vt and wt are uncorrelated. The key pieces being estimated here are the variances V and W, since these explain how much of the variance is in each component of the model. In this, vt is the error term on the measurement or observation equation that maps the observed data to the state equation. The wt are the errors for the state or dynamic equation that characterises the dynamics of the model. The V and W terms are the variances on these mean zero, normal, error terms.
The alternative model to see if there is a trend is a local linear growth model (i.e. a second order trend model). This allows for a second‐order trend that can capture shifts in trend beyond the random walk model. In contrast with a first‐order model which is linear (slope is either up or down), a second order model allows an inflection point (up/down vs down/up), allowing a good level of complexity in the shape. This model allows for a time‐varying slope for mt. The equations for this model extend those given earlier to include a trend term βt. This extends the earlier equations as follows:
| (3) |
| (4) |
| (5) |
The analyses were conducted with the ‘dlm’ package (Petris, 2010) in R version 3.3.3 (Ihaka and Gentleman, 1996; R Core Team, 2016), allowing the implementation of DLMs.
Disaggregated age–gender groups time series analysis
To obtain a visual impression of the evolution of reported confirmed human invasive listeriosis incidence rates, by age and gender, smoothed trend lines based on local regressions were computed (Cleveland et al., 1992).
For modelling of the disaggregated cases data, the low number of cases in certain age and gender subgroups, and the non‐normality of the residuals did not allow for the use of a dynamic linear modelling approach, as was the case for the aggregated data. Instead, the trends in the subgroups required the use of a model that allowed the handling of small numbers of observed counts at the same time as being able to deal with autocorrelation of the counts. An appropriate model for such a situation is a Poisson autoregressive model (PAR(p)) (Brandt and Williams, 2001). This model is based on an extended Kalman filter for the count process and allows for analysis of cyclical properties (e.g. autocorrelation).
The equation estimated for the PAR(p) models is
| (6) |
where yt is the count at time t and yt‐1 is the lagged count, with t indicating time, rho expressing the autocorrelation coefficient for a 1‐month lag model (for some of the count time series a second lag was also needed to account for second order serial correlation). The remaining term in the exp() expresses the constant, the time trend in logarithms and the population offset. The PAR(p) model described by (Brandt and Williams, 2001) and the R‐code to handle such models had to be adapted in order to include log(population) offset for the subgroup populations, an offset being an adjustment term with a parameter estimate (for log(population)) constrained to 1.
The trend component is then
| (7) |
More details on the basis of this model can be found in Brandt and Williams (2001).
The analyses were conducted with an adapted version of the ‘pest’ commands (Brandt and Williams, 2001) for R version 3.3.3 (Ihaka and Gentleman, 1996; R Core Team, 2016), enabling the implementation of autoregressive Poisson models. Adaptations to the code were required to produce some results specific to this study. For comparing the incidence rates of specific groups (e.g. males and females of an age group), the package ‘epitools’ (Aragon, 2012) in R version 3.3.3 (Ihaka and Gentleman, 1996; R Core Team, 2016) was used. The R‐code of the TSA is available in Appendix B.
2.2.2. Comparison of rates
For comparison of rates (case fatality or incidence rates), the ‘rateratio’ function of the ‘epitools’ package (Aragon, 2012) for R version 3.3.3 (R Core Team, 2016) was used, allowing the calculation of the rate ratio, confidence intervals and p values, by median‐unbiased estimation (mid‐p method). This method compares rates by using a test of independence. An alpha level of 0.1 was applied without multiple comparisons correction. The multiple comparison procedure applies to all possible comparisons among the factor level case fatality rates (CFRs).
2.2.3. Assessment questions
As illustrated in the approach flow chart (Figure 2), a number of factors that may contribute to any change in the number of cases or incidence rates of human invasive listeriosis were identified based on the conceptual model, the TSA, the review of sensitivity analyses in published QMRAs, and the reports of the three outsourcing activities (Jofré et al., 2016; Møller et al., 2017; Pérez‐Rodríguez et al., 2017). To be able to evaluate the potential contribution of these factors on the incidence rates of human invasive listeriosis, a number of AQs were formulated. In addition to the change in human listeriosis, differences in incidence rate levels between population groups were also considered to be important for the analysis. Since formulation of AQs is a potential source of uncertainty (EFSA Scientific Committee, 2016) special care was taken to formulate them with the support of a technical expert. Factors are separated based on whether they are related to the host (AQ1.1–1.2), the food (AQ2.1–2.4), the national surveillance systems (AQ3.1) or the bacterium (AQ4.1):
AQ1.1: What contribution did any change in the population size (i.e. the number) of the elderly and/or susceptible people make to the change in cases of human invasive listeriosis in the EU/EEA in the time period 2008–2015?
AQ1.2: What contribution did any change in ‘underlying condition rate’ make to the change in incidence rates of human invasive listeriosis in the EU/EEA in the time period 2008–2015?
AQ2.1: What contribution did any change in L. monocytogenes prevalence in RTE food at retail level make to the change of human invasive listeriosis incidence rates in the EU/EEA in the time period 2008–2015?
AQ2.2: What contribution did any change in L. monocytogenes concentration in RTE food at retail level make to the change of human invasive listeriosis incidence rates in the EU/EEA in the time period 2008–2015?
AQ2.3: What contribution did any change in storage conditions (temperature, time) after retail (i.e. consumer phase) make to the change of human invasive listeriosis incidence rates in the EU/EEA in the time period 2008–2015?
AQ2.4: What contribution did any change in consumption (serving size and frequency) make to the change of human invasive listeriosis incidence rates in the EU/EEA in the time period 2008–2015?
AQ3.1: What contribution did any change of (improved) surveillance make to the change of human invasive listeriosis incidence rates in the EU/EEA in the time period 2008–2015?
AQ4.1: What contribution did any change in virulence make to the change of human invasive listeriosis incidence rates in the group of interest in the EU/EEA in the time period 2008–2015?
The AQs were evaluated stepwise. First, an importance analysis identified the most important factors that may have an impact by using the gQMRA model (See Section 2.2.4). The second step was to evaluate empirical evidence, or indicator data to investigate the support for a change in the factor during the time period. In the third step, a synthesis was made of the evidence from the TSA, the importance analyses, the empirical evidence and the uncertainty analyses. Based on the outcome of this evaluation, conclusions, with uncertainties described, were drawn on the impact of the different factors on the human listeriosis incidence rates and data gaps were identified.
2.2.4. Listeria monocytogenes generic QMRA (gQMRA) model
In order to address the identified factors/hypothesis explaining the increase of human invasive listeriosis incidence rates in the EU/EEA, a quantitative microbiological risk assessment model, referred to as the L. monocytogenes generic quantitative microbiological risk assessment (gQMRA) model, was developed by the working group (Figure 3) upon the model developed by Pérez‐Rodríguez et al. (2017). The gQMRA model presents the following adaptations and improvements:
Figure 3.
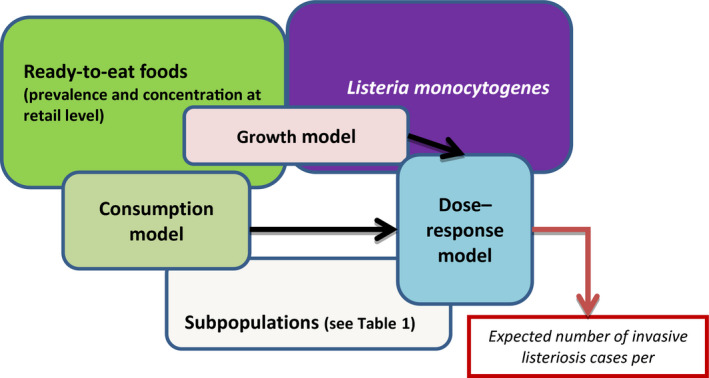
- The gQMRA model is constructed around three main elements; food, population and hazard. It includes three models: consumption model, growth model and dose–response model. The overlapping of the model boxes with the main element boxes indicates that the model takes into account one or several factors characterising the food, the populations or the hazard.
Since the TSA addressed the listeriosis trend in 14 age–gender groups, the gQMRA model had to be adapted to address all these groups. The model by Pérez‐Rodríguez et al. (2017) considered three groups: ≥ 65 years old, pregnant women and < 65 years old. Therefore, input data related to age–gender groups had to be developed, i.e. dose–response parameters, and consumption data.
The estimation of exposure was used to assess a new DR model with parameters for the 14 age–gender groups, which was developed mainly based on epidemiological data on human invasive listeriosis in the EU/EEA.
The data on initial L. monocytogenes concentration in RTE foods was modified by also using US data to evaluate the effects of initial concentration and growth.
Implementation of the model in R to allow for a higher number of iterations (millions of iterations) and therefore more stability of the model outputs (model convergence).
The model is generic in the sense that the model allows the inclusion of more or fewer RTE food categories and subpopulations without changing the R code. As the inputs are provided in structured Microsoft Excel tables, the code automatically interprets the number of RTE food categories and the number of subpopulations.
The R code and model implementation allow an expanded evaluation of uncertainty when the uncertainty about the inputs are available.
Full inclusion of the variability related to the DR model.
The gQMRA model predicts consumer exposure based on the initial contamination level at retail of a variety of RTE foods, and the potential growth before consumption. The probability of a consumer being infected and developing invasive listeriosis is then predicted by applying a DR model.
More than 70% of cases of listeriosis occur in individuals with recognised underlying diseases such as liver disease, cancer and diabetes and would ideally need to be considered in the risk assessment model (Goulet et al., 2012). However, the lack of reliable data on the distribution of human listeriosis cases for the different underlying conditions groups as in the Goulet et al. (2012) study prompted the application of another approach based on epidemiological data available in the EU/EEA using the same 14 subpopulations defined by age and gender as in the TSA. The distribution of the number of human invasive listeriosis cases within these subpopulations is presented in Table 1 combined with their relative risk.
Table 1.
The distribution of the number of invasive human invasive listeriosis cases in the EU/EEA (2008–2015) within the 14 subpopulation groups and estimated relative risks
| Subpopulation group | Population in EU/EEA (2008–2015)a | Proportions of subpopulations in EU/EEA | Invasive listeriosis cases in EU/EEA (2008–2015)b | Relative riskc |
|---|---|---|---|---|
| Female 1–4 yo | 9,981,292 | 0.021 | 49 | 0.17 |
| Male 1–4 yo | 10,507,387 | 0.022 | 62 | 0.20 |
| Female 5–14 yo | 24,769,674 | 0.052 | 52 | 0.07 |
| Male 5–14 yo | 26,071,451 | 0.054 | 51 | 0.07 |
| Female 15–24 yo | 27,917,371 | 0.058 | 209 | 0.26 |
| Male 15–24 yo | 29,107,545 | 0.061 | 72 | 0.08 |
| Female 25–44 yo | 67,013,021 | 0.140 | 1,067 | 0.54 |
| Male 25–44 yo | 68,019,328 | 0.142 | 351 | 0.18 |
| Female 45–64 yo | 65,803,889 | 0.137 | 1,219 | 0.63 |
| Male 45–64 yo | 63,791,535 | 0.133 | 2,001 | 1.07 |
| Female 65–74 yo | 24,249,576 | 0.051 | 1,328 | 1.87 |
| Male 65–74 yo | 20,921,720 | 0.044 | 2,142 | 3.50 |
| Female ≥ 75 yo | 25,539,929 | 0.053 | 2,537 | 3.40 |
| Male ≥ 75 yo | 15,476,863 | 0.032 | 2,862 | 6.33 |
| Total population | 479,170,581 | 1 | 14,002 | 1 |
yo: years old.
The average of the yearly population figures during the time period 2008–2015 was used.
Based on the final data set for the TSA consisting of 14,002 confirmed human invasive listeriosis cases for 2008–2015 from 24 EU Member States and two EEA countries (Iceland and Norway).
Ratio of the incidence rate observed in one subpopulation to the incidence rate observed in the total population. A relative risk (RR) > 1 means that invasive listeriosis is more likely to occur in the subpopulation than in the total population. A RR < 1 means that invasive listeriosis is less likely to occur in the subpopulation than in the total population. RR = 1 means that there is no difference in the risk between the subpopulation and the total population.
The input data of the gQMRA model and additional information related to the gQMRA assessment can be found in Appendix C.
Ready‐to‐eat foods
The seven RTE food subcategories considered in the gQMRA model are:
Cold‐smoked fish;
Hot‐smoked fish;
Gravad fish;
Cooked meat;
Sausage;
Pâté; and
Soft and semi‐soft cheese.
The gQMRA model starts at the retail level. The prevalence of contamination by L. monocytogenes is taken from the BLS data (see Section 2.1.2) (EFSA, 2013, 2014a).
Good quality enumeration data for L. monocytogenes in RTE foods are rare. In the EU, the BLS (EFSA, 2013, 2014a) provided the best available data on the concentration of L. monocytogenes in certain RTE foods. The data were checked and are summarised in Figure 4. In the current model, for initial concentration only, data for cold‐smoked and hot‐smoked fish were combined, under the simplifying assumption that the two types of smoked fish have the same distribution of the initial concentration. This assumption is justified based on the distribution frequency of L. monocytogenes counts in cold‐smoked and hot‐smoked fish samples from the BLS. It should be noted that in the BLS, enumerations were carried out at the end of shelf life of the RTE foods. For fish, the enumerations were also done at the time of sampling and these data were used.
Figure 4.
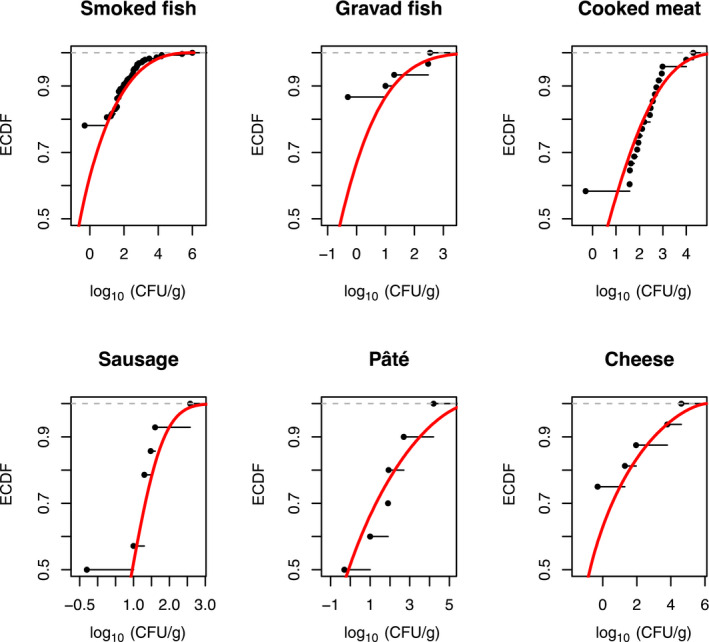
- For better visibility, different scales of the x‐axis were used. The empirical cumulative distribution function (ECDF) is a step function that jumps up by 1/n at each of the n data points. Its value at any specified value of the measured variable is the fraction of observations of the measured variable that are less than or equal to the specified value. Example: for pâté, curves show that concentration has a probability of 90% to be less or equal to 3 log10 CFU/g. The cumulative distribution function (solid red line) is the probability that the concentration will take a value less than or equal to a specific concentration. Example: for smoked fish, the concentration has a probability of around 90% to be less or equal to 2 log10 CFU/g.
Listeria monocytogenes concentrations (at decimal logarithm scale) in RTE food were modelled using beta‐general distributions with a minimum equal to −1.69 log10 CFU/g and the maximum concentration based on the maximum L. monocytogenes concentration in the RTE food categories as sampled in the BLS. The two other (shape) parameters of the food‐specific beta‐general distributions (α and β) were estimated using a maximum likelihood estimation algorithm implemented in the ‘mle’ function (‘stats4’ package in R version 3.3.3 (Ihaka and Gentleman, 1996; R Core Team, 2016)). Positive samples without enumeration were assumed to have a concentration less than 10 CFU/g. The cumulative distribution functions (CDFs) of the used beta‐general distributions are presented in Figure 5.
Figure 5.
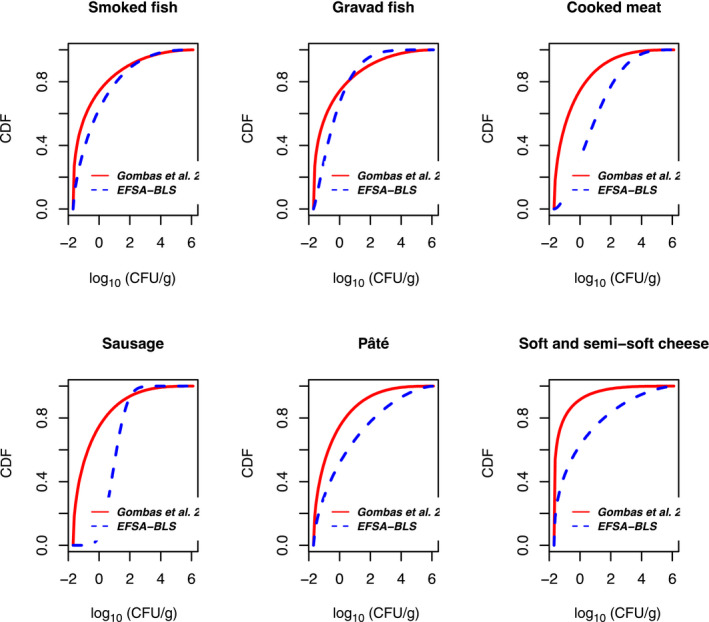
- The cumulative distribution function is the probability that the concentration will take a value less than or equal to a specific concentration. Example: the blue dashed curve shows that for smoked fish, the concentration has a probability of around 90% to be less or equal to 2 log10 CFU/g.
A similar study was conducted in the USA. Eight categories of RTE foods were collected over 14 to 23 months from retail markets in Maryland and northern California. The product categories included luncheon meats, deli salads, fresh soft ‘Hispanic‐style’ cheese, bagged salads, blue‐veined and soft mould‐ripened cheese, smoked seafood, and seafood salads (Gombas et al., 2003). In order to compare the BLS and US data, it was assumed that luncheon meat sampled in the USA has the same initial concentration distribution as cooked meat, sausage and pâté sampled in the EU. Likewise, the concentration for blue‐veined and mould‐ripened cheese in the US study are considered equivalent to soft and semi‐soft cheese as sampled in the EU. Gravad fish was not included in the US study and therefore the samples from smoked fish sampled in the USA were used instead. Using the assumptions above and the same approach for fitting a cumulative distribution function, the BLS data and the US data were compared (Figure 5).
As shown in Figure 5, for meat products and cheese the BLS data resulted in a CDF that indicates a higher frequency of high concentrations compared with those obtained with Gombas et al. (2003) data. This difference could be explained, partially, by the fact that the enumerations were carried out at the end of shelf life of the RTE foods in the BLS (except for fish samples, which were analysed at sampling and at the end of shelf life), whereas in the Gombas et al. (2003) survey quantification was carried out directly after the sampling. For smoked fish, the product most similar in the BLS and US surveys, the concentration beta distributions based on BLS survey and Gombas et al. (2003) data had very similar CDFs. Gravad fish was not identified in Gombas et al. (2003); therefore, the presented CDF corresponds to smoked fish. Overall, the concentrations in gravad fish are lower than the concentrations observed in smoked fish.
Faced with this uncertainty on the distribution of initial L. monocytogenes concentrations, it was decided to consider three options:
Option 1. Use only the distributions estimated with BLS data.
Option 2. Use only the distributions estimated with US data (Gombas et al., 2003).
Option 3. Use fish distribution from BLS data, and meat and cheese distributions from US data (Gombas et al., 2003).
Option 3 was considered the best and was used as the baseline for the gQMRA model because the model is including growth after retail and so concentration data observed at the end of the shelf life cannot be used.
Consumption model
In this model, the average portion size (mass of RTE food ingested per meal) per RTE food category and subpopulation as well as the total number of eating occasions per year (TEO) were estimated from the EFSA consumption database and are presented in Section 3.3.3.
Growth model
Listeria monocytogenes can multiply at refrigeration temperatures. The exponential growth rate (EGR) can vary between the different RTE food categories. In order to capture this variability a review of available data on the L. monocytogenes EGR in different foods was carried out by Pérez‐Rodríguez et al. (2017). The output of this review has been summarised using probability distributions of the EGR estimated at 5°C for the different RTE food categories in the risk assessment. It was assumed that the EGR at 5°C is log‐normally distributed. Moreover, the packaging conditions, i.e. reduced oxygen packaging (ROP; including both vacuum and modified atmosphere packaging) vs normal packaging, were considered as a factor modifying the growth potential of L. monocytogenes in all seven RTE food subcategories, except in soft and semi‐soft cheese. Therefore, the growth has been estimated for 13 subcategories/packaging conditions. The proportion of RTE food categories that are ROP packed was estimated using data collected during the BLS survey.
The EGR at a specific temperature T is derived using this simplified secondary model, with Tmin = −1.18°C as derived from FDA and FSIS (2003):
| (8) |
The temperature (T) of the consumer refrigerator was assumed normally distributed with a mean equal to 5.9°C and a standard deviation of 2.9°C. The temperature was truncated to −2°C and 15°C (Derens‐Bertheau et al., 2015).
We are assuming in this model that the consumer stores the different RTE food categories at the same temperature.
The final concentration C(t), in CFU/g, at the end of the storage time (t) at temperature T is calculated using the Rosso equation:
| (9) |
where Cmax is the maximum concentration or maximum population density (MPD) and C(0) is the initial concentration before storage (CFU/g). This primary growth model does not include a lag time as it is considered in general that the lag phase is finished before the RTE foods are purchased. This assumption is conservative in the sense that it may overestimate the risk. The possible growth between purchasing and storage in the refrigerator was ignored; because first no accurate data are available to consider this step and second the transportation to the laboratory after sampling may include part of this growth potential. The latter, however, is unlikely for the BLS samples as these samples had to be transported in refrigerated containers and had to be kept at between 2 and 8°C. Those received at a temperature higher than 8°C were rejected, unless the temperature at retail was higher than 8°C (EFSA, 2013).
The time of storage (t) was calculated following three steps:
Step 1: determination of the remaining shelf life; in considering data observed within the BLS. The remaining shelf life of an RTE food at the time of its purchase was assumed to follow an exponential distribution which has a single parameter. This parameter was estimated for all seven RTE food subcategories and per type of packaging (ROP versus normal).
Step 2: it was assumed that the RTE food can be consumed any time from immediately after purchase up to and beyond the remaining shelf life of the product (10% more) but more frequently consumers will consume the food after having stored it for a period of time equal to 0.30 of the remaining shelf life. This variability, as assumed by the working group members, was modelled with a beta‐pert distribution with a minimum, mode and maximum equal to 0, 0.30 and 1.1 respectively (this variable was named proportion of remaining shelf life, psl).
Step 3: for each iteration of the model, the storage time is derived by multiplying the two values obtained by sampling the respective distributions of psl and of the remaining shelf life.
Distribution of doses in ‘generic’ ready‐to‐eat food
The concentration at the time of consumption, C(t), in CFU/g, was assessed for the 13 RTE food subcategories/packaging conditions. For each of these, one million iterations were performed to assess a specific C(t) distribution. The expected exposure dose (λ) distribution was assessed for each RTE food subcategory/packaging condition in each of the considered age–gender groups as follows:
| (10) |
where PS is the portion size in g.
An overall expected exposure dose distribution in generic RTE food was assessed from those obtained for each of 13 RTE food subcategories/packaging conditions by weighting each category by its relative frequency of consumption (number of eating occasions for a RTE category/number of eating occasions for all the RTE food categories) in each of the considered subpopulations (age–gender groups). In the same way, an overall prevalence was estimated.
From the simulation model, the distribution of the concentration at time of consumption, i.e. the dose, is obtained for each of the 14 subpopulations for each of the three options of the initial concentration. Figure 6 shows the dose distributions using option 3, the baseline option. The starting points of the cumulative dose distributions are the overall proportion of non‐contaminated RTE food for each of the 14 subpopulations (i.e. 1‐Prevalence of contaminated RTE food). The differences in the overall prevalence are explained by the differences in the consumption patterns between the subpopulations. The lowest curves, for male and female, are obtained with the age category ‘above 75 years old’ meaning that these two populations are the most exposed to L. monocytogenes (Figure 6).
Figure 6.
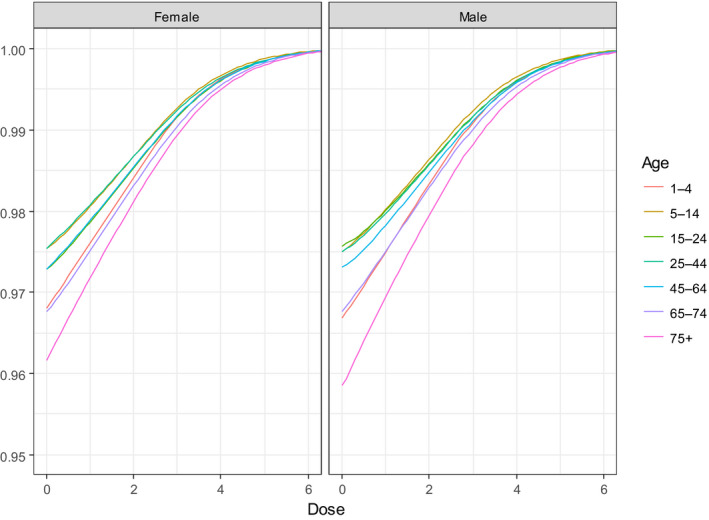
- The y‐axis represents the cumulative distribution function. This is the probability that the concentration will take a value less than or equal to a specific concentration. Example: the curve in the male population ‘above 75 years old’ shows that the concentration in the generic RTE food has a probability of around 98% to be less than or equal to 2 log10 CFU/g. Option 3: using fish products distribution from EU BLS data, and meat and cheese distributions from US data (Gombas et al., 2003).
Dose–response model
The DR model used in the gQMRA was assessed using the approach described in Pouillot et al. (2015b). This model is a log‐normal exponential model; given an expected dose λ (number of L. monocytogenes CFU per serving) the probability of illness is derived as follows:
| (11) |
The r parameter, which represents the probability that one single CFU will survive the different barriers and multiply in a favourable site of infection depends on the characteristics of the host and the strain of L. monocytogenes. By its definition, r is variable. To capture this variability, r was assumed to be log‐normally distributed. The log‐normal distribution is described by two parameters; μ and σ (mean and standard deviation). As epidemiological data show significant differences in incidence rate of human invasive listeriosis between categories of age and gender, it was decided to estimate the mean of the log‐normal distribution of r for each of the 14 populations. With parsimony, the standard deviation was assumed to be the same for each subpopulation: in this way, it characterises the intrasubpopulation variability of r.
To estimate the 14 means of r, we used as exposure the output of the exposure model (Figure 3), the average of the annual observed cases of human invasive listeriosis per subpopulation between 2008 and 2011 and the TEO per subpopulation. This reference period is used because it corresponds to the period of data consumption collection and covers the period of the BLS. Estimating r consists in solving the following equation which has a single unknown value (mean of r):
| (12) |
where f(λ) and g(r) are two probability distribution functions describing the variability of the expected doses (output of the gQMRA model) and the r parameter of the exponential model respectively. The standard deviation of g(r) is considered constant and equal to 1.62 as in Pouillot et al. (2015b). The equation is solved for each of the 14 subpopulations. Table 2 gives the estimated mean of log10(r) for each of them.
Table 2.
Estimated means of the r parameter estimated by the baseline gQMRA model for the 14 subpopulation groups
| Subpopulation groups | Geometric mean of r |
|---|---|
| Female 1–4 yo | 2.67E‐15 |
| Male 1–4 yo | 3.41E‐15 |
| Female 5–14 yo | 1.21E‐15 |
| Male 5–14 yo | 9.89E‐16 |
| Female 15–24 yo | 4.73E‐15 |
| Male 15–24 yo | 9.20E‐16 |
| Female 25–44 yo | 9.44E‐15 |
| Male 25–44 yo | 1.72E‐15 |
| Female 45–64 yo | 8.30E‐15 |
| Male 45–64 yo | 9.02E‐15 |
| Female 65–74 yo | 1.99E‐14 |
| Male 65–74 yo | 2.75E‐14 |
| Female ≥ 75 yo | 2.91E‐14 |
| Male ≥ 75 yo | 2.91E‐14 |
yo: years old. Option 3 for the distribution of initial L. monocytogenes concentrations was used, i.e. fish distribution using the BLS data, and meat and cheese distributions from US data (Gombas et al., 2003).
Expected number of human invasive listeriosis cases per subpopulation
The different parts of the model were combined to estimate the number of human invasive listeriosis cases in R version 3.3.3 (Ihaka and Gentleman, 1996; R Core Team, 2016). The estimated number of cases is expected to be close to the reported ones as the DR model is calibrated to the epidemiological data. The code is available in Appendix C.
Importance analysis
An importance analysis was carried out to evaluate the potential for the different factors identified in the AQs to contribute to the change of invasive listeriosis incidence rate. This analysis shows how much change in the factor is needed to explain different fractions of the observed change in invasive listeriosis incidence rates. A comparison of this information with any empirical data on changes in the factor during the time period would indicate the extent of the contribution from the factor on the observed trend.
The importance analysis was carried out by running the gQMRA model with different value ranges for the following input parameters:
MPD of L. monocytogenes in RTE foods;
time of storage at consumer level: mode and maximum of the proportion of the remaining shelf life;
temperature of consumer refrigerator during storage: mean; and
initial concentration of L. monocytogenes in RTE foods: set of data (EU versus US).
For the evaluated factors, it was found that the relative impacts on the outputs of the model were relatively close for all subpopulations so results were presented for the whole population.
2.3. Uncertainty
Based on the draft EFSA guidance on uncertainty (EFSA Scientific Committee, 2016), and the mandate, special attention was given to: (i) the interpretation of the ToRs, i.e. framing of the mandate and the AQs, (ii) identifying sources of uncertainty and (iii) their impact on the outcome of the assessment. Focus of the uncertainty assessment was on ToR 2, i.e. uncertainty associated with the gQMRA model, the TSA and indicator data, on trying to assess the combined effects on uncertainties in answering the AQs. The identified assumptions and other sources of uncertainty were listed for those.
3. Assessment
New information and evidence related to factors important for L. monocytogenes contamination in the food chain and for the reported incidence rates of human illness are summarised in Sections 3.1–3.4 under the headings of a common risk assessment which makes up the response to ToR 1. A detailed analysis of the trends in human invasive listeriosis incidence rates (2008–2015) is presented in Section 3.5, and an evaluation of potential contributing factors using different risk assessment approaches and models in Section 3.6, which together are the response to ToR 2.
3.1. Evidence for hazard identification
3.1.1. Introduction to the species L. monocytogenes
Several new species of the genus Listeria have been described during the last decade and the genus Listeria now consists of 17 distinct species (Orsi and Wiedmann, 2016). Some of the new species were isolated from the environment and decaying material, others were recovered from food and the food processing environment. Among all Listeria species, L. monocytogenes is by far the most important species from a human health perspective, followed by L. ivanovii that might be found in food in very rare cases. The oral route is the central mechanism of exposure both for animals and humans and it is estimated that 99% of all human cases of listeriosis are food‐borne (Orsi et al., 2011). Listeria monocytogenes is isolated from a variety of biotic and abiotic sources, the environment and foods. Both raw material contamination and cross‐contamination during food processing may have an effect on the prevalence and the concentration of L. monocytogenes in the final product. Concerning exposure of consumers, contamination of raw materials could be critical in cases where low‐processed foods are produced and processing conditions are not efficient enough to reduce or eliminate the bacterium from the final product. In that context, cattle (cows and ewes) suffering from mastitis could be of notice since L. monocytogenes may be shed into the raw milk at very high numbers for extended periods of time and especially for on‐farm dairies that often process such milk without any, or with uncontrolled, heat treatment (Wagner et al., 2005). Other examples could be low‐processed fish products and a variety of foods of non‐animal origin. In all those cases it is possible that the contaminated raw material leads to a contamination of the food processing environment (FPE) and from there to the contamination of the final product. The most important route of contamination is considered to be via FPEs. L. monocytogenes is transmitted to food via introduction from environmental sources outside the processing facility (incoming raw materials, animals, soil, dust and water) into the FPE. Temporal breakdown in hygiene barrier efficiency such as during phases of reconstruction may trigger this and may also lead to a persistent colonisation of an FPE which can be seen as an intermediate step in transmission from the original habitat to the food being processed (Reij et al., 2004). Having colonised an FPE, L. monocytogenes may spread throughout the facility via aerosols, personnel, food workflows, and contaminated contact materials possibly leading to persistence if sanitation procedures are insufficient (Alali and Schaffner, 2013). FPEs often display a multitude of compartments, presenting challenges for efficient cleaning and disinfection. The problem is triggered by other factors such as inappropriate design of equipment, niche adaptation and biofilm formation that may lead to persistence of the bacterium (Carpentier and Cerf, 2011).
3.1.2. Epidemiology of human listeriosis in the EU/EEA
The notification rate of invasive listeriosis has increased between 2008 and 2015, from 0.30 to 0.46 cases per 100,000 population (Table 3). The number of case reports in the EU increased by 60% from 1,381 confirmed cases reported in 2008 to 2,206 cases in 2015. Most listeriosis cases are sporadic and over 98% of human invasive L. monocytogenes infections are acquired domestically and most travel‐related cases have acquired the infection within the EU/EEA (EFSA and ECDC, 2016). In 2015, 270 deaths were reported in the EU, which was the highest annual number of deaths reported due to listeriosis since 2008. The overall CFR was 17.7% in 2015 (EFSA and ECDC, 2016). The causes of deaths among elderly in nursing homes and care facilities may remain undetermined (Buchanan et al., 2017) and therefore mortality may be underestimated for these groups. The more recent (April 2017) reported cases of confirmed human invasive listeriosis and notification rates in the EU/EEA by country and year, sourced from the Surveillance Atlas, are provided in Appendix D.
Table 3.
Reported and published cases of confirmed human invasive listeriosis, related deaths and case fatality rates in the EU, 2008–2015
| Year | Confirmed cases | Notification rate per 100,000 population | Cases with outcome data (% of confirmed cases) | Deaths | CFR (%; 95% CI)i |
|---|---|---|---|---|---|
| 2008a | 1,381 | 0.30 | 653 (47.3%) | 134 | 20.5% (17–24) |
| 2009b | 1,645 | 0.36 | 757 (46.0%) | 126 | 16.6% (14–19) |
| 2010c | 1,601 | 0.35 | 1,063 (66.3%) | 181 | 17.0% (15–19) |
| 2011d | 1,476 | 0.32 | 1,054 (71.4%) | 134 | 12.7% (11–15) |
| 2012e | 1,642 | 0.41 | 1,112 (67.7%) | 198 | 17.8% (16–20) |
| 2013f | 1,763 | 0.44 | 1,228 (69.7%) | 191 | 15.6% (14–18) |
| 2014g | 2,161 | 0.52 | 1,401 (64.8%) | 210 | 15.0% (13–17) |
| 2015h | 2,206 | 0.46 | 1,524 (69.1%) | 270 | 17.7% (16–20) |
CFR: case fatality rate; CI: confidence interval. It should be noted that the case numbers in the Appendix D may differ slightly from the ones presented in this table due to different sources and times (published reports versus real‐time data extracted from the Surveillance Atlas) and different country coverage (EU in this table versus EU/EEA in Appendix D).
2008 report: http://www.efsa.europa.eu/en/efsajournal/pub/1496
2009 report: https://www.efsa.europa.eu/en/efsajournal/pub/2090
2010 report: https://www.efsa.europa.eu/en/efsajournal/pub/2597
2011 report: https://www.efsa.europa.eu/en/efsajournal/pub/3129
2012 report: https://www.efsa.europa.eu/en/efsajournal/pub/3547
2013 report: https://www.efsa.europa.eu/en/efsajournal/pub/3991
2014 report: https://www.efsa.europa.eu/en/efsajournal/pub/4329
2015 report: https://www.efsa.europa.eu/en/efsajournal/pub/4634
Aggregated estimate for reporting countries of case fatality (% of cases with known outcome), CI estimated in this Scientific Opinion.
Estimates of under‐reporting and under‐ascertainment are lower than for many other pathogens (Haagsma et al., 2013), probably due to the severity of listeriosis, and multiplication factors around 1.7 to 2 have been reported in Canada, the USA and the UK (Mead et al., 1999; Adak et al., 2002; Thomas et al., 2013). France estimated in 1997 a sensitivity of 76% for detecting bacteraemia and meningitis cases at the national level (Goulet et al., 2001).
The burden of listeriosis can be measured using disability adjusted life years (DALYs) by adding years of life lost (YLL) due to premature deaths and years of life lived with disability (YLD) (Devleesschauwer et al., 2014). The WHO global burden of disease study estimated the global burden of listeriosis by subregions using DALYs. The estimated DALY for Euro A region was 11,132 in 2010, and the estimated number of listeriosis cases was 1,491 with 352 deaths (de Noordhout et al., 2014). While this region includes only 22 EU/EEA countries and thus does not represent the whole EU/EEA, the disease estimates are close to the reported case numbers from EU/EEA. The EU/EEA‐wide study on burden of food‐borne diseases showed that the main burden of listeriosis is due to its high case fatality (Cassini et al., 2016).
The highest notification rates are commonly seen in the elderly, over 65 years old, and in children under 1 year of age.27 The rate for males was double that for females in the age group 65–74 years in 2015 (Figure 7). In the age group 65–74 years, the rate for males was over 140 times higher than for males in the age group 5–14, while the respective rate ratio was 24 for females.
Figure 7.
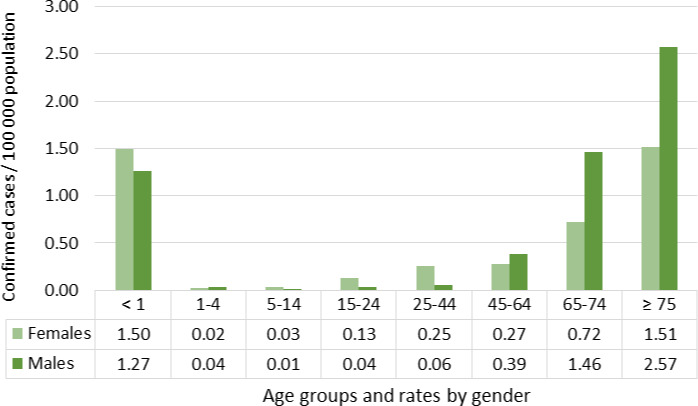
- Source: Data from The European Surveillance System – TESSy, provided by Austria, Belgium, Croatia, Cyprus, the Czech Republic, Denmark, Estonia, Finland, France, Germany, Greece, Hungary, Iceland, Ireland, Latvia, Lithuania, Luxembourg, Malta, the Netherlands, Norway, Poland, Portugal, Romania, Slovakia, Slovenia, Spain, Sweden, the United Kingdom and released by ECDC.
In addition to old age and increased susceptibility due to underlying conditions, medical practices and medications have been hypothesised as risk factors for human listeriosis (ACMSF, 2009a). Of special interest are treatments with proton pump inhibitors (PPI); it has been suggested that they influence susceptibility to several enteric pathogens, e.g. Campylobacter, Salmonella and Listeria (Bouwknegt et al., 2014). PPI increase the gastric pH, encourage growth of the gut microflora, increase bacterial translocation and alter various immunomodulatory and anti‐inflammatory effects (Bavishi and DuPont, 2011; Bouwknegt et al., 2014). A case–control study investigated the association between the use of PPI and the risk of non‐pregnancy‐associated listeriosis using Danish registry data (Jensen et al., 2017). The authors reported a temporal association between increased susceptibility to listeriosis and the use of PPI with an adjusted odds ratio (OR) of 2.81 (95% CI, 2.14–3.69). Based on the adjusted OR the population‐attributable fraction of listeriosis due to current PPI usage was estimated at 8.3%. The OR increased with decreasing age, which might indicate a higher relative impact for people with a lower baseline risk (Jensen et al., 2017).
Lethal L. monocytogenes infections particularly affect the population > 45 years old, with average annual CFRs ranging from 16.0% among 65‐ to 74‐year‐old males to 22.5% among females over 75 years old (Table 4). There were no significant differences in CFR between genders for all age groups except for the age group 21–44 where case fatality was almost four times higher for males than for females.
Table 4.
Mean annual case fatality rates of invasive listeriosis with 95% confidence intervals by age group and gender in the EU/EEA, 2008–2015
| Age group (years) | Males (N = 4,753) | Females (N = 3,837) | ||
|---|---|---|---|---|
| Mean CFR (%) | 95% CI | Mean CFR (%) | 95% CI | |
| < 1 | 12.7 | [8.5–16.9] | 11.6 | [8.0–15.2] |
| 1–20 | 7.6 | [1.8–13.5] | 5.4 | [1.2–9.7] |
| 21–44 | 12.6 | [9.4–15.7] | 3.4 | [1.7–5.1] |
| 45–64 | 17.7 | [15.4–20.1] | 16.1 | [13.3–18.8] |
| 65–74 | 16.0 | [13.5–18.5] | 19.3 | [16.3–22.4] |
| ≥ 75 | 20.3 | [18.3–22.4] | 22.5 | [20.0–25.0] |
CFR: case fatality rate; CI: confidence interval.
Source: Data from The European Surveillance System – TESSy, provided by Austria, Belgium, Croatia, Cyprus, the Czech Republic, Estonia, France, Germany, Greece, Hungary, Ireland, Latvia, Lithuania, Malta, the Netherlands, Norway, Poland, Portugal, Romania, Slovakia, Slovenia, Spain, the United Kingdom and released by ECDC.
3.1.3. Pregnancy‐associated human listeriosis cases
The variable for reporting pregnancy‐associated cases (Yes/No/UNK) was introduced in 2010 for 2009 data. Therefore, the time period for assessing the proportion of pregnancy‐associated cases is 2009–2015. All pregnancy‐associated cases were reported within the three age groups: < 1 year; 15–24 years and 25–44 years old (Table 5). As reporting of pregnancy‐related cases varies by country (i.e. some countries report only a mother, only a child or both) data for children under one year of age is also presented for the sake of completeness. The proportion of unknown information has been, on average, 44% over the years for females in the combined age group 15–44 years and thus the known pregnancy‐associated cases account for about 56% of the reported females in this age group between 2008 and 2015 (N = 603/1,083). After the introduction of a new variable, the first two reporting years tend to be more unstable before the reporting routine has developed.
Table 5.
Number of invasive listeriosis casesa and proportion of reported pregnancy‐association by selected age groups and years in the EU/EEA, 2009–2015
| Year | Age group (years) | ||
|---|---|---|---|
| < 1 | 15–24 | 25–44 | |
| Number of cases (% pregnancy‐associated) | Number of females (% pregnancy‐associated) | Number of females (% pregnancy‐associated) | |
| 2009 | 27 (40.7) | 22 (54.5) | 71 (45.1) |
| 2010 | 70 (90.0) | 10 (20.0) | 49 (53.1) |
| 2011 | 33 (87.9) | 15 (66.7) | 69 (68.1) |
| 2012 | 29 (72.4) | 16 (62.5) | 69 (65.2) |
| 2013 | 32 (84.4) | 12 (58.3) | 71 (73.2) |
| 2014 | 43 (81.4) | 16 (87.5) | 87 (69.0) |
| 2015 | 21 (76.2) | 23 (78.3) | 73 (74.0) |
| Total | 255 (79.2) | 114 (64.0) | 489 (64.6) |
Source: Data from The European Surveillance System – TESSy, provided by Austria, Estonia, France, Greece, Hungary, Ireland, Italy, Latvia, the Netherlands, Poland, Romania, Slovenia, Sweden, the United Kingdom and released by ECDC.
Cases with known data on pregnancy‐association (Y/N).
In the age group 15–24 years, the pregnancy‐associated case proportions were over 50%, except in 2010 when the proportion was about 20% (Table 5). This is probably an artefact due to small numbers and an early reporting phase. No marked change was seen in the age group 25–44 years.
3.1.4. Reported food‐borne listeriosis outbreaks
Data reported in the zoonoses database on occurrence of ‘strong‐evidence’ food‐borne outbreaks caused by Listeria (2008–2015) at EU/EEA level can be found in Appendix E. All outbreaks were caused by L. monocytogenes. A summary is provided in Table 6. A total of 37 strong‐evidence food‐borne outbreaks were reported with 525 human cases, 182 hospitalisations and 37 deaths. Thus, most invasive listeriosis cases appear as sporadic infections and the detected outbreaks are usually small.
Table 6.
Summary of reported strong‐evidence food‐borne outbreaks caused by Listeria monocytogenes in the EU/EEA as reported in the zoonoses database (2008–2015)
| Food vehicle | Serovarm (number of outbreaks) | Number of outbreaks | Place of exposuren (number of outbreaks) | Place of origino (number of outbreaks) | Human cases | Hospitalised casesp | Deathsp | Number of reporting countries | Distribution of outbreaks per country (year of outbreaks)q |
|---|---|---|---|---|---|---|---|---|---|
| Dairy products | 4 | 44 | 42 | 11 | |||||
| Cheesea | 1/2a (3), 1/2b (1) | 4 | D (1), H (3) | P (1), RT (1), U(2) | 44 | 42 | 11 | 3 | DE (2009), AT (2009), BE (2011, 2013) |
| Fish and seafood | 7 | 40 | 25 | 4 | |||||
| Crustaceans, shellfish, molluscs and products thereofb | 3 | H (1), M (2) | P (2), U(1) | 10 | 8 | 2 | 2 | UK (2013, 2013), FR (2013) | |
| Fish and fish productsc | 4 | D (1), H (1), O (1), U(1) | P (1), U(3) | 30 | 17 | 2 | 3 | DE (2010), DK (2010, 2014), NO (2013) | |
| Meat and meat products | 11 | 126 | 58 | 11 | |||||
| Bovine meat and products thereofd | 1/2a (1) | 2 | M (1), U(1) | M (1), P (1) | 12 | 12 | 2 | 2 | DK (2009), UK (2012) |
| Meat and meat productse | 1 | D (1) | U(1) | 34 | NR | NR | 1 | SE (2013) | |
| Other or mixed red meat and products thereoff | 1/2a (2) | 3 | D (2), HM (1) | P (2), U(1) | 34 | 30 | 5 | 3 | UK (2010), FI (2012), SE (2014) |
| Pig meat and products thereofg | 1/2a (4), 4b (1) | 5 | H (2), R (1), Mu (1), O (1) | F (1), R (1), O (1), P (2) | 46 | 28 | 6 | 5 | AT (2008), CZ (2009), CH (2011), BE (2013), IT (2015) |
| Food of non‐animal origin | 2 | 34 | 3 | 5 | |||||
| Vegetables and juices and other products thereofh | 4b (2) | 2 | H (1), HM (1) | P (1), U(1) | 34 | 3 | 5 | 2 | DE (2013), CH (2014) |
| Other | 13 | ||||||||
| Bakery productsi | 2 | H (1), D (1) | P (2) | 16 | 16 | 1 | 2 | FI (2011), UK (2012) | |
| Buffet mealsj | 2 | HM (1), R (1) | HM (1), R (1) | 28 | 5 | 0 | 2 | UK (2014), FI (2015) | |
| Mixed foodsk | 1/2 a (1), 4b (3), O4 (1) | 7 | HM (4), S (1), U(2) | C (1), HM (1), P (1), S (1), U(3) | 192 | 17 | 2 | 5 | UK (2011, 2012), DE (2014, 2015), DK (2014), PT (2015), SE (2015) |
| Other foodsl | 2 | HM (1), O (1) | P (1), U (1) | 45 | 4 | 1 | 2 | UK (2010), DK (2014) | |
| All | 37 | D (5), H (9), HM (8), M (3), Mu (1), R (2), O (3), S (1), U (4) | C (1), F (1), HM (2), M (1), P (14), R (2), RT (1), O (1), S (1), U (13) | 525 | 182 | 37 |
More details can be found in Appendix E.
Local produced soft cheese (L. monocytogenes, serovar unspecified), cheese (acid curd) made from pasteurised milk (L. monocytogenes serovar 1/2a), acid curd cheese (L. monocytogenes serovar 1/2a), more information about food vehicle not reported (L. monocytogenes serovar 1/2a), more information about food vehicle not reported (L. monocytogenes serovar 1/2b).
Crab meat (L. monocytogenes, serovar unspecified), crab meat (L. monocytogenes, serovar unspecified), more information about food vehicle not reported (L. monocytogenes, serovar unspecified).
Herring casserole in vegetable oil (L. monocytogenes serovar 4b), gravad salmon (L. monocytogenes, serovar unspecified), half‐fermented trout (L. monocytogenes, serovar unspecified), smoked trout and smoked halibut (Listeria spp., unspecified).
Beef stew (sous vide) (L. monocytogenes, serovar unspecified), pressed beef also called potted beef and beef stew (L. monocytogenes serovar 1/2a).
More information about food vehicle not reported (L. monocytogenes, serovar unspecified).
Tongue, beef, pork, ham, chicken, turkey (L. monocytogenes serovar 1/2a), meat jelly (L. monocytogenes, serovar unspecified), sausage (L. monocytogenes serovar 1/2a).
Sliced jelly pork (L. monocytogenes serovar 4b), more information about food vehicle not reported (L. monocytogenes serovar 1/2a), more information about food vehicle not reported (L. monocytogenes serovar 1/2a), more information about food vehicle not reported (L. monocytogenes serovar 1/2a).
Mixed salad (L. monocytogenes serovar 4b), pre‐cut salad (L. monocytogenes serovar 4b).
Sponge cake (L. monocytogenes, serovar unspecified), pork pies (L. monocytogenes serovar 4b).
Sandwiches (L. monocytogenes, serovar unspecified).
Sandwiches various and prepared salad dishes (L. monocytogenes O4), sandwiches (L. monocytogenes, serovar unspecified), iceberg lettuce with yogurt dressing, Gouda cheese (L. monocytogenes serovar 1/2a), composite meal (Listeria spp., unspecified).
Salmon and cress sandwiches, egg mayonnaise sandwiches (L. monocytogenes O4), cold cuts (Listeria spp., unspecified).
Serovar included when reported.
Place of exposure: this is the location (‘setting’) where the food was consumed or where the final stages of preparation of the food vehicle took place. D = disseminated cases, HM = hospital or medical care facility, H = household, M = mobile retailer or market/street vendor, Mu = multiple places of exposure in one country, R = restaurant or cafe or pub or bar or hotel or catering service, O = others, S = school or kindergarten, U = unknown or not reported.
Place of origin of the problem: place where the contributory factors occurred. C = canteen or workplace catering, F = farm, HM = hospital or medical care facility, M = mobile retailer or market/street vendor, P = processing plant, R = restaurant or cafe or pub or bar or hotel or catering service, RT = retail, O = others, S = school or kindergarten, U = unknown or not reported.
The figure could be higher as for some outbreaks this was not reported.
Austria (AT), Belgium (BE), the Czech Republic (CZ), Denmark (DK), Finland (FI), France (FR), Germany (DE), Norway (NO), Sweden (SE), Switzerland (CH), the United Kingdom (UK). Data from Spain has not been included in this table because it was provided outside the EFSA zoonoses database and in a different format of aggregation.
The ‘dairy’ food category was responsible for four of these outbreaks causing 44 cases, while ‘fish and seafood’ and ‘meat and meat products’ food categories were responsible for 7 and 11 of these outbreaks causing 40 and 126 cases. In total, these three categories caused 22 (or 59%) strong‐evidence food‐borne outbreaks, 210 (or 40%) human cases, 125 (69%) hospitalisations and 26 (or 70%) deaths. Food of non‐animal origin caused two outbreaks and 34 cases. Some of the outbreaks where the ‘Other’ food category was implicated as the food vehicle may include RTE foods of the three food categories focussed on in this Scientific Opinion, e.g. sandwiches, buffet meal, mixed foods.
The place of exposure (i.e. the location where the food was consumed or where the final stages of preparation of the food vehicle took place) was reported for 33 out of the 37 outbreaks, with nine at the household level, eight at the hospital or medical care facility, six as disseminated cases, three at a mobile retailer or market/street vendor and the remaining seven at another place of exposure. Thus, a substantial number of outbreaks occur in hospitals and other places of exposure where the proportion of individuals being vulnerable to infection with L. monocytogenes is higher than in the remaining population (Table 6) (Silk et al., 2014). The place of origin of the problem (i.e. the place where the contributory factors occurred) was reported for 24 outbreaks with 14 at the processing plant, two at the hospital or medical care facility and two at a restaurant, café, pub, bar, hotel or catering service. The number of outbreaks by year is as follows: 1 (2008), 4 (2009), 4 (2010), 4 (2011), 4 (2012), 8 (2013), 7 (2014) and 5 (2015).
Not all of these outbreaks are characterised by severe systemic forms of listeriosis. In 2015, Germany reported the largest L. monocytogenes (serovar 4b) outbreak affecting 159 cases, of which only two were hospitalised. This outbreak was associated with the consumption of mixed food (rice pudding) and occurred in a school or kindergarten (EFSA and ECDC, 2016). Without this outbreak, the three above‐mentioned categories caused 61% of the strong‐evidence food‐borne outbreaks, 57% of the human cases, 69% of the hospitalisations and 70% of the deaths.
Most outbreaks successfully investigated in the EU‐28 in recent years concerned animal‐derived food or food composed partly from an animal‐derived source (Table 6 and Appendix E). Mainly in the USA, large outbreaks of listeriosis have been reported in recent years where food commodities initially not considered as primary high‐risk foods (Garner and Kathariou, 2016) have been implicated. These commodities included mainly produce (lettuce and fruit) and it should be noted that the first world‐wide report on an outbreak of listeriosis in 1983 also occurred upon consumption of a plant food: coleslaw. Produce is assigned to the category of low‐processed food commodities that may have a higher risk of pathogen transmission due to the rather simple processing chain applied. A cluster of more than 100 infections (147 cases) was reported in the USA in 2011 (McCollum et al., 2013) where epidemiological investigations confirmed that cantaloupe produced by a farm in Colorado was the outbreak source. Unsanitary conditions identified in the processing facility operated by the farm probably resulted in contamination of cantaloupes with L. monocytogenes. Another outbreak also affecting young healthy children and lasting from December 2014 to January 2015 caused 35 cases due to consumption of caramel apples.28 This outbreak is of particular interest for modelling approaches: an outbreak occurred despite both the apple (pH < 4.0) and the caramel coating (free water activity < 0.8) having a physicochemical profile that would deny a growth of L. monocytogenes. The hypothesis is that insertion of the stick led to a juicy interface between the apple and the coating. This growth‐friendly microenvironment led to the observation that even under storage conditions of 7°C, L. monocytogenes could substantially grow (Glass et al., 2015). An outbreak of listeriosis linked to ice cream based milkshakes was associated with the exposure of a large number of consumers. The ice cream in this outbreak was also distributed to hospitals and severe illness was observed in ten highly susceptible individuals29. The exposure with high doses of L. monocytogenes was very unlikely. This outbreak suggests that human listeriosis cases could even occur after distribution of low‐level contaminated products that do not support the growth of this pathogen if a highly vulnerable segment of the population is involved (Pouillot et al., 2015b). Other foods of non‐animal origin recently involved in listeriosis outbreaks were diced celery (in 2010 with 10 cases involved) (Gaul et al., 2013), frozen vegetables (in 2013–2016 with 9 cases involved30) and salads (in 2015–2016 with 19 cases involved31).
3.1.5. Epidemiological relationship between L. monocytogenes isolates of human and food origin along the food chain
Outbreaks of listeriosis occur around the globe every year and investigations have found associations with various food commodities. However, it is important to note that most human listeriosis cases are sporadic and until now sporadic cases of listeriosis were rarely traced to a food source due to methodological limitations. Due to the improved performance of epidemiological tools, case clusters are more effectively identified and the source can be more accurately traced. For instance, in the USA this development is reported to have led to the detection of a larger number of outbreaks with a fewer number of cases (Buchanan et al., 2017). Next generation sequencing (NGS) has improved the detectability of outbreaks dramatically due to the fact that NGS can be applied on high numbers of isolates in a semi‐automated way. Major advancement to an automated processing of raw data was made in the recent years and data exchange is now simpler. This advancement was also illustrated and confirmed by the outsourcing activity 3 when Møller et al. (2017) studied the possible epidemiological relationship of 1,143 L. monocytogenes isolates collected in the EU, of which 333 were human clinical isolates and 810 were food isolates. As the food isolates in this study were focussed on the food categories represented in the BLS, it supported the conclusions in relation to these sources, but it limits conclusions on other potential food sources.
A retrospective analysis of nine outbreaks illustrated the potential of WGS as a tool to detect outbreaks linking cases sometimes extended over periods of time or in different countries. Also based on single nucleotide polymorphism (SNP), a total of 151 clusters were detected, including 124 novel clusters that had not previously been detected. Of these, 48 included one or more isolates from sporadic human cases, four clusters contained isolates from both sporadic cases and known outbreaks and 21 contained isolates from sporadic cases and food. This outsourcing activity illustrates the discriminatory power of WGS, demonstrating its ability to completely change the paradigm of outbreak investigation. WGS comparisons based on SNPs, seven locus multilocus sequence typing (MLST) or core genome MLST (cgMLST) (Moura et al., 2017) result in the detection of specific and sensitive potential links between human cases and/or foods but also the use of higher resolution typing tools requires epidemiological investigation follow up.
Another objective of the outsourcing activity 3 (Møller et al., 2017) was to apply a source attribution approach, and to partition the human disease burden to single sources. Five source attribution models were applied and five and four categories of sources (fish, swine, ovine, bovine and/or poultry) were considered. As explained above, the selection of food isolates in this study focused on the food categories sampled in the BLS, therefore non‐animal sources are not considered in this source attribution analysis. Given the small number of isolates, all of the isolates along the food chain that originate from a particular reservoir were combined. The capability to predict the correct source of strains in the data set was evaluated. The source attribution models performed better than random. Depending on the number of loci used for attribution and based on self‐attribution the best model predicted over 80% of strains to the correct source, while others predicted around 40% of sources correctly. The bovine source was found to be the main source for human disease in all of the models. Limitations of this study, as for source attribution in general, are the available set of strains and the corresponding information for classification and description of the strains. Especially in relation to L. monocytogenes it is extra cumbersome to attribute a strain to a specific food or animal source since contamination during processing is so important.
3.1.6. Analysis of Rapid Alert System for Food and Feed (RASFF) data on L. monocytogenes
RASFF data are used to qualitatively indicate the types and ranges of foods where L. monocytogenes has been recovered during the time period. In the RASFF database, under the product category ‘food’ and hazard ‘Listeria monocytogenes’, there were 760 notifications since 2008. The notifications were screened in duplicate and the majority, 91% (690/760) of notifications, were considered to be RTE foods. The number of notifications by RASFF product category and year can be found in Table 7.
Table 7.
Number of Rapid Alert System for Food and Feed notifications for Listeria monocytogenes by product category and year of notification and considered as ready‐to‐eat
| Product category | Year | |||||||||
|---|---|---|---|---|---|---|---|---|---|---|
| 2008 | 2009 | 2010 | 2011 | 2012 | 2013 | 2014 | 2015 | 2016 | 2008–2016 period (percentage) | |
| Fish and fish products | 11 | 26 | 39 | 54 | 22 | 27 | 43 | 35 | 31 | 288 (41.7) |
| Meat and meat products (other than poultry) | 10 | 10 | 15 | 17 | 17 | 12 | 13 | 16 | 16 | 126 (18.3) |
| Milk and milk products | 22 | 13 | 15 | 23 | 20 | 20 | 29 | 30 | 14 | 186 (27.0) |
| Cereals and bakery products | 1 | 1 (0.1) | ||||||||
| Cocoa and cocoa preparations, coffee and tea | 1 | 1 (0.1) | ||||||||
| Crustaceans and products thereof | 3 | 4 | 1 | 4 | 1 | 1 | 2 | 16 (2.3) | ||
| Eggs and egg products | 1 | 1 (0.1) | ||||||||
| Fats and oils | 1 | 1 (0.1) | ||||||||
| Fruit and vegetables | 1 | 2 | 5 | 1 | 5 | 4 | 18 (2.6) | |||
| Gastropods | 1 | 1 (0.1) | ||||||||
| Herbs and spices | 1 | 1 (0.1) | ||||||||
| Ices and desserts | 1 | 1 (0.1) | ||||||||
| Nuts, nut products and seeds | 1 | 1 | 2 (0.3) | |||||||
| Other food product/mixed | 1 | 2 | 2 | 5 (0.7) | ||||||
| Poultry meat and poultry meat products | 1 | 2 | 2 | 1 | 1 | 3 | 1 | 2 | 4 | 17 (2.5) |
| Prepared dishes and snacks | 1 | 4 | 1 | 2 | 5 | 2 | 2 | 7 | 24 (3.5) | |
| Soups, broths, sauces and condiments | 1 | 1 (0.1) | ||||||||
| All product categories | 46 | 58 | 80 | 99 | 74 | 69 | 94 | 94 | 76 | 690 |
The RTE foods included in the following three RASFF food product categories were most commonly notified: ‘fish and fish products’ (N = 288), ‘milk and milk products’ (N = 186) and ‘meat and meat products other than poultry’ (N = 126). A comparison of the RTE food RASFF notifications with strong‐evidence food‐borne outbreaks described in Section 3.1.4 indicates that food types associated with food‐borne outbreaks are similar to the food types being controlled and found positive. The food categories associated with 59% of strong‐evidence food‐borne outbreaks were associated with 87% of RASFF notifications during this period. In particular, the ‘dairy’ food category was associated with 11% of the total outbreaks while the RASFF category ‘milk and milk products’ was related to 27% of the total RASFF notifications since 2008. Similarly, ‘fish and seafood’ and the RASFF category ‘fish and fish products’ were associated with 19% and 42% of outbreaks and notifications, respectively, while ‘meat and meat products’ were associated with 30% of the total outbreaks and the RASFF category ‘meat and meat products other than poultry’ with 18% of notifications. These findings reinforce that these food categories continue to have public health significance from a food safety perspective.
3.1.7. Summarising remarks for hazard identification
The reported number of confirmed human invasive listeriosis cases in the EU was 60% higher in 2015 (2,206 cases) than in 2008 (1,381 cases). Under‐reporting/under‐ascertainment of listeriosis cases has been estimated at around a factor of 2 in the UK and North America.
Most listeriosis cases are sporadic and almost all (> 98%) human L. monocytogenes infections are acquired domestically and most travel‐related cases have acquired the infection within the EU/EEA.
The highest notification rates of invasive listeriosis in the EU/EEA are commonly seen in the elderly, over 65 years old, and in children under 1 year of age. In 2015, the rate for males was double that for females in the age group over 65 years. In the same year, the notification rate for males was over 140 times higher than for males in the age group 5–14 years, while the respective rate ratio was 24 for females.
In 2015, 270 deaths were reported in the EU, which was the highest annual number of deaths reported due to invasive listeriosis since 2008. The overall CFR was 17.7% in 2015. For those over 45 years old, the average annual CFR in the period 2008–2015 ranged in females from 16.1% among 45–64‐year‐olds to 22.5% for those over 75 years old, and in males from 16.0% for the 65–74‐year‐olds to 20.3% for those over 75 years old.
There were no significant differences in CFRs between genders across age groups except for the age group 21–44 where the case fatality was almost four times higher for males than for females. Data on immunocompetency was not available.
In addition to old age and increased susceptibility due to underlying conditions, medical practices and medications have been hypothesised as risk factors for listeriosis. The use of PPI, which increase gastric pH, was associated with increased susceptibility to non‐pregnancy‐related listeriosis in Denmark with an adjusted OR of 2.81 (95% CI, 2.14–3.69). Based on the adjusted OR the population‐attributable fraction of listeriosis due to current PPI usage was estimated at 8.3%.
In RASFF, 91% of the 760 notifications since 2008 related to L. monocytogenes were considered to be RTE food. The following three RASFF food product categories were most commonly notified: ‘fish and fish products’ (N = 282), ‘milk and milk products’ (N = 186) and ‘meat and meat products other than poultry’ (N = 112). Together these RASFF categories accounted for 87% of the 690 notifications.
Comparisons between RASFF notifications and strong‐evidence listeriosis food‐borne outbreaks indicate that food types being controlled and found positive are often similar to the food types associated with outbreaks. This finding reinforces the fact that these food categories continue to have public health significance from a food safety perspective.
A total of 37 strong‐evidence food‐borne outbreaks caused by L. monocytogenes were reported in the EU/EEA with 525 human cases, 182 hospitalisations and 37 deaths during 2008–2015. Most invasive listeriosis cases appear as sporadic infections and the detected outbreaks are usually small. This makes it difficult to establish links between human cases and causative foods. NGS techniques, when combined with epidemiological information, have shown the potential to attribute relatedness within a cluster and thus establish stronger links between human cases and causative foods.
The ‘meat and meat products’ food category was responsible for 11 of these outbreaks, causing 126 cases. ‘Fish and seafood’ and ‘dairy’ food categories were responsible for respectively seven and four of these outbreaks, causing 40 and 44 cases. In total these three categories caused 59% of the strong‐evidence food‐borne outbreaks and 40% of the human cases. Some of the outbreaks where ‘Other’ was the food category implicated as the food vehicle may include RTE food within these food categories.
Recent outbreak reports such as those associated with cantaloupe and caramel apples in the USA demonstrate that as yet unconsidered RTE food categories of plant‐derived origin under certain conditions can also support growth and have the potential to contribute to the burden of disease. The ice cream outbreak in the USA highlights that human listeriosis cases could occur after widespread distribution of low‐level contaminated products that do not support the growth of this pathogen if a highly vulnerable segment of the population is exposed.
Considering the place of exposure when reported, 28% of the outbreaks were reported at the household level, 25% at a hospital or medical care facility, 16% as disseminated cases, 9% at a mobile retailer or market/street vendor and another 22% at another place of exposure.
The discriminatory power of genotyping by sequencing for outbreak detection was suggested through the outsourcing activity 3. They detected 124 previously not described clusters of strains. Of these, 48 included one or more sporadic human isolates of which four clusters contained both sporadic cases and known outbreaks and 21 contained both sporadic cases and food. Thus, seemingly unrelated sporadic cases of listeriosis, sometimes over extended periods of time or in different countries, could be traced back to food sources. However, epidemiological information is still needed to further investigate the microbiological clusters.
A source attribution study through outsourcing activity 3 on 333 human clinical and 810 food isolates collected in the EU, indicated that the highest share of the human disease burden is attributed to the bovine source using a number of different models. The source attribution models performed better than random and the best model based on self‐attribution of strains predicted over 80% of strains to the correct sources. Limitations of this study, as for source attribution in general, are the available set of strains and the corresponding information for classification and description of the strains. Especially in relation to L. monocytogenes, it is extra cumbersome to attribute an isolate to a specific food or animal source since contamination during processing is so important. These limitations make the conclusions on source attribution uncertain.
3.2. Evidence for hazard characterisation
3.2.1. Biology and virulence of L. monocytogenes
Clinical biology of L. monocytogenes
Listeria monocytogenes has been isolated from more than 40 mammalian and avian species and both humans and animals develop similar forms of disease. After ingestion and passage through the stomach, L. monocytogenes multiplies in the intestinal lumen, crosses the intestinal barrier, enters the bloodstream and accumulates in the liver and spleen. Thereafter, the bacteria can re‐enter the bloodstream to cause central nervous infection or abortion (Vazquez‐Boland et al., 2001). In healthy individuals, infection with L. monocytogenes may cause gastroenteritis (Ooi and Lorber, 2005). Outbreak reports have shown that even a very high contamination level of the food source might only lead to this milder form of listeriosis (Dalton et al., 1997). Moreover, L. monocytogenes can be isolated in some cases from rare sites of infection in the human body such as ankles, eyes and kidneys.
Strains of L. monocytogenes can be grouped into four evolutionary lineages (I–IV), and 13 serotypes. However, strains of only three serotypes (1/2a, lineage II; 1/2b and 4b, lineage I) have been associated with 98% of all human listeriosis cases (Orsi et al., 2011). Lineage I encompasses the clinically relevant serovars 1/2b and 4b whereas serovar 1/2a is accounted to lineage II (Lomonaco et al., 2015).
Organisation of important molecular traits for Listeria virulence
With the availability of the first full genome of L. monocytogenes EGD in 2001, most experts expected a rapid growth in the number of biomarkers that indicate distinct Listeria pathotypes (Glaser et al., 2001). This, however, turned out not to be the case. In the meanwhile, multiple studies have shown that the core genome of L. monocytogenes is stable (Kuenne et al., 2013; Moura et al., 2017). Most genetic rearrangement is conferred through uptake of mobile elements such as plasmids and transposons. Transposons integrate at preferred sites (hotspots) into the L. monocytogenes genome and some of these hotspots are hot candidates in terms of an improved understanding of adaptation against environmental stresses. The main findings in the whole genome sequencing study by Møller et al. (2017) are in line with the ‘stable core genome theory’. Although a huge number of virulence associated genes (N = 115) were tested, more than 80% of the putative marker genes were detected in more than 95% of the test strains of lineage I and II. This finding proves that most virulence markers are ubiquitous to the most important genetic lineages. The majority of markers that were not present in the majority of strains were found in food strains, of those mostly representatives of lineage II.
Four pathogenicity islands have been described in L. monocytogenes and L. ivanovii: LIPI‐1 contains a couple of the major virulence factors such as hly (encodes for a haemolysin), plcB (encodes for phospholipases needed for L. monocytogenes release into the cytosol), actA (encodes the listerial surface protein ActA required for Actin‐based intracytoplasmic movement and cell‐to‐cell spread) and is present in all lineages. Some other important virulence factors mediating entry into host cells such as internalin A and B are encoded by an inlAB operon located outside the classical LIPI‐1. LIPI‐2 contains a sphingomyelinase specific to L. ivanovii and additional internalin genes and was described in L. ivanovii (Vazquez‐Boland et al., 2001; Dominguez‐Bernal et al., 2006). LIPI‐3 encodes for an additional haemolysin called streptolysin S and was most frequently found in clinically relevant lineage I L. monocytogenes strains (Molloy et al., 2011). This finding was confirmed by the WGS study by Møller et al. (2017), who showed that the LIPI‐3 genes and the gene for the virulence protein Vip (vip gene (Cabanes et al., 2005)) were more likely present in clinical and/or lineage I isolates. A fourth pathogenicity island has been very recently described and contains six genes encoding for a cellobiose‐family phosphotransferase system (Maury et al., 2016).
Many of the more than 80 virulence factors known in L. monocytogenes are regulated by the transcriptional regulator PrfA (Freitag et al., 2009). A number of surface proteins including the internalins are crucial for host cell invasion (Bierne et al., 2007). Internalin A (InlA), which interacts with E‐cadherin present at the surface of the host cell, mediates the entry of L. monocytogenes into intestinal epithelial cells (Bonazzi et al., 2009). Several mutations in the inlA gene lead to a premature stop codon and subsequently in a truncated InlA protein. An overview of gene mutations in L. monocytogenes leading to a reduced virulence is provided in Appendix F. These types of mutations, which are carried presumably by environmental and food strains, are associated with attenuated virulence and often found in food isolates (Nightingale et al., 2008; Van Stelten et al., 2010). After L. monocytogenes enters the host cell, it escapes the vacuole, replicates intracellularly and spreads from cell to cell (Cossart, 2011). These processes are mainly mediated by the pore‐forming toxin listeriolysin O, encoded by the hly gene, and products from the plcB gene and other virulence factors (Gedde et al., 2000; Hamon et al., 2012). Some researchers have undertaken further attempts to unravel virulence genes that are associated with higher frequency in either lineage I/II or III/IV. Interesting results suggested carbon source utilisation and tolerance of bile stress as possible triggers for a different pathogenic potential (reviewed in Lomonaco et al. (2015)). As mentioned before, the ability to sequence a vast number of isolates was a leap forward in recent years but proved that the core genome of L. monocytogenes, including most virulence‐associated genes, is rather stable and that most adaptation occurs through mobile elements at a limited number of genetic hotspots (Kuenne et al., 2013). A limitation of sequencing is that gene mapping generates hypotheses but lacks information on whether post‐genetic events could render the proposed effects. A solution to this problem is the use of cell culture for virulence models and animal challenges to study L. monocytogenes pathogenicity in vivo. Approaches differ widely and it is remarkable that in vivo data cannot be deduced from in vitro cell culture‐based data (Disson and Lecuit, 2013). Intravenous, subcutaneous or intraperitoneal infection of rodents were the most frequently used animal studies; however, all these methods of administering strains do not mimic the natural route of exposure. Oral infections of mice would follow the natural route of exposure but were shown to be biased due to a genetic difference between murine and human E‐cadherin in epithelial cells (Lecuit et al., 1999). Transgenic mice (hEcad) have overcome this problem to some extent but are not commercially available (Lecuit and Cossart, 2001). The only other animal model leading to a course of infection comparable to the infection in humans after oral exposure is the guinea pig model. Other model organisms for virulence studies such as gerbils and wax moths are not easily manageable or far from representative of the situation in humans.
Virulence variability in L. monocytogenes
Through the aforementioned studies, it has become clear that L. monocytogenes demonstrates enormous serotype/strain variation in virulence and pathogenicity levels. Epidemic strains from foods are highly infective and sometimes deadly while food or food environment isolates are less associated with human cases and are less virulent mainly due to mutation in the main virulence genes (reviewed by Velge and Roche (2010)). Some listeriosis outbreaks were traced back to foods carrying more than one L. monocytogenes strain of different serotypes and virulence profiles (Gilmour et al., 2010; Laksanalamai et al., 2012; Rychli et al., 2014). Until recently, there was no comprehensive definition of virulence levels of L. monocytogenes that could address the risk assessment aspects of either hypervirulence or hypovirulence (Velge and Roche, 2010). A recent study compared epidemiological results based on genetic typing with sequence information and results from animal models. The study by Maury et al. (2016) included all isolates that were collected in France by the French Listeriosis Reference Centre as a central unit over a 9‐year sampling period resulting in 6,633 isolates, including 2,584 clinical and 4,049 food isolates. The representativeness is provided in the paper. It showed that almost 80% of isolates could be assigned to 12 clonal complexes (CCs). The clones that were more frequently isolated from clinical samples, ‘infection‐associated’, were different from the clones more frequently isolated from food samples, ‘food‐associated’. There were also clones that were ‘intermediate’. Clones CC1, CC2, CC4 and CC6 were to a high probability of clinical origin, whereas CC121 and CC9 were strongly associated with provenance from food. The `infection‐associated′ CCs were most commonly associated with central nervous system (CNS) and maternal–neonatal (MN) infections as opposed to isolated bacteraemia. The ‘food‐associated’ CC121 and CC9 were rarely present in clinical samples but, if recovered from clinical specimens, usually isolated from blood (Maury et al., 2016). The latter CCs were also more frequently associated with highly immunocompromised patients or patients showing a higher number of severe comorbidities. Using a humanised mouse model, it became evident that the food‐associated CCs were less invasive and therefore of a hypovirulent state. Strain sequencing at least partly strengthened the argument that clonal complexes encompassing hypovirulent strains are more likely show mutations in the internalin A gene, which had already been proven for MLST 121 strains in a previous study (Schmitz‐Esser et al., 2015; Maury et al., 2016).
The outcomes of this study were only partly confirmed by the results of the study by Møller et al. (2017). There, a lower number of strains (1,143) were sequenced, isolated during the BLS or mainly during a period of two years in different laboratories from different clinical or food sources. In this study, the isolates of CC121 and CC9 were predominantly having a food origin, which supports the study from Maury et al. (2016). A clear assignment of isolates of CC1, CC2, CC4 and CC6 to a clinical origin was only substantiated for isolates of CC1 and CC4 (see Figure 8). A detailed analysis of isolates of food origin only revealed that strains of CC121, CC8 and CC155 were predominately isolated from fish and fish products, whereas strains of CC31 and CC2 showed higher frequency in meat and meat products. Since the sequenced isolate collection was arbitrarily put together, mainly incorporating isolates from the BLS and a limited sampling interval of two years, conclusions from these results should be taken with care.
Figure 8.
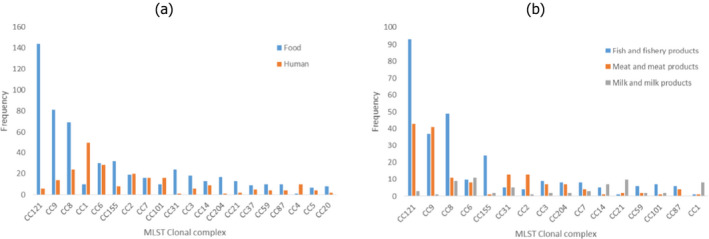
- The y‐axis represents the number of isolates.
Environmental and host‐related factors impacting on virulence
The elucidation of the infection pathway of L. monocytogenes in recent decades has shown that virulence is not a stable characteristic but can be influenced by environmental conditions. So far only a limited number of studies (reviewed by NicAogain and O'Byrne (2016)) investigated the impact of food on the in vitro and in vivo virulence of L. monocytogenes. Temperature, osmotic stress and pH were shown to have an impact on the virulence profile (Andersen et al., 2007; Duodu et al., 2010; Walecka et al., 2011). Milk and milk‐specific characteristics, like fat content, were demonstrated to have an influence on the in vitro virulence of L. monocytogenes as well (Pricope‐Ciolacu et al., 2013). Conclusively, Mahoney and Henriksson (2003) reported that the pathogenicity of L. monocytogenes depends on the nature of the food in which the pathogen is present and Rantsiou et al. (2012) determined that food matrices alter strain‐dependently the expression of several major virulence factors. A recently published study encompassing phenotypic and sequencing approaches found that stress tolerance of L. monocytogenes is associated with serotype, CC, full length inlA gene profiles, and the presence of plasmids. Interestingly, isolates with full length inlA exhibited enhanced cold tolerance relative to those harbouring a premature stop codon in this gene (Hingston et al., 2017). The limitation of all these studies is that they focus on experimental environments or food as only one step of a sequence of events during natural L. monocytogenes infection. L. monocytogenes needs to survive not only in the food environment but also under conditions encountered during the passage through the gastrointestinal (GI) tract of the host and to be subsequently able to cross the intestinal, placental and blood–brain barriers (Lecuit, 2005). All these steps affect the virulence of the pathogen and point towards a finely tuned process that enables L. monocytogenes to infect hosts. When exposed to adverse conditions, like the food environment or the GI tract, L. monocytogenes shapes its transcriptome by activating complex response networks related not only to stress but also to virulence. The main stress response regulator, the alternative sigma factor σB, contributes directly to the regulation of virulence gene expression like inlA, inlB and prfA under conditions typically encountered during GI passage (Nadon et al., 2002; Kazmierczak et al., 2003; Sue et al., 2004). The pathogenicity of L. monocytogenes has been related to the viability of the pathogen in the acidic environment of the stomach and subsequently in the presence of bile in the small intestine (Jiang et al., 2010). L. monocytogenes gene bsh, positively regulated by PrfA, encodes for a bile salt hydrolase that contributes to survival in the GI tract and is involved in the intestinal and hepatic phases of listeriosis (Dussurget et al., 2002; Begley et al., 2005). However, the specific effects on pathogenicity and subsequently on health risk are still not completely understood.
Virulence heterogeneity and detection of L. monocytogenes
A non‐trivial point for interpreting the concepts of clinical and food‐related strains is the impact of hypo/hypervirulence on L. monocytogenes detectability in different matrices. Initial studies published in 2003 have shown that hypovirulent strains appear less frequently on some isolation media (Gracieux et al., 2003). A follow‐up study demonstrated that the effect was most likely due to the composition of the detection media (e.g. antimicrobials added) rather than due to mutations in virulence regulator genes such as prfA (Roche et al., 2009). A follow‐up study on this issue showed that overgrowth of L. monocytogenes most likely has a nutritional basis (Gnanou‐Besse et al., 2010). Hypovirulent strains have generally a reduced PI‐PLC and haemolysis activity, leading to less characteristic colonies on isolation media, in particular on Listeria Agar according to Ottaviani and Agosti, prescribed as first medium in EN ISO 11290‐1. The detection of L. monocytogenes from food during selective enrichment can also be limited by the natural microbiota or by other Listeria spp. (Cornu et al., 2002; Zitz et al., 2011; Keys et al., 2013; Dailey et al., 2014, 2015). The results of coculture experiments conducted at the EURL Lm demonstrated that newly described Listeria species did not have inhibitory activities affecting L. monocytogenes growth (Barre et al., 2016). It was furthermore suggested recently that strain competition within the species L. monocytogenes is one of the factors related to bias during the enrichment and detection procedure in the case of mixed cultures, as a consequence of strain fitness in a given niche like food or other enrichment conditions (Gorski et al., 2006; Zilelidou et al., 2016b). In the case of a food product contaminated with multiple L. monocytogenes strains, the strain with the growth disadvantage will be missed during enrichment (Zilelidou et al., 2016a). The Jameson effect, or the growth inhibition due to a lack in nutrient availability, gives a competitive advantage to the numerically dominant species (Mellefont et al., 2008). Anyhow, this was not the case for L. monocytogenes co‐cultures as growth competition also occurs between L. monocytogenes strains with similar growth rates (Zilelidou et al., 2016b). Inhibition of growth through production of bacteriocins or bacteriophages was also proposed (Cornu et al., 2002). One can speculate that the newly discovered recombination hotspot repeat genes in the genome of often food‐associated ST121 strains, suggested to be involved in cell–cell interactions, might provide a better competition against other bacteria or other L. monocytogenes strains (Schmitz‐Esser et al., 2015). However, future work is needed to confirm this hypothesis as a critical role of cell contact in growth inhibition and virulence competition has already been shown (Zilelidou et al., 2015). The advantage of certain L. monocytogenes strains during competition could not be correlated with the serotype (Gorski et al., 2006; Zilelidou et al., 2016b) even if a lineage‐dependent detection of strains during enrichment (Bruhn et al., 2005) and a competitive advantage of serotype 1/2a strains over serotype 4b in biofilm formation were reported (Pan et al., 2009).
The presence of more than one L. monocytogenes isolate in food can lead to increased infection rates due to synergistic effects on the virulence potential. Specifically, in cocultivation experiments, L. monocytogenes isolates considered strong growth competitors, as their growth was not or only slightly attenuated by other isolates, showed high invasiveness compared to weak fitness competitors (Zilelidou et al., 2015). Furthermore, L. monocytogenes isolates classified as virulent reach significantly higher cell counts on selective agar media than non‐virulent isolates in single cultures (Gracieux et al., 2003). It was speculated that cell contact co‐cultivation of L. monocytogenes isolates can lead to an induction of virulence gene expression for strong competitor strains and might trigger strain competition for entry into the host cells (Zilelidou et al., 2015). However, further confirmation through gene expression studies is needed.
3.2.2. Clinical picture of reported human listeriosis cases in the EU/EEA
The population groups at highest risk for severe listeriosis are the elderly, pregnant women and those with underlying immunosuppressive conditions (Maertens De Noordhout et al., 2016; Pfaff and Tillett, 2016). Over 97% of human listeriosis cases reported in the EU/EEA with available data were hospitalised (EFSA and ECDC, 2016), reflecting the focus of EU‐level surveillance on invasive forms of the disease. In a Belgian study by Bertrand et al. (2016), cancer was the most common (43%) underlying condition in human listeriosis cases for all serotypes with known data (N = 426) followed by digestive diseases with 12% (46% with no indication of underlying condition).
In the pooled TESSy data from 2011 to 2015,32 information on clinical specimen type was reported for almost 3,600 cases (39.2% of all reported cases during that time period). Of these, 71.8% were septicaemia (specimen = blood) and 19.4% meningitis (specimen = cerebrospinal fluid, CSF), while 8.4% of the samples were from ‘other sterile site’ (these are not specified but could be, e.g. joints, heart or eyes). Only 11 positive samples (0.3%) were reported from a non‐sterile site (e.g. placental tissue), all from females under 44 years old. Bloodstream infections were relatively more common (45.1%) in the very elderly (over 75 years old) whereas meningitis was mainly (29.6%) reported in the middle‐aged group (45–64 years old) (Table 8).
Table 8.
Specimena types of reported invasive listeriosis cases by age groups in the EU/EEA, N = 3,597, 2011–2015
| Age group (years) | Blood | CSF | Other sterile site | Non‐sterile site |
|---|---|---|---|---|
| N (%) | N (%) | N (%) | N (%) | |
| < 1 | 71 (2.7) | 16 (2.3) | 9 (3.0) | 3 (27.3) |
| 1–20 | 37 (1.4) | 29 (4.1) | 9 (3.0) | 1 (9.1) |
| 21–44 | 249 (9.7) | 92 (13.1) | 90 (29.6) | 7 (63.6) |
| 45–64 | 515 (20.0) | 205 (29.3) | 69 (22.7) | 0 (0.0) |
| 65–74 | 545 (21.1) | 177 (25.3) | 53 (17.4) | 0 (0.0) |
| ≥ 75 | 1,165 (45.1) | 181 (25.9) | 74 (24.3) | 0 (0.0) |
| Total | 2,582 (100.0) | 700 (100.0) | 304 (100.0) | 11 (100.0) |
CSF: cerebrospinal fluid; N: No of cases with the specimen type used for diagnosis of case; %: Percentage of cases with a specimen type in an age group.
Source: Data from The European Surveillance System – TESSy, provided by Austria, Croatia, Estonia, France, Hungary, Lithuania, Luxembourg, the Netherlands, Norway, Poland, Portugal, Romania, Slovakia, Slovenia, Spain, the United Kingdom and released by ECDC. Age was missing for one case with specimen type ‘blood.’
Specimen types were introduced to EU‐level reporting in 2012.
Tables 9 and 10 show the CFR values in the different age groups and each gender. For infections caused by L. monocytogenes serogroup IIa, the CFR was significantly lower in the female age group 1–44 years with no significant differences between other age and gender groups (Table 9). A significantly lower CFR was also estimated in the female age group 1–44 years for infections caused by L. monocytogenes serogroup IVb. An association with CFR and age was noted for serotype IVb (Table 10). The results are further visualised in Figure 9. As the infections with serogroup IVb are most commonly reported in humans in the EU/EEA, the severity of these infections is noteworthy and requires further study.
Table 9.
Case fatality rates in males and females in different age groups in invasive human infections with Listeria monocytogenes serogroup IIa, pooled data, 2007–2015
| Age group (years) | Males (N = 779) | Females (N = 715) | ||||||
|---|---|---|---|---|---|---|---|---|
| Total | Death | CFR | Groupa | Total | Death | CFR | Groupa | |
| 1–44 | 36 | 6 | 0.17 | b | 105 | 6 | 0.06 | a |
| 45–64 | 204 | 47 | 0.23 | b | 142 | 26 | 0.18 | b |
| 65–74 | 219 | 38 | 0.17 | b | 157 | 37 | 0.24 | b |
| ≥ 75 | 320 | 58 | 0.18 | b | 311 | 68 | 0.22 | b |
CFR: case fatality rate.
Source: Data from The European Surveillance System – TESSy, provided by Austria, Belgium, France, Germany, Hungary, Ireland, Italy, Lithuania, Luxembourg, the Netherlands, Norway, Poland, Portugal, Romania, Slovenia, Sweden, the United Kingdom and released by ECDC.
Letters are used to indicate which CFR values are significantly different. For example, when CFR values are not significantly different they will have the same letter and values that are significantly different will have a different letter (i.e. a, a, b would mean that the first and second groups both differ from the third group but not between each other).
Table 10.
Case fatality rates in males and females in different age groups in invasive human infections with Listeria monocytogenes serogroup IVb, pooled data, 2007–2015
| Age group (years) | Males (N = 1025) | Females (N = 789) | ||||||
|---|---|---|---|---|---|---|---|---|
| Total | Death | CFR | Groupa | Total | Death | CFR | Groupa | |
| 1–44 | 78 | 8 | 0.10 | b | 164 | 2 | 0.01 | a |
| 45–64 | 285 | 48 | 0.17 | bc | 151 | 27 | 0.18 | bc |
| 65–74 | 254 | 62 | 0.24 | cd | 154 | 39 | 0.25 | cd |
| ≥ 75 | 408 | 113 | 0.28 | d | 320 | 98 | 0.31 | d |
CFR: case fatality rate.
Source: Data from The European Surveillance System – TESSy, provided by Austria, Belgium, France, Germany, Hungary, Ireland, Italy, Lithuania, Luxembourg, the Netherlands, Norway, Poland, Portugal, Romania, Slovenia, Sweden, the United Kingdom and released by ECDC.
Letters are used to indicate which CFR values are significantly different. For example, when CFR values are not significantly different they will have the same letter and values that are significantly different will have different letter (i.e. a, a, b would mean that the first and second groups both differ from the third group but not between each other’).
Figure 9.
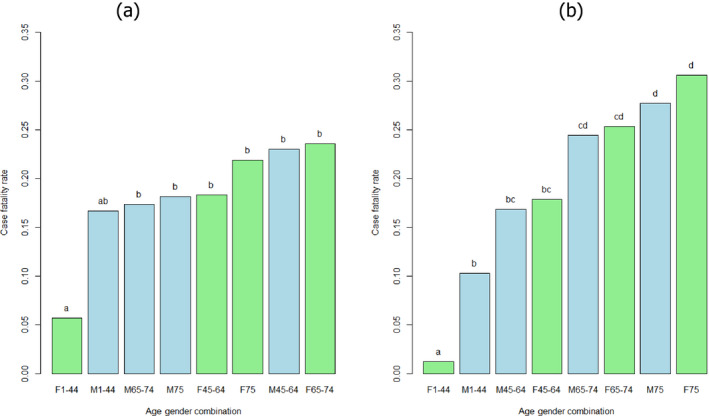
- F: female (green bar); M: male (blue bar).
- Case fatality rate values not significantly different have the same letter (comparisons only within groups). Multiple comparison analysis conducted in each serogroup separately with alpha = 0.1.
3.2.3. Listeria monocytogenes dose–response relationships
The conceptual process upon which microbial DR models are developed comprises four biologically plausible steps: (i) ingestion of an assumed number of organisms by a host individual; (ii) ingested organisms passing through the various barriers and surviving until they reach the target site; (iii) surviving organism(s) causing infection and (iv) infection resulting in illness. The current DR models are specified upon the assumptions that encompass all four probabilistic elements involved in this process: random number of ingested organisms, random number of surviving organisms and reaching the target site, concentration‐independent probability of surviving organisms resulting in infection; and of illness following infection. Therefore, within the microbial DR models framework, it is generally accepted that the minimal infective dose is one cell associated with a probability of infection or illness (r). If each cell is capable of inducing illness (‘single‐hit’), then the probability of illness given a known number of ingested cells D can be derived from:
| (13) |
The underlying assumption of the single‐hit model is then the absence of interaction between the ingested cells where r is assumed to be independent of the size of the ingested dose. The interpretation of the probability derived from the single‐hit model means that the single‐hit model provides a conditional probability of illness given a value of r and a number of ingested bacteria which roughly represents the outcome of the interaction between the individual characteristics of the exposed host, the bacterial strain characteristics and the food characteristics. Thus, the parameter r is expected to be highly variable and should be specified for each single exposure occasion.
If the variability in the parameter r is addressed, with the function f(r) being the probability distribution for r, the probability of illness can be derived from:
| (14) |
This new probability of disease has a different interpretation from that calculated with the single‐hit model. It represents the marginal probability of illness given an exposure to D organisms. By marginal we mean here the probability of illness in an exposed population (average probability of illness).
To capture the variability of the parameter r, different approaches are used: including a full characterisation of the probability distribution of r or a stratification of the exposed population. In the latter approach, different values of r for different segments of the population and no variability within each segment of the population are assumed. In doing so, only variability attributable to host group factors is integrated. The general approach to estimate r is by combining an extensive exposure assessment encompassing ‘all’ RTE foods with epidemiological data on the observed number of cases and relative risk of the different population segments (for example, see Table 11). The r values are then optimised so that the estimated number of cases matches the observed number of cases.
Table 11.
Epidemiological data used to assess the dose–response model of Pouillot et al. (2015b)
| Subpopulation group | Number of individuals in France (Goulet et al., 2012)(A) | Invasive listeriosis cases in France (2001–2008)(B) | Proportion(C) = (A/total of A) | RR(D) = (B/A) × (Total of A/Total of B) | Expected confirmed cases in EU/EEA 2008–2015(D × C × total cases in EU/EEA) | Percentage of expected confirmed cases in EU/EEA 2008–2015 |
|---|---|---|---|---|---|---|
| Under 65 years old, no known underlying condition (i.e. ‘healthy adult’) | 48,909,403 | 189 | 0.767 | 0.126 | 1,351 | 9.65 |
| Over 65 years old, no known underlying condition | 7,038,068 | 377 | 0.110 | 1.743 | 2,695 | 19.24 |
| Pregnancy | 774,000 | 347 | 0.012 | 14.591 | 2,480 | 17.71 |
| Non‐haematological cancer | 2,065,000 | 437 | 0.032 | 6.887 | 3,123 | 22.31 |
| Haematological cancer | 160,000 | 231 | 0.003 | 46.988 | 1,651 | 11.79 |
| Renal or liver failure (dialysis, cirrhosis) | 284,000 | 164 | 0.004 | 18.794 | 1,172 | 8.37 |
| Solid organ transplant | 25,300 | 16 | 0.0004 | 20.582 | 114 | 0.82 |
| Inflammatory diseases (rheumatoid arthritis, ulcerative colitis, giant cell arteritis, Crohn's disease) | 300,674 | 68 | 0.005 | 7.361 | 486 | 3.47 |
| HIV/AIDS | 120,000 | 22 | 0.002 | 5.967 | 157 | 1.12 |
| Diabetes (type I or type II) | 2,681,000 | 79 | 0.042 | 0.959 | 565 | 4.03 |
| Heart diseases | 1,400,000 | 29 | 0.022 | 0.674 | 207 | 1.48 |
| Total | 63,757,445 | 1,959 | 1 | 14,002 |
HIV/AIDS: Human immunodeficiency virus infection and acquired immune deficiency syndrome.
Number of persons with underlying conditions and number of cases of invasive listeriosis observed in France, 2001–2008 used by Pouillot et al. (2015b); and expected number of invasive human listeriosis cases per population segments in the EU/EEA (2008–2015) estimated based on the French data in this Scientific Opinion.
Commonly, the original single‐hit response model is replaced by the single‐hit exponential DR model (named exponential model). In this model, it is assumed that the actual ingested dose is uncertain but can be described by a Poisson distribution with a mean equal to λ:
| (15) |
Exponential DR models have been extensively used for the characterisation of the L. monocytogenes DR relationship (Farber et al., 1996; Notermans et al., 1998; Lindqvist and Westoo, 2000; Chen et al., 2003; Franz et al., 2010; Mataragas et al., 2010; Tromp et al., 2010; Busschaert et al., 2011; FAO and WHO, 2014; Sant'Ana et al., 2014; Vasquez et al., 2014).
Using epidemiological data, the Food and Agriculture Organization and the World Health Organization (FAO and WHO, 2004) estimated r, the probability of illness after consumption of one cell of L. monocytogenes, at around r1 = 5 × 10⁻¹² for susceptible host individuals (immunocompromised persons, pregnant women, and elderly persons), and r2 = 5 × 10⁻¹⁴ for non‐susceptible persons. Including uncertainty, the 5th percentiles are 2.47 × 10⁻¹³ for r1 and 3.55 × 10⁻¹⁵ for r2, and the 95th percentiles are 9.32 × 10⁻¹² for r1 and 2.70 × 10⁻¹³ for r2.
In the Food and Drug Administration and Food Safety and Inspection Service risk assessment (FDA and FSIS, 2003), DR relationships for invasive listeriosis were characterised for three population groups: (i) the perinatal (fetuses and neonates infected in utero by contaminated foods consumed by their mothers), (ii) elderly people (60 years old and older) and (iii) the intermediate‐age population (including healthy individuals and certain susceptible subpopulations, such as AIDS patients or individuals under immunosuppressive therapy). Five different DR models fitted to one data set obtained from mice infected with a single strain of L. monocytogenes (Golnazarian et al., 1989) were used to characterise the model uncertainty, although the exponential model received the greatest weight as it was the best‐fitting model. The variability in virulence of L. monocytogenes strains was estimated on the basis of mice experiments, and variability in host susceptibility was estimated based on mice studies and human epidemiological data. Furthermore, FoodNet surveillance data on the incidence rates of listeriosis in the USA were used to adjust the mortality curves to reduce the resulting overestimation of listeriosis risk, reflecting the different susceptibility between mice and humans (FDA and FSIS, 2003; Hoelzer et al., 2013).
The exponential DR model for L. monocytogenes has recently been applied, also taking into account the actual heterogeneity observed in the pathogen–host interaction by means of a probability distribution for the parameter r (Mataragas et al., 2010; Gkogka et al., 2013; Sant'Ana et al., 2014; Pouillot et al., 2015b). Pouillot et al. (2015b) carried out a refinement of the exponential model used in the FAO and WHO L. monocytogenes risk assessment (FAO and WHO, 2014) to more adequately represent extremely susceptible population subgroups and highly virulent L. monocytogenes strains. A model incorporating adjustments for variability in L. monocytogenes strain virulence and host susceptibility was derived for 11 population subgroups with similar underlying comorbidities using data from multiple sources, including human surveillance and food survey data.
The lognormal‐Poisson DR model was chosen and proved able to reconcile DR relationships developed based on surveillance data with outbreak data. In comparison, the classical beta‐Poisson DR model was insufficiently flexible for modelling L. monocytogenes DR relationships, especially in outbreak situations. Overall, the modelling results suggest that most invasive listeriosis cases are linked to the ingestion of highly contaminated food items (Pouillot et al., 2015b). The relationship derived by Pouillot et al. (2015b) can be considered an ‘extended’ exponential model, which encompasses the risk of listeriosis in those population subgroups at highest risk of listeriosis.
The Pouillot et al. (2015b) DR model is mathematically described as follows:
| (16) |
where:
λ is the expected number of L. monocytogenes cells in one typical portion of a RTE food
f(r): is the probability density function describing the variability of the parameter r
-
log10 (r) ˜ Normal(μ,σ)
-
–
The mean (μ) is specific to each of the considered 11 population segments (see Table 12).
-
–
The standard deviation (σ) is assumed to be the same for all the population segments. It is summarising the variability between L. monocytogenes strains (σs) and host individual susceptibilities (σh). Twelve per cent of the overall variability of r (σ2) is attributed to strain variability, the rest is for host individuals’ variability within each population segment (Pouillot et al. (2015b)).
-
–
Table 12.
| Subpopulation group | Geometric mean of r | 95% variability interval of ra |
|---|---|---|
| Under 65 years old, no known underlying condition (i.e. ‘healthy adult’) | 7.82E‐15 | [3.6E‐18,1.7E‐11] |
| Over 65 years old, no known underlying condition | 1.47E‐13 | [6.7E‐17,3.2E‐10] |
| Pregnancy | 1.99E‐12 | [9.0E‐16,4.4E‐09] |
| Non‐haematological cancer | 7.68E‐13 | [3.5E‐16,1.7E‐09] |
| Haematological cancer | 9.51E‐12 | [4.3E‐15,2.1E‐08] |
| Renal or liver failure (dialysis, cirrhosis) | 2.76E‐12 | [1.3E‐15,6.1E‐09] |
| Solid organ transplant | 3.11E‐12 | [1.4E‐15,6.9E‐09] |
| Inflammatory diseases (rheumatoid arthritis, ulcerative colitis, giant cell arteritis, Crohn's disease) | 8.35E‐13 | [3.8E‐16,1.8E‐09] |
| HIV/AIDS | 6.44E‐13 | [2.9E‐16,1.4E‐09] |
| Diabetes (type I or type II) | 7.39E‐14 | [3.4E‐17,1.6E‐10] |
| Heart diseases | 4.96E‐14 | [2.2E‐17,1.1E‐10] |
HIV/AIDS: Human immunodeficiency virus infection and acquired immune deficiency syndrome.
The total variability is 1.62; the variability attributable to host individuals’ differences is 0.55.
In the model by Pouillot et al. (2015b), the potential of a given L. monocytogenes strain to cause disease (i.e. strain virulence determined by a given set of transient and fixed virulence factors) were considered independent of the susceptibility of a given host to listeriosis (i.e. host susceptibility due to a given set of comorbidities and other factors impacting individual susceptibility such as genetic predisposition). To derive estimates for σ, the estimates of variability in susceptibility presented in the Food Safety and Inspection Service and Food and Drug Administration risk assessment (FSIS and FDA, 2013) were used.
| (17) |
Figure 10 shows the marginal DR models for each of the 11 considered population segments.
Figure 10.

Dose–response models (probability of severe listeriosis cases conditional to the exposed dose) for each of the 11 population segments considered in Pouillot et al. (2015b)
Table 12 provides the estimated parameter of the Pouillot et al. (2015b) DR model. The Pouillot et al. (2015b) and the FAO/WHO models were both applied for the under 65, over 65 and the pregnant populations in the recent L. monocytogenes risk assessment by Pérez‐Rodríguez et al. (2017).
In 2015, data from an outbreak of listeriosis linked to milkshakes made from ice cream produced in one factory showed that contaminated products were distributed widely to the public without any reported cases, except for four cases of severe illness in persons who were highly susceptible. These data were used by Pouillot et al. (2016) to estimate the r parameter. The average level of contamination was 8 CFU/g and accounting for the uncertainty about the actual exposure dose, r was estimated within the range 1.2 × 10⁻⁷ to 5.5 × 10⁻⁷ for susceptible individuals such as those in the outbreak. This result is in the same order of magnitude of the estimated r parameter by FAO and WHO (2014), 3.2 × 10⁻⁷, from data collected during a listeriosis outbreak involving immunocompromised patients in Finland in 1998–1999. Using the model of Pouillot et al. (2015b), the r values estimated from the ice cream outbreak data are almost 2 log10 higher than those based on the epidemiological data used in the original publications to estimate r values. These differences could be explained by a particularly virulent strain of L. monocytogenes present in ice cream or by outbreak investigation biases.
3.2.4. Summarising remarks for hazard characterisation
Listeria monocytogenes is a facultative intracellular pathogen responsible for severe illnesses in humans and animal species. In addition to the systemic forms of listeriosis, a gastroenteric form exists that most likely occurs in non‐immunocompromised individuals. This form of listeriosis is less well reported and its pathogenicity is less well understood.
In the EU/EEA, during the 2008–2015 time period, bloodstream infections were the most commonly sampled and reported clinical forms of invasive L. monocytogenes infections (71.8% of confirmed cases), followed by meningitis (19.4% CSF samples).
The CFR values ranged from 0.06 to 0.24 for the serogroup IIa and from 0.01 to 0.31 for the serogroup IVb. For serogroup IIa CFR values were significantly lower in the female group of age 1–44. This was also true for serogroup IVb and the CFR in the 65–74 and the ≥ 75 groups was highest and higher than the CFR in the other age and gender groups.
There is ample evidence for a high variability regarding the virulence potential and pathogenicity of different L. monocytogenes isolates. Strains of only three serotypes (1/2a, lineage II; 1/2b and 4b, lineage I) have been associated with 98% of all human listeriosis. Recent studies have shown that truncation in inlA affects the virulence of L. monocytogenes but also phenotypic features such as cold adaptation. Mutations in the inlA gene are a frequent feature (> 30%) of L. monocytogenes and an attribute of some molecular subtypes such as MLST ST121 strains.
Epidemiological data from a French strain collection (more than 6,000 isolates from both clinical specimens and food items) combined with genetic sequence information and results from animal models indicate that 12 clonal complexes make up almost 80% of all isolates, and that different levels of virulence may be associated with these.
Listeriosis is a food‐borne illness, but CCs have, according to one study, been termed ‘infection‐associated,’ ‘food‐associated’ or `intermediate′ depending on the relative proportion of isolates isolated from clinical, food and both. ‘Infection‐associated’ CCs are most commonly associated with CNS and MN infections as opposed to bacteraemia alone. `Food‐associated′ CCs are rarely isolated from invasive clinical samples but, when recovered from clinical specimens, usually isolated from blood. In addition, `food‐associated’ CCs are more frequently associated with highly immunocompromised patients or patients showing a higher number of severe comorbidities. Based on humanised mouse models, it appears that ‘food‐associated’ CCs are less invasive (hypovirulent) than the ‘infection‐associated’ CCs. When more data becomes available, e.g. on occurrence, virulence and DR, it may be considered appropriate to carry out a risk assessment for different CCs of L. monocytogenes.
A non‐trivial point for interpreting the concepts of ‘infection‐associated’ and ‘food‐associated’ strains is the detectability of different CCs in different matrices. Overgrowth of L. monocytogenes by non‐pathogenic Listeria isolates during enrichment and detection has been reported and traced to composition of detection media, natural microbiota in the sample, intraspecies competition, bacteriophages and cell–cell contact. The international reference method, Standard EN ISO 11290‐1 recently revised, is well established and widely used for L. monocytogenes detection in samples from the food chain (food, feed and environment of food production).
Despite the observed variability in their virulence potential almost every L. monocytogenes strain has the ability to result in human listeriosis because of the complex interaction between the pathogen, food and host.
The probability of a single CFU to cause illness in a specific host population is reflected in the parameter r. This r parameter includes both the virulence of different L. monocytogenes isolates and the susceptibility of different human subpopulations. Most current DR models build on the exponential model but can be distinguished based on how the distribution of variability and uncertainty of the r parameter is addressed. The available r values range from 10−15 for < 65 years old without underlying conditions, to 10−12 for the most susceptible subpopulations, and can, when estimated for specific outbreaks with highly susceptible populations, be as high as 10−7.
A systematic literature review identified the exponential model approaches adopted by the FDA/FSIS and FAO/WHO (FDA and FSIS, 2003; FAO and WHO, 2004) as being employed in about half of the existing risk assessments.
A lognormal‐Poisson extension of the exponential model used in the FAO/WHO L. monocytogenes risk assessment (FAO and WHO, 2004), and the Pouillot et al. (2015b) model, incorporating the virulence and susceptibility variability for 11 population groups, suggests that most human invasive listeriosis cases are linked to the ingestion of highly contaminated food items.
Incorporating adjustments for variability in strain virulence and host susceptibility in the lognormal‐Poisson model was associated with an increase in the probability of observing listeriosis cases conditional to the exposure doses.
Recent outbreak investigations, e.g. the US ice cream outbreak, showed that listeriosis cases in highly susceptible persons were associated with a no‐growth product, with a very low average level of contamination (8 CFU/g). However, in those outbreaks, it cannot be excluded that the cases were due to the exposure to high doses considering the distribution of the initial concentration and the further preparation.
The impact of environmental factors in the food and conditions in the human host on L. monocytogenes virulence/pathogenicity and subsequently on health risk is not completely understood.
3.3. Evidence for exposure assessment
3.3.1. Persistence of L. monocytogenes strains in the food processing environment
As a saprophyte, L. monocytogenes effectively colonises food contact materials and other niches in FPEs. Once residing in a niche, L. monocytogenes is hard to eradicate. The question is still valid if persistence is a more passive process of strains not exposed to a sufficient level of sanitation (hygiene failures) or if genetic determinants of some L. monocytogenes strains contribute to the phenomenon (Carpentier and Cerf, 2011). In a comprehensive study, over 2,200 environmental samples were collected following a harmonised sample scheme from 12 European food processing facilities producing RTE foods of animal origin. FPEs in each of the facilities were found positive at least once during the sampling period and the overall occurrence rate of L. monocytogenes was 12.6%. FPE at meat‐producing facilities were found to be positive at a fourfold higher rate than at milk‐processing facilities. A spatial evaluation of sampling schemes showed three distinct contamination scenarios: (i) widely disseminated (repeated isolation of L. monocytogenes from different areas and compartments); (ii) direct (repeated positive results from the same area, often close to entrances) and (iii) hotspots (infrequent positive results from single spots such as salt baths, etc. (Muhterem‐Uyar et al., 2015). From this and other studies, it can be concluded that L. monocytogenes can be detected in most FPEs over time to a varying degree, and a total absence of L. monocytogenes in the FPE cannot be expected. This highlights the need for appropriate sampling programmes and corrective actions to prevent L. monocytogenes from being transmitted from in‐house sources to the product. One approach envisaged in the USA for L. monocytogenes control is the ‘seek and destroy’ concept (Malley et al., 2015).
Listeria monocytogenes can persist for months or even years in various environmental niches, including chilled food plants (Lundén, 2004; Møretrø and Langsrud, 2004; Keto‐Timonen et al., 2007; Schmitz‐Esser et al., 2015). Survival in nature seems to be dependent on altitude and humidity (Linke et al., 2014). Persistence could be due to high adaptive capacity against physical–chemical factors and due to other genetic determinants increasing survival capacity. Studies on the biofilm‐forming capacity of L. monocytogenes do not result in a conclusive picture. Although attempts were undertaken to identify gene products that go with biofilm formation in L. monocytogenes (Piercey et al., 2016), it is still under debate whether this bacterium is an effective biofilm producer (Barbosa dos Reis‐Teixeira et al., 2017). A limitation of some biofilm studies is that they are performed in highly artificial experimental settings (plastic microtitre plates) or that the phenotype strongly varies, with some strains producing biofilms and others not (Borucki et al., 2003). While some evidence exists that persistent strains may cope better with conditions in food environment than non‐persistent strains, there is also contrary evidence. Regarding the physical–chemical factors, to withstand a wide range of temperatures (2–45°C), L. monocytogenes changes its fatty acid composition of cell membranes (Annous et al., 1997). L. monocytogenes is able to grow/survive at pH of 4.1–9.6 (Lungu et al., 2009). Some evidence exists that persistent strains may cope better with acidic conditions than non‐persistent strains do (Lunden et al., 2008). The acid tolerance response (ATR) system allows the survival of L. monocytogenes at low pH values up to 5.5. In addition, through the activation of the ATR system bacterial cells can also become adapted to severe acid stress (pH 3.5; (O'Driscoll et al., 1996)). Moreover, the glutamate decarboxylase (GAD) system is also responsible for acid resistance (Cotter et al., 2001).
Listeria monocytogenes is also well adapted to osmotic stress, particularly to high concentrations of salt (Gandhi and Chikindas, 2007). As many as 21 functionally active osmoprotective systems have been described up to now (reviewed by Burgess et al. (2016)). Two groups of proteins were distinguished, namely salt shock proteins and stress acclimation proteins (Duche et al., 2002). To name two mechanisms, L. monocytogenes cells accumulate osmoprotectants such as glycine betaine, proline betaine, acetyl carnitine, carnitine, butyrobetaine and 3‐dimethylsulfoniopropionate which protect the cells against high salt concentrations (Bayles and Wilkinson, 2000). Furthermore, there is a two‐component regulatory system consisting of a homologous KdpE protein (an ATPase with high affinity for potassium), inter alia, which receives potassium under salt stress into the cells. The high potassium concentrations in the cells activate the two stress‐regulating genes kdpE (encodes the response regulator) and the downstream gene orfX (Walderhaug et al., 1992; Brondsted et al., 2003). Along with osmotic stress, desiccation stress might have an important impact on L. monocytogenes growth. L. monocytogenes positive samples from food products with low water activity (aw) have been repeatedly reported. In comparison to other stress‐related factors, there is relatively little knowledge on desiccation tolerance of L. monocytogenes available in the scientific literature (Burgess et al., 2016). Cold adaptation in L. monocytogenes is a particular feature of this facultative pathogen and often associated with osmotic stress tolerance. L. monocytogenes possesses small, highly homologous protein members of the cold shock protein (Csp) family but there are other molecular mechanisms described that contribute to the cold adaptation potential (Tasara and Stephan, 2006). Csps and cold acclimation proteins are temperature‐induced (Bayles et al., 1996). Furthermore, L. monocytogenes is able to accumulate cryoprotectants such as glycine betaine and carnitine at refrigeration temperatures (Bayles and Wilkinson, 2000; Angelidis and Smith, 2003). Cold adaptation makes L. monocytogenes particularly capable of surviving in food stored in cold chains of modern food production and retail systems (see Section 3.3.3).
Against this background, scientific studies are being performed to better understand the genetic determinants that contribute to the persistence phenomenon. It is well established that some clones of L. monocytogenes tolerate higher concentrations of disinfectants. A transposon (Tn6188) was shown to confer tolerance against quaternary ammonium compounds (Muller et al., 2013). Other plasmid‐based genetic elements such as the bcrABC cassette were shown to be associated with increased persistence (Elhanafi et al., 2010). Of interest for persistence is the hypervariable genetic hotspot lmo0443–lmo0449 that appears to play a role in stress response (Ryan et al., 2010). So far, three distinct insert sequence types are known for the genetic locus mentioned above: stress survival islet 1 (SSI‐1), lin0464–lin0465 and LMOf2365_0481 (Ryan et al., 2010). SSI‐1 consists of five distinct genes, namely lmo0444, lmo0445, pva (lmo0446), gadD1 (lmo0447) and gadT1 (lmo0448) (Ryan et al., 2010). The function of the individual genes of the islet was previously understood as follows: pva has significance for the tolerance of L. monocytogenes to bile (Begley et al., 2005); genes gadD1 and gadT1 are involved in the GAD system thus affecting the survival of L. monocytogenes in mildly acidic environments (Cotter et al., 2005). In fact, it was demonstrated that SSI‐1 positively affects bacterial growth under salt and acid stress. The regulatory mechanisms of SSI‐1 are not conclusively understood. However, the alternative stress sigma factor SigB assumes a regulatory impact while the central virulence regulator PrfA exerts no influence on the insertion SSI‐1. Furthermore, lmo0445 appears to exert a regulatory function on the other four genes of the islet (Ryan et al., 2010).
The insert sequence type lin0464‐lin0465 is a fragment of 2.2 kb which contains two genes: lin0464 and lin0465 are homologues of L. innocua genes lin0464 and lin0465 (Hein et al., 2011). This insert is extremely prevalent in L. monocytogenes MLST 121, a hypovirulent subtype that is often isolated from FPEs (Rychli et al., 2014). The smallest of the three insert types is LMOf2365_0481 because it has a size of 713 bp (base pairs). Of all three inserts, the least is known about LMOf2365_0481 and its function remains to be elucidated. An interesting question concerns the distribution of marker genes for persistence in the Listeria population. Attempts have been undertaken to establish an SNP‐based system to distinguish between persistent and non‐persistent strains (Stasiewicz et al., 2015). Møller et al. (2017) tried to study the marker gene diversity in 1,143 L. monocytogenes strains of clinical and food‐borne origin by an NGS approach. In their report, they summarised that abundance of putative markers of resistance to detergents, disinfectants and antiseptics, e.g. via efflux mechanisms, was close to 20%. However, the authors emphasised that the presence or absence of genes promoting a persistent phenotype was not found to be pertinent in their strain set. Their study did not focus on the accessory genome, which by definition comprises genes mostly located on mobile elements, which may not be present ubiquitously across the L. monocytogenes population. The analysis of the accessory genome is important as it has been recently shown that conservation of the accessory genome might be associated with persistence (Fagerlund et al., 2016). Genes on plasmids or other mobile elements such as transposons will make a significant contribution to the variation in biology seen between isolates and therefore should be a rich source for the discovery of polymorphisms associated with persistence and other features. It should be noted that sequence analysis is not enough to fully understand the regulatory background of the persistence phenomenon in L. monocytogenes. Expression of gene markers for persistence (Mazza et al., 2015) or proteome analysis (Rychli et al., 2016) have recently appeared promising for predicting persistence phenotypes.
3.3.2. Prevalence and concentration of L. monocytogenes in RTE foods
EFSA monitoring data
Compliance of different RTE food subcategories with the L. monocytogenes FSC in 2008–2015 is presented in Figure 11. The figure includes monitoring data according to sampling stage, for the relevant food types at retail (also catering, hospitals and care homes) and at processing (also cutting plants). Data collected at ‘unspecified’ sampling stages are included in the data reported at retail. The apparently higher proportion of non‐compliance at processing is at least partly explained by the application of the different limit of FSCs for retail and processing (see footnote to Figure 11).
Figure 11.
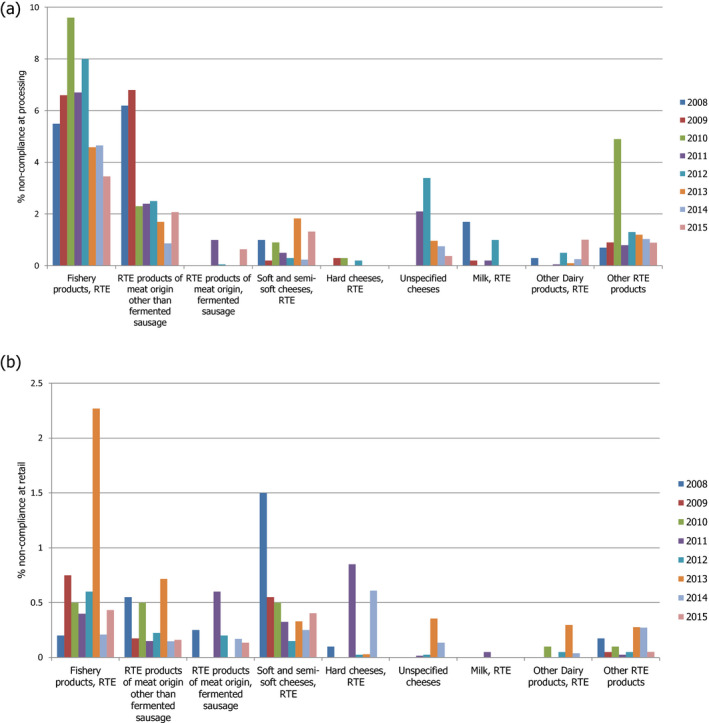
- RTE: ready‐to‐eat. This graph includes data where sampling stage at retail (also catering, hospitals and care homes) and at processing (also cutting plants) have been specified for the relevant food types. Data collected at the ‘unspecified’ sampling stage are included in the data reported at retail. The category ‘other RTE products’ includes RTE food other than: ‘RTE fishery products,’ ‘soft and semi‐soft cheese,’ ‘hard cheese,’ ‘unspecified cheese,’ ‘other RTE dairy products,’ ‘milk,’ ‘RTE products of meat origin other than fermented sausage,’ ‘RTE products of meat origin, fermented sausage.’ For the non‐compliance analysis of samples collected at the processing stage, the food safety criterion of ‘absence in 25 g’ was applied, except for samples of hard cheese and fermented sausage that were assumed to be unable to support the growth of L. monocytogenes and for which the criterion of ‘≤ 100 CFU/g’ was applied. For the non‐compliance analysis of samples collected at the retail level, the FSC of ‘≤ 100 CFU/g’ was applied. Only information on the main RTE food categories (RTE fishery products, RTE cheese and RTE meat products) is included in this graph. The number of samples at processing ranged from year to year from 456 to 13,578 for ‘RTE fishery products’, from 1,132 to 40,853 for ‘RTE products of meat origin other than fermented sausage’, from 14 to 1,283 for ‘RTE products of meat origin, fermented sausage’, from 585 to 8,381 for ‘soft and semi‐soft cheese’, from 220 to 5,897 for ‘hard cheese’, from 1,365 to 4,264 for ‘unspecified cheese’, from 111 to 1,890 for ‘milk, RTE’, from 312 to 5,418 for ‘other RTE dairy products’, and from 57 to 2,397 for ‘other RTE products’. The number of samples at retail ranged from year to year from 1,356 to 7,174 for ‘RTE fishery products’, from 3,264 to 16,653 for ‘RTE products of meat origin other than fermented sausage’, from 85 to 2,772 for ‘RTE products of meat origin, fermented sausage’, from 699 to 4,381 for ‘soft and semi‐soft cheese’, from 245 to 2,058 for ‘hard cheese’, from 283 to 4,598 for ‘unspecified cheese’, from 48 to 2,766 for ‘milk, RTE’, from 605 to 5,110 for ‘other RTE dairy products’, and from 9,786 to 16,208 for ‘other RTE products’.
Considering the sampling stage of processing; apart from 2008 and 2009, ‘RTE fishery products’ was the food category with the highest level of non‐compliance. It ranged from 3.5% to 9.6% of single samples. For ‘RTE products of meat origin other than fermented sausage’ and ‘RTE products of meat origin, fermented sausage’ the level of non‐compliance ranged between 0.9% and 6.8%, and 0% and 0.6%, respectively. In the case of cheese, ‘soft and semi‐soft cheese’ (0.2–1.8%) overall showed a higher level of non‐compliance than ‘hard cheese’ (0–0.3%). For ‘unspecified cheese,’ ‘milk, RTE’ and ‘other RTE dairy products’ respectively 0.4–3.4%, 0–1.7%, and 0–1% single samples were non‐compliant.
Considering the retail sampling stage, ‘RTE fishery products’ had the highest level of non‐compliance in 2013 (2.3% of single samples), while for other years it was below 0.8%. For ‘RTE products of meat origin other than fermented sausage’ and ‘RTE products of meat origin, fermented sausage’ the highest levels of non‐compliance were 0.7% (in 2013) and 0.6% (in 2011). In the case of ‘soft and semi‐soft cheese’, the level of non‐compliance was below 0.6%, except in 2008 (1.5%). For ‘hard cheese’ the level of non‐compliance was below 0.3%, except in 2011 (0.9%) and 2014 (0.6%). For ‘unspecified cheese,’ data have only been reported since 2011 with the highest level of non‐compliance in 2013 (0.4%). For ‘milk, RTE’ the level of non‐compliance was below 0.1% for all years. This was also the case for ‘other RTE dairy products’, except in 2013 (0.3%). Between 0.05 and 0.3% of single samples in the category ‘other RTE products’ were found to be non‐compliant.
Although non‐compliance at retail of less than 1% may be considered low, this may translate into many servings containing more than 100 CFU/g when total consumption is taken into account.
EU‐wide prevalence of Listeria monocytogenes in RTE foods
The estimates of prevalence across the EU, as derived from the BLS conducted in 2010 and 2011, of L. monocytogenes‐contaminated fish, meat and cheese samples, and of the proportion (%) of samples with L. monocytogenes counts exceeding the level of 100 CFU/g (among the sampled categories of RTE foods, as described above) can be found in Table 13.
Table 13.
Prevalence (%) of Listeria monocytogenes‐contaminated fish, meat and cheese samples, and proportion (%) of samples with Listeria counts exceeding the level of 100 CFU/g at the time of sampling (for fish only) and at the end of shelf life, in the EU, 2010–2011 (from EFSA (2013))
| Product and subtype | Number of samples | At sampling | At end of shelf life | ||
|---|---|---|---|---|---|
| Prevalence with 95% CI (%) | Proportion > 100 CFU/g with 95% CI (%) | Prevalence with 95% CI (%) | Proportion > 100 CFU/g with 95% CI (%) | ||
| Total fish | 2,994 | 10.4 (9.1–11.7) | 1.0 (0.7–1.4) | 10.3 (9.1–11.6) | 1.7 (1.3–2.3) |
| Cold‐smoked fish | 599 | 17.4 (14.2–21.1) | 1.7 (0.9–3.2) | 16.0 (13.2–19.3) | 2.0 (1.1–3.6) |
| Hot‐smoked fish | 525 | 6.3 (4.4–8.9) | 1.3 (0.6–2.8) | 6.7 (4.7–9.3) | 1.7 (0.9–3.3) |
| Unknown smoked fisha | 1,625 | 8.8 (7.3–10.5) | 0.6 (0.3–1.2) | 9.1 (7.6–10.9) | 1.8 (1.2–2.6) |
| Gravad fish | 245 | 12.2 (8.7–17.0) | 0.8 (0.2–3.2) | 12.2 (8.6–17.1) | 0.8 (0.2–3.2) |
| Total meat | 3,470 | ND | ND | 2.07 (1.63–2.64) | 0.43 (0.25–0.74) |
| Total cheese | 3,393 | ND | ND | 0.47 (0.29–0.77) | 0.06 (0.02–0.24) |
CI: confidence interval; ND: not determined.
Portugal did not participate in the baseline survey and one non‐Member State, Norway, participated. Norway is not included in the EU prevalence estimation analysis. Prevalence was based on combined detection and enumeration methods results. A food sample was considered positive if L. monocytogenes was detected by at least one of either the detection or the enumeration method, (i.e. a sample was regarded as positive when either the detection test result was positive and/or the enumeration test result was positive, i.e. having a count of at least 10 CFU/g). The survey specifications defined particular subsets of food products to be sampled, specifically (i) RTE fish which were hot‐smoked or cold‐smoked or gravad, were not frozen, and were vacuum or modified atmosphere packaged; (ii) RTE meat products which had been subjected to heat treatment, and were then vacuum or modified atmosphere packaged; (iii) RTE soft or semi‐soft cheese, excluding fresh cheese. This category includes smear‐ripened, mould‐ripened, brine‐matured or otherwise ripened, cheese made from raw, thermised or pasteurised milk of any animal species. The cheese could be packaged, or unpackaged at retail but packaged at the point of sale for the consumer. Only packaged and intact (sealed) packages, packaged by the manufacturer, were to be collected for sampling. However, in the case of cheese and meat products, products packaged at the retail outlet could also be collected for sampling.
Fish which may have been hot‐ or cold‐smoked.
The EU prevalence estimate in fish samples at the time of sampling was 10.4% and at the end of shelf life was 10.3%. The EU‐level estimate of the proportion of samples with L. monocytogenes counts exceeding the level of 100 CFU/g at sampling was 1.0% while for fish samples at the end of shelf life it was 1.7%. Among meat products, the EU prevalence of L. monocytogenes‐contaminated samples at the end of shelf life was estimated at 2.07% while the EU‐level proportion of samples with L. monocytogenes counts exceeding 100 CFU/g was estimated at 0.43%. The EU estimate of prevalence of L. monocytogenes‐contaminated cheese samples at the end of shelf life was 0.47% while the EU‐level estimate of proportion of samples with L. monocytogenes counts exceeding 100 CFU/g was 0.06%.
Prevalence of Listeria monocytogenes in RTE foods from literature studies
The extensive literature search performed by Jofré et al. (2016) on the occurrence and levels of contamination of L. monocytogenes in a wide range of RTE foods covering the 1990–2015 period yielded 308 records eligible for data extraction. About 90% of the studies were surveys of naturally contaminated RTE foods with quantification of prevalence and/or levels of L. monocytogenes as (one of) the purpose/s of the study. Altogether, the category ‘dairy products’ was included in most records (N = 139), followed by ‘meat products’ (N = 110), ‘seafood’ (N = 79), ‘composite food’ (N = 62, including meals such as pasta‐ and rice‐based salads, pre‐cooked chilled foods, sandwiches, sushi, pastry and desserts), ‘produce’ (N = 58) and ‘other types of products’ (N = 16, including egg products and other un‐specific/non‐described ‘RTE products’ in general). Some studies deal with more than one food category; therefore, the sum of records is higher than the 308 reviewed studies.
Prevalence data were available for 778 outcomes, i.e. individual‐item survey results. The RTE food category with most prevalence data were dairy products (N = 276), followed by meat products (N = 173), seafood (N = 151), other products (e.g. composite products of raw materials from different categories; N = 104) and fresh produce (N = 74). In total, L. monocytogenes was detected in 78.1%, 70.5%, 51.8%, 36.5%, and 47.1% of the studies dealing with seafood, meat products, dairy products, produce and other products, respectively. Figure 12 shows the box‐plot representation of the L. monocytogenes prevalence of each RTE food subcategory.
Figure 12.
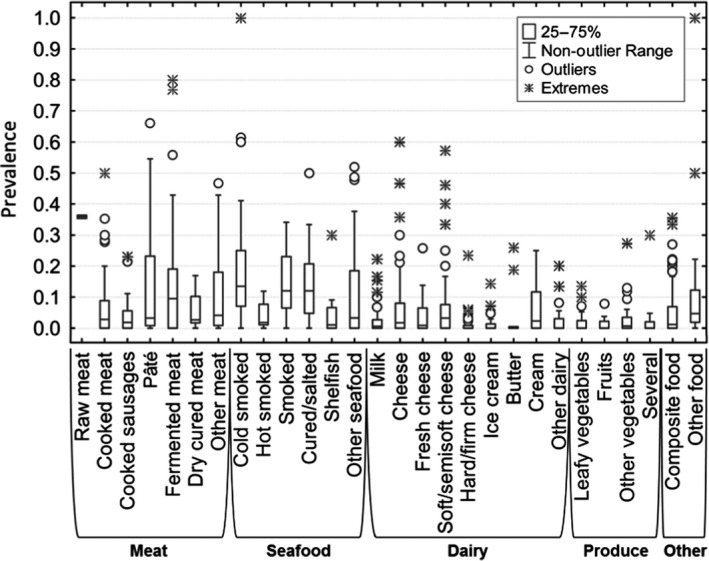
- Median value is indicated by the line within the interquartile box. Outliers (O) and extreme (⋄) values correspond to values at 1.5‐ and 3‐fold the interquartile range, respectively, from the 75th percentile.
In all subcategories, the distribution of the prevalence values was asymmetric, with several outliers as well as extreme values. For the whole period, the median of the prevalence was below 10% for almost all subcategories, except for fermented sausage (10%), cold‐smoked fish (13%), smoked fish (either cold‐ or hot‐smoked; 12%) and cured/salted fish (12%). The above results need to be considered with caution due to the variations in the number of samples and differences in the sampling designs between studies.
Semi‐quantitative data about L. monocytogenes levels (e.g. grouped in concentration ranges or above/below 100 CFU/g or ml) was provided in 244 studies. The highest number of semi‐quantitative data points has been recorded for meat products (N = 62). Quantitative data were obtained for only 14 RTE product types. More information can be found in Jofré et al. (2016).
RASFF data
Based on the criteria described in Section 2.1.2, the total number of RASFF notifications analysed for the concentration of the pathogen were 130 for the RASFF product category ‘fish and fish products,’ 126 for the RASFF product category ‘milk and milk products’ and 81 for the RASFF product category ‘meat and meat products other than poultry.’ In order to include notifications reporting concentrations less than the detection limit (i.e. < 10 CFU/g) in the analysis, data were formed as CDF and the statistical analysis was performed using the Monte Carlo simulation (10,000 iterations).
Figure 13 presents the CDF of the L. monocytogenes concentration for RASFF food product category ‘fish and fish products,’ ‘milk and milk products’ and ‘meat and meat products other than poultry’ reported in all RASFF notifications during the years 2008–2016. For example, the concentration is over 2 log10 CFU/g in approximately 80%, 65% and 65% of ‘fish and fish products,’ ‘meat and meat products,’ and ‘milk and milk products,’ reported in RASFF notifications, respectively. The average concentrations were 2.61, 2.46 and 2.34 log10 CFU/g for ‘milk and milk products,’ ‘fish and fish products’ and ‘meat and meat products other than poultry’, respectively. The highest maximum concentrations were 6.25, 5.32 and 4.75 log10 CFU/g, respectively.
Figure 13.
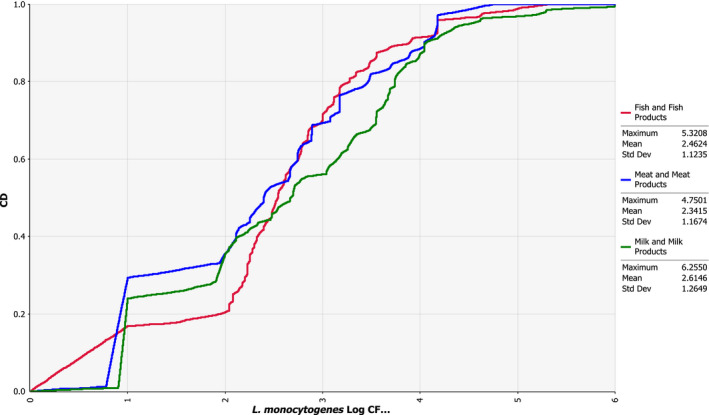
- The empirical cumulative distribution function is a step function that jumps up by 1/n at each of the n data points. Its value at any specified value of the measured variable is the fraction of observations of the measured variable that are less than or equal to the specified value. Example: the red curve shows that concentration has a probability of 20% to be less or equal to 2 log10 CFU/g.
3.3.3. Consumption and food handling
Consumption and food handling can impact on human listeriosis risk since exposure may increase with increased consumption of RTE foods with a high likelihood of being contaminated, and with improper food handling that may increase the spread and growth of L. monocytogenes. Thus, changes in consumption patterns or differences in food handling among population groups have been proposed as potential drivers for changes in the incidence rates of listeriosis (Yang et al., 2006; ACMSF, 2009a).
Consumption
In Germany, a national case–control study of sporadic non‐pregnancy‐associated listeriosis cases between 2012 and 2013 identified consumption of cold cooked sausages, and the consumption of packaged cheese and pre‐sliced cheese as food‐related risk factors (Preussel et al., 2015). A retrospective case–control study of listeriosis patients in England aged over 60 identified that cases were more likely than controls to report the consumption of cooked meats (beef and ham/pork, but not poultry), cooked fish (specifically smoked salmon) and shellfish (prawns), dairy products (most noticeably milk but also certain cheeses), and mixed salads. They were less likely than controls to report the consumption of other forms of seafood, dairy spread, other forms of dairy products, sandwiches and fresh vegetables (Gillespie et al., 2010). Based on the general UK population over 65 years old, another study concluded that it was not possible to determine any particular factor in the shopping and consumption patterns for people over 65 years old that was likely to increase their risk of listeriosis. However, compared with all consumers there was a tendency to eat more homemade, chilled and fresh (not frozen) foods and to consume more food cold than hot (ACMSF, 2009a). According to a UK discussion paper on risk factors among older consumers (ACMSF, 2009b), there is a need to better understand how the dietary practices of people aged 60 years and over are affected by ageing and how this may be linked to a potentially increased exposure to L. monocytogenes.
Serving size
Statistical parameters and probability distribution parameters for serving size of the target food subcategories and three population groups in the EU were developed by Pérez‐Rodríguez et al. (2017). The data for pregnant women were based only on a single available study and these limited data were not used in that risk assessment. Instead, serving sizes for pregnant women were assumed to be similar to the general adult population. More information on serving sizes and the total number of servings in the 28 Member States across the EU can be found in Pérez‐Rodríguez et al. (2017).
For the purpose of the present Scientific Opinion, serving sizes for different age and gender groups were also estimated based on national surveys carried out between 1997 and 2012 and available in the EFSA consumption database. In Table 14, the mean of the mean serving sizes reported in these surveys are shown, illustrating the differences in serving sizes between different age groups for six subcategories of RTE foods.
Table 14.
Mean of the mean serving sizes (g) in the most recent national surveys from the EFSA food consumption database
| Age group (years) | Fish products | Meat products | Cheese | |||||||||
|---|---|---|---|---|---|---|---|---|---|---|---|---|
| Gravad fisha | Smoked fish | Cooked meat | Heat‐treated sausages | Pâté | Soft and semi‐soft cheese | |||||||
| F | M | F | M | F | M | F | M | F | M | F | M | |
| 1–4 | 25 | –b | 26 | 21 | 22 | 23 | 38 | 44 | 19 | 22 | 21 | 20 |
| 5–14 | 47 | 68 | 54 | 56 | 31 | 32 | 54 | 63 | 28 | 29 | 27 | 43 |
| 15–24 | 132 | 101 | 56 | 57 | 39 | 51 | 68 | 90 | 36 | 49 | 40 | 43 |
| 25–44 | 95 | 151 | 64 | 78 | 42 | 53 | 61 | 79 | 41 | 53 | 48 | 45 |
| 45–64 | 96 | 134 | 61 | 87 | 42 | 53 | 63 | 78 | 41 | 49 | 46 | 44 |
| 65–74 | 144 | 129 | 60 | 58 | 40 | 42 | 55 | 70 | 31 | 44 | 32 | 40 |
| ≥ 75 | 154 | 132 | 49 | 66 | 30 | 42 | 63 | 61 | 33 | 38 | 36 | 41 |
F: female; M: male.
In the gQMRA model it was assumed that the serving size of gravad fish is the same as that of smoked fish.
There were no servings in this group.
The means of the median, 25th percentile and 75th percentile are shown in Appendix G. The largest mean of the mean serving sizes were found for gravad fish followed by smoked fish and heat‐treated sausages. It should be noted that differences are sometimes small and that the data for gravad fish are based on surveys from only one Member State.
The numbers of yearly servings per age and gender are presented in Appendix G and the total number of servings in Table 15. Cooked meat and heat‐treated sausages were the subcategories with the most consumed servings per person and year and for meat products the number of servings was in general greater for males than for females (Table 15 and Appendix G). For the other food subcategories, gender differences in consumption frequency varied by age (Appendix G). The pattern with the highest number of servings associated with cooked meat and heat‐treated sausages are reflected in the total number of servings in the EU/EEA (Table 15). Since these figures reflect the size of the populations, in general fewer total numbers of servings of RTE foods are consumed by age groups over 65 years than by those between 25 and 65 years old. In the BLS, 0.43% of RTE meat and meat products contained concentrations of L. monocytogenes above 100 CFU/g (Table 13). Under the assumption that this result reflects the corresponding RTE food category considered when estimating the frequency of consumption, this would translate to approximately 55 million such contaminated servings being consumed by the over 75 age group per year in the EU/EEA.
Table 15.
Mean number of servings (in millions) per year in the EU/EEA based on the mean number of servings per day estimated from the most recent national surveys (1997–2012) in the EFSA food consumption database and population data from 2015
| Age group (years) | Gravad fisha | Smoked fish | Cooked meat | Heat‐treated sausages | Pâté | Soft and semi‐soft cheese | ||||||
|---|---|---|---|---|---|---|---|---|---|---|---|---|
| F | M | F | M | F | M | F | M | F | M | F | M | |
| 1–4 | 7 | 0 | 271 | 306 | 749 | 864 | 1,000 | 982 | 591 | 650 | 232 | 202 |
| 5–14 | 13 | 5 | 222 | 225 | 2,488 | 2,778 | 2,444 | 2,838 | 958 | 1,211 | 475 | 475 |
| 15–24 | 43 | 73 | 398 | 263 | 2,788 | 4,055 | 1,642 | 2,713 | 671 | 1,057 | 679 | 593 |
| 25–44 | 253 | 164 | 831 | 933 | 8,449 | 11,252 | 4,696 | 7,659 | 1,644 | 2,892 | 2,296 | 2,033 |
| 45–64 | 337 | 314 | 1,389 | 1,567 | 9,213 | 11,563 | 5,287 | 8,027 | 1,589 | 2,735 | 2,455 | 2,558 |
| 65–74 | 287 | 189 | 1,006 | 994 | 3,869 | 4,001 | 2,049 | 2,402 | 782 | 1,076 | 1,049 | 1,054 |
| ≥ 75 | 88 | 39 | 1,586 | 1,574 | 3,565 | 2,780 | 2,021 | 1,990 | 1,231 | 1,177 | 1,334 | 1,183 |
| Mean(all ages) | 1,028 | 784 | 5,703 | 5,862 | 31,121 | 37,293 | 19,139 | 26,611 | 7,466 | 10,798 | 8,520 | 8,098 |
F: female; M: male.
In the gQMRA model it was assumed that the number of servings of gravad fish is 22.3% of those of smoked fish.
Consumer food handling
Consumer food handling practices expected to have the largest impact on exposure and risk are those that can lead to contamination of RTE foods, e.g. cross‐contamination to unpackaged foods in the refrigerator, or to actions that may allow increased growth, i.e. improper storage temperatures and times. In one risk assessment of L. monocytogenes in deli meats, up to a million‐fold increase in risk due to consumer handling was estimated, and storage practices appeared to be more important in terms of risk than cross‐contamination (Yang et al., 2006).
According to a review of consumer food safety studies from 1993–2014, in the majority of studies (83%) survey methods were used, some (29%) also used observational methods, mostly by determination of the operational temperature in refrigerators and a few (12%) used focus groups (Evans and Redmond, 2014). Thus, the majority of information on consumer behaviour is based on self‐reporting via questionnaires or interviews where it may be difficult to know how responses relate to actual behaviour, since it is not uncommon that there is a difference between what is known about handling and what is done in practice (Redmond and Griffith, 2003). Direct observation methods allow assessment of actual behaviour but may be subject to bias since consumers may change their behaviour in response to the ‘experimental’ situation. The review of Evans and Redmond Evans and Redmond (2014) covered studies related to behavioural risk factors for listeriosis in the home and supports the conclusion that consumer handling related to storage and other self‐reported practices are risk factors (Evans and Redmond, 2014). This could be due to lack of consumer knowledge, consumer attitudes or understanding. Differences were observed between different groups, for instance categorised by gender (e.g. Alibabic et al. (2012) and Brennan et al. (2007)) or education/training (e.g. Brennan et al. (2007)). In relation to risk factors, the review indicated that consumer understanding of use‐by dates is often lacking and in practice adherence to these may be very variable. In relation to storage of food products in refrigerators, there were generally positive attitudes for the need for correct temperatures, but a large proportion of consumers did not know the recommended temperatures.
The reported differences between groups in the population are commonly presented and interpreted by separating consumers into various groups characterised by narrative labels (Kennedy et al., 2005b; Kendall et al., 2013), where factors such as age, socioeconomic status (married, divorced, unemployed), general education, home economics training (Brennan et al., 2007), cognition (Evans and Redmond, 2016a), psychology (Fischer and Frewer, 2008) have been related to behaviour. Significant life‐stage events may have an impact on food handling behaviour, e.g. the death of spouse/partner, divorce or separation. Brennan et al. (2007) categorised males over 65 years of age who were widowed, divorced or separated as one of four high‐risk groups in terms of microbiological food safety in Ireland. The other three risk groups were single 18–34‐year‐old non‐student males, without home economics training in school; 18–24‐year‐old female homemakers, without home economics training; and, perhaps unexpected, > 45‐year‐old female homemakers with home economics training. Possible explanations put forward for the last group was that best practice had changed since this group received training or over‐confidence in their own judgement. Several studies have identified young and elderly males as risk groups in terms of knowledge, attitudes and behaviour (e.g. McCarthy et al. (2007) and Rossvoll et al. (2013)).
Several studies have highlighted the diversity of elderly and other risk groups and that differences in food handling practices may be great within different narratively characterised consumer groups (e.g. divorced, unemployed) and also between studies from different countries. Indeed, the group over 60 years old may include those who are a generation apart, with or without underlying health conditions, in addition to other sociodemographic differences (ACMSF, 2009b). This sociodemographic diversity among cases is well captured and very illustrative in the description of five anonymous listeriosis cases in the UK (ACMSF, 2009b). The existence of national differences was illustrated in a study reporting that Belgian consumers less frequently stored their fresh produce in a refrigerator and did so for a shorter time than Spanish consumers (Jacxsens et al., 2015). There is also a lack of food handling studies for risk groups other than the elderly, e.g. pregnant women (Pereboom et al., 2014) and other specific vulnerable groups.
Since the increase in the number of listeriosis cases has been associated with the older population and this group often also includes other vulnerable groups, the food handling practices of this group are of particular interest. In addition to socioeconomic factors, a number of ageing‐related effects may impact on how the elderly handle food. For instance, ‘deterioration of oral health, eyesight, hearing, reduction in mental stimulation and social interaction opportunities; reduction in physical mobility (both personal and transport); chronic physical deterioration/pain (including arthritis and osteoporosis); early stage dementia/memory‐related problems’ (ACMSF, 2009b). Based on limited data, factors that were identified in the UK population over 65 years old that may contribute to increased L. monocytogenes exposures were keeping food beyond the use‐by dates or not keeping them refrigerated at suitable temperatures (ACMSF, 2009a). A more recent study supports that conclusion and reported that knowledge among older consumers about appropriate refrigerator temperatures was poor and ownership of thermometers was low (Evans and Redmond, 2016a). Although the majority of older adults may store leftover chilled food in the refrigerator, one study reported that 78% of older adults kept sliced cooked meat uncovered in the refrigerator (Terpstra et al., 2005), and in another study, 38% reported they would store leftover food out on the counter (Almanza et al., 2007). A combined use of observation, self‐reporting and microbiological analysis was employed to identify risk factors among the group of consumers over 60 years old in the UK (Evans and Redmond, 2016a). Forty‐one per cent of foods in home refrigerators were beyond the use‐by date, and of these 11% were RTE foods commonly associated with listeriosis. Of opened RTE foods, 66% had been, or were reportedly intended to be, stored beyond the recommended two days after opening. Refrigeration temperatures were above the 5°C recommended storage temperature in the UK in 50% or more of storage areas, and older refrigerators operated at significantly higher temperatures. In addition, L. monocytogenes was isolated in 2% of the kitchens. In contrast, concern about and understanding of the concept of use‐by dates was reported among older adults but studies proving adherence or observational data to support this is generally lacking (Evans and Redmond, 2014). A US study among senior‐aged women and women of child‐bearing age reported that opened packages were often being stored for longer than recommended and that interpretation of the labels was highly variable but both age groups considered use‐by more helpful than other types of labelling (Lenhart et al., 2008). One study in the UK indicated that the failure to follow use‐by dates was due to the difficulty of reading the labels (Johnson et al., 1998). It should be highlighted that comparatively few studies of ‘the over 60s’ exist and from few countries. Evans and Redmond (2014) reported that only 7% of the consumer food safety studies reviewed included data for older adults, i.e. over 60 years old.
Another overview of food safety studies with focus on reported differences between older (> 60 years) and younger consumers carried out as a follow‐up of the UK ad hoc report concluded that it is not known whether knowledge levels differ with generations or have changed as people age, and, if knowledge levels have changed, why that change may have occurred (ACMSF, 2009b).
In conclusion, knowledge gaps make it difficult to conclude in a quantitative manner on the range of food handling behaviours in different risk and age groups and on how this may contribute to trends of listeriosis. However, based on the available studies, unsafe practices are not uncommon, > 10%, among the elderly and can have a potential impact on the occurrence of listeriosis cases. There is a wide variation within broadly defined consumer groups and it is thus problematic to generalise about food handling behaviours of these groups. The majority of studies about food handling are from a few countries which contribute some uncertainty concerning the generalisability of the results presented. The extent of different behaviours among risk groups may vary to the same extent that socioeconomic factors, traditions and types of food vary between Member States. There is a need for better information on human listeriosis cases in terms of socioeconomic–demographic data.
Storage temperature of RTE foods in retail and domestic refrigerators
The logistic chain of RTE foods includes storage at the production point or distribution centres, transportation, retail and domestic storage. The temperature during the first steps of the chain are in most cases satisfactorily controlled (Afchain et al., 2005). In contrast, conditions at the retail level are out of manufacturers’ direct control and often deviate from legislated temperature limits while temperature control is completely in the hands of the consumer at domestic level. In general, the temperature during storage at retail is lower than during domestic storage (EFSA BIOHAZ Panel, 2008). Available survey studies on retail storage temperatures in France, Slovenia, Greece and Finland reported a mean temperature ranging from 2.7 to 5.6°C (Pierre, 1996; Afchain et al., 2005; Derens et al., 2006; Likar and Jevsnik, 2006; Koutsoumanis et al., 2010; Lunden et al., 2014). Storage temperature, however, may vary between retail cabinet types as well as between positions in the cabinet. Maximum temperatures in cabinets were generally in the most exposed (to ambient) areas and minimum temperatures are located in the least exposed areas (Evans et al., 2007). In addition, Koutsoumanis et al. (2010) reported a variation of temperature with time in retail cabinets in which periodic up‐shifts of temperature may occur due to the defrost system of the refrigerators. This may affect microbial growth depending on the food, the direction and duration of the temperature shifts and the L. monocytogenes strain.
RTE foods with extended shelf life may be stored in a domestic refrigerator for long time. In addition, consumers do not always respect the instructions on time and temperature of storage indicated on the label (Marklinder and Eriksson, 2015). Domestic refrigerator temperatures can therefore have a significant effect on the risk of listeriosis. Table 16 presents data from 23 survey studies on domestic refrigerator temperatures from eight European countries. The data are presented in such a manner as to facilitate comparison between surveys, although this is not always possible due to the use of different parameters and temperature ranges in the reporting of the data. Of the 16 surveys for which a mean temperature was given, this ranged from 5 to 8.1°C. Recently, Roccato et al. (2017) analysed data on domestic refrigerator temperatures of chilled food in European countries in order to draw up general rules which could be used either in risk assessment or shelf life studies. In relation to domestic refrigerator temperatures, 15 studies provided pertinent data. Twelve studies presented normal distributions, according to the authors or from the data fitted into distributions. Analysis of temperature distributions suggested that the countries were separated into two groups: northern European countries and southern European countries. The overall variability of European domestic refrigerators in the latter study was described by a normal distribution: N (7.0, 2.7)°C for southern countries, and N (6.1, 2.8)°C for the northern countries.
Table 16.
Temperature survey data on domestic refrigerators in the EU
| Year reported | Country | N | Minimum temperature | Mean temperature | Maximum temperature | % refrigerators running at temperature °Ca | Reference | ||||||
|---|---|---|---|---|---|---|---|---|---|---|---|---|---|
| > 4 | > 5 | > 6 | > 7 | > 8 | > 9 | > 10 | |||||||
| 1990 | UK | 75 | <5 | 15 | 6 | Rose et al. (1990) | |||||||
| 1991 | UK | 252 | 0.9 | 6 | 11.4 | 70 | Evans et al. (1991)) | ||||||
| 1992 | UK | 150 | 0.8 | 6.5 | 12.6 | 71 | Flynn et al. (1992) | ||||||
| 1993 | France | 102 | 14 | 70 | Victoria (1993) | ||||||||
| 1994 | Netherlands | 125 | 70 | 28 | 2 | de Lezenne Coulander (1994) | |||||||
| 1997 | Greece | 136 | 50 | Sergelidis et al. (1997) | |||||||||
| 1997 | UK | 108 | 2 | 5.9 | 12 | 50 | Worsfold and Griffith (1997) | ||||||
| 1998 | UK | 645 | −2 | 7 | 13 | 70 | Johnson et al. (1998) | ||||||
| 2002 | France | 119 | 0.9 | 6.6 | 11.4 | 80 | Laguerre et al. (2002) | ||||||
| 2003 | UK | 901 | 31 | 3 | Ghebrehewet and Stevenson (2003) | ||||||||
| 2003 | Greece | 110 | 74 | 46 | 23 | 8 | Bakalis et al., (2003) | ||||||
| 2005 | Ireland | 100 | −7.9 | 5.4 | 20.7 | 59 | Kennedy et al. (2005a) | ||||||
| 2005 | Portugal | 86 | 70 | Azevedo et al. (2005) | |||||||||
| 2005 | Greece | 258 | −2 | 6.3 | 50 | 10 | Taoukis et al. (2005) | ||||||
| 2005 | Netherlands | 31 | 3.8 | 11.5 | 68 | Terpstra et al. (2005) | |||||||
| 2006 | UK | 24 | 5 | 33 | Breen et al. (2006) | ||||||||
| 2007 | Spain | 30 | 6.98b | 83.7 | 74.0 | 61.9 | 48.5 | 35.3 | 23.6 | 14.5 | (Carrasco et al. (2007) | ||
| 2010 | Greece | 100 | −0.3 | 6.3c | 13.0 | 84 | 72 | 56 | 36 | 24 | 13 | 7 | Koutsoumanis et al. (2010) |
| 2010 | Spain | 33 | 0.6 | 7.9 | 14.5 | 84.9 | 78.8 | 51.5 | 15.1 | Garrido et al. (2010a) | |||
| 2010 | UK | 50 | 5.9 | 71 | 30 | 29 | WRAP (2010) | ||||||
| 2014 | Italy | 84 | 2.5 | 8.1 | 15.9 | 94 | 73.8 | 51.2 | Vegara et al. (2014) | ||||
| 2014 | France | 1.1 | 6.3 | 10.7 | 47 | Derens‐Bertheau et al. (2015) | |||||||
| 2015 | Sweden | 5.9d | 16 | Marklinder and Eriksson (2015) | |||||||||
| 2016 | UK | 43 | −1.7 | 5.9e | 16.9 | 79.1 | 62.8 | 39.5 | 14.0 | 4.7 | 4.7 | 0.0 | Evans and Redmond (2016b) |
N: number of refrigerators sampled.
Cumulative frequency of temperature data based on data reported by the authors.
Estimated from fitted distribution of daytime data.
Based on data from middle shelves.
Based on data from middle shelves front.
Central refrigerator temperature.
As in the case of retail cabinets temperature in domestic refrigerators varies among different positions. Figure 14 presents the temperature distribution (per cent) at the back and front of three different shelves (top, middle and bottom) in 1,812 refrigerators examined by Marklinder and Eriksson (2015).
Figure 14.
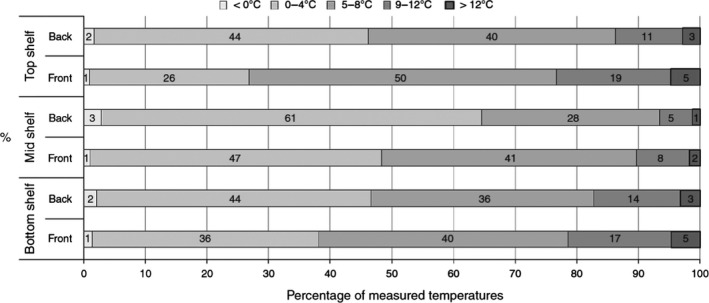
Temperature distribution (per cent) at the back and front of three different shelves (top, middle and bottom) in 1,812 refrigerators (adopted from Marklinder and Eriksson (2015) © Emerald Group Publishing Limited all rights reserved)
In general, the middle shelf has been reported as the coldest spot of domestic refrigerators (Koutsoumanis et al., 2010; WRAP, 2010; Marklinder and Eriksson, 2015) and the door shelf as the hottest spot (Bakalis et al., 2003; Koutsoumanis et al., 2010).
Available data indicate that the domestic fridge mean temperature is also affected by fridge type and age. The waste and reduction action programme (WRAP, 2010) reported that fridge compartments at the bottom of the fridge–freezer combination showed slightly higher mean fridge air temperatures than both standalone (larder) fridges and fridge freezers with the fridge compartment on top. The results from the above programme also suggest a general trend that older fridges have higher mean air temperature than newer models. Fridges between one and two years old showed mean fridge temperatures of 3.7°C compared with mean fridge temperatures of 6.4°C within fridges over 5 years old.
3.3.4. Factors impacting the prevalence and concentration of L. monocytogenes in RTE food
Factors described in the EU‐wide baseline survey
In the Scientific Report of EFSA (2014a), the generalised estimating equations methodology was used to investigate the statistical association between several factors on which information was gathered during the BLS, and the two outcomes: prevalence of L. monocytogenes and proportion of samples with counts exceeding 100 CFU/g, in the surveyed fish and meat products. Problems due to sparseness of the data were evident during the model‐building process and resulted in instability of the effect estimates of some factors during the sensitivity analysis. While some of the associations between the modelled outcomes and the examined factors were stable during sensitivity analysis, others were unstable with ORs and/or p values of the same factor fluctuating importantly between different analyses. One should be very careful with formulating strong statements about those factors that were unstable across different models during the sensitivity analysis. Therefore, the discussion of the respective results in the above‐mentioned report, as well as in this section, focuses mainly on the factors which were significantly associated with the modelled outcomes, and exhibited consistent and stable associations in the presented models and the corresponding sensitivity analyses. Several other factors were included in the final multivariable models presented in EFSA (2014a); however, the results were not always stable as shown in the sensitivity analysis, and therefore, the results concerning these factors are not presented here. In conclusion, the results presented in this section represent only a subsection of the terms included in the original multivariable models as they appear in the EFSA (2014a) report and have also been statistically adjusted for all other terms that were included in those models. The complete models, as well as additional analyses, are presented in EFSA (2014a) and in the External Scientific Report (Rakhmawati et al., 2014).
Based on the multivariable models for fish products, the odds of L. monocytogenes presence were higher for ‘cold‐smoked fish’ than for ‘hot‐smoked fish’ (OR = 0.54 with 95% CI 0.33–0.89 and 0.61 with 95% CI 0.38–0.98 at time of sampling and at end of shelf life, respectively) and ‘unknown smoked fish’ (OR = 0.57 with 95% CI 0.41–0.79 and 0.62 with 95% CI 0.45–0.86 at time of sampling and at end of shelf life, respectively), for ‘sliced’ than for ‘not sliced’ samples (OR = 1.59 with 95% CI 1.02–2.48 and 1.39 with 95% CI 0.91–2.12 at time of sampling and at end of shelf life, respectively) and for samples with ‘two or more antimicrobial preservatives and/or acidity regulators (AP/AR),’ than for samples with ‘no reported AP/AR.’ For this latter factor, the respective odds of L. monocytogenes presence were considerably higher (OR = 7.89 with 95% CI 4.33 ‐ 14.39 and 7.15 with 95% CI 3.61–14.17 at time of sampling and at end of shelf life, respectively) in samples with two or more AP/AR than for samples with ‘no reported AP/AR’. As discussed in EFSA (2014a), initial appraisal of this association might appear as something of a paradox. However, most commercially used preservatives have a mild to moderate antilisterial effect, which is essentially bacteriostatic (growth‐inhibitory), rather than bactericidal. Hence, a higher number of preservatives in products contaminated with low numbers of L. monocytogenes could have only a minor and indirect effect on the probability of pathogen detection during food testing (a positive test). Antimicrobials may also reduce competitive flora possibly improving the growth potential of L. monocytogenes. Furthermore, any related conclusions or even attempts to interpret the association between the ‘number of AP/AR’ and L. monocytogenes prevalence should be made with great caution because the number of reported additives in this BLS does not necessarily constitute a reliable index of the antilisterial ‘load’ or ‘profile’ of the fish products tested. In particular, the concentration of the reported additives was in most cases unknown and, additionally, food ingredients with direct or indirect antibacterial properties, e.g. salt, sugar, smoke or herbs (whose concentration was also, typically, unknown), were not taken into account in this analysis. Finally, some important explanations on how the sampled fish products were classified in the above‐mentioned categories have been previously reported (EFSA, 2013). In conclusion, the reason for this finding is unknown and more studies are needed. Additionally, the models for the proportion of samples with counts exceeding 100 CFU/g, indicated that ‘sliced’ fish samples had higher odds of containing L. monocytogenes in excess of 100 CFU/g than ‘not sliced’ samples (OR = 2.79 with 95% CI 0.90–8.58 and 2.55 with 95% CI 1.07–6.05 at time of sampling and at end of shelf life, respectively).
As regards the factors associated with L. monocytogenes prevalence in the packaged heat‐treated meat products, higher odds of L. monocytogenes presence were found for ‘pâté’ than for ‘cold, cooked meat products’ (OR = 2.91 with 95% CI 1.39–6.10) and for ‘sliced’ samples than for ‘not sliced’ samples (OR = 2.13 with 95% CI 0.94–4.83). The odds of being contaminated with L. monocytogenes for ‘sausage’ samples were not statistically significantly different from the corresponding odds for ‘cold, cooked meat product’ (OR = 0.97 with 95% CI 0.52–1.82, p value = 0.93). For packaged heat‐treated meat products, the proportion of samples with L. monocytogenes counts exceeding 100 CFU/g was associated with the ‘animal species of the origin of the meat product’ (lower odds, OR = 0.35 with 95% CI 0.13–0.97, for products made from meat from ‘all other species’ than for ‘avian species’) and with ‘remaining shelf life’ (the OR of having an L. monocytogenes count above 100 CFU/g was 1.01 with 95% CI 1.005–1.016 for a meat product sample with an additional day of ‘remaining shelf life’ than for a sample with a ‘remaining shelf life’ that was one day shorter).
Finally, the association of L. monocytogenes prevalence and proportion of samples with counts exceeding 100 CFU/g with factors on which information was gathered during the BLS was not assessed for the surveyed cheese samples, owing to the very small number of samples that were found to be contaminated with L. monocytogenes in the BLS. More information can be found in EFSA (2014a).
Factors described in the literature
The extensive literature search carried out by Jofré et al. (2016) on the L. monocytogenes contamination in different RTE foods considered risk factors associated with (a) the processing environment (e.g. presence/absence of HACCP systems, education and training of food handlers, validated cleaning and disinfection programmes, food contact surface testing/results), (b) manufacturing and preparation practices (e.g. type of processing, exposure after a lethal treatment, for instance during slicing and packaging, use of post‐lethal treatment and/or antimicrobial process), (c) product characteristics (e.g. pH, aw, salt, preservatives, packaging type) and (d) storage conditions (e.g. time and temperature). The authors reported that the impact of some of the factors considered in the review was hard to assess, as the studies usually do not provide the outcome (prevalence and/or level values) as a function of the risk factors.
Only three studies were characterised as ‘intervention studies,’ because they were based on naturally contaminated samples for which there was reported prevalence of L. monocytogenes other than zero and because of that, the impact of different interventions on prevalence (also following storage) could be compared with that of a reference treatment. For example, the impact of super‐chilling (−2°C for 14 or 28 days) cold‐smoked salmon before storage was assessed in comparison with a control (i.e. batch without super chilling) (Midelet‐Bourdin et al., 2008). The prevalence of L. monocytogenes in smoked salmon super‐chilled for 14 days was similar to the control (25% and 26%, respectively). Despite the fact that super‐chilling for 28 days resulted in a slightly lower prevalence of the pathogen (23%) than the control, the number of samples with a concentration > 100 CFU/g was slightly higher than for the other treatments. Another study dealt with sources of contamination of L. monocytogenes in cold‐smoked rainbow trout (Autio et al., 1999). An eradication programme consisting of disassembly and thorough cleaning and disinfection of the production machines and production lines caused a drastic reduction of L. monocytogenes prevalence in the environment and in the RTE product, e.g. from 100% (22 positives out of 22 analysed products) down to 0% (not detected in any of the 20 products analysed). More information can be found in Jofré et al. (2016). To conclude, there is a limited number of studies available dealing with interventions on naturally contaminated RTE foods.
3.3.5. Growth, survival and inactivation of L. monocytogenes in food and in the food chain
The previous EFSA Scientific Opinion about the risk of L. monocytogenes related to RTE foods (EFSA BIOHAZ Panel, 2008), reported on the predictive modelling tools and approaches that had become available before 2007, updating the opinion of 1999. The major advancements identified included the increase in availability of growth curves, the publication of new secondary models, the development of fitting tools and the incorporation of models to user‐friendly applications. It reported on growth and probability of growth (growth/no‐growth interface) models, but not on thermal and non‐thermal inactivation. Since 2007 there has been an increasing volume of raw data published for growth and inactivation of L. monocytogenes in RTE foods, generated via challenge testing. This has enabled the improvement of existing models (e.g. by re‐fitting), or the fitting of new models, as well as an increase in our understanding of the impact of factors influencing the behaviour of L. monocytogenes in RTE foods. The developments have also greatly assisted in quantifying the response of L. monocytogenes to spatio‐temporal changes of the food processing and storage parameters (Augustin et al., 2015), including physicochemical characteristics, structure and competing microflora. Since the previous Scientific Opinion several predictive models for L. monocytogenes growth in RTE foods have been validated based on comparisons of observed and predicted growth and growth/no‐growth responses in 1014 experiments in meat, seafood, poultry and dairy products performance (Mejlholm et al., 2010). In the following paragraphs, the Scientific Opinion provides an update on knowledge about growth and inactivation and the current state of the art of predictive modelling of L. monocytogenes in RTE foods since 2007, summarised in the following areas and further detailed in Appendix H. A detailed overview of the comparative impact of different models and modelling considerations on the estimated dose of L. monocytogenes may also be found in Pouillot and Lubran (2011):
Cardinal secondary (describing how parameters of primary models such as maximum specific growth rates or lag times vary with environmental conditions) growth and growth/no‐growth models that predict the growth rate as well as the capacity of L. monocytogenes to initiate growth in response to multiple explanatory variables. The basic idea behind cardinal parameter models (CPMs) is to use model parameters that have a biological and/or graphical interpretation and refer to minimum, optimal and maximum (or reference) values of product characteristics (intrinsic factors) and processing/storage conditions (extrinsic factors) that affect the growth of microorganisms. This has the advantage that appropriate starting values are easy to determine when models are fitted to experimental data by nonlinear regression. In addition, the models may be easily adjusted to account for different pathogen–food combinations by introducing the cardinal values and the maximum specific growth rate at optimum (μopt) or reference conditions (μref) of the organisms in the target (e.g. new) food (Aryani et al., 2015a, 2016). They are also easily modified to account for an increasing number of factors influencing microbial growth, by simply adding multiplicative gamma terms. The growth/no‐growth interface divides the set of intrinsic and extrinsic factors controlling microbial growth into two domains, one where growth is permitted and one where growth is prohibited (Le Marc et al., 2005). It is delimited by the so‐called cardinal values (T, pH, aw, etc.) for growth and outlines the biokinetic range of microbial proliferation. Using the new form of CPMs with interactions (#4b in Table H.1 of Appendix H), both the growth rate and the growth/no‐growth interface of L. monocytogenes can be predicted simultaneously by identifying those combinations of growth factors (e.g. pH, aw and T) that result in a psi value (ψ) equal to 1 or higher. A psi value equal to 1 defines the predicted growth/no‐growth boundary; on the predicted no‐growth side of the growth boundary, ψ‐values are higher than 1 and on the growth side they are lower than 1.
Strain variability and cardinal models with stochastic terms describing the strain variability in growth limits and growth rates. In general, the growth variability among strains of L. monocytogenes appears to increase at growth conditions away from the optimum for this organism, or otherwise close to the growth boundaries (Barbosa et al., 1994; Begot et al., 1997; Lebert et al., 1998; De Jesus and Whiting, 2003; Lianou et al., 2006; Aryani et al., 2015a; den Besten et al., 2017). For instance, differences in the minimum inhibitory concentration (MIC) values of various un‐dissociated organic acids have been reported for different L. monocytogenes strains, (Wemmenhove et al., 2016), with the concentrations of the un‐dissociated forms of these acids depending on the pH. In a detailed study by Aryani et al. (2015a), the impact of strain variability on maximum specific growth rates was quantified for twenty different L. monocytogenes strains as a function of pH, aw [NaCl], un‐dissociated lactic acid (HLac) and temperature (T). This showed that L. monocytogenes had an average pHmin of 4.5 (5–95% prediction interval (PI) 4.4–4.7), [NaCl]max of 2.0 mM (PI 1.8–2.1), [HLac]max of 5.1 (PI 4.2–5.9) and Tmin of −2.2 (PI(−3.3)–(−1.1)). The maximum concentration of un‐dissociated lactic acid found for one strain under one condition was 6.35 mM. The fact that cardinal (or growth‐limiting) values are species‐ or even strain‐dependent, introduces significant variability in the assessment of the impact of marginal growth conditions on microbial growth, a common issue encountered in quantitative microbiological risk assessment (Delignette‐Muller and Rosso, 2000; den Besten et al., 2017). Strain variability in growth limits can be incorporated into growth and growth/no‐growth models by replacing the fixed values (commonly the median of reported cardinal values) for the cardinal parameters of intrinsic (e.g. pH, aw and preservatives) and extrinsic (temperature, gas atmosphere, etc.) factors controlling growth of L. monocytogenes with probability distributions, thereby converting the deterministic models to stochastic ones (Ostergaard et al., 2015). As an alternative, the impact of strain variability on growth of L. monocytogenes may be described by growth predictions accounting for the 5–95% prediction intervals of cardinal parameters estimates, for various strains. These estimates may derive from fitting cardinal secondary models to the μmax of different strains in response to the biokinetic range of intrinsic and extrinsic variables (Aryani et al., 2015a).
Impact of food microflora and food structure on the growth of L. monocytogenes . This is about adding into the models a quantitative description of the additional complexity (and its impact on L. monocytogenes) of solid/semi‐solid foods compared with broths or liquid foods, which have been the most common substrates for generation of modelling data. As stated above, a practical way to do that is to ‘calibrate’ a cardinal model against the target food, via the estimation of a reference (μref) growth rate for L. monocytogenes in the food of concern, which encompasses the food‐specific effect on growth of the organism (Aryani et al., 2016).Microbial interaction has various forms. For instance, growth of pseudomonads (e.g. in milk or meat) causes hydrolysis of proteins, which could provide free amino acids and likely stimulate L. monocytogenes growth (Marshall et al., 1992). Conversely, growth of L. monocytogenes is known to be negatively affected by the competitive growth of lactic acid bacteria, naturally present as indigenous (spoilage) microbiota or added as starter or aroma cultures in dairy products (Ostergaard et al., 2014). The proposed mathematical approaches to model the interaction between lactic acid bacteria and L. monocytogenes are mainly based on the Jameson effect model or the Lotka–Volterra competition model (Cornu et al., 2011), which consider that the growth of the pathogen starts to be affected (retarded or even halted but rarely stimulated) as the population of lactic acid bacteria (or of the competitor in general) approaches a critical level that is close to a stationary phase of growth (Duret et al., 2014). Such an approach has been successfully applied to model L. monocytogenes growth in processed seafood, mayonnaise‐based seafood salads, pork products and cottage cheese, both at constant and fluctuating temperatures, deterministically and stochastically (Gimenez and Dalgaard, 2004; Cornu et al., 2011; Ostergaard et al., 2014; Mejlholm and Dalgaard, 2015). Microbial growth in liquid laboratory media, in which most of the existing models have been developed, can differ significantly from growth on a solid food since in the latter the rates of diffusion of molecules are lower, the nutrients around a microcolony are utilised rapidly and not quickly replaced, while metabolites diffuse away slowly from the colony. If bacteria are suspended in liquids, their growth is planktonic and the motility of microorganisms may enable taxis to certain nutrient‐rich sites of the food (Wilson et al., 2002). In structured aqueous media, due to the addition of thickeners, or structure‐inducing agents, such as gelatin, pectins, starch, gums, etc., microbial cells are immobilised within the gelled regions and constrained to grow as submerged colonies in three dimensions. Their growth rates as colonies tend to be lower than that of planktonically growing cells (Wilson et al., 2002; Theys et al., 2008; Aspridou et al., 2014; Boons et al., 2014; Skandamis and Jeanson, 2015). This can be further enhanced by increasing the fat concentration on the expense of water phase, thereby increasing the size of oil droplets. If bacteria are growing on the surface of foods, such as meat and vegetables, growth is also colonial, initially in two dimensions (mono‐layer), whereas the centre of the colony gradually develops in the third dimension, most likely upward, depending on aeration and nutrient availability (Skandamis and Jeanson, 2015). The residence of microorganisms on the surface of foods as compared to being suspended in liquid media or liquid foods (e.g. milk) is reported to impact their growth potential in a strain‐dependent way and in some cases (e.g. in ham) increase their heat resistance, due to the protective effect of the food matrix on heat transfer (Aryani et al., 2016). The environment in which cells are dividing (e.g. whether it is the same or different from the one where they receive the heat treatment) also plays an important role on subsequent heat resistance (Aryani et al., 2016).
Impact of preculture conditions and shifts in the food (micro‐) environment on the lag time of L. monocytogenes , also addressing the impact of innate single cell heterogeneity of lag times on overall population dynamics. The number of models for the growth rate of L. monocytogenes is markedly higher than that for lag time. Lag time depends on current growth conditions and on cell ‘history,’ which defines the capacity of the organism to adapt and regrow in the new environment. Studies have demonstrated the effect of pre‐incubation conditions (composition of the medium, temperature, pH, aw, etc.) on the lag duration of different pathogens and recent reports quantitatively describe the impact of up‐ and downshifts in salinity and pH on the lag time of L. monocytogenes (Le Marc et al., 2010; Belessi et al., 2011b). It is suggested that there is an adaptation or injury rate induced at conditions inhibiting the growth of L. monocytogenes (Belessi et al., 2011b). Another situation that may strongly impact the physiological state of cells is their life within a biofilm. Detachment of such cells from the biofilm and translocation to a food (e.g. due to contamination) may be sensed as a shift in the environment and thus induce lag time (Poimenidou et al., 2009; Belessi et al., 2011a).Traditional predictive microbiology uses deterministic mathematical models which describe the growth of large microbial populations as a whole without considering the variability in the responses of individual cells. Since contamination with pathogens usually occurs with very low numbers, the development of stochastic approaches that can describe the variability of single cell behaviour is necessary for realistic estimations of safety risks. Koutsoumanis and Lianou (2013) showed that as a result of the heterogeneity in cell division time, growth of single cells or small microbial populations present a high variability, and can be considered as a pool of events, each one of which has its own probability of occurring. In addition, the apparent variability in population growth gradually decreases as the initial population increases (i.e. at time 0). A significant heterogeneity has also been observed in the ability of individual cells to initiate growth (Aguirre and Koutsoumanis, 2016).
Thermal and non‐thermal inactivation models. Fewer inactivation models than growth models have been reported and in Table H.5 (Appendix H), an overview of the available inactivation models for L. monocytogenes is provided. Notably, thermal resistance of L. monocytogenes markedly varies with strain, as evidenced in the range of 55–65°C for 20 strains (Aryani et al., 2015b). Such strain variability may be equivalent to 50–70% of the reported variability in the literature, whereas most of remaining variability may be accounted for by strain variability when strains are subjected to different growth histories (Aryani et al., 2015b). Non‐thermal inactivation is usually the result of the single or combined effect of low pH (< 4.5) or aw (< 0.90) and moisture (< 60%) at refrigeration or ambient temperatures in the presence or not of preservative agents close to their MIC. Although the lethality is attributed to heat‐independent factors, temperature values within the biokinetic range of growth from the minimum (suboptimal: 0–5°C) to the maximum (superoptimal: 45–47°C) value for growth, remain the factor governing the non‐thermal inactivation rate of bacteria (Shadbolt et al., 1999; Ross et al., 2008; McQuestin et al., 2009; Zhang et al., 2010a). The work of Coroller et al. (2012) presents a modelling approach for non‐thermal inactivation based on the gamma hypothesis, capable of quantifying both growth and inactivation depending on the prevailing conditions.
Table H.1.
Secondary cardinal (gamma‐type) models for the growth rate and growth/no‐growth interface of Listeria monocytogenes in response to growth factors (temperature, pH and water activity) and growth inhibitors (organic acids; nitrites; phenolic compounds; carbon dioxide)
| # | Equation | Type of model and information about the model on: (i) range of independent variables, (ii) use of single or multiple strains, (iii) outcome (probability of growth or growth rate) | Other comments | References | |||
|---|---|---|---|---|---|---|---|
| 1 |
|
Relative effect of growth factors (Tn=2, pHn=1, awn=1) on μmax.Xmin, Xopt and Xmax, are the minimal, optimum and maximum cardinal values, respectively | Typical square root model | Zwietering et al. (1992); Gimenez and Dalgaard (2004); Zuliani et al. (2007); Mejlholm et al. (2010); Mejlholm and Dalgaard (2007) | |||
| 2 |
|
Relative effect of T (n = 2), pH (n = 1) and aw (n = 2) on μmax | – | Rosso et al. (1995); Augustin et al. (2015); Augustin and Carlier (2000a) | |||
| 3 |
|
Relative effect of growth inhibitors (NO2, Phe, CO2, organic acids, etc.) on μmax | a:0.3 for potassium sorbate, 0.5 for acetate and diacetate, 1 for lactate and other inhibitors | Zuliani et al. (2007); Mejlholm et al. (2010); Augustin and Carlier (2000a) | |||
| 4 | a. Model without interaction b. Models with interactions | Cardinal growth model (gamma model) with or without interactions (ξ).‐μmax can be replaced by μref corresponding to a reference temperature (Tref) in the equation 1 above‐μmax may be square root‐transformed | ξ: interaction term kjl: l‐th level of the jth corrective factor of the reference μmax (defined as level 0 with k0 = 1) for the impact of biotic (competitive microbiota) or abiotic (matrix structure, agitation, fat, diffusion limitations, etc.) | Le Marc et al. (2002); Gimenez and Dalgaard (2004); Augustin et al. (2005); Zuliani et al. (2007); Mejlholm et al. (2010) Augustin and Carlier (2000b); Mejlholm and Dalgaard (2007) | |||
| 5 |
|
Formulas for calculation of interaction term in the cardinal models with interaction (#4b) | ψ value of 1 corresponds to the growth/no‐growth interface | Le Marc et al. (2002) | |||
| 6 |
|
γ(X): the relative effect of a single growth factor or inhibitor on μmax | Le Marc et al. (2002) | ||||
| 7 |
|
X represents any of the growth factors T, pH, or aw | Augustin et al. (2005) | ||||
| 8 |
|
Mejlholm et al. (2010); Mejlholm and Dalgaard (2007) | |||||
| 9 |
|
Square root model T: 7–30°C3 strains | Minimally processed lettuce under MAP (5% O2: 15% CO2: 80% N2) | Sant'Ana et al. (2012) | |||
| 10 |
|
Square root modelT: 4–25°C 4 strains | Cut cantaloupe Honeydew Watermelon Aerobic storage | Danyluk et al. (2014) | |||
| T: 4–43°C3 strains | Cut cantaloupe | Fang et al. (2013) | |||||
| 11 |
|
Square root modelT: 5–25°C6 strains | Iceberg lettuce | Koseki and Isobe (2005) | |||
| 12 |
|
Growth/no‐growth model:It defines the surface that delimits the growth area | X: growth factors (T, pH, or aw) ci: concentration of growth inhibitors. The limiting function of certain inhibitors may be expressed with shape parameter as in #3 | Augustin and Carlier (2000b) | |||
| 13 |
|
Growth/no‐growth model:Square and cross‐terms may be includedTwo strains separately | Cardinal parameters fitted with non‐linear logistic regression.If cardinal values are fixed then b 0 ‐b 6 are estimated with linear logistic regression | Tienungoon et al. (2000); Le Marc et al. (2005) | |||
| 14 |
|
Growth/no‐growth model:T (4–30°C), pH (4.24–6.58) and aw (0.900–0.993)Agar versus broth Composite of strains | Ordinary logistic regression | Koutsoumanis et al. (2004) | |||
| 15 | Logit P = a0 + a1T + a2T2 + a3SL + a4SL2 + a5SD + a6SD2 + a7 TSL + a8TSD + a9SLSD | Growth/no‐growth model:Aerobic versus anaerobic conditions.T (4 to 30°C), SL: 0 to 6% (vol/vol), and SD: 0 to 0.5% (wt/vol) with 0.5% or 2.5% NaClComposite of strains | Ordinary logistic regression | Skandamis et al. (2007) | |||
| 16 | Logit P = f(aw, pH, Lactic acid, contamination level) | Growth/no‐growth model:Quantifies the growth potential of L. monocytogenes during the first 8 h of cheese‐making at 30°CpH (5.6 to 6.5),aw (0.938 to 0.96) | Polynomial expressions | Schvartzman et al. (2010, 2011) | |||
| 17 |
P(T, pH, aw) = p(T).p(pH).p (aw), where |
Growth/no‐growth model:Probability of single cell growthT: 5‐25°CpHHCl: 4.4–6.5awNaCl: 0.919–0.989Single strain | Tinf, pHinf and awinf: values below which, no growth occurs (P = 0)Tsup, pHsup and awsup: values above which, growth occurs with P = 1c: inflection point for the impact of temperature on P for growth | Augustin and Czarnecka‐Kwasiborski (2012) |
aw: water activity; CO2: carbon dioxide; MAP: modified atmospheric packaging, MIC: minimum inhibitory concentration, NO2: nitrites; OA: organic acids; Phe: phenolic compounds; SL: sodium lactate, SD: sodium diacetate; T: temperature.
Table H.5.
Overview of thermal and non‐thermal inactivation models for Listeria monocytogenes
| # | Output (response variable) | Equation type | Model variables and ranges | Substrate/Food | Thermal or non‐thermal | References |
|---|---|---|---|---|---|---|
| 1 | Ln(t4D)a | Quadratic or cubic polynomial expression |
T: 4–42°C NaCl: 0.5–19% pH 3.2–7.3 Lactic acid: 0–2% w/w NaNO2: 0–200 ppm Undissociated lactic acid Undissociated nitrous acid |
BHI broth under reduced O2 (100–150 ppm O2) or under aerobic conditions | Non‐thermal | Buchanan and Golden (1995); Buchanan et al. (1997) |
| 2 | Death rate | Gamma model including Bigelow terms |
T: 0–43°C pH: 3.3–10.0 Sorbic acid: 0–0.3% Lactic acid: 0–18% |
Data from Sym'previus, Combase and literature | Non‐thermal (extending from growth to inactivation domain) | Coroller et al. (2012) |
| 3 | Ln D | Quadratic expression |
T: 55–65°C NaCl: 0.5–19% Sodium pyrophosphates: 0–0.3% w/w pH: 4–8.0 |
Beef gravy | Thermal | Juneja and Eblen (1999) |
| 4 | D‐value | Quadratic expression |
T: 57.5–62.5°C NaCl: 0–3% w/w Apple polyphenols: 0‐3% w/w |
Ground beef | Thermal | Juneja et al. (2013) |
| 5 | D‐value, z‐value | Log‐linear | T: 56–62°C | Fruit juices (apple, orange and grape) | Thermal | Mazzotta (2001b) |
| 6 | D‐value, z‐value | Log‐linear | T: 58–66°C | Surimi‐based imitation of crab meat | Thermal | Mazzotta (2001a) |
| 7 | D‐value, z‐value | Log‐linear | T: 55–70°C | RTE chicken‐fried beef patties | Thermal | Osaili et al. (2006) |
| 8 | D‐value, z‐value | Log‐linear | T: 55–65°C | BHI, milk and ham. Inactivation was assessed for 20 strains | Thermal | Osaili et al. (2006) |
BHI: Brain Heart Infusion; D‐value: the time for a one‐log reduction at a constant temperature; Ln: natural logarithm; z‐value: the temperature shift needed to change the D‐value by one log‐unit.
Natural logarithm of the time for 4 decimal (4 D) inactivation.
3.3.6. Summarising remarks for exposure assessment
Persistence of L. monocytogenes in food processing environments is an often observed and important phenomenon for contamination of RTE foods. Some hypovirulent molecular subtypes such as ST 121 seem to encompass multiple isolates with a proven capability to persist.
Whether persistence is a result of improper hygiene conditions or more the effect of strains equipped with an arsenal of genetic determinants is under debate. A high adaptive capacity against physical–chemical factors and biofilm‐forming capacity could partly explain the persistence phenomenon. A transposon (Tn6188) and the bcrABC cassette were shown to be associated with tolerance against some disinfectants. The hypervariable genetic hotspot lmo0443‐lmo0449 appears to play a further role in stress response as it may harbour two independently acting stress survival islets (either SSI‐1 or SSI‐2).
During the time period 2008–2015, non‐compliance at processing ranged from 3.5% to 9.6% for ‘RTE fishery products,’ from 0.9% to 6.8% for ‘RTE products of meat origin other than fermented sausage,’ and from 0% to 0.6% for ‘RTE products of meat origin, fermented sausage.’ Non‐compliance ranged from 0.2% to 1.8% for ‘soft and semi‐soft cheese’ and 0 to 0.3% for ‘hard cheese.’ At retail, non‐compliance was generally lower and for most of the years was less than 1%. The lower level of non‐compliance at retail is at least partly explained by the application of the different limits of FSCs for retail and processing.
The extensive literature survey (outsourcing activity 1) covering the time period 1990–2015 reported that the distribution of the L. monocytogenes prevalence values was asymmetric, with several outliers and extreme values. For the whole period, the median of the prevalence was below 10% for all subcategories, except for fermented sausages (10%), cold‐smoked fish (13%), smoked fish (either cold‐ or hot‐smoked; 12%) and cured/salted fish (12%). There was wide variability between studies due to, for example, the aim of the study, the foods sampled and the geographical origin.
-
According to the EU‐wide BLS conducted in 2010 and 2011 on L. monocytogenes in three RTE food categories at retail:
-
–
at the end of shelf life L. monocytogenes was more prevalent in RTE smoked and gravad fish (10.3%, and 1.7% above 100 CFU/g), than in RTE heat‐treated meat (2.07%, and 0.43% above 100 CFU/g) and RTE soft and semi‐soft cheese (0.47% and 0.06% above 100 CFU/g) products.
-
–
Based on the multivariable models, the odds of L. monocytogenes presence in sliced sampled fish and meat RTE products were higher than in non‐sliced products.
-
–
Additionally, the odds of L. monocytogenes presence were higher for ‘cold‐smoked fish,’ than for ‘hot‐smoked fish’ and ‘unknown smoked’ fish. Moreover, the odds of L. monocytogenes presence were considerably higher for fish samples with two or more AP/AR than for samples with ‘no reported AP/AR’. The reasons are unknown and more studies are needed.
-
–
Of factors associated with prevalence of L. monocytogenes in packaged heat‐treated meat products, higher odds of presence were associated with ‘pâté’ than with ‘cold, cooked meat products’, whereas the odds were not significantly different for `sausage′. Similarly, the proportion of samples with L. monocytogenes counts exceeding 100 CFU/g was associated with the ‘animal species of the origin of the meat product’ and with ‘remaining shelf life’.
-
–
The average L. monocytogenes concentration found among RASFF notifications related to RTE foods was 2.61, 2.46 and 2.34 log10 CFU/g for the categories ‘milk and milk products’, ‘fish and fish products’ and ‘meat and meat products other than poultry’, respectively. The respective highest maximum concentrations were reported as 6.25 log10 CFU/g, 5.32 log10 CFU/g, and 4.75 log10 CFU/g. The concentration was over 2 log10 CFU/g in approximately 80% (‘fish and fish products’) and 65% (‘milk and milk products,’ ‘and ‘meat and meat products other than poultry’) of notifications.
Cooked meat and heat‐treated sausage were the subcategories with most consumed servings per person and year in the EU/EEA and for meat products the number of servings was in general greater for males than for females.
A combination of results from the BLS and consumption data indicates that approximately 55 million servings contaminated with more than 100 CFU/g may be consumed by the ≥ 75 age group per year in the EU/EEA.
Unsafe practices (including storage time and temperatures) are not uncommon within the elderly group (> 10% of persons studied), and can have a potential impact on the human listeriosis risk. There is a wide variation within broadly defined consumer groups and it is thus problematic to generalise about food handling behaviours of these groups and in different MS and on how this may contribute to trends of human listeriosis.
The extent of different behaviours among risk groups between EU Member States may vary to the same extent that socioeconomic factors, traditions and types of food vary. There is uncertainty on the actual distribution in the EU because the studies were developed in only a few countries.
Temperature of domestic refrigerators is highly variable. A review of 23 available survey studies from 1991 to 2016 showed mean, minimum and maximum temperatures ranging from < 5 to 8.1, −7.9 to 3.8 and 11.4 to 20.7, respectively. A recent analysis of domestic refrigerator temperature distributions suggested that the countries were separated into two groups: northern European countries (normal distribution: N (6.1, 2.8)) and southern European countries (normal distribution: N (7.0, 2.7)).
Developments with cardinal growth, probability of growth models and non‐thermal inactivation models, together with data on strain variability and stochastic modelling are promising. Developments include validated models which have improved the capability to provide realistic predictions for L. monocytogenes growth in RTE foods.
Knowledge gaps make it difficult to draw quantitative conclusions on the range of food handling behaviours in different risk and age groups and on how this may contribute to trends of human listeriosis. In this context, there is a need for better information on human listeriosis cases in terms of socioeconomic–demographic data.
There is a need to better understand how the dietary practices and food handling of the elderly are affected by ageing and how this may be linked to an increased exposure to L. monocytogenes.
To improve the performance of cardinal models there is a need to better understand the lag time and the adaptive responses to environmental shifts both at single cell and population level, as well as the quantitative impact of intrinsic factors (e.g. food structure, indigenous microflora) on the growth, including MPD, and survival of L. monocytogenes.
3.4. Evidence for risk characterisation – summary of recent risk assessment studies
3.4.1. Results from the review of QMRA outputs
The available QMRA studies from the literature were retrieved by Pérez‐Rodríguez et al. (2017) and reviewed. These studies performed quantitative risk assessment and covered deli meats sliced at retail or pre‐packaged, vacuum or non‐vacuum packaged, soft cheeses made of both pasteurised and non‐pasteurised milk, smoked fish including gravad salmon, rainbow trout, pasteurised milk and fresh produce (leafy vegetables). Regarding the approach to address variability and uncertainty, both first and second order approaches were undertaken. The influential factors on risk estimate included: (i) time and temperature at different stages of the food chain, mainly during distribution and storage at retail or at consumer level, (ii) the food's intrinsic characteristics (e.g. pH, aw, presence of inhibitors), (iii) extrinsic factors (e.g. packaging atmosphere), (iv) application of lethality treatment such as heat treatment (pasteurisation), (v) likelihood of transfer due to slicing or other handling steps, such as partitioning or cross‐contamination by the processing environment, (vi) prevalence and concentration of L. monocytogenes, (vii) susceptibility of population, (viii) serving size and (ix) number of servings.
Assessment of the impact of the aforementioned factors on the final risk estimate was done either through sensitivity analysis, estimating the correlation coefficient between the model inputs (for exposure assessment and DR) with the outputs of concern, e.g. mean number of human listeriosis cases per year, or via ‘what if’ scenario analysis and importance analysis, in relation to a baseline scenario, or a combination of both. Some studies performed detailed (‘advanced’) sensitivity analysis by assigning values for certain input parameters at specified percentiles (in the range of 1–99%) of their distribution, leaving the other model input parameters to vary according to their own distribution and performing Monte Carlo simulations to estimate the change in model output (e.g. number of cases) as a result of input shifts in the specified percentiles (Carrasco et al., 2010; Mataragas et al., 2010; Pradhan et al., 2010, 2011; Stasiewicz et al., 2014).
Assessment of risk was based on the following three groups of population: perinatal (fetuses and newborns from 16 weeks after fertilisation to 30 days after birth), the elderly population (> 60 or > 65 years old) and intermediate population that does not belong to either of these categories. When a single population group was considered in the risk characterisation, then either the elderly, or the perinatal subpopulations, or collectively the high‐risk fraction of a national population was used. In some cases (e.g. see Carrasco et al. (2010)) the risk estimates for the high‐risk population were compared with those of the low‐risk population. Expressions of risk included cases per year or per serving.
According to the sensitivity or scenario analysis of the QMRA studies reviewed, the factors per food category identified as being influential on the risk of human listeriosis per serving or per year have been summarised below.
Deli meats
A risk assessment for L. monocytogenes in deli meats predicted that 63–84% of human listeriosis cases and deaths attributable to deli meats are due to retail‐sliced products (Gombas et al., 2003; FSIS, 2010; Pradhan et al., 2011). Sensitivity and scenario analyses performed by Pradhan et al. (2011) indicated that the frequency of cross‐contamination at retail from other food products or from the environment was the most important factor that affected the relative risk of listeriosis‐associated deaths. It was estimated that cross‐contamination of deli ham and turkey from other products increased the relative risk of listeriosis‐associated deaths 5.9‐ and 6.1‐fold, respectively, and from the retail environment 4.9‐ and 5.8‐fold, respectively.
The prevalence and levels of L. monocytogenes at the processing plant, the stage of product slicing, storage time and temperature at retail and at the consumer level, as well as the presence of growth inhibitors are affecting the risk of listeriosis (Endrikat et al., 2010; Garrido et al., 2010b; Gallagher et al., 2013). Retail‐sliced products represent a two‐ to fourfold higher risk (also expressed through the number of deaths) than prepackaged sliced products (Endrikat et al., 2010; Gallagher et al., 2013). Endrikat et al. (2010) carried out a risk assessment of pre‐packaged RTE meat and poultry foods produced by federally inspected processing facilities in the period from the early 1990s to 2008. Notably, the decreasing trend in the prevalence of L. monocytogenes at production (and the expected concomitant decline in the human listeriosis incidence rate) was counteracted by the increase in prevalence at retail due to slicing. It was suggested that this resulted in the constant listeriosis rates observed from 2001 onwards (Endrikat et al., 2010).
The elevated risk posed by products sliced at retail is reduced almost 2.8‐ to 9‐fold if growth inhibitors are used in the formulation of the cooked meat products (Pradhan et al., 2010). According to the modified version of the 2003 FDA and FSIS (FDA and FSIS, 2003) model for the assessment of the relative risk of L. monocytogenes in 23 categories of RTE products, almost 70% of the estimated deaths caused by consumption of contaminated deli meats were attributed to retail‐sliced products that did not contain growth inhibitors (Endrikat et al., 2010; FSIS, 2010). The prevalence and levels of L. monocytogenes on products when they leave the plant in combination with their ability to support growth of the organism are influential factors on consumers’ exposure (Garrido et al., 2010a; Gallagher et al., 2013).
Storage temperature has a higher influence on the risk of listeriosis than storage duration. Reduction of the home storage temperature of vacuum‐packaged cooked ham and turkey to below 7°C confers a marked reduction in the risk. Nonetheless, long storage time at retail (i.e. longer shelf life) or at home only, especially in combination with improper temperature control, may significantly increase the risk (Gallagher et al., 2013).
The sensitivity analysis of Mataragas et al. (2010) for cooked meat products, targeting the high‐risk fraction of the EU population (approx. 20–25%), suggests that a retail storage temperature of 7°C or home storage temperature of 9.4°C, a storage duration of 22 days at retail and 5 days at home are the cut‐off values for a steep increase in the risk of listeriosis. The use of antimicrobials in the formulation or the application of post‐lethality antimicrobial interventions is thought to contribute to further risk reduction.
Cross‐contamination from the retail environment, e.g. due to slicing, or other contaminated products increases the risk more than the increase in the prevalence of L. monocytogenes in the unopened products (Pradhan et al., 2011). Controlling cross‐contamination, especially from products that do not support growth to products that support growth, e.g. by GHP, the use and frequent replacement of gloves, equipment sanitation, elimination of niches and early slicing, contributes to the control of the risk (FDA and FSIS, 2003; Pouillot et al., 2015a). Serving size is thought to have the least effect on the risk.
Fish products
The dominant factors that seem to affect the risk estimate in this product category are those determining the concentration of the pathogen at the time of consumption (Lindqvist and Westoo, 2000; Pouillot et al., 2007, 2009). As such, control of temperature (< 4.5°C) throughout the supply chain in combination with short storage periods (e.g. < 7 days in home refrigerators) and compliance with microbiological criteria, i.e. < 100 CFU/g, at the moment of food purchase, especially in the trout model, were identified as the most effective means for controlling the risk of listeriosis (Garrido et al., 2010b). According to Pouillot et al. (2007, 2009) employing second‐order exposure assessment and risk characterisation models, respectively, listeriosis caused by consumption of cold‐smoked salmon is attributable to the rare consumption of products with high doses, due to growth of L. monocytogenes. The number of listeriosis cases correlated well with the frequency of exposure to 108 CFU/serving (Pouillot et al., 2009). As such, the mitigation strategies that may reduce the risk of listeriosis in this product are those associated with the reduction of prevalence and actions taken at the consumer phase, such as limiting the temperature abuse (e.g. by lowering the mean temperature in domestic refrigerators by 2–3°C) and reducing the duration of domestic storage, i.e. from purchase to consumption. In contrast, the control of initial contamination is less effective in reducing the risk, unless the growth of L. monocytogenes is sufficiently controlled post‐packaging up to the moment of consumption (Pouillot et al., 2009).
In the same context, other factors to which the final risk estimate was found to be sensitive were the growth rate of lactic acid bacteria acting as competitors to L. monocytogenes, the variability and the uncertainty around the mean parameter of the reference growth rate of L. monocytogenes, the variability in the minimum growth temperature of L. monocytogenes, and the variability in consumer refrigerators and in the proportion of consumers exposed to contaminated products (Pouillot et al., 2007, 2009; Vasquez et al., 2014).
The predicted risk is also highly affected by the DR model used and it is important that the model sufficiently represents the virulence properties (also in relation to human susceptibility) of various L. monocytogenes strains (Lindqvist and Westoo, 2000). In the Pouillot et al. (2009) model, the uncertainty in the r parameter of the DR model, representing the probability of infection per single cell, was the major influential factor of the uncertainty in the predicted number of listeriosis cases.
Dairy products
For raw milk, first the storage temperature and then the time between collection of milk in the bulk tank and the purchase are the most critical factors affecting the risk of listeriosis. The longer the time the higher the risk (Latorre et al., 2011). Purchasing raw milk from retail stores leaves more time for L. monocytogenes to grow and thus increases the risk. According to Latorre et al. (2011), existence of microbiological raw milk testing programmes may contribute highly to risk reduction. The susceptibility of different consumer groups was assessed with the following decreasing order: elderly > perinatal > intermediate.
Increasing the milk pasteurisation temperature from 72 to 82°C, in the context of high temperature short time processing, may be associated with an increase of human health risk from listeriosis. This is possible because in the event of post‐process contamination of milk with L. monocytogenes, the organism may grow faster and at higher maximum levels than in milk pasteurised at a lower temperature. This is due to the lower levels of competing microbiota achieved by increasing the pasteurisation temperature (Stasiewicz et al., 2014). The rise in risk is further supported by improper consumer practices in the storage of milk, i.e. increases in temperature and storage duration. By contrast, boiling milk in vending machines markedly reduces the risk of listeriosis (Giacometti et al., 2015).
In Canada and the USA, it was estimated that raw milk cheeses pose a 53 and 112 times higher risk, respectively, than cheeses made from pasteurised milk, the latter being considered as the baseline risk case (FDA and Health Canada, 2015). Lethality treatments may reduce the risk, but only 100% testing of lots and removing the positive ones may ensure higher risk reduction than that ensured by using pasteurised milk for cheese manufacturing (Williams et al., 2009; FDA and Health Canada, 2015).
In soft cheeses made from raw milk, such as camembert of Normandy and brie of Meaux, growth is expected to be higher in the rind than in the core, but the overall risk seems to be low and controlled by the competitive growth of curd acidification by starters (Sanaa et al., 2004). The final risk estimate is sensitive to the speed and strength of curd acidification.
In soft‐ripened cheese made of pasteurised milk, the factors impacting the risk of illness by L. monocytogenes are cross‐contamination or re‐contamination during manufacturing (linked to the hygiene of the processing environment), the control of L. monocytogenes concentration in cheese entering the ripening room and the time–temperature and the ageing of the cheese at retail (Tenenhaus‐Aziza et al., 2014).
Leafy vegetables
Storage temperature at retail and in the home, duration of storage and serving size are the most influential factors for the risk of listeriosis derived from leafy greens intended to be eaten raw (Tromp et al., 2010; Ding et al., 2013; Sant'Ana et al., 2014). In salad bars, the amount of products in stock and turnover times may further contribute to risk since this will influence the probability of having products out of date or of lower quality (Franz et al., 2010; Tromp et al., 2010).
3.4.2. Results from the outsourcing activity 2 risk assessment
A quantitative risk characterisation of L. monocytogenes in various RTE food categories (heat‐treated meat; smoked and gravad fish; and soft and semi‐soft cheese) in the EU was performed, starting from the retail stage. In principle, the three major RTE food categories (meat, fish and dairy) that were considered by the BLS in 2010 and 2011 were considered. The three categories were divided into seven subcategories, including cooked meat, sausage and pâté, cold‐ or hot‐smoked fish and gravad fish and soft/semi‐soft cheese.
For prevalence and concentration, data from the BLS were complemented with EU monitoring data and data from other sources: (i) the BLS data, (ii) the EU monitoring data (2011–2014) and (iii) scientific studies retrieved by Jofré et al. (2016).
For modelling purposes, prevalence of L. monocytogenes in the major RTE food subcategories was considered for further splitting into food subcategories, based on their relevance to risk and according to the review analysis. In particular, prevalence scenarios were considered for sliced/non‐sliced RTE foods as well as for the type of atmosphere packaging, i.e. reduced oxygen packaging (ROP) and normal.
Input data were introduced as distributions into the stochastic risk assessment model and different scenarios and sensitivity analyses were carried out. Growth of L. monocytogenes considering interaction with lactic acid bacteria was modelled from retail to consumption using temperature–time profiles during food transport and storage. This information was combined with the Pouillot et al. (2015b) DR model (see Section 3.2.3) to estimate the number of listeriosis cases per million servings (reflecting individual and food‐related risk; Appendix I) and per year (reflecting population risk or public health burden, also associated with consumption frequency; Table 17) in the EU separately for the ‘healthy’ population (< 65 years), the elderly (≥ 65 years) and pregnant women by varying the parameter of the DR model for the different risk groups. The distribution used in the QMRA reflects mostly variability and the only uncertainty evaluated was in the prevalence estimate.
Table 17.
Estimation of the number of human listeriosis cases per year in the EU in the ready‐to‐eat (RTE) food subcategories (adopted from Pérez‐Rodríguez et al. (2017))
| RTE food subcategory | Population subgroups | |||
|---|---|---|---|---|
| Healthya | Elderlyb | Pregnant | Total | |
| Cold‐smoked fish | 54 (42, 68) | 201 (154, 254) | 104 (75, 138) | 358 (271, 460) |
| Hot‐smoked fish | NC (NC, 1) | 1 (NC, 1) | 6 (4, 8) | 7 (4, 10) |
| Gravad fish | 48 (33, 70) | 230 (160, 320) | 92 (63, 129) | 370 (257, 519) |
| Cooked meat | 71 (50, 98) | 316 (218, 449) | 477 (337, 659) | 863 (604, 1207) |
| Sausage | 64 (31, 118) | 252 (120, 469) | 225 (107, 417) | 541 (258, 1003) |
| Pâté | 12 (4, 27) | 92 (28, 220) | 54 (16, 130) | 158 (48, 377) |
| Soft and semi‐soft cheese | 5 (2, 10) | 11 (5, 20) | 3 (1, 6) | 19 (8, 36) |
| Total | 254 (162, 392) | 1,103 (685, 1,733) | 961 (603, 1,487) | 2,318 (1,450, 3,612) |
Numbers outside brackets represent 50th percentile. Numbers between brackets represent 2.5th and 97.5th percentiles. NC stands for no cases, which refers to values < 0.5 cases/year; for values between 0.5 and 1, the values have been rounded to 1. Total refers to the arithmetic sum of the number of cases.
< 65 years old.
≥ 65 years old.
Heat‐treated meat products
For heat‐treated meat products, results showed that the type of product exerted a noticeable effect on the incidence rates of human listeriosis. According to the simulation outcome, pâté presented the highest listeriosis risk (2.14 × 10⁻⁵ − 2.51 cases/106 servings) followed by cooked meat (2.72 × 10⁻⁴ – 1.26 cases/106 servings) and sausage (1.96 × 10⁻⁵ – 8.28 x 10⁻¹ cases/106 servings). Numbers between brackets represent the maximum range between the estimated 2.5th and 97.5th percentiles of the different atmosphere and slicing combinations within the food category (Appendix I). In pâté, the population group with the largest risk per million servings was pregnant women, followed by the elderly and finally the healthy population. The package atmosphere and slicing appeared to affect listeriosis risk across all population groups, and this was most evident in the pregnant population. In all cases, ROP and slicing led to the lowest listeriosis risk. In contrast, the combination with the greatest total risk values corresponded to normal atmosphere packaging and slicing, indicating that slicing becomes a relevant factor contributing to listeriosis risk when combined with normal packaging. Predicted risk levels associated with cooked meat were highest for the pregnant population. Sausage products presented a lower risk than cooked meat and pâté.
According to Pérez‐Rodríguez et al. (2017), the uncertainty range in the estimates, here mostly reflecting variability, is important to consider when types of product and populations are compared. In some cases, the 95% interval ranged more than one order of magnitude (e.g. in sausage with normal and non‐slicing conditions for the elderly), indicating that those risk estimates are associated with a large variability and should be carefully interpreted.
As regards the type of product, i.e. type of package atmosphere and slicing/non‐slicing, a definitive and general conclusion was not drawn by Pérez‐Rodríguez et al. (2017). Overall, it appears that slicing and normal atmosphere are more often related to a higher listeriosis risk, although this was not a general rule and, for example, for pâté, the highest combination corresponded to sliced and ROP packaged pâté. It is likely that the combined effect of prevalence and the shelf life associated with each product could play a relevant role in these differences.
Smoked and gravad fish
In general, the predicted median number of cases per million servings is higher in either cold‐smoked fish or gravad fish depending on conditions and lower in hot‐smoked fish (Appendix I).
The predicted number of listeriosis cases per million servings was similar for sliced and non‐sliced products under both ROP and normal atmosphere packaging.
For hot‐smoked fish, the model predicted a much lower number of cases (10 times lower) than for cold‐smoked fish due to the lower prevalence values, and the expected lower growth rate of L. monocytogenes during storage. The population group exposed to the largest risk was again pregnant women, followed by the elderly and finally the healthy population. The ROP/sliced condition was associated with the highest predicted number of listeriosis cases.
The scenario associated with the highest risk was that corresponding to exposure of the pregnant population to gravad fish sliced and packed with normal atmosphere packaging or ROP. For this scenario, a median of 1.1 cases/106 servings is predicted, with a 2.5% and 97.5% percentile of 0.7 and 1.6 cases/106 servings, respectively. As for cooked meat, risk estimates for the pregnant population were associated with a large variability and results should be carefully interpreted. For the elderly and healthy subpopulation, predicted risk for the RTE fish category was in general 10 and 100 times lower than for the pregnant population, respectively.
Soft and semi‐soft cheese
Predicted risk per million servings for soft and semi‐soft cheese indicates substantial effects from the slicing procedure. Specifically, slicing doubled the predicted risk associated with soft and semi‐soft cheese independent of population group. For instance, for the pregnant population the median number of predicted cases per million servings was 1.07 × 10⁻³ for non‐sliced and 1.98 × 10⁻³ for sliced cheese. The predicted risk for the pregnant population group was 100 times greater, expressed as listeriosis cases per million servings, than for the elderly population.
In the risk model, predicted growth was low for all evaluated scenarios independent of packaging atmosphere. Moreover, for this RTE food category, it seems that the effect of slicing contributed mostly to the increase in the number of cases due to an increase in prevalence.
Predicted number of total cases – public health burden
The overall risk estimates were obtained for each food subcategory expressed as listeriosis cases per year in the EU, derived from the number of servings in the EU Member States and their proportions on the market (Table 17). The model estimated 2,318 (95th percentile interval: 1,450–3,612) listeriosis cases per year in the EU considering the seven RTE food subcategories altogether. The overall results indicated that the higher risk population group was the elderly population to which 48% of total cases were attributed, followed by pregnant women (41%), and finally the < 65‐year‐old population (11%) (see Table 18). The attribution of cases to the pregnant population appears to be an overestimation compared to the distribution of cases during the period, where about 8% of reported cases were related to the 25‐ to 44‐year female age group. The discrepancy is partially a result of the scope of the risk assessment and the application of a DR model considering only these three groups.
Table 18.
Attribution of the yearly estimated 2,318 human listeriosis cases in the EU to the population subgroups and the ready‐to‐eat (RTE) food subcategories (derived from Table 17)
| RTE food subcategory | Population subgroup | |||
|---|---|---|---|---|
| Healthya | Elderlyb | Pregnant | Total | |
| Cold‐smoked fish | 2.3 | 8.7 | 4.5 | 15.5 |
| Hot‐smoked fish | 0.0 | 0.0 | 0.3 | 0.3 |
| Gravad fish | 2.1 | 9.9 | 4.0 | 16.0 |
| Cooked meat | 3.1 | 13.6 | 20.6 | 37.3 |
| Sausage | 2.8 | 10.9 | 9.7 | 23.4 |
| Pâté | 0.5 | 4.0 | 2.3 | 6.8 |
| Soft and semi‐soft cheese | 0.2 | 0.5 | 0.1 | 0.8 |
| Total | 11.0 | 47.6 | 41.4 | 100.0 |
< 65 years old.
≥ 65 years old.
The results per food category showed differences in this aspect. For pâté, sausage, soft and semi‐soft cheese and cold‐smoked and gravad fish most cases were attributed to the elderly population and for cooked meat and hot‐smoked fish to the pregnant population. The product that obtained the highest median number of predicted listeriosis cases was cooked meat, closely followed by sausage.
Regarding smoked and gravad fish, the highest number of listeriosis cases was predicted for the subcategory gravad fish in the elderly subpopulation (median = 230 cases), followed by cold‐smoked fish in the elderly population (median = 201 cases) and the pregnant population (median = 104 cases). In general, the elderly subpopulation was predicted to be by far the most affected, especially when consuming gravad fish. However, for other food subcategories, such as hot‐smoked fish, only a slight difference in the number of cases between the three subpopulations (six cases for the pregnant women, one case for elderly women, and no cases for the healthy subpopulation) was predicted.
Finally, for soft and semi‐soft cheese, the elderly population was associated with the highest number of predicted cases (median = 11) followed by the healthy and pregnant population groups.
Uncertainty and sensitivity analysis
Pérez‐Rodríguez et al. (2017) identified and described sources of uncertainty in the risk assessment model. For the assessment of uncertainty, the effect of individual variables was qualitatively assessed by determining each one's direction on the increase or reduction in the final number of human listeriosis cases per year in the EU population. A quantitative assessment of uncertainty was not done except for the uncertainty in the prevalence estimate. This was stated to be due to the scarcity of data and information for some variables. Thus, the combined effect of all uncertainties was not quantified.
To determine the influence of the most important model inputs on the estimated number of human listeriosis cases, Pérez‐Rodríguez et al. (2017) performed scenario analyses with a focus on those variables deemed to be important sources of uncertainty in the model. The selected variables were modified to values representing worst‐ and best‐case scenarios. Results were expressed as variation percentages (%) in the number of cases with respect to the outcome from the baseline model expressed per million servings to enable comparisons between food categories with different consumption patterns.
Different factors had different impacts on estimated risk in the different food categories. In general, the most important factor was storage temperature and the effect was greatest for heat‐treated meat. The assumption on the maximum concentration of L. monocytogenes in a serving impacted on the estimated risk for all food categories but especially for RTE fish. The effect of the time to consumption was fairly small except for RTE fish. The assumption of the presence of a lag time or not was also small for all food categories and introducing lag time only reduced the estimated risk in heat‐treated meat not RTE fish or RTE cheese.
3.4.3. Summarising remarks for risk characterisation
Most risk characterisations consider three risk populations (i.e. pregnant women/perinatals (fetuses and newborns from 16 weeks after fertilisation to 30 days after birth), the elderly (> 60 or > 65 years old), and the intermediate population that do not belong to either of these categories) and have not addressed gender differences. This limitation can be addressed with DR data and other input data developed at a finer resolution in some recent publications and in the present Scientific Opinion.
The importance of growth as a risk determining step is reinforced in the review of published risk assessments and levels of important factors reducing growth (such as storage times, storage temperatures, antimicrobials, competition) have been reported under different assumptions and scenarios.
At retail, cross‐contamination from other products and from the retail environment (including during slicing) to RTE foods has been identified as important for the predicted risk of human listeriosis.
-
Based on the quantitative risk characterisation of L. monocytogenes in various RTE food categories (heat‐treated meat; smoked and gravad fish; and soft and semi‐soft cheese) in the EU (outsourcing activity 2):
-
–
The food subcategory associated with the largest number of cases per year was cooked meat (863 cases). After that followed, sausage (541 cases), gravad fish (370 cases), cold‐smoked fish (358 cases), pâté (158 cases), soft and semi‐soft cheese (19 cases) and hot‐smoked fish (7 cases). For hot‐smoked fish and for cooked meat, most of these cases were attributed to the pregnant population, for the rest of the food subcategories most cases were attributed to the elderly population (≥ 65 years old). The fewest cases were attributed to the healthy population (< 65) for all food categories. Cases due to other food categories were not considered in the assessment.
-
–
Estimated risks expressed as the median number of cases per million servings was in general highest for the pregnant population, followed by the elderly and last the healthy population.
-
–
Similarly, the estimated median number of cases per million servings for RTE meat for all scenarios and populations ordered by the range was pâté (2.14 × 10⁻⁵ – 2.5 cases) followed by cooked meat (2.72 × 10⁻⁴ – 1.26 cases) and sausage (1.96 × 10⁻⁵ – 8.28 × 10⁻¹ cases). For RTE fish, gravad fish (2.16 × 10⁻³ – 1.57 cases), cold‐smoked fish (3.02 × 10⁻⁴ – 2.34 × 10⁻¹ cases), and hot‐smoked fish (4.94 × 10⁻⁷ – 4.55 × 10⁻⁴ cases), and for soft and semi‐soft cheese (4.39 × 10⁻⁶ – 1.95 × 10⁻² cases).
-
–
Most of the cases were predicted to occur in the elderly population (48%) followed by the pregnant population (41% of cases) and the healthy population (11%). The attribution of cases to the pregnant population appears to be an overestimation compared to the distribution of cases during the period, where about 8% of reported cases were related to the 25‐ to 44‐year female age group. The overestimation is partially a result of the scope of the risk assessment and the application of a DR model considering only these three populations.
-
–
Uncertainty sources for some variables such as initial prevalence should be further elucidated as well as variability in L. monocytogenes growth when types of product and populations are compared.
-
–
The evaluated input variables had different impacts on estimated risk in the different food categories. In general, the most important factor was storage temperature, and the effect was greatest for heat‐treated meat.
-
–
The assumption on the maximum concentration of L. monocytogenes in a serving had an impact on the estimated risk for all food categories but especially for RTE fish. The effect of the time to consumption was fairly small except for RTE fish. The assumption of the presence on lag time was also small for the three considered food categories.
-
–
3.5. Evaluation of the epidemiological trend of human listeriosis
3.5.1. Results of the aggregated TSA
In this section, the analysis of the aggregate L. monocytogenes series from January 2008–December 2015 is presented. This analysis modelled confirmed human invasive listeriosis cases per month. This was also the outcome used in the analysis described in Section 1.1 (EFSA and ECDC, 2015) that led to the conclusion of an increasing trend. Furthermore, the underlying total population (denominator) did not change meaningfully and the analysis of the incidence rates would give the same results. This is in contrast with an analysis by age–gender subgroups, in which the variation may be more significant. As mentioned in Section 2.2.1, the 2008–2015 time series exhibits changing dynamics and requires a dynamic linear modelling approach. A random walk model with seasonal effects (Equations 1 and 2) and a local linear growth model (i.e. a second‐order trend model) (Equations 3 and 4) were finally selected as appropriate to model these data.
For the simple random walk plus seasonal trend model the maximum likelihood estimates of the variances for the two equations are V = 29.9 and W = 184.3. This means that most of the variation (more than six times more) of the L. monocytogenes series is explained by the random walk and the seasonal patterns in the data. With the selected model, the total variance of the time series is partitioned as a random walk and seasonal model across two equations. This means that about 86% (= 184.3/(184.3 + 29.9) × 100) of the variation in the series is explained by the subsequent model. The strong seasonal component in those data comes out. The random walk component also implies that the current number of listeriosis cases depends on the past value plus an error term considered as white noise.
Figure 15 shows the original data expressed as human invasive listeriosis cases and the original data expressed as invasive listeriosis cases divided by the population, both in function of time. The two trends appear very similar, and it was decided to report the analysis using the invasive listeriosis cases as the outcome only.
Figure 15.
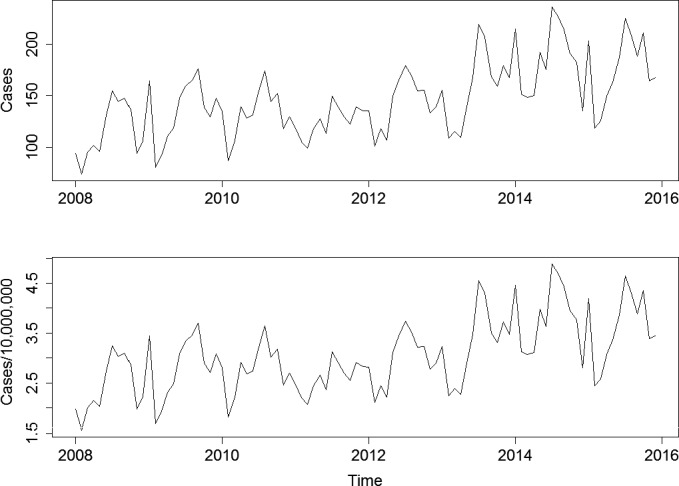
- Top graph: human invasive listeriosis cases; bottom graph: human invasive listeriosis cases per 10,000,000 population.
Figure 16 shows the original data with several additional measures from the fitted model. The top panel shows the raw data with the filtered (red) and smoothed (green) fits. The filtered fits are the running version of the model for predicting time t given only time t‐1 and past seasonal values. The smoothed values are the best prediction given all values from time t = 1 to time t = T (thus it is ‘smoother’). The second panel in the plot shows the time‐varying seasonal component. This shows that early in the series, it is hard to estimate the seasonality since it has a large variance compared with the later part of the series. In contrast, in the later part of the time series, the seasonality becomes more regular and easier to estimate. Finally, the last panel gives the standardised residuals.
Figure 16.
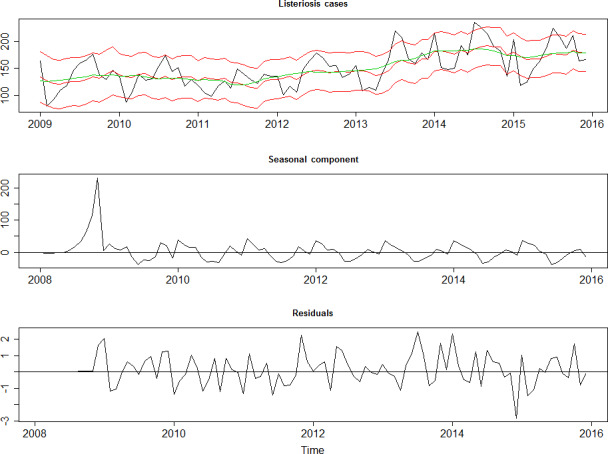
- Top graph: cases with fitted random walk plus seasonal model and 95% credibility interval (red), and smoothed estimate (green). Middle graph: Seasonal component of the Listeria time series. Bottom graph: Standardised residuals of the Listeria time series after removal of the seasonal component and the trend.
These residuals are white noise, meaning that the residuals are uncorrelated (i.e. stable) and that forecasting is allowed since we can model the dynamics, i.e. shocks/noise/residuals are uncorrelated. Their autocorrelation functions have values showing no residual serial correlation. In a TSA, current values of a dependent variable can be based on both the current values of an explanatory variable and on the lagged (past period) values of the dependent variable (e.g. one month earlier (t−1)). If such a relation exists between residuals and past residuals, this indicates that there is no white noise. Ljung–Box tests of the serial correlations tests the null hypothesis that there is no correlation between the residuals and the residuals in previous months. This test resulted in a p value of 0.88 at lag one month which led to the conclusion that the null of no serial correlation could not be rejected; in other words, that there is no violation of the white noise in the model. The same is true at the seasonal lag of 12 months with a p value of 0.37.
When the local linear growth model is estimated, the variance estimates are V = 23.6, W = 189.2, and U = 3.37 × 10⁻⁸. This means that there is nearly no variance in the trend term βt. This model was rejected because the second‐order term explained nearly zero of the variance in the Listeria time series.
The random walk plus seasonal trend is therefore the appropriate model. This model was used to forecast the number of human invasive listeriosis cases, as shown in Figure 17, indicating the stability of the number of cases in the EU/EEA.
Figure 17.
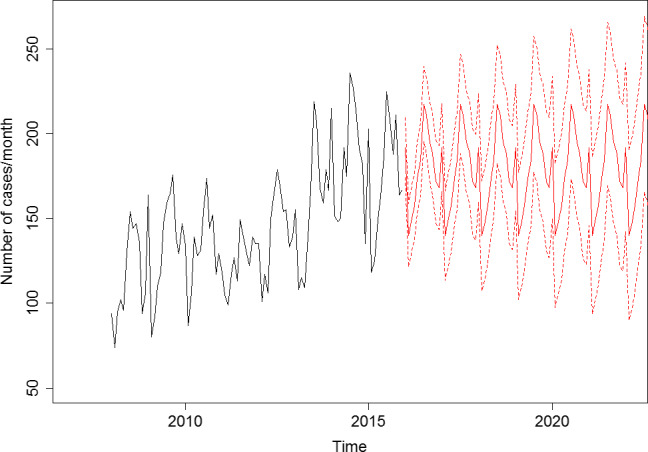
Cases of confirmed human invasive listeriosis in function of time observed in the EU/EEA and future predictions based on the fitted random walk plus seasonal model, with the respective intervals based on one standard deviation, 2008–2015
These results are not consistent with the conclusions in the EU summary report by EFSA and ECDC (2016), which identified an increasing trend of confirmed human invasive listeriosis cases during the period 2008–2015. This may be attributed to the difference in the countries included in the analysis, the exclusion criteria applied (e.g. age, gender) and the different analytical approaches being used. In the report, a 12‐month moving average was used to assess the temporal trends at the EU level and linear regression was applied to test the significance of trends. A linear regression analysis does not address auto‐ and seasonal correlation, and assumes linearity and normally distributed residuals. The visual representation of the number of L. monocytogenes cases in the report with a moving average indicates a stable trend until 2013 and a change between 2013 and 2015, indicating non‐linearity. The TSA accounted for auto‐ and seasonal correlation and other issues such as non‐linearity. Obviously, this makes the detection of an increasing trend harder, i.e. requiring stronger evidence. It is noteworthy that the report also indicates (i.e. no p value reported as a statistical support) that the number of invasive listeriosis cases stabilised in 2015.
The presence of seasonality is interesting and could be due to several factors, such as hygiene, climate, human behavioural factors and seasonal consumption patterns.
3.5.2. Results of the disaggregated TSA
As mentioned earlier, the analysis of the aggregated 2008–2015 data did not result in the indication of an increasing trend of invasive listeriosis incidence rates, probably partly a consequence of the presence of autocorrelation and seasonality. From this analysis, it was unclear whether or not this absence of proof of a trend would also be valid when performing the analysis for subgroups.
Figure 18 shows the evolution of reported human invasive listeriosis incidence rates in the EU/EEA between 2008 and 2015, by age and gender. The thick lines correspond to smoothed trend lines based on local regression. In Appendix B, the evolution has been shown for a selection of age groups using the same scale on the y‐axis.
Figure 18.
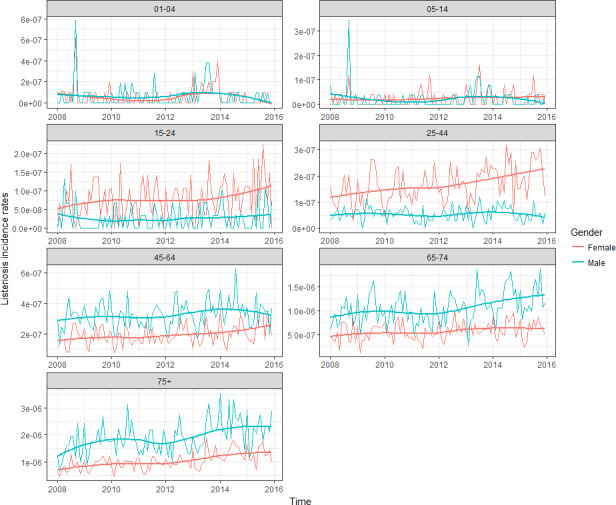
- The thick lines correspond to smoothed trend lines based on local regression.
As a first step, the incidence rate per person‐month was calculated for the year 2008 as shown in Table 19. The human invasive listeriosis incidence rate is statistically higher in the female 25–44 group than in the male 25–44 group, while the opposite is true for the 45–64, 65–74 and ≥ 75 age groups. The same differences are still noticed in 2015, but in that year the Listeria incidence rate is also statistically higher in the female than in the male 15–24 group.
Table 19.
Incidence rates of human invasive listeriosis (cases per million population and month) observed in the EU/EEA and the incidence rates by age–gender combination in 2008 and 2015
| Year | Age group | Incidence in males(A) | Incidence in females(B) | Male/female incidence ratio(A/B)a | CI | p valueb | |
|---|---|---|---|---|---|---|---|
| 2008 | 1–4 | 0.09 | 0.09 | 1.04 | 0.44 | 2.53 | 0.924 |
| 2008 | 5–14 | 0.04 | 0.02 | 1.88 | 0.77 | 5.03 | 0.166 |
| 2008 | 15–24 | 0.04 | 0.05 | 0.71 | 0.35 | 1.42 | 0.334 |
| 2008 | 25–44 | 0.05 | 0.12 | 0.43 | 0.30 | 0.61 | < 0.001 |
| 2008 | 45–64 | 0.30 | 0.17 | 1.79 | 1.44 | 2.24 | < 0.001 |
| 2008 | 65–74 | 0.89 | 0.50 | 1.78 | 1.44 | 2.20 | < 0.001 |
| 2008 | ≥ 75 | 1.41 | 0.76 | 1.87 | 1.56 | 2.25 | < 0.001 |
| 2015 | 1–4 | 0.03 | 0.02 | 1.83 | 0.34 | 14.81 | 0.491 |
| 2015 | 5–14 | 0.01 | 0.03 | 0.48 | 0.12 | 1.57 | 0.231 |
| 2015 | 15–24 | 0.03 | 0.11 | 0.30 | 0.15 | 0.58 | < 0.001 |
| 2015 | 25–44 | 0.05 | 0.21 | 0.21 | 0.15 | 0.30 | < 0.001 |
| 2015 | 45–64 | 0.32 | 0.23 | 1.38 | 1.14 | 1.67 | 0.001 |
| 2015 | 65–74 | 1.25 | 0.61 | 2.06 | 1.72 | 2.46 | < 0.001 |
| 2015 | ≥ 75 | 2.20 | 1.30 | 1.70 | 1.49 | 1.94 | < 0.001 |
CI: confidence interval.
different rounded values are obtained by using the values shown in (A) and (B) due to the rounding to two decimals.
based on tests for independence for comparison of rates and test of independence two‐sided p values calculated using mid‐p.
Table 20 shows the results of a Poisson auto‐regression. When no rho coefficients are reported, the fitted model is a Poisson regression with a population offset. The PAR(p) and Poisson regression estimates for the models with the offsets are the best fit for each gender–age series. The positive signs on the autoregressive coefficients indicate positive serial correlation when it is present. The trend (incidence rate) increases statistically when the z values are higher than 1.96 in absolute terms. Although one needs to be careful to use the monthly incidence rate ratios based on a Poisson regression in the presence of autocorrelation, the monthly relative average increase based on the latter regression model is shown in the last column in Table 20.
Table 20.
Poisson autoregression model output with population offsets for the Listeria rates by age–gender combinationa
| Gender | Age group | Trend coefficientb (×100) | z value | Rho(1)c | Rho(2)c | Monthly % increase in incidence rated (+ CI) |
|---|---|---|---|---|---|---|
| Female | 1–4 | < 0.001 | < 0.01 | — | — | Non‐significant |
| 5–14 | 0.819 | 1.61 | — | — | Non‐significant | |
| 15–24 | 0.532 | 0.97 | 0.614 | — | Non‐significant | |
| 25–44 | 0.610 | 2.90 | 0.347 | — | 0.64 [0.42,0.86] | |
| 45–64 | 0.355 | 1.78 | 0.345 | — | 0.43 [0.23,0.64] | |
| 65–74 | 0.313 | 1.93 | 0.245 | — | 0.30 [0.10,0.49] | |
| ≥ 75 | 0.596 | 4.95 | 0.257 | — | 0.70 [0.55,0.84] | |
| Male | 1–4 | −0.111 | −0.24 | — | — | Non‐significant |
| 5–14 | −0.206 | −0.41 | — | — | Non‐significant | |
| 15–24 | 0.294 | 0.69 | — | — | Non‐significant | |
| 25–44 | 0.021 | 0.11 | — | — | Non‐significant | |
| 45–64 | 0.121 | 0.94 | 0.269 | — | Non‐significant | |
| 65–74 | 0.238 | 1.41 | 0.195 | 0.156 | Non‐significant | |
| ≥ 75 | 0.353 | 2.76 | 0.123 | 0.50 [0.37,0.64] |
CI: confidence interval.
Significant coefficients (alpha = 0.05) are shown in bold. Those with borderline significance are shown in italics.
Coefficient obtained in the Poisson autoregressive [Par(p)] model, when Rhos are shown, otherwise coefficient for log(time) based on a Poisson model.
The autocorrelation coefficient at lag p.
Based on incidence rate ratio (monthly change) based on Poisson model.
Statistically significant increasing trends in the incidence rates are noticed for the 25–44 and ≥ 75 age groups in the female population while a statistical increasing trend is only noticed in the ≥ 75 age group in the male population. For the female 45–64 and 65–74 age groups the increasing trend was borderline significant (z‐values of 1.78 and 1.93, respectively, where z > 1.96 indicates significance at the 0.05 alpha level, Table 20). The 65–74 and ≥ 75 male groups needed PAR(2) models indicating that the presence of autocorrelation (two lags) resulted in over dispersion, with a possible influence on the significance of the trend as a result. The time plot for these age groups also shows a tendency to stay high or stay low, with an increase that only starts in 2012, which is also indicative of positive autocorrelation.
The values in the last column in Table 20 are based on the monthly incidence rate ratios and estimated using a Poisson regression and are included for illustrative purposes. These indicate the increase expressed as a percentage, and can be interpreted as a proportional monthly increase, e.g. every month the incidence rate is augmented by 0.70% compared with the previous month for the female ≥ 75 group, while this is 0.50% for the males. Notice that the confidence intervals for the females ≥ 75 and males ≥ 75 overlap, indicating that the increase based on the Poisson model is not significantly different in the male group as compared with the female group.
A general conclusion is that some positive trends appear for the subgroups while this is not the case with the aggregated data. This is known as an ecological bias. Furthermore, the manifestation of, e.g. seasonality when aggregating temporal data, as seen in this study, has also been reported in other studies (Shellman, 2004).
3.5.3. Uncertainty analysis of the TSA
The sources of uncertainty in relation to assumptions and data for the TSA and the potential impact are shown in Table 21. The uncertainty related to the model fitting is quantitatively expressed using the CIs of the incidence rate changes. Apart from model fitting there are several additional uncertainty sources, which can lead to under‐ or overestimation of the observed trends.
Table 21.
Potential sources of uncertainty identified in the time series analysis and qualitative assessment of the impact that these uncertainties could have on the incidence rate outcome and on the incidence rate trend in the EU/EEA between 2008 and 2015
| Input/parameter/model structure | Source of uncertainty | How uncertainty has been addressed | Direction of the effect on the incidence−/+a | Direction of the effect on the incidence trend−/+a | |
|---|---|---|---|---|---|
| Data | Human invasive listeriosis data | Under‐ascertainment/under‐reporting | A survey was performed in the EU/EEA countries about changes in diagnostic practices and in their national surveillance systems | + | + |
| Classification of cases. Only laboratory‐confirmed cases were included in the analyses | Not addressed | − | −/+ | ||
| Incomplete data. One Member State reported only aggregated data and was not in the original data set (N = 46); three EU/EEA countries were excluded (N = 72); for some cases (N = 169) age, gender and/or month was unknown | Not addressed | −/+ | −/+ | ||
| Hypothesis/model | Model aggregated analysis | Model selection. The most appropriate model was used because other models did not include autocorrelation or seasonal correlation and did not fully capture the dynamics of changing trends | Other models, such as a change point were tried out, but did not result in a more appropriate model. Confidence intervals around the coefficients and incidence rate changes are indicative of uncertainty. The uncertainty may be overestimated and therefore more likely to not identify a trend than to identify a trend that is not there, given that the model used is relatively conservative. The choice not to distinguish outbreaks from other observations could have been investigated through models with several states but this was not tested. | Not applicable | − |
| No covariates are included in the aggregated model and homogeneity in group is assumed (same trend assumed in all Member States and comorbidity groups; uncertainty reduced by stratification by gender and age) | Country‐specific analyses were not conducted in this Scientific Opinion. Analyses by gender and age were conducted elsewhere in this Scientific Opinion | Not applicable | −/+ | ||
| Short time series for TSA (2008–2015) | Not addressed | Not applicable | −/+ | ||
| Influential data points (outbreaks included) | Not addressed | Not applicable | −/+ | ||
| Hypothesis/model | Model disaggregated analysis | See model aggregated analysis except for the covariates age and gender that are included | See model aggregated analysis except for the covariates age and gender that are included. The models are relatively conservative albeit less conservative than the model for the aggregated data since seasonality was not needed for analysing the disaggregated data | Not applicable | − |
| PAR(p) model may only approximate low order serial correlation in the data | Seasonal correlation was investigated but not present at the disaggregated data level | Not applicable | + |
N: number of cases; PAR(p): Poisson autoregressive model.
+ means that the (real) outcome/effect is possibly overestimated; − means that the (real) outcome/effect is possibly underestimated.
The aggregated L. monocytogenes time series from January 2008 to December 2015 is short. Indeed, as a rule of thumb a minimum of 60 observations for a TSA is advised, and in the current study 80 observations are available. More information may affect the trend. With respect to the aggregated data, the most appropriate (dynamic linear) model was used because other potential models do not include autocorrelation or seasonal correlation and do not fully capture the dynamics of changing trends and a change point analysis did not indicate the presence of a change point. The inclusion of all the latter model characteristics reduces the possibility to detect a possible trend. No covariates were included in the aggregated model and homogeneity in group was assumed, which may hide the presence of trends in subgroups. This was less the case in the disaggregated data analysis, in which some of the uncertainty issues that were observed for the aggregated data were also noticed. Due to the available data the analysis and understanding of trends were performed using age and gender as proxies for susceptible populations and not including countries as a covariate. This is a limitation and means that the observed trends may hide trends among subgroups or be true for only a subset of the age–gender–country population.
3.5.4. Conclusions of the TSA in the EU/EEA, 2008–2015
The TSA of the aggregated 2008–2015 confirmed listeriosis data did not show an increasing trend of invasive listeriosis incidence rates in the EU/EEA. This is partly a consequence of the presence of changing dynamics, autocorrelation and seasonality in the aggregated analysis, and an analysis capturing all these components. This is in contrast with analyses of data for certain age–gender groups which revealed trends and where some of the aforementioned characteristics were present to a lesser extent.
For females, the incidence rate of confirmed human invasive listeriosis significantly increased for the 25–44 and ≥ 75 age groups in this time period with a monthly increase estimated at 0.64% and 0.70%, respectively. For the female 45–64 and 65–74 age groups, the increasing trend was borderline significant with a monthly increase estimated at 0.43% and 0.30%, respectively.
For males, the incidence rate of confirmed human invasive listeriosis cases increased significantly for the ≥ 75 age group only with a monthly increase estimated at 0.50%.
Some differences between females and males in the increases of the incidence rates were noticed, e.g. for certain age groups, (borderline) increases were noted in some female groups and not in the male groups.
Based on a comparison of the incidence rate in 2008, a significantly higher invasive listeriosis incidence rate was noticed in males than females in the 45–64, 65–74 and ≥ 75 age groups, whereas the incidence rates were higher for females than males in the 25–44 age group. These differences remain similar by 2015, except that the difference in the 25–44 age group had increased significantly and that the incidence rates were higher for females than males in the 15–24 age group.
The highest incidence rate was seen in the ≥ 75 group resulting in 2015 in an incidence rate of 2.20 and 1.30 cases per month per million persons for the males and females, respectively.
The uncertainty related to the model fitting is quantitatively expressed using the CIs of the incidence changes. Apart from model fitting there are several additional uncertainty sources, which can lead to under‐ or overestimation of the observed trends. Due to the available data, the analysis and understanding of trends were performed using age and gender as proxies for susceptible populations and not including countries as a covariate. This is a limitation and means that the observed trends may hide trends among subgroups or be true for only a subset of the age–gender–country population.
3.6. Evaluation of factors that may explain the epidemiological trend of human listeriosis
As described in the methodology section (Section 2.2.3), potential factors that may explain the epidemiological trend were identified by the working group via a conceptual model and were evaluated as AQs in three steps. First, an importance analysis was used to evaluate the most important factors and their potential impact on the number of predicted cases using the gQMRA model (see Section 2.2.4). The second step was to evaluate the empirical evidence, i.e. the indicator data, to investigate the support for a change in the factor during the time period. In the third step, an evidence synthesis of the TSA, the importance analysis, indicator data and the uncertainty analyses were made. Based on the outcome of this evaluation conclusions were drawn, with uncertainties described, on the impact of the different factors on the human invasive listeriosis incidence rates.
The starting point for identifying the relevant factors was a simplified conceptual model for L. monocytogenes contamination in the food chain and for the reported incidence rates of human illness (Figure 19). It should be pointed out that the factors identified can act alone or in combination, and that the influence of some factors cannot be evaluated explicitly but are considered indirectly through their effects on prevalence and concentration at retail or the other factors in the model.
Figure 19.
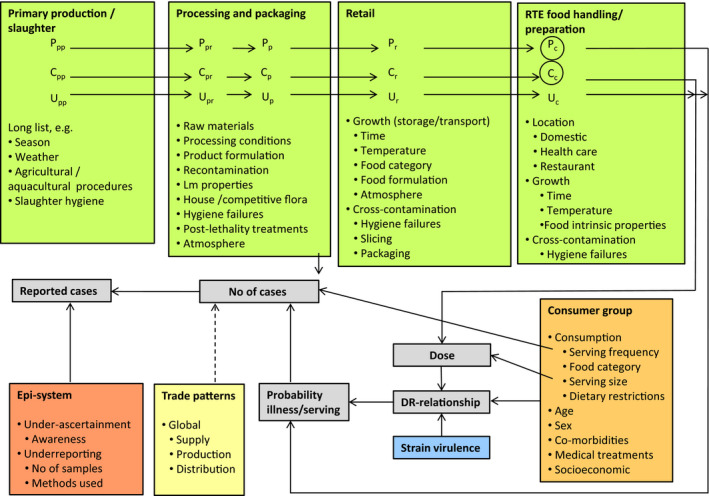
- C: concentration; Lm: Listeria monocytogenes; P: prevalence; U: food unit size, which may affect the distribution of Lm, i.e. P, and C, considerably. The subscript for C, P and U refers to the production stage.
Contamination levels and prevalence of L. monocytogenes in RTE foods at different stages in the food chain and related influencing factors and processes are shown in green boxes. For instance, growth rates depend both on intrinsic properties of the food such as the formulation of the RTE food, and on extrinsic factors such as storage temperature. Prevalence and concentration might change when the size of the food unit (U) is changing, along the different steps of the food chain (e.g. Nauta (2002)). The properties and type of the RTE food and the consumption habits of the individuals in the consumer group of interest (orange box) influence the ingested dose and the relevant DR relationship (grey boxes). The DR model is dependent on the population group considered and it is assumed that, for example, medical treatments and the virulence of L. monocytogenes strains (blue box) may affect the vulnerability of the consumer and lead to an adjustment of the DR model. Furthermore, the number of cases is a function of the probability of illness per serving and the number of servings consumed by the individuals in the consumer group, i.e. a function of the serving frequency. The number and distribution of cases may also be different if the pattern of trade of ingredients and/or the final product are global, regional or local (yellow box). Finally, the influence of the national surveillance system (Figure 19, red box) is reflected in the reported number of cases which may be less than those actually occurring, dependent on under‐ascertainment and under‐reporting. Under‐ascertainment refers to symptomatic cases not contacting health services, whereas under‐reporting refers to known infected individuals whose disease status is misdiagnosed or fails to be reported to the organisation responsible for surveillance (van Lier et al., 2016).
To be able to unambiguously evaluate the different factors a general assessment question was formulated as: ‘What contribution (= impact) did any change in factor x make to the change of cases/incidence rates of human invasive listeriosis in the EU and EEA in the time period 2008–2015?’
3.6.1. Listeria monocytogenes generic QMRA (gQMRA) model: baseline
In order to test the possible implication of certain factors to the increase of human invasive listeriosis cases and incidence rates after 2011, a baseline gQMRA model was run with the prevalence and initial concentration of L. monocytogenes in RTE foods and the consumption pattern assumed to represent the situation during the period 2010–2011. The baseline gQMRA model considers option 3 for the initial concentration of L. monocytogenes in RTE foods. The outputs are presented in Table 22. The L. monocytogenes prevalence in the first column was calculated by weighting the prevalence observed in the different RTE food categories by their consumption in each population group; therefore, providing an average prevalence across all food categories for each population group. Consequently, the differences in prevalence between the groups are due to the different consumption patterns; the estimated prevalence is higher in the age group ≥ 75 years old. The total number of cases per year estimated by the model is 1,523, and this is as expected as the DR model is calibrated to the epidemiological data, close to the average reported number of cases in 2008–2011, i.e. 1,521 cases.
Table 22.
Output of the baseline gQMRA model for the subpopulations included in the time series analyses
| Population group (gender and age in years) | Prevalence a | Total number of eating occasions per year(A) | Risk per eating occasion(B) | Cases per year (A × B) |
|---|---|---|---|---|
| Female 1–4 | 0.03516 | 2.90E+09 | 1.73E‐09 | 5 |
| Male 1–4 | 0.03647 | 3.07E+09 | 2.37E‐09 | 7 |
| Female 5–14 | 0.02567 | 6.64E+09 | 8.29E‐10 | 5 |
| Male 5–14 | 0.02578 | 7.58E+09 | 7.62E‐10 | 6 |
| Female 15–24 | 0.02806 | 6.27E+09 | 3.86E‐09 | 24 |
| Male 15–24 | 0.02466 | 8.74E+09 | 9.39E‐10 | 8 |
| Female 25–44 | 0.02503 | 1.81E+10 | 6.49E‐09 | 117 |
| Male 25–44 | 0.02526 | 2.50E+10 | 1.72E‐09 | 43 |
| Female 45–64 | 0.02768 | 2.02E+10 | 6.60E‐09 | 134 |
| Male 45–64 | 0.02739 | 2.68E+10 | 8.65E‐09 | 232 |
| Female 65–74 | 0.03371 | 8.98E+09 | 1.65E‐08 | 148 |
| Male 65–74 | 0.0332 | 9.75E+09 | 2.40E‐08 | 234 |
| Female ≥ 75 | 0.04045 | 1.01E+10 | 2.58E‐08 | 260 |
| Male ≥ 75 | 0.04286 | 9.06E+09 | 3.31E‐08 | 300 |
For the initial concentration of L. monocytogenes in the RTE foods, fish distributions from BLS data, and meat and cheese distributions from US data were used (option 3). One million iterations were used.
The L. monocytogenes prevalence was calculated by weighting the prevalence observed in the 13 RTE food subcategories/packaging conditions by their consumption in each population group.
Table 23 summarises the distributions of concentration at retail level and at time of consumption. The frequency of a contaminated food having a concentration higher than 5 log10 CFU/g, after two million iterations, increases during storage by overall less than 1% of a unit.
Table 23.
Probabilities of exceeding certain L. monocytogenes concentrations in ready‐to‐eat (RTE) food categories at retail level (initial) and at time of consumption estimated using the gQMRA model
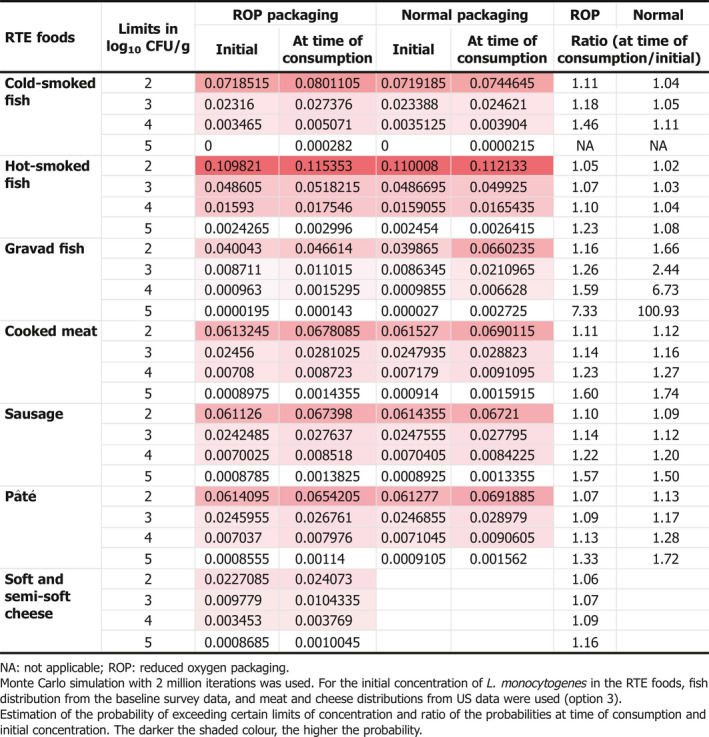
Combining the consumption patterns for different food categories the distribution of exposure doses is derived for each subpopulation. When eating a contaminated food, the probability of being exposed to a dose higher than 5 log10 CFU varies between 1.34% and 2.06%. Considering the overall prevalence of contaminated RTE food categories, the probability of exceeding an exposure dose of 5 log10 CFU is between 0.042% and 0.078%.
The overall impact of growth on the risk of human invasive listeriosis was assessed by comparing the baseline expected number of cases with a scenario where growth was excluded. The expected number of cases in the absence of growth is presented in Figure 20. Without growth, the total number of cases (sum of the cases per subpopulation) was reduced from 1,523 (Table 22) to 953 (Figure 20) showing that absence of growth from retail onwards may prevent, on average, 570 cases (37%, 570/1,523). The observed growth depends mainly on the temperature and duration of storage after retail. In case of option 1 (i.e. the use of data observed at the end of the shelf life), the initial concentration distribution will allow for more food with high concentration before storage. In one hand, this fact will probably reduce the impact of storage on the number of cases. On the other hand, starting with higher concentrations will lead to higher concentrations at the time of consumption ‐under the same storage conditions‐ and so this will probably increase the impact of storage on the number of cases. When running the model with the other options, the same order in the percentage of cases attributable to the storage conditions are obtained (data not shown).
Figure 20.
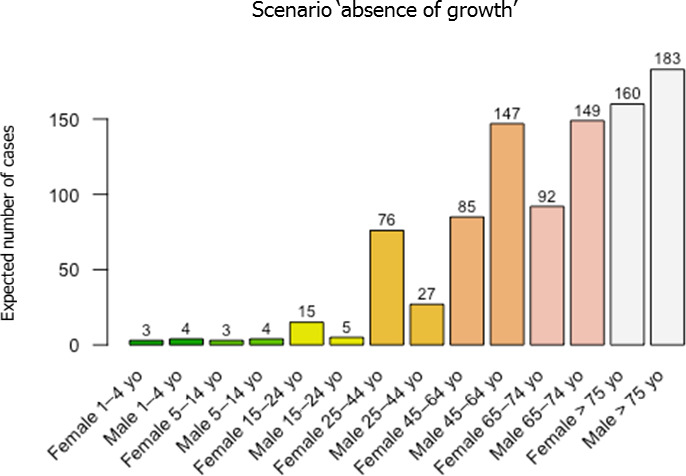
Expected number of human invasive listeriosis cases per subpopulation and per year in the EU/EEA (1 million iterations) with a scenario ‘absence of growth’
The DR model was applied to calculate the risk per serving for each subpopulation and the cumulative risk attribution was calculated for each possible dose of exposure. The cumulative attribution risk for a specific dose (x) is the proportion of human invasive listeriosis cases attributable to doses lower than or equal to x. The doses lower than or equal to 5 log10 CFU could be responsible for 4.08–7.22% of the total cases, meaning that 92.78–95.02% of cases are attributable to exposures with a dose higher than 5 log10 CFU (Figure 21). Considering this result, the total number of human invasive listeriosis cases would be very sensitive to the fraction of exposure with high doses (> 5 log10 CFU) which corresponds to an average concentration > 3.3 log10 CFU/g (when considering an average serving size of 50 g).
Figure 21.
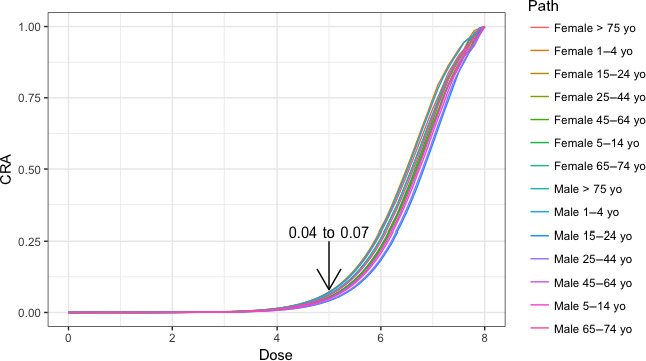
- The cumulative attribution risk for a specific dose (x) is the proportion of human invasive listeriosis cases attributable to doses lower or equal to x.
3.6.2. gQMRA model: importance analysis
The factors evaluated had a similar impact on the outcome for the different subpopulations. The risk change is presented in Figure 22 as a multiplication factor relative to the baseline model.
Figure 22.
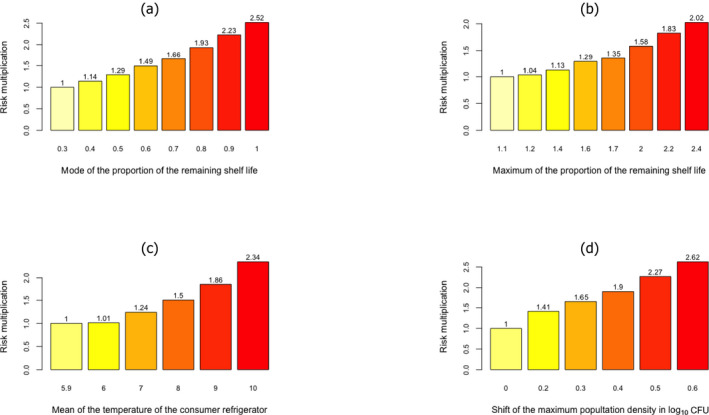
Increase in risk of human invasive listeriosis as a function of (a) the mode of the proportion of the remaining shelf life used to store ready‐to‐eat (RTE) food in the consumer refrigerator (using simulations with a maximum proportion equal to 1.1); (b) the maximum of the proportion of remaining shelf life time used to store RTE food in the consumer refrigerator (using simulations with a mode of the proportion equal to 0.3); (c) the mean of the mean temperature of the consumer refrigerator; (d) the maximum population density shift
For a doubling in risk due to the most common time of consumption, the mode of the proportion of the remaining shelf life is investigated. It is concluded that the timing of consumption needs to be shifted by 0.5 to around 0.8 instead of the baseline of 0.3 (Figure 22a). To increase the risk by a factor of 2 (Figure 22b), the maximum increase of the invasive listeriosis incidence rates observed in the TSA, consumers need to consider the maximum acceptable remaining shelf lives of RTE products to be 2.4 times the recommended instead of the 1.1 times as assumed in the baseline scenario. This is under the assumption that the most common time of consumption still occurs at a time point corresponding to 0.3 of remaining time of the recommended shelf life. Similarly, a maximum remaining shelf life of 1.4 would increase the incidence rate by a factor of 1.13 (Figure 22b).
The effect of the mean storage temperature (which influences growth) on the risk of invasive listeriosis is perhaps less than expected (Figure 22c). A doubling in incidence rate results when the mean storage temperature increases from 5.9°C in the baseline scenario to between 9 and 10°C.
The gQMRA model output was very sensitive to a shift in the L. monocytogenes maximum population density. A shift of less than 0.5 log10 CFU/g would result in a doubling of the risk (Figure 22d). Even a small shift of 0.2 log10 CFU/g resulted in an increase of risk by a factor of 1.4 (Figure 22d). An increase in this parameter could also be interpreted as a shift of non‐compliant samples to higher concentrations.
3.6.3. Indicator data
Prevalence
EFSA monitoring data
The monitoring data have several limitations for the purpose of evaluating any changes in prevalence of L. monocytogenes in RTE foods. As described in Sections 2.1.2 and 3.3.2, these data are evaluated in accordance with the L. monocytogenes microbiological criteria applying certain assumptions that have been spelled out in the latest EU summary report (EFSA and ECDC (2015)). Boelaert et al. (2016) stated that ‘In essence, food chain control data are compliance checks and are collected with the aim to install an early warning and initiate control measures. Although they can be used for trend watching (which covers general observations of harmonised or non‐harmonised data for possible trends), these data are unsuitable for trends analyses, because a reference (study) population is mostly absent and because the sampling is risk‐based and thus, non‐representative.’
For some subcategories, the results presented in Figure 11 represent a substantial number of samples, e.g. at processing in 2014, a total 40,853 samples of RTE products of meat origin other than fermented sausage were reported, and at retail in 2008 for the same category 16,653 samples were reported. Still, the results are sensitive to the type of samples, the sampling schemes and the number of Member States reporting in a single year. At the low prevalence reported (a few per cent or even below 1 per cent) a large number of samples is needed to make it possible to draw conclusions about any differences between years and subcategories. Thus, the data may at best indicate the magnitudes of the prevalence in the food subcategories during the time period but it should be pointed out that the results between years is sensitive to the amount of sampling, the Member State reporting and varying sampling strategies over years even within a Member State. Another issue is that the available data relate to compliance of products with the microbiological criterion, which is the absence at 25 g at processing and 100 CFU/g at retail. As such, prevalence is potentially directly linked to non‐compliant products at the processing stage, whereas at retail, prevalence is expected to be higher than the non‐compliance. For these reasons, supporting evidence for a trend in prevalence cannot be concluded for samples taken at retail. At processing, the same limitations mentioned above apply but some observations can be made. The L. monocytogenes non‐compliance in fishery products from 2013 to 2015 appears lower than that from 2008 to 2012. Similarly, non‐compliance in meat products other than sausages from 2010 onwards appears lower than during the preceding years. For the other subcategories incomplete data and variable percentages of non‐compliance over the years are observed (i.e. sausages and dairy products).
In conclusion, based on the monitoring data on percentages of non‐compliant food items there is no evidence to suggest an increase of the prevalence or non‐compliance of L. monocytogenes in RTE foods over time. The uncertainty of this conclusion is high due to the limitations associated with the data for the purpose of evaluating prevalence changes.
Literature data
Figure 23 shows the trend of prevalence with time for the period of conducting the studies presented in the extracted literature reports, for the three major RTE food categories.
Figure 23.
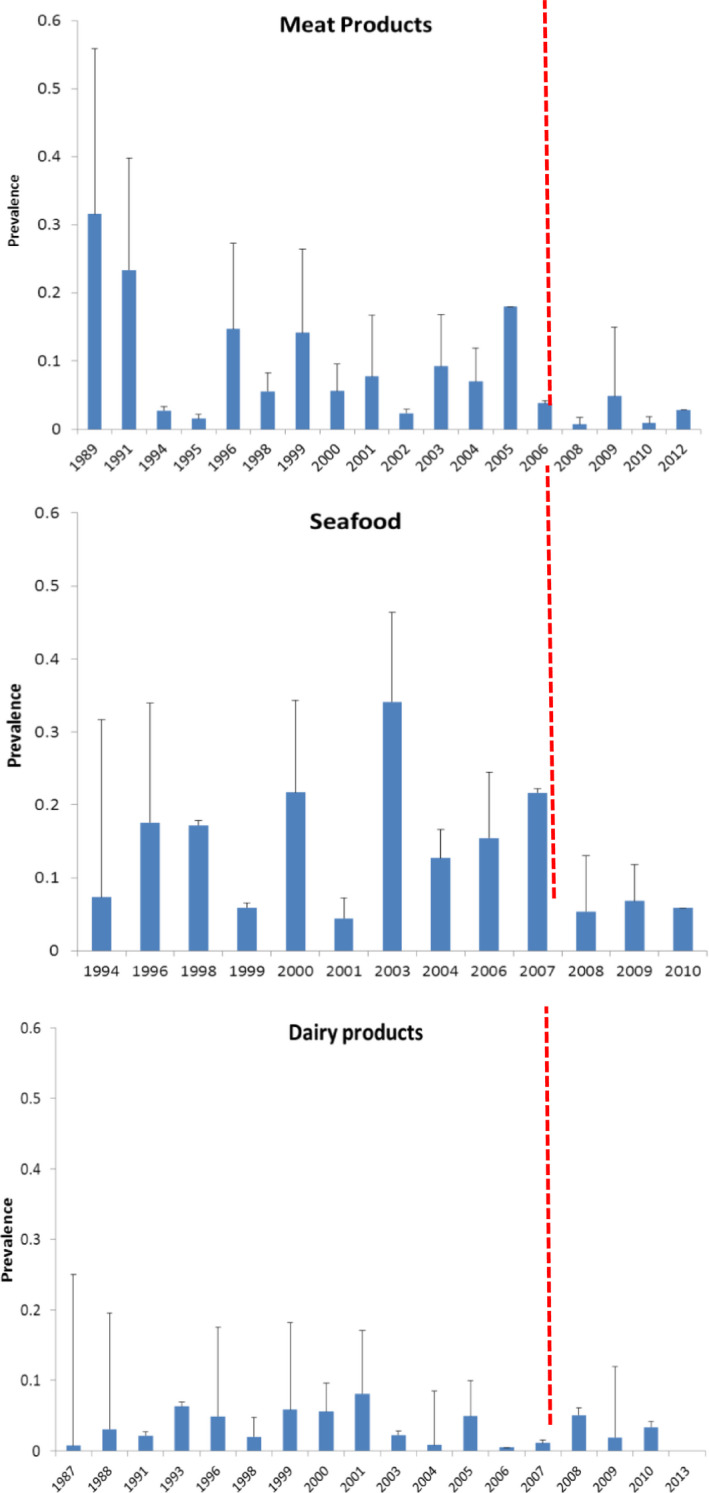
- Red vertical line shows the beginning of the targeted period of concern for the present Scientific Opinion extending from 2008 onwards. This period is also characterised by scarcity of data.
The suitability of the data to evaluate trends is unclear and the observed prevalence varies over time in all food categories. The data do not support an increase in prevalence of L. monocytogenes in the three RTE food categories during the 2008–2015 time period but the uncertainty of the conclusion is high due to the limitations associated with the data.
Concentration
The RASFF data were further analysed in relation to the year of reporting. Figure 24 presents a summary trend graph showing the change in the average value and the variability of the L. monocytogenes concentration for ‘fish and fish products’. The highest average concentrations (3.01 log10 CFU/g) were reported in 2008. Notifications during 2014 showed the lowest average concentration (2.17 log10 CFU/g). The highest maximum concentrations were reported for defrosted smoked salmon (5.32 log10 CFU/g, 2011), mackerel fillets with pepper (5.04 log10 CFU/g, 2009), chilled salmon (4.93 log10 CFU/g, 2014), skinned juniper‐smoked trout fillets (4.64 log10 CFU/g, 2008) and smoked salmon (4.60 log10 CFU/g, 2010).
Figure 24.
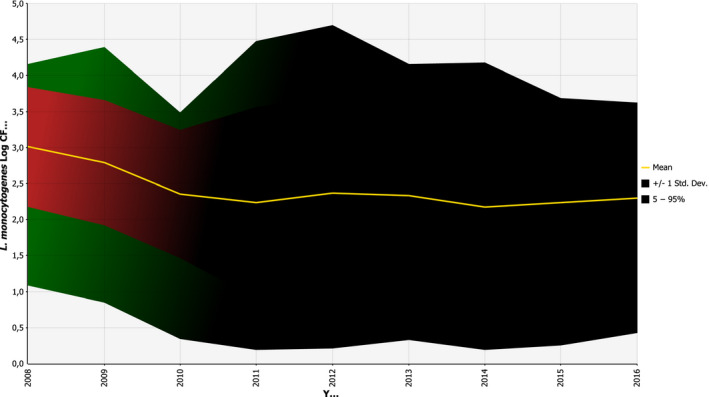
Summary trend graph for Listeria monocytogenes concentration in ‘fish and fish products’ reported in RASFF notifications for the years 2008–2016
The summary trend graph showing the change in the average value and the variability of the L. monocytogenes concentration in ‘meat and meat products other than poultry’ is presented in Figure 25. The highest average concentrations (2.74 log10 CFU/g) were reported in 2011. Notifications during the year 2013 showed the lowest average concentration (1.21 log10 CFU/g). The highest maximum concentrations were reported for smoked bacon (4.75 log10 CFU/g, 2012), salami (4.49 log10 CFU/g, 2011), chilled beef stew (4.18 log10 CFU/g, 2016), cream pâté (4.18 log10 CFU/g, 2011) and black pudding sausage (4.16 log10 CFU/g, 2010).
Figure 25.
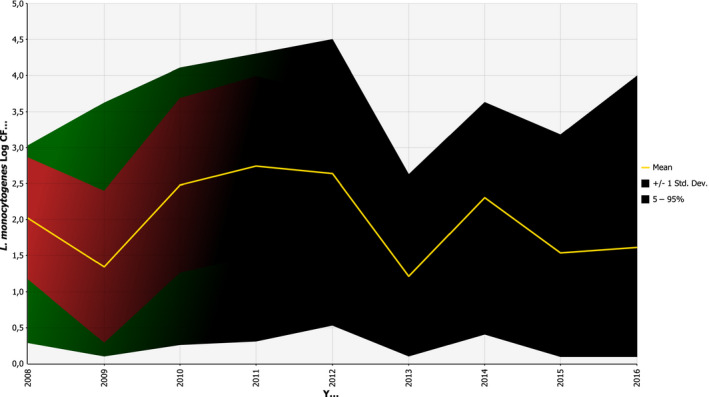
Summary trend graph for Listeria monocytogenes concentration in ‘meat and meat products other than poultry’ reported in RASFF notifications for the years 2008–2016
The summary trend graph of L. monocytogenes concentration for ‘milk and milk products’ is presented in Figure 26. The highest average concentrations (3.13 log10 CFU/g) were reported in 2008. Notifications during 2013 showed the lowest average concentration (1.23 log10 CFU/g). The highest maximum concentrations were reported for chilled gorgonzola (6.26 log10 CFU/g, 2015), raw buffalo milk cheese (5.87 log10 CFU/g, 2008), raw milk cheese (5.30 log10 CFU/g, 2013), gorgonzola cheese (5.28 log10 CFU/g, 2014) and cheese (5.15 log10 CFU/g, 2014).
Figure 26.
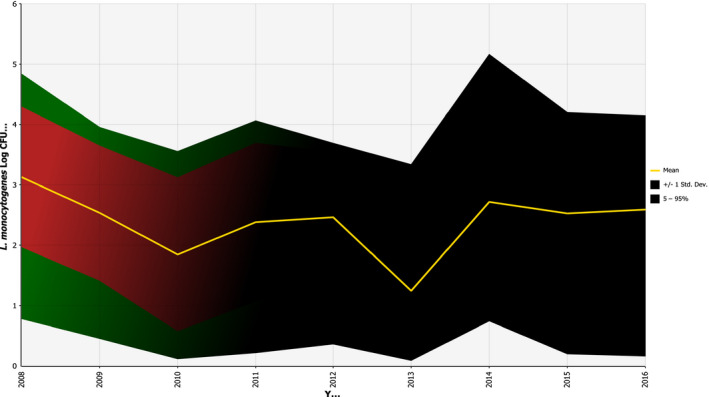
Summary trend graph for Listeria monocytogenes concentration in ‘milk and milk products’ reported in RASFF notifications for the years 2008–2016
In conclusion, among foods involved in RASFF notifications, high L. monocytogenes concentrations can be found in the RTE food categories such as ‘fish and fish products’, ‘meat and meat products other than poultry’ and ‘milk and milk products’. There is no obvious trend over the period 2008–2016. It should be noted that the variability in concentration is high while the uncertainty related to the fact the RASSF data are not based on a systematic sampling procedure should be taken into account.
Consumption
EFSA consumption database
The change in the number of servings per year for the age group over 65 years old was estimated based on the available data in four northern European countries. To make the comparison of any changes over time easier to observe, the difference between means is shown in Appendix G.
Overall, there is some support for an increase in terms of the number of servings of RTE foods but the pattern is different for the different countries. For instance, Denmark has an increase in the number of servings for most food categories for both genders, whereas there is weak support for this in the Netherlands. The time interval between the two surveys is longest for the Swedish data and for some food categories the results are based on few consumption events. Cooked meat and soft and semi‐soft cheese (both genders) and smoked fish (males) indicate an increase in several countries.
A recently published French study, INCA 3 (Anses, 2017), reported on changes in consumption and food safety behaviours based on interviews conducted in 2014–2015 compared to a previous study carried out in 2006–2007. The study showed more frequent consumption of raw foods of animal origin (mainly fish and beef), longer storage times before consumption of perishable foodstuffs, and more frequent exceedance of use‐by dates.
In conclusion, there is some support for an increase in the number of servings for some food categories (cooked meat, soft and semi‐soft cheese) as well as decreases in others, but it is not possible to draw any general conclusions due to the few countries involved and other limitations of the data.
Food and Agriculture Organization data
In order to get a rough estimate of the possible smoked salmon consumption in the EU for a recent period (2003–2013), FAO data were accessed, through the application FishstatJ and the workspace FAO Fishery and Aquaculture Statistics, (v.2016.1.2) – data set: ‘Global commodities production and trade’ (date: 26/02/2016) – Commodity: ‘Salmons, smoked’ (FAO, 2016).26 Three trade flows, i.e. production, import and export data (weights in tonnes) were obtained for EU countries for the years 2003–2013 (production data were not available for all countries). Subsequently, a calculation was made in which production and import weights were added for each year and country and export weights were subtracted from this sum. When any of the three trade flows variables were generally available for a country, but missing for some years, all data for that combination of country and year were removed from the calculation. Also, sometimes the outcome of the above calculation was a negative number. In those cases, this outcome was substituted by zero. This was the case for some years for several countries and for all the years for Lithuania and Poland. Some additional assumptions were made for the calculations of the overall numbers, for example, values reported as over zero but less than half a tonne were substituted by zero, while data that were reported as having been estimated by FAO were used in the same way as the rest of the reported data. For more insights on the data used and more specific assumptions as well as definitions, methodologies and disclaimers concerning the FAO data sets, the reader is referred to the original FAO source.
This result, which can be viewed as a proxy for consumption (in tonnes) was added for all EU countries (26 countries included, while Lithuania and Poland were excluded, as explained above) for each year of the above‐mentioned time period, and it showed an increasing tendency from year to year. Indeed, the overall sums (in tonnes) were: 2003: 80,354; 2004: 78,648; 2005: 86,781; 2006: 91,884; 2007: 102,238; 2008: 105,396; 2009: 117,891; 2010: 120,408; 2011: 133,995; 2012: 145,636; 2013: 149,232.
In conclusion, there is an indication that the proxy for consumption of smoked salmon has increased by more than 40% during the 2008–2013 period. Any conclusions that could be drawn from this exercise would be characterised by high uncertainty, since they would be based on only a proxy measure that only utilises data until 2013 and that only concerns smoked salmon.
Surveillance
The EU‐level surveillance of invasive human listeriosis was established in 2008 and since then countries have aimed to improve their national surveillance systems. A short consultation of the FWD‐Net contact points among those countries that are included in the EU‐wide TSAs revealed that nine countries had improved their national reporting systems either slightly (N = 5) or moderately (N = 4), whereas eight countries replied to the question with ‘not at all.’
Two countries with a relatively high level of case reporting have improved their national surveillance systems to the extent that it may have influenced the overall increase. Germany reported a change in the case definition to a more sensitive one and an increase in the reimbursements for diagnostic tests by the insurance companies. Spain has improved the partial surveillance coverage (i.e. more regions reporting human listeriosis) from 25% in 2009–2012 to 30% in 2013 and 45% in 2014–2015 (EFSA and ECDC, 2016). In Germany, the cases increased from 2008 to 2015 by 90% and in Spain the increase was 134% (Appendix D). Based on the survey in countries, the network coverage increased in Belgium from 50% in 2008 to 75% in 2015, which may have contributed to the observed increase of cases by 30% (from 64 to 83) in Belgium during the study period.
Thirteen countries (42%) responded to the questionnaire targeted to microbiologists. In 2008–2015, the indication of testing for L. monocytogenes has not changed for pregnant women (N = 8) and other patients (N = 10) (remaining five and three replies respectively were ‘don't know’). Eight countries replied that the diagnostic methods have changed ‘slightly’ (N = 3), ‘moderately’ (N = 3), or ‘very much’ (N = 2). Five countries have introduced PCR‐based detection of L. monocytogenes in liquor and blood while MALDI‐TOF has been adopted by clinical microbiologists in three countries.
To conclude, there have been some changes in the surveillance systems, in particular for some countries with a relatively high level of reporting, which may have contributed to the increasing trend in confirmed invasive listeriosis cases in the EU/EEA. There are some changes in the diagnostic methods but they are not expected to have contributed to the trend.
Virulence/pathogenicity/serogroups
The new insights into the relation between clonal complexes and virulence, and new sequencing data may allow the hypothesis of a shift to more virulent and/or pathogenic L. monocytogenes strains to be thoroughly addressed but these data were not yet available. As a proxy, data on CFRs and serogroups over the time period were used. If cases under 1 year old are excluded, CFRs increase by age and this is detected in almost every year for age groups over 45 years for both sexes. In some years, however, the age group 45–64 years may show higher CFR values than those over 65 years, indicating the potential impact of underlying conditions (Tables 24 and 25). The human data from The European Surveillance System indicated that infection with serogroup IVb among middle‐aged and elderly people increased the likelihood of a fatal outcome (Table 10). However, although variable, there is no apparent increase in the CFRs in these age–gender groups over the time period (Tables 24 and 25), even though the number of serogroup IVb cases reported also appeared to increase (Figure 27). The data in this figure are based on reporting in the four Member States with stable reporting of serotypes/serogroups over time, and also show an apparent increase in the number of reported serogroup IIa cases from 2008 to 2015. These four Member States account for about 33% of all reported cases during this time period. The proportion of isolates in these countries serotyped during the period varied between 30 and 50% but was similar at the beginning and the end of the period.
Table 24.
Confirmed female invasive listeriosis cases and case fatality rates by age group and year in the EU/EEA, 2008–2015
| Age group (years) | 2008 | 2009 | 2010 | 2011 | 2012 | 2013 | 2014 | 2015 | ||||||||
|---|---|---|---|---|---|---|---|---|---|---|---|---|---|---|---|---|
| N | CFR(%) | N | CFR(%) | N | CFR(%) | N | CFR(%) | N | CFR(%) | N | CFR | N | CFR(%) | N | CFR(%) | |
| < 1 | 20 | 20.0 | 19 | 5.3 | 29 | 6.9 | 24 | 12.5 | 27 | 14.8 | 35 | 5.7 | 43 | 14.0 | 29 | 13.8 |
| 1–20 | 5 | 0.0 | 3 | 0.0 | 8 | 0.0 | 15 | 13.3 | 10 | 10.0 | 15 | 13.3 | 14 | 0.0 | 15 | 6.7 |
| 21–44 | 52 | 0.0 | 63 | 4.8 | 68 | 5.9 | 79 | 3.8 | 69 | 7.2 | 67 | 1.5 | 88 | 1.1 | 106 | 2.8 |
| 45–64 | 63 | 20.6 | 64 | 14.1 | 87 | 14.9 | 83 | 13.3 | 105 | 14.3 | 92 | 13.0 | 97 | 14.4 | 126 | 23.8 |
| 65–74 | 72 | 20.8 | 60 | 25.0 | 104 | 10.6 | 86 | 23.3 | 107 | 19.6 | 115 | 17.4 | 110 | 20.0 | 127 | 18.1 |
| ≥ 75 | 92 | 26.1 | 133 | 18.8 | 154 | 22.7 | 158 | 17.1 | 176 | 26.7 | 202 | 21.3 | 237 | 21.1 | 284 | 26.1 |
| Total | 304 | 18.4 | 342 | 15.5 | 450 | 14.4 | 445 | 14.8 | 494 | 20.5 | 526 | 15.2 | 589 | 15.8 | 687 | 14.4 |
CFR: case fatality rate; N: number of confirmed cases.
Source: Data from The European Surveillance System – TESSy, provided by Austria, Belgium, Croatia, Cyprus, the Czech Republic, Estonia, France, Germany, Greece, Hungary, Ireland, Latvia, Lithuania, Malta, the Netherlands, Norway, Poland, Portugal, Romania, Slovakia, Slovenia, Spain, the United Kingdom and released by ECDC.
Table 25.
Confirmed male invasive listeriosis cases and case fatality rates by age group and year in the EU/EEA, 2008–2015
| Age group (years) | 2008 | 2009 | 2010 | 2011 | 2012 | 2013 | 2014 | 2015 | ||||||||
|---|---|---|---|---|---|---|---|---|---|---|---|---|---|---|---|---|
| N | CFR(%) | N | CFR(%) | N | CFR(%) | N | CFR(%) | N | CFR(%) | N | CFR(%) | N | CFR(%) | N | CFR(%) | |
| < 1 | 23 | 13.0 | 27 | 3.7 | 42 | 19.0 | 25 | 8.0 | 28 | 21.4 | 15 | 13.3 | 26 | 15.4 | 27 | 7.4 |
| 1–20 | 5 | 0.0 | 5 | 20.0 | 8 | 12.5 | 7 | 0.0 | 7 | 14.3 | 8 | 0.0 | 7 | 0.0 | 7 | 14.3 |
| 21–44 | 25 | 20.0 | 18 | 11.1 | 32 | 12.5 | 23 | 17.4 | 31 | 6.5 | 27 | 11.1 | 38 | 7.9 | 35 | 14.3 |
| 45–64 | 106 | 19.8 | 122 | 22.1 | 144 | 21.5 | 142 | 13.4 | 167 | 16.8 | 166 | 18.7 | 207 | 15.9 | 189 | 13.8 |
| 65–74 | 113 | 23.0 | 140 | 16.4 | 169 | 16.0 | 143 | 9.8 | 148 | 16.9 | 172 | 15.7 | 199 | 14.1 | 218 | 16.1 |
| ≥ 75 | 110 | 22.7 | 131 | 18.3 | 228 | 16.7 | 194 | 19.1 | 206 | 24.8 | 247 | 17.8 | 305 | 19.7 | 291 | 23.7 |
| Total | 382 | 20.9 | 443 | 17.6 | 623 | 17.5 | 536 | 14.2 | 587 | 19.3 | 635 | 16.9 | 782 | 16.4 | 767 | 17.5 |
CFR: case fatality rate; N: number of confirmed cases.
Source: Data from The European Surveillance System – TESSy, provided by Austria, Belgium, Croatia, Cyprus, the Czech Republic, Estonia, France, Germany, Greece, Hungary, Ireland, Latvia, Lithuania, Malta, the Netherlands, Norway, Poland, Portugal, Romania, Slovakia, Slovenia, Spain, the United Kingdom and released by ECDC.
Figure 27.
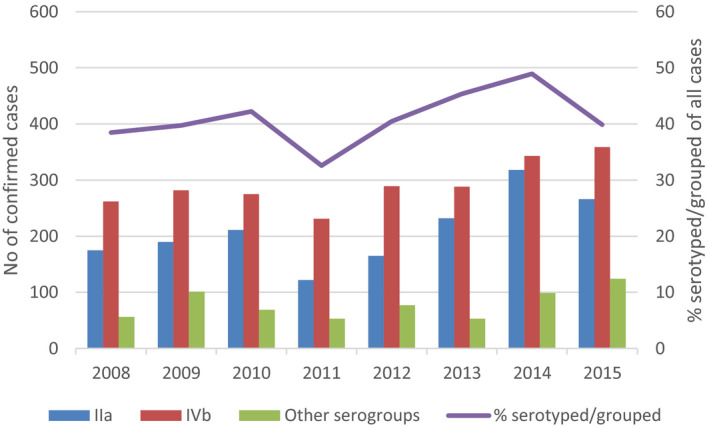
- Source: Data from The European Surveillance System – TESSy, provided by Austria, France, Germany, the United Kingdom, and released by ECDC (N = 4,640).
In summary, it is not possible to conclude whether virulence/pathogenicity has changed over the time period due to the limitations of the available data. CFRs appear not to have increased, whereas the number of cases with serogroups IIa and IVb may have increased over the time period. Only serogroups have been considered above. Typing of L. monocytogenes isolates is now in the transition phase from traditional methods (e.g. pulsed field gel electrophoresis, conventional/PCR‐based serotyping) to sequencing (e.g. WGS) and these data are currently not available across the EU.
Susceptible population
Table 26 shows the demographic changes in the EU/EEA over the time period 2009–2015. There were 514 million inhabitants in the EU/EEA in 2009; 522 million in 2015. This increase results from the increase in the elderly population (≥ 65 years old) as the younger age group (< 65 years old) has declined. In this time span, for example, the population over 75 years old has increased from 41.6 million (or 8.1% of the population) to 47.1 million (or 9.0% of the population).
Table 26.
Evolution of the population in the EU/EEA over time, 2009–2015
| Totala | Year | ||||||
|---|---|---|---|---|---|---|---|
| 2009 | 2010 | 2011 | 2012 | 2013 | 2014 | 2015 | |
| 514,946 | 516,168 | 516,110 | 517,357 | 518,616 | 520,554 | 522,221 | |
| < 75 yoa | 473,319 | 473,678 | 472,860 | 473,199 | 473,568 | 474,502 | 475,131 |
| ≥ 75 yoa (%)b | 41,628(8.1%) | 42,490(8.2%) | 43,250(8.4%) | 44,158(8.5%) | 45,048(8.7%) | 46,053(8.8%) | 47,090(9.0%) |
| 25–44 yo womena (%)b | 73,116(14.2%) | 72,509(14.0%) | 71,828(13.9%) | 71,330(13.8%) | 70,778(13.6%) | 70,378(13.5%) | 69,941(13.4%) |
| Number of live births a (ratec) | 5,558(10.8) | 5,558(10.8) | 5,412(10.5) | 5,378(10.4) | 5,221(10.1) | 5,280(10.1) | 5,239(10.0) |
| Diabetesa , d (%)b | NA | NA | 43,626(8.45%) | NA | 46,839(9.03%) | NA | 47,336(9.06%) |
| Diabetesd in < 75 yoa (preve) | NA | NA | 34,578(7.31%) | NA | 36,230(7.65%) | NA | 37,083(7.80%) |
| Diabetesd in ≥ 75 yoa (prev)f | NA | NA | 9,047(20.92%) | NA | 10,608(23.55%) | NA | 10,253(21.77%) |
| Cancer (death rate)g | 268.6 | 267.3 | 265.1 | 261.5 | |||
| Ischaemic heart diseases (death rate)g | 84.91 | 84.32 | 81.79 | 79.65 | |||
| Chronic liver diseases (death rate)g | 15.68 | 15.35 | 14.71 | 14.3 | |||
| Healthy life yearsh at 65 yo for females | NA | 8.8 | 8.6 | 8.5 | 8.6 | 8.6 | NA |
| Healthy life yearsh at 65 yo for males | NA | 8.7 | 8.5 | 8.5 | 8.5 | 8.6 | NA |
| Life expectancy at 65 yo for females | 20.8 | 21.0 | 21.3 | 21.1 | 21.3 | 21.6 | 21.2 |
| Life expectancy at 65 yo for males | 17.3 | 17.5 | 17.7 | 17.7 | 17.9 | 18.2 | 17.9 |
NA: not available; yo: years old.
Number of persons in thousand.
Percentage of the total population.
Crude birth rate, i.e. the ratio of the number of live births during the year to the average population in that year and expressed per 1,000 inhabitants.
Type‐2 only.
Prevalence in < 75 yo group.
Prevalence in ≥ 75 yo group.
Standardised death rate by 100,000 inhabitants (death rate of a population adjusted to a standard age distribution (from http://ec.europa.eu/eurostat/tgm/table.do?tab=table&init=1&language=en&pcode=tps00116&plugin=1)
The indicator ‘healthy life years’ at age 65 measures the number of years that a person at age 65 is still expected to live in a healthy condition.
The EU is also experiencing historically low fertility rates, below the natural replacement level (an average of 2.1 children per woman in developed world economies). With fewer children being born, the relative share of young people in the EU's population has decreased. The women in the age group 25–44 years old in the EU/EEA decreased from 73 million in 2009 to 69 million in 2015. During this period, the number of live births in the EU/EEA also declined from 5.5 to 5.2 million in the EU/EEA. The crude birth rate is the ratio of the number of live births during the year to the average population in that year and expressed per 1,000 inhabitants. The EU/EEA crude birth rate declined from 10.8 per 1,000 inhabitants in 2009 to 10.0 per 1,000 inhabitants in 2015.
There were only few comparable data available over time of the number of persons with underlying conditions in the EU/EEA. The percentage of persons with type 2 diabetes increased slightly during the 2011–2015 period, from 7.3% to 7.8% in the younger age group (< 75 years old) and from 20.9% to 21.8% in the elderly population (≥ 75 years old). Similarly, death rates for several serious conditions have also decreased, e.g. cancer, ischaemic heart disease, chronic liver diseases, which suggest that the proportion of people living with an underlying condition may have increased (Table 26).
The gender/age‐specific prevalence (in percentage) of neoplasm (a), HIV/AIDS (b), cirrhosis and other chronic liver diseases (c), and chronic kidney disease (d), in western Europe, 1990–2015 for specific age–gender groups is presented in Figure 28. Cancer incidence is generally greater in males than in females and the incidence increases with age. This would suggest that the increase in the proportion of older people would also contribute to an increase in susceptibility. Furthermore, for neoplasm, HIV/AIDS and cirrhosis and other chronic liver diseases, the prevalence has increased during the time period 2008–2015.
Figure 28.
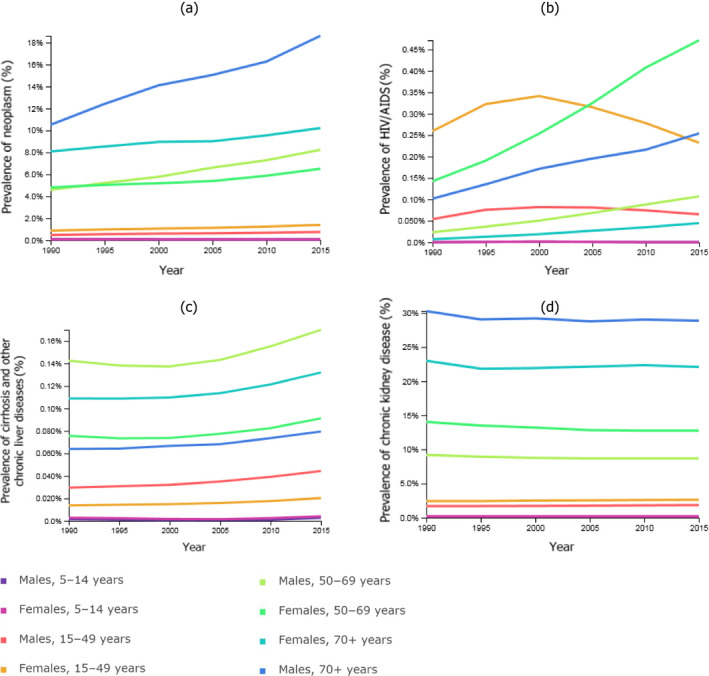
Prevalence (in percentage) in specific age–gender groups in western Europe, 1990–2015, of neoplasm (a), human immunodeficiency virus infection and acquired immune deficiency syndrome (HIV/AIDS) (b), cirrhosis and other chronic liver diseases (c), and chronic kidney disease (d) Data from http://www.healthdata.org/
The number of adults (> 15 years) living with HIV in the EU/EEA was also estimated by ECDC at 810,083 in 2015 (or 0.18% of that population group). For the over 65 years age group, the figures are estimated at 3,215 for females (0.006% of that group) and 11,852 for males (0.03% of that group). For the 15–65 years age group, the figures are 216,642 for females (0.13% of that group) and 578,374 for males (0.34% of that group).
In conclusion, the increase in the number of people > 75 years, and the observations that death rates are decreasing and cancer rates increase with age, and the increase in the prevalence of several underlying conditions support the hypothesis that susceptibility has increased at least in the oldest age groups during the time period of interest.
3.6.4. Uncertainty analysis of the gQMRA model
The quantitative risk assessment model developed in this Scientific Opinion was built upon the model developed by Pérez‐Rodríguez et al. (2017) in outsourcing activity 2 and in general the uncertainty sources of both models are similar. Table J.1 in Appendix J presents a list and brief description of the identified sources of uncertainty. The output of the gQMRA model developed in this Scientific Opinion was the number of cases in each age–gender group due to consumption of a generic RTE food, reflecting the properties (prevalence, initial contamination, growth, etc.) and consumption of the foods considered, and uncertainty is associated with the outcome because of the identified data and knowledge gaps. An important source of uncertainty is the DR relationship since it is calibrated with the epidemiological data on observed cases and is the same data as used in the exposure assessment. In addition, in the DR model applied here, it is implicitly assumed that the distribution of strain virulence is the same between the different food categories. Although some strains/clonal complexes are equally distributed between the different food categories, small differences in relative percentages of high/medium/low virulent CCs could lead to significant differences in the risk estimates. This has been exemplified for L. monocytogenes in cold smoked salmon in France (Fritsch et al., 2017).
Table J.1.
Potential sources of uncertainty identified in the Listeria monocytogenes generic QMRA (gQMRA) model and qualitative assessment of the impact that these uncertainties could have on the final outcome
| Component of assessment affected (e.g. subquestion, parameter, study, etc.) | Assumption/Data used | Brief description of sources of uncertainty | Direction of the effect on the number of casesa | Direction of the effect on the impact of factors on the number of casesa |
|---|---|---|---|---|
| Food categories | ‐Seven food categories (cold‐smoked fish, hot‐smoked fish, gravad fish, cooked meat, sausage, pâté, soft and semi‐soft cheese) were assumed to represent RTE foods. | Other RTE food categories may contribute to human listeriosis | Both directions | Both directions |
| Prevalence | ‐A single value for prevalence of RTE food subcategory was assumed based on available occurrence data (BLS, and US data). |
‐Performance of detection methods and associated information bias, due to competition with background flora and poor recovery of L. monocytogenes on plates ‐Sampled products may not represent the food category |
Both directions | Both directions |
| Initial concentration |
‐Initial concentrations (at decimal logarithm scale) were assumed to be distributed as a beta‐general with a minimum equal to −1.69 and maximum equal to 6.1. The two other (shape) parameters of the beta‐general distribution (a and β) are estimated based on data using a maximum likelihood estimation algorithm ‐BLS data were used for fish and US data (Gombas et al., 2003) for meat and cheese distributions. |
‐Performance of detection methods and associated information bias, due to competition with background flora and poor recovery of L. monocytogenes on plates ‐Sampled products may not represent the food category ‐US data may not represent EU |
Both directions | Both directions |
| Time of storage |
The remaining shelf life of a RTE food at the time of its purchasing was assumed to follow an exponential distribution. A variable named psl was used to introduce the variability in storage time which was described with a beta‐pert distribution with a minimum, mode and maximum and mode equal to 0, 0.30 and 1.1 respectively. The storage time is derived by multiplying the psl by the remaining shelf life. ‐Storage time at consumer level (fraction of remaining shelf life) is considered independent of the food category. |
‐Storage time may differ between food categories ‐The used distribution for psl may not be appropriate ‐Sampled products may not represent the food category ‐psl description was based on expert knowledge since no data were available and may differ from reality |
Both directions | Both directions |
| Temperature of storage |
‐The temperature (T) of the consumer refrigerator was assumed normally distributed with a mean equal to 5.9°C and a standard deviation of 2.9°C based on literature data. ‐Storage temperature was considered independent of the food category. ‐Constant temperature was assumed during storage at consumer level (but variable between consumers). ‐Storage time and temperature were considered as independent factors. |
‐Performance of temperature recording methods ‐ The used distribution for T may not be appropriate ‐Storage temperature may differ among EU countries ‐Sampled refrigerators may not be representative ‐In reality temperature conditions are dynamic and not constant ‐Storage time and temperature are expected to be dependent factors due to spoilage |
Both directions | Both directions |
| Growth |
‐The EGR at a specific temperature T is derived using this simplified secondary model, with Tmin = −1.18°C ‐To describe the variability it was assumed that the EGR at 5°C is log‐normally distributed. ‐The parameters of the Probability distributions of the EGR were estimated for the different food categories based on data from a review study carried out by Pérez‐Rodríguez et al. (2017). ‐No lag time included (lag time was considered as completed from production to retail level). ‐No interaction (competition or metabiosis) with background flora was assumed. ‐A constant value for the maximum concentration was assumed. |
‐There may be some uncertainty of the used Tmin value ‐The used distribution for EGR may not represent all sources of variability ‐Uncertainty of the used values of EGR distribution parameters ‐lag time may not be completed from production to retail ‐The background flora may affect the growth of the pathogen ‐The maximum concentration can vary depending on product, temperature, initial concentration and background flora |
Both directions | Both directions |
| Consumption |
‐The average serving size (mass of RTE food ingested per meal) per category of food and per subpopulation as well as the TEO per year were estimated from the EFSA consumption data base. In total 14 subpopulations were considered (7 age groups for each male and female). ‐A single value (average) for both serving size and total number of eating occasions per year was used. Variability was not considered. |
‐Average serving size may not be the most representative parameter, for reflecting serving size ‐Uncertainty of data of EFSA consumption data base ‐Consumption data may vary among EU countries and over time ‐Variability in serving size and total number of eating occasions per year ‐Uncertainty around classification of food groups ‐General uncertainty with using 1–7 days diaries to estimate overall consumption, e.g. no consumption during survey or high consumption |
Both directions | Both directions |
| Dose response | The mean of the log‐normal distribution of r for each of the 14 populations was estimated. With parsimony, the standard deviation was assumed to be the same for each subpopulation. The 14 means of r, were calculated based on the output of the exposure model, the average of the annual observed cases of listeriosis per subpopulation between 2008 and 2011 and the TEO per subpopulation. |
‐Uncertainty around using US concentration data ‐Uncertainty around assumption of no variation of consumption within subpopulations ‐assumption of that variability between host factors and listeria factors are log‐normally distributed ‐r values may vary among EU countries ‐DR data not independent from combined assessment; the same data as in exposure calibrated / anchored to the number of cases |
Both directions | Both directions |
BLS: EU‐wide baseline survey; DR: dose response; EGR: exponential growth rate; psl: proportion of remaining shelf life; RTE: ready‐to‐eat; T: temperature; TEO: total number of eating occasions.
Lack of data does not allow estimating the direction of the uncertainty.
The model was used to assess the distribution of cases in the baseline scenario, attribution of cases to different doses and the effect of growth, but mainly in the importance analysis to evaluate the impact of the various factors on the reported trend of listeriosis incidence rates in the EU/EEA. The uncertainty of the evaluation of contributing factors, in relation to food categories not considered, depends on the degree that the non‐considered foods would differ in terms of prevalence, initial contamination, growth, storage, consumption, etc., to those considered. The impact of uncertainty is expected to be lower for the importance analysis when the relative effects of factors were evaluated than for the absolute number predictions, since the impact is expressed as a multiplication factor, i.e. as a relative number of the number of cases in two scenarios. The uncertainty of the absolute outputs of the gQMRA model was not evaluated quantitatively but the magnitude of the uncertainties related to the factors evaluated is indicated in the importance analysis. However, since the analysis is carried out at EU/EEA level, and because there are many data gaps and wide variation between countries, the outcome EU/EEA level may not be representative for all countries.
3.6.5. Synthesis of evidence of factors that may explain the human listeriosis trend in the EU/EEA, 2008–2015
When a listeriosis case occurs, it is the unwanted outcome of an interaction between a human host and the pathogen being ingested via food. Due to data limitations listeriosis trends in humans were analysed and interpreted using age and gender as proxies for susceptible human hosts, while country variations were not considered in this Scientific Opinion. Furthermore, only the three RTE food categories with seven subcategories included in the BLS were considered. This means that not all foods are included and that many changes in the relevant factors and in food are not considered. These include changes in the different susceptible subpopulations which may have occurred during the time period and these may have been variable in different countries. Thus, data limitations may hide trends and changes at lower levels of aggregation.
The observed trends in the TSA reflected changes in the incidence rates of human invasive listeriosis over the time period 2008–2015 and were less than a factor of 2 for the different population groups. This corresponds to relatively small changes in terms of the absolute number of cases when considered per age group, especially in comparison with other food‐borne illnesses. This makes it especially challenging to identify single or combined factors responsible for the increase in invasive listeriosis because small changes that are difficult to detect could be behind the changes. It is also a challenge for any QMRA model to have a resolution at this level, i.e. less than 2,300 annual cases separated into different age and gender groups.
The TSA indicated an increasing trend for all female age groups over 25 years and for males in the ≥ 75 age groups. The increase in the female 45–64 and 65–74 age groups was borderline significant. It is assumed that the trend in females aged 25–44 years old reflects an increased incidence rate in pregnant women since more than half of the cases in this age group are known to be related to pregnancy. It is believed that this trend indicates that general changes affecting all age groups, but not changes in susceptibility, have probably occurred during the time period. An increased susceptibility among pregnant women may also be hypothesised if the age of women at childbirth has increased but data to substantiate such a trend are scarce. Considering Eurostat data, there was only a small increase in the mean age at childbirth in the EU from 29.7 years in 2008 to 30.5 years in 2015. It should be noted data for the last three years were only estimated and/or provisional. Thus, the reasons for a conclusion of a general factor affecting all groups are that invasive listeriosis incidence rates have increased despite the fact that birth rates have decreased during the time period and that there is no reason to assume an increased susceptibility of females but not males in the reproductive age group. Factors that are considered possible to affect all age groups include a general increase in exposure (prevalence, concentrations and/or consumption), increased L. monocytogenes virulence and/or improved surveillance. These general factors will also contribute to the observed increasing trends in the other age–gender groups, although not necessarily to the same extent. Additional factors may also be important, especially when considering the observation that the incidence rates in age groups over 45 are higher in males than in females and the difference becomes smaller in the older age groups. Below is a summary of the evidence (TSA, gQMRA, indicator data) for the contribution of different factors to the observed trends.
Factors related to the host
AQ1.1: What contribution did any change in the population size (i.e. the number) of the elderly and/or susceptible people make to the change in cases of human invasive listeriosis in the EU/EEA in the time period 2008–2015?
This question is addressed primarily using epidemiological and population data.
An increase in the number of susceptible persons due to increased age or increased susceptibility will increase the number of human invasive listeriosis cases by the same amount, i.e. a doubling in numbers would result in a doubling in the number of cases, everything else being equal. If only the number of persons in the susceptible groups is increased, observed incidence rates would not show an increasing trend. For this to occur, the proportions of any characteristics that affect the risk of invasive listeriosis within the age–gender group would have to change.
Figures 29 (females) and 30 (males) show the annual invasive listeriosis incidence (a), number of human invasive listeriosis cases (b), and population size (c), between 2008 and 2015 for the different age groups. Dotted lines indicate the minimum or different levels of change expressed as a percentage or as a factor. The annual number of cases increases by a factor close to 1.5 for the female 45–64 age group, female and male 65–74 age groups, and by a factor close to 2 for the female and male ≥ 75 age groups and the female 25–44 age group.
Figure 29.
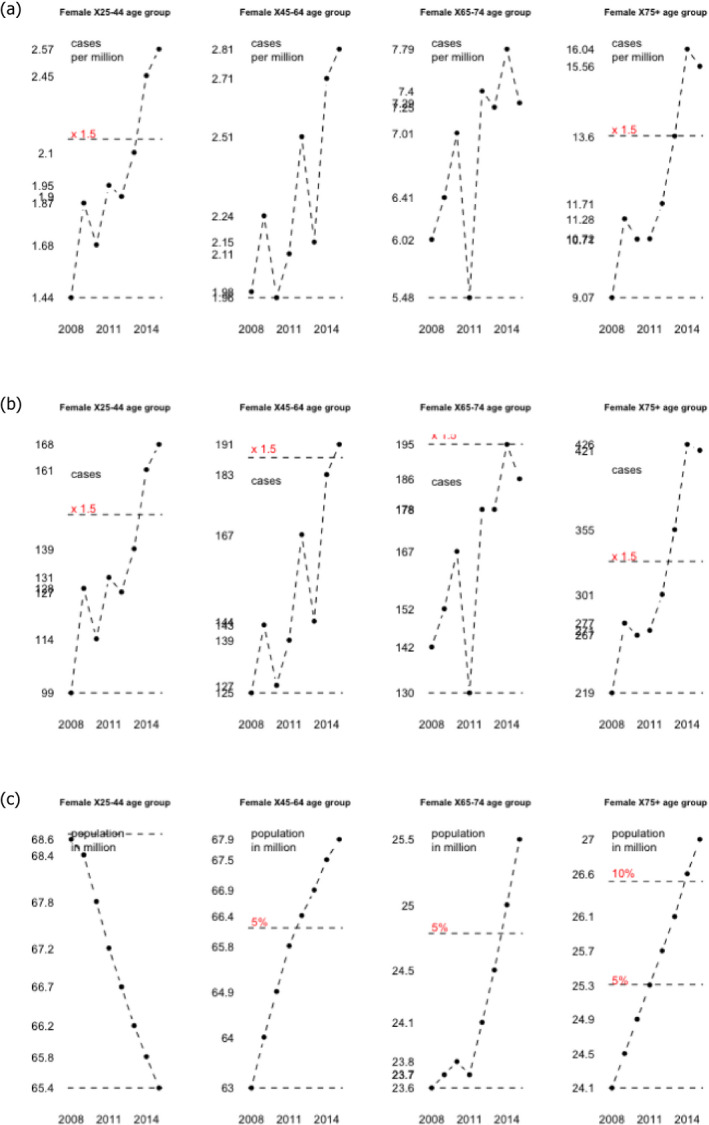
- The line 1.5 shows the increase from the lowest level by a factor of 1.5, lines 5% and 10% by a percentage of 5 and 10% respectively.
Interestingly, for the male and female 25–44 age groups the population sizes decreased by 5% (68.6 to 65.4 million for female) between 2008 and 2015. All other populations increased in size. The largest population increases are for the male 65–74 and ≥ 75 age groups where the population size increased by around 10–22% (Figure 30c).
Figure 30.
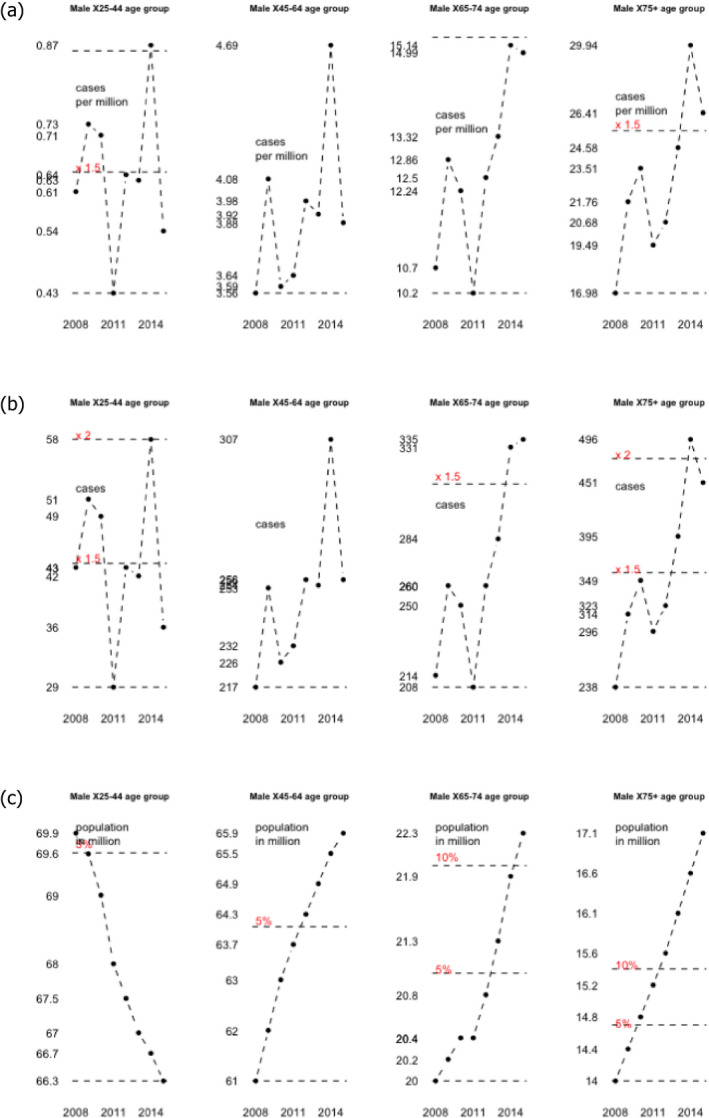
- The lines 1.5 and 2 show the increase from the lowest level by a factor of 1.5, lines 5% and 10% by a percentage of 5 and 10% respectively.
If the population increase were the only factor explaining the increased number of invasive listeriosis cases in these age groups, a population increase of more than 50% would be required instead of the observed increase of 22% (17.1/14). Moreover, for the female 25–44 age group, a decrease in the population is observed.
AQ1.2: What contribution did any change in ‘underlying condition rate’ make to the change of incidence rates of invasive listeriosis in the EU/EEA in the time period 2008–2015?
From AQ1.1 it is clear that population growth cannot explain the whole increase in the number of invasive listeriosis cases and if the number of cases were due only to an increase in the size of these populations there would be no increasing trend in the invasive listeriosis incidence. Thus, additional factors are needed to explain the trend. As concluded above, based on the increase in the female 25–44 group, factors affecting all age–gender groups are probably contributing to the increase. In addition, especially for the older age groups an increase in susceptibility due to underlying diseases is probably contributing to the increasing trends. The reasons for this conclusion are that indicator data show that the incidence of conditions characteristic of important risk groups, e.g. cancer cases, has increased while death rates due to these illnesses have decreased. This is expected to have resulted in an increase of the proportion of susceptible people in age groups over 44 years old which is supported by the observed increase in the prevalence of several underlying conditions. In addition, the proportion of people over 80 and 85 years old within the age group > 75 has increased and the cancer rates increase for each of these age groups. Furthermore, support for this conclusion may be the observation that a high proportion of cases are associated with bacteraemia (Section 3.1) and as reported in Section 3.2 this symptom is typical for less virulent food‐related strains and cases with one or more underlying conditions. Additional support may be the fact that the incidence of cancer as well as of invasive listeriosis is higher in males and that the difference decreases with age. Admittedly, other differences related to gender may be as important.
Factor related to the food
AQ2.1: What contribution did any change in L. monocytogenes prevalence in RTE food at retail level make to the change of human invasive listeriosis incidence rates in the EU/EEA in the time period 2008–2015?
The impact of prevalence is direct, i.e. an increase by a factor of two would increase the incidence by a factor of two (if it is assumed that the distribution for the concentration of L. monocytogenes remains the same).
The outcome of the gQMRA model indicates that the overall prevalence in the generic RTE food weighted to reflect consumption increases with ages over 25–44 years. This suggests that part of the increase in invasive listeriosis incidence with age can be explained by consumption.
Due to data gaps and limited indicator data it is not possible to conclude to what extent an increase of prevalence with time could explain the increasing trend.
AQ2.2: What contribution did any change in L. monocytogenes concentration in RTE food at retail level make to the change of human invasive listeriosis incidence rates in the EU/EEA in the time period 2008–2015?
As shown in the importance analysis, the gQMRA model is very sensitive to the MPD and small changes may result in a multiplication of risk by a factor of 2. The impact of initial concentration is also shown in Figure 31 where the estimated number of human invasive listeriosis cases using the three different options described in the methodology section is presented.
Figure 31.
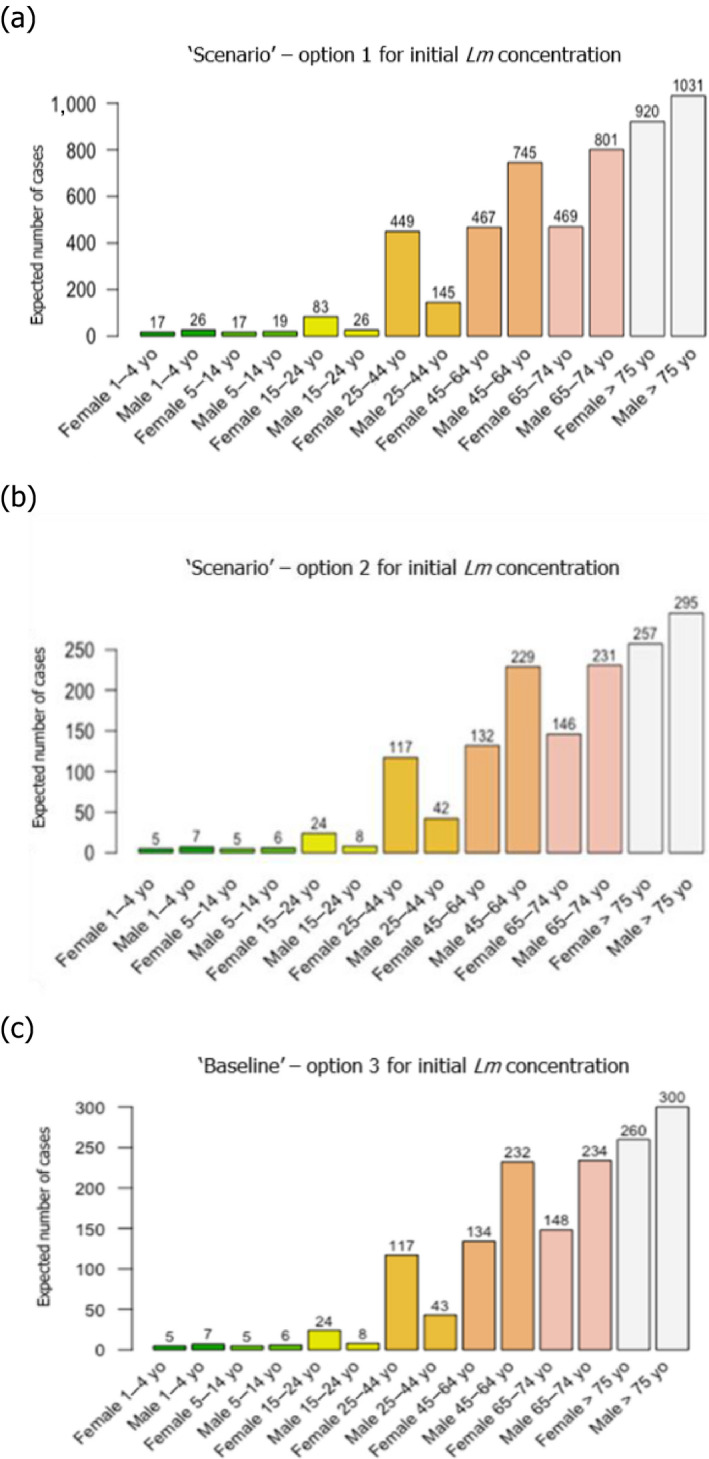
The option using the BLS data resulted in a substantially larger number of human invasive listeriosis cases than the baseline and option 2 (Figure 31). Thus, the concentration at retail and the MPD have a large impact on the listeriosis risk. Some indicator data suggest that a large number of servings exists on the market within a dose range that, according to the gQMRA model, explains more than 90% of invasive listeriosis cases, i.e. over 3 log10 CFU/g. In contrast, there are limited data to determine the extent to which shifts in concentration, either in non‐compliant foods, MPD or the concentration at retail, have contributed to the increased invasive listeriosis trend. The indicator data, i.e. the RASFF data, were variable but did not indicate any consistent increase in either the mean or the maximum concentrations. At the same time, these data are very limited and it is therefore uncertain to what extent it reflects the real situation.
AQ2.3: What contribution did any change in storage conditions (temperature, time) after retail (i.e. consumer phase) make to the change of human invasive listeriosis incidence rates in the EU/EEA in the time period 2008–2015?
The gQMRA indicated that the potential for an impact of storage conditions on the human invasive listeriosis incidence was quite large, especially for the storage time. In addition, the summary of the literature on food handling (including storage times and temperatures) indicated that the proportion of unsafe behaviours in risk groups is large, and sometimes related to age or socioeconomic factors. This supports the notion that storage conditions contribute to the human invasive listeriosis incidence. Different combinations of maximum remaining storage time and mode of storage time may lead to a multiplication by a factor of 2. Several trends in society, for instance in relation to sustainability and efforts to decrease food waste or a weak economy, may be hypothesised to influence changes in these parameters. Similarly, lack of temperature control among different consumer groups has also been reported. Due to data gaps it is not possible to conclude that consumer storage conditions (times, temperatures) have changed during the time period and contributed to the increasing human listeriosis trends.
AQ2.4: What contribution did any change in consumption (serving size and frequency) make to the change of human invasive listeriosis incidence rates in the EU/EEA in the time period 2008–2015?
As can be seen in Table 22 (results baseline model, total number of eating occasions per year (TEO)), the impact of the number of servings is direct, i.e. an increase of serving frequencies by a factor of two would increase the number of human invasive listeriosis cases per year by a factor of two. The same is true for the serving size.
There is some support in the indicator data for an increase in the consumption frequency of RTE foods, e.g. cooked RTE foods and smoked salmon, but this is based on limited data.
Results from the gQMRA model indicated that differences in consumption among the age groups influenced the probability of exposure to L. monocytogenes through the effect on the prevalence. Due to data gaps, it is not possible to conclude whether serving sizes or the number of eating occasions have increased during the time period or to what extent it might have contributed to the increased trend of human invasive listeriosis.
Factors related to the surveillance system
AQ3.1: What contribution did any change of (improved) surveillance make to the change of human invasive listeriosis incidence rates in the EU/EEA in the time period 2008–2015?
The impact of this factor is direct, i.e. an improvement of surveillance by a factor of two would increase the human invasive listeriosis incidence by a factor of two. Estimations of under‐reporting and under‐ascertainment of listeriosis in Canada, the USA and the UK have resulted in factors of around 1.7–2 (Mead et al., 1999; Adak et al., 2002; Thomas et al., 2013) which are in the same range as the largest increases in invasive listeriosis trends. The indicator data show that changes in the surveillance in some countries may have contributed to an increase in the number of reported cases during the time period. It is not possible to draw conclusions on the quantitative impact of this on the observed trend.
Factors related to the bacterium
AQ4.1: What contribution did any change in virulence make to the change of human invasive listeriosis incidence rates in the group of interest in the EU/EEA in the time period 2008–2015?
The available indicator data were limited, and the analysis could only be based on serogroups and mortality rates. These data did not indicate an increase in the virulence/pathogenicity.
Based on the indicator data, it is not possible to conclude that the virulence of L. monocytogenes has increased during the period. With new data becoming available, it should be possible to evaluate this factor more appropriately.
3.6.6. Conclusions of factors contributing to the human listeriosis trend in the EU/EEA, 2008–2015
Summarising remarks based on the gQMRA model and the baseline scenario:
The frequency of exposure (i.e. the prevalence of L. monocytogenes in RTE foods) appears to increase with age over 25 years old for both genders, due to differences in consumption patterns.
Based on predictions of the gQMRA model, the expected number of human invasive listeriosis cases per year is reduced by 37% (from 1,523 to 953) in the absence of growth from retail onwards.
Based on the gQMRA model and empirical data on initial L. monocytogenes concentrations reflecting contaminated RTE food on the market (of the considered foods ‘RTE fish,’ ‘RTE meat’ and ‘RTE cheese,’ according to specifications from the BLS), 92% of invasive listeriosis cases for all age‐gender groups are attributable to doses above 105 CFU per serving. Assuming an average serving size of 50 g, this would correspond to an average L. monocytogenes concentration in RTE foods above 2,000 CFU/g at the time of consumption.
Factors that may have impacted on the trend of human invasive listeriosis cases/incidence rates in the EU/EEA during 2008–2015 were classified based on the quality of the available evidence applying the probability scales as defined in the draft EFSA guidance on uncertainty (EFSA Scientific Committee, 2016):
Class 1: factors likely (66–90%) to have contributed to the trend (based on the potential impact when changing the factor according to modelling or other information, and support from indicator data and expert opinion);
Class 2: factors that as likely as not (33–66%) have contributed to the trend (based on expert opinion due to the potential impact when changing the factor according to modelling or other information, but with no or limited empirical evidence to support the conclusion); and
Class 3: factors that are inconclusive and therefore may or may not have contributed to the trend (based on expert opinion due to the potential impact when changing the factor according to modelling, but no or limited empirical evidence).
The following factors were considered to belong to class 1:
-
For the increased number of human invasive listeriosis cases in the EU/EEA
-
–
An increased population size of the elderly and susceptible population (except in the 25–44 female age group which has decreased).
-
–
-
For the increased incidence rates/cases of human invasive listeriosis in the EU/EEA
-
–
An increased proportion of susceptible persons in age groups over 45 years of both genders. The increasing trend in the female 25–44 age group (pregnancy‐related) suggests that a factor other than susceptibility must have contributed since susceptibility is not expected to have changed in this population during the time period. The additional factor may be any of those evaluated and would likely contribute to the trend in all age groups but possibly to a varying degree.
-
–
The following factors were considered to belong to class 2:
-
For the increased incidence rates/cases of human invasive listeriosis in the EU/EEA
-
–
An increased consumption (number of servings per person) of RTE foods in the EU/EEA as there is some support in the indicator data for an increase in the consumption frequency of RTE foods, e.g. cooked RTE foods and smoked salmon, but this is based on limited data.
-
–
An improved surveillance of human invasive listeriosis in the EU/EEA as there have been some changes in the surveillance systems, in particular for some countries with a relatively high level of reporting.
-
–
The following factors were considered to belong to class 3:
-
For the increased incidence rates of human invasive listeriosis in the EU/EEA
-
–
L. monocytogenes concentration in the three considered RTE food categories33 at retail
-
–
L. monocytogenes prevalence in the three considered RTE food categories at retail
-
–
L. monocytogenes virulence potential
-
–
Storage conditions (time and temperature) after retail of the three considered RTE food categories.
-
–
Several data gaps limited the evaluation of factors behind the observed invasive listeriosis trend and contributed to uncertainties in the assessment outcome. Data gaps include harmonised data collected using a sampling strategy suitable for surveillance over time on:
prevalence and concentration of L. monocytogenes in RTE foods
consumption of RTE foods
prevalence of risk groups by age and gender
retail and home storage temperatures
L. monocytogenes virulence.
4. Conclusions
ToR 1 To summarise and critically evaluate the most recent information on L. monocytogenes in RTE foods, and in particular from the following sources: (a) EU‐wide baseline survey and monitoring data and (b) the three EFSA outsourcing activities
The overall pattern of listeriosis epidemiology has not changed since the previous Scientific Opinion as most human cases appear to be sporadic and reported outbreaks are usually small, and invasive listeriosis mainly affects high risk groups.
Epidemiological data combined with sequence information and results from animal models in one study indicate that 12 CCs make up almost 80% of the more than 6,000 isolates from clinical specimens and food items, and that different levels of virulence may be associated with these. Among these 12 CCs, some CCs are more often isolated from food samples and less frequently isolated from invasive clinical samples but, when recovered from clinical specimens, they are usually isolated from blood. These CCs appear to be less virulent (hypovirulent) and are more frequently associated with highly immunocompromised patients or patients showing a higher number of severe comorbidities than CCs predominantly isolated from clinical specimens. Those CCs predominantly isolated from clinical specimens are most commonly associated with CNS and MN infections as opposed to bacteraemia alone. Uncertainty may be associated with this classification due to knowledge gaps about factors influencing the isolation and detectability of different strains from different matrices. When more data become available, e.g. on occurrence, virulence and DR, it may be considered appropriate to carry out risk assessments for different CCs of L. monocytogenes.
WGS techniques, when combined with epidemiological information, have shown the potential to attribute relatedness among L. monocytogenes strains and thus to establish stronger links between human listeriosis cases and causative foods.
Recent outbreak reports such as those associated with cantaloupe and caramel apples in the USA demonstrate that as yet unconsidered RTE food categories of plant‐derived origin under certain conditions can also support growth and have the potential to contribute to the burden of disease. The ice cream outbreak in the USA highlights that food that do not support growth has also the potential to contribute to the burden of disease after widespread distribution of low‐level contaminated products if a highly vulnerable segment of the population is exposed.
Persistence of L. monocytogenes in food processing environments is still considered to be the major source of RTE food contamination.
As evidenced in the EU monitoring, RASFF and the BLS on L. monocytogenes in RTE smoked and gravad fish, heat‐treated meat and soft and semi‐soft cheese, RTE food categories typically associated with human listeriosis, i.e. ‘meat and meat products,’ ‘fish and fish products,’ and ‘milk and milk products’ continue to be of significance from a food safety perspective. For instance, combining the BLS and consumption data indicates that approximately 55 million servings of RTE meat and meat products contaminated with more than 100 CFU/g may be consumed per year by the population over 75 years old in the EU/EEA.
Unsafe practices (including storage time and temperatures) are not uncommon within the elderly group (> 10% of persons studied). There is a wide variation within the broadly defined consumer groups and it is thus problematic to generalise about the food handling behaviours of these groups and in different MS and on how this may contribute to trends of human listeriosis.
The average probability of a single L. monocytogenes CFU to cause illness in a specific host (the r value), may vary up to 100 million times from the least to the most susceptible subpopulations. This suggests that the impact of the health status of a consumer is equally important to consider as the level of L. monocytogenes in the ingested food.
Since the previous Scientific Opinion several developments, including cardinal growth models, probability of growth models and non‐thermal inactivation models, together with data on strain variability (in growth limits, growth rates and heat resistance) and stochastic modelling have been reported. Developments include validated models which has improved the capability to provide realistic predictions for L. monocytogenes growth in RTE foods.
The quantitative risk characterisation of L. monocytogenes in various RTE food categories (heat‐treated meat; smoked and gravad fish; and soft and semi‐soft cheese) in the EU (outsourcing activity 2) predicted most of the listeriosis cases to occur in the elderly population (48% of cases) followed by the pregnant population (41% of cases) and the healthy population (11% of cases). The attribution of cases to the pregnant population appears to be an overestimation compared to what has been reported during the period. The overestimation is partially a result of the scope of the risk assessment and the application of a DR model considering only these three populations.
ToR 2 To discuss and evaluate the factors related to contamination in the food chain and the consumption patterns that may contribute to the reported trend of listeriosis incidence in the EU
For the time period 2008–2015, the aggregated TSA (total 14,002 confirmed cases) did not show an increasing trend of invasive listeriosis incidence rates in the EU/EEA, while trends were shown for the disaggregated analyses (by age and gender). This is partly a consequence of the presence of changing dynamics, autocorrelation and strong seasonality in the aggregated analysis.
For females, the incidence rate of confirmed human invasive listeriosis significantly increased for the 25–44 and ≥ 75 age groups in this time period with a monthly increase estimated at 0.64% and 0.70%, respectively. For the female 45–64 and 65–74 age groups, the increasing trend was borderline significant with a monthly increase estimated at 0.43% and 0.30%, respectively. For males, the incidence rate of confirmed human invasive listeriosis cases increased significantly only for the ≥ 75 age group with a monthly increase estimated at 0.50%.
In 2015, the invasive listeriosis incidence rate was higher for males than for females in the age groups over 45 years old. The opposite was true for the female 15–24 and 25–44 age groups believed to largely reflect pregnancy‐related listeriosis. The highest incidence rate in the EU/EEA in the period 2008–2015 is for the ≥ 75 age group resulting in 2015 in incidence rates of 2.20 and 1.30 cases per month per million persons for males and females respectively.
There are several sources of uncertainty, which can lead to under‐ or overestimation of the observed trends. Due to the available data, the analysis and understanding of trends were performed using age and gender as proxies for susceptible populations or pregnant women and did not include countries as a covariate. This is a limitation and means that the observed trends may hide trends among subgroups or be true for only a subset of the age–gender–country population.
A gQMRA model was developed to reflect a generic RTE food consumed in the EU/EEA. Contamination of the RTE food at the moment of consumption was based on consumption data, growth properties, packaging, and empirical data on initial L. monocytogenes concentrations of the considered foods ‘RTE smoked and gravad fish’, ‘RTE heat‐treated meat’ and ‘RTE soft and semi‐soft cheese’, according to specifications from the BLS and outsourcing activity 2. The gQMRA model can be updated with additional food categories when data become available.
Based on this gQMRA model, 92% of invasive listeriosis cases for all age‐gender groups are attributable to doses above 105 CFU per serving. Assuming an average serving size of 50 g, this would correspond to an average L. monocytogenes concentration in RTE foods above 2,000 CFU/g at the time of consumption. Still, a small proportion of cases are associated with the more frequently occurring RTE foods having a higher L. monocytogenes prevalence and lower L. monocytogenes levels.
Based on predictions of the gQMRA model, the expected number of human invasive listeriosis cases per year can be reduced by 37% (from 1,523 to 953) in the absence of growth after retail (i.e. at the consumer phase). This point to the possibility to control 63% of cases via control prior to the retail phase.
Factors that may have contributed to the trends of human listeriosis cases/incidence rates in the EU/EEA during 2008–2015 were classified, based on the available evidence into probability scales as defined in the draft EFSA guidance on uncertainty (EFSA Scientific Committee, 2016).
-
Factors considered as likely (66–90%) were:
-
–
An increased proportion of susceptible persons in age groups over 45 years for both genders. The increasing trend in the female 25–44 age group (mainly pregnancy‐related) suggests that a factor other than susceptibility must have contributed since susceptibility is not expected to have changed in this population during the time period. The additional factor may be any of those evaluated and would likely contribute to the trend in all age groups but possibly to a varying degree.
-
–
An increased population size of the elderly and susceptible population (except for the 25–44 female age group which has decreased). This factor would only contribute to the number of invasive listeriosis cases but not the increase in incidence rates.
-
–
-
Factors considered as likely as not (33–66%) were:
-
–
An increased consumption (number of servings per person) of RTE foods in the EU/EEA as there is some support in the indicator data for an increase in the consumption frequency of RTE foods, e.g. cooked RTE foods and smoked salmon, but this is based on limited data.
-
–
An improved surveillance of human invasive listeriosis in the EU/EEA as there have been some changes in the surveillance systems, in particular for some countries with a relatively high level of reporting.
-
–
-
Inconclusive factors were:
-
–
L. monocytogenes concentration in the three considered RTE food categories at retail;
-
–
L. monocytogenes prevalence in the three considered RTE food categories at retail;
-
–
L. monocytogenes virulence potential;
-
–
storage conditions (time and temperature) after retail of the three considered RTE food categories.
-
–
The increasing trend of listeriosis for some population groups may potentially be attributed to numerous factors which not only include the contamination levels in food, but also other factors, such as consumption, strain virulence, health status of consumer and demographic changes. This indicates the need for continuous review of the food safety management system in the EU to achieve the appropriate level of protection.
Due to data limitations, the present evaluation of contributing factors was based on only three RTE categories which is a limitation of the assessment. The impact of this depends on the degree that the non‐considered foods would differ in terms of prevalence, initial contamination, growth, storage, consumption, etc., to those considered. Furthermore, since the analysis is carried out at EU/EEA level, and because there are many data gaps and wide variations between countries, the outcome at EU/EEA level may not be representative for all countries. Thus, Member States are encouraged to apply the gQMRA model to their specific data.
Uncertainty is associated with the gQMRA model because of data and knowledge gaps. An important source of uncertainty is the DR relationship since it is dependent on the same data as used in the exposure assessment and the epidemiological data. However, the impact of uncertainty is expected to be lower for the importance analysis when the relative effects of factors were evaluated than for the absolute number predictions.
-
Data gaps to conclude on contributing factors include representative data collected across the EU/EEA using a harmonised sampling strategy suitable for surveillance over time on:
-
–
prevalence and concentration of L. monocytogenes in RTE foods;
-
–
consumption of RTE foods;
-
–
prevalence of different underlying conditions in different risk groups by age and gender;
-
–
retail and home storage temperatures; and
-
–
L. monocytogenes virulence.
-
–
5. Recommendations
General
To raise the awareness of all stakeholders in the food chain, including vulnerable groups, people supplying food to vulnerable groups, caterers, RTE producers, and authorities, about the potentially increasing problem of L. monocytogenes in RTE foods since the proportion of citizens in high‐risk groups is expected to increase in the EU/EEA.
Evaluation of factors and trends
To implement innovative programmes to generate data (i.e. prevalence and concentration, preferably coupled with sequencing) on L. monocytogenes in RTE foods (not only the classical food categories) that are comparable across Member States and time in the EU as existing monitoring has other objectives and is not appropriate for evaluating trends over time.
To improve the monitoring and/or surveillance data reporting at the EU level enabling a better assessment of compliance by FBO with the FSC for L. monocytogenes of RTE food categories according to Commission Regulation (EC) No 2073/2005.
To address the need for data to evaluate changes in consumption of RTE foods, and other food categories over time in the EU.
Improvement of understanding of listeriosis for risk assessment and risk management
To improve collection and reporting of data on human listeriosis including underlying conditions (e.g. pregnancy, different types of cancer, renal or liver failure).
To collect data on consumption habits and food handling practices of susceptible populations, especially the elderly, as well as socioeconomic–demographic data.
To promote the use of NGS/WGS in routine epidemiological surveillance of food and humans to improve the detection of outbreaks, the understanding of the distribution of different virulent strains in food and to enable better source attribution. This will translate molecular information, relating to L. monocytogenes in RTE food, into implementable action for the appreciation and management of risks.
To apply the gQMRA model with additional food categories when data become available. Member States to apply the gQMRA model and TSA model to their specific data.
Abbreviations
- AIDS
acquired immune deficiency syndrome
- ANSES
French Agency for Food, Environmental and Occupational Health and Safety
- AP
antimicrobial preservatives
- AQ
assessment question
- AR
acidity regulators
- ARIMA
autoregressive integrated moving average
- ATR
acid tolerance response
- aw
water activity
- BHI
Brain Heart Infusion
- BIOHAZ Panel
EFSA Panel on Biological Hazards
- BLS
EU‐wide baseline survey
- CA
Competent Authority
- CC
clonal complex
- CDF
cumulative distribution function
- CFR
case fatality rate
- CFU
colony forming units
- cgMLST
core genome multilocus sequence typing
- CI
confidence interval
- CNS
central nervous system
- CPM
cardinal parameter models
- CSF
cerebrospinal fluid
- Csp
cold shock protein
- DALYs
disability adjusted life years
- DLM
dynamic linear model
- DR
dose response
- ECDC
European Centre for Disease Prevention and Control
- EEA
European Economic Area
- ECDF
empirical cumulative distribution function
- EFSA
European Food Safety Authority
- EGR
exponential growth rate
- EURL Lm
EU Reference Laboratory for Listeria monocytogenes
- Eurostat
The Statistical Office of the European Union
- FAO
The Food and Agriculture Organization of the United Nations
- FBO
food business operator
- FDA
Food and Drug Administration
- FPE
food processing environment
- FSC
food safety criteria
- FSIS
Food Safety and Inspection Service
- FWD‐Net
European Food‐ and Waterborne Diseases and Zoonoses network
- GI
gastrointestinal
- GAD
glutamate decarboxylase
- GHP
good hygiene practice
- GMP
good manufacturing practice
- gQMRA
Listeria monocytogenes generic QMRA
- HACCP
hazard analysis and critical control points
- HIV
human immunodeficiency virus
- InlA
internalin A
- IRTA
Institut de Recerca i Tecnologia Agroalimentàries
- MIC
minimum inhibitory concentration
- MLST
multilocus sequence typing
- MN
maternal–neonatal
- MPD
maximum population density
- NGS
next generation sequencing
- OR
odds ratio
- PAR
Poisson autoregressive model
- PCR
polymerase chain reaction
- Pi
prediction interval
- PPI
proton pump inhibitors
- QMRA
quantitative microbiological risk assessment
- RASFF
EU Rapid Alert System for Food and Feed
- ROP
reduced oxygen packaging
- RTE
ready‐to‐eat
- SNP
single nucleotide polymorphism
- TEO
total number of eating occasions per year
- TESSy
The European Surveillance System
- ToR
terms of reference
- TSA
time series analysis
- UCO
University of Cordoba
- YLD
years of life lived with disability
- YLL
years of life lost
- WGS
whole genome sequencing
- WHO
World Health Organization
- WRAP
Waste and Resources Action Programme
Appendix A – Food safety criteria (FSC) for Listeria monocytogenes in ready‐to‐eat (RTE) foods
1.
Commission Regulation (EC) No 2073/20054 on microbiological criteria for foodstuffs lays down food safety criteria (FSC) for L. monocytogenes in ready‐to‐eat (RTE) foods. This Regulation came into force in January 2006.
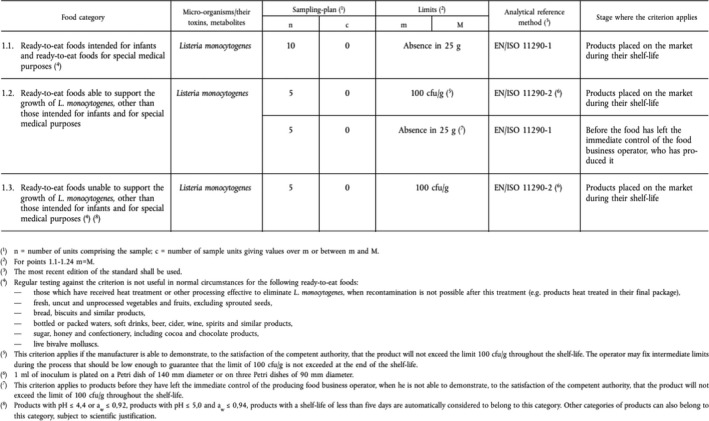
Food business operators (FBOs) shall ensure that foodstuffs comply with these microbiological criteria. To this end the FBOs at each stage of food production, processing and distribution, including retail, shall take measures, as part of their procedures based on Hazard Analysis and Critical Control Point (HACCP) principles together with the implementation of good hygiene practice, to ensure the following:
that the supply, handling and processing of raw materials and foodstuffs under their control are carried out in such a way that the process hygiene criteria are met;
that the food safety criteria applicable throughout the shelf life of the products can be met under reasonably foreseeable conditions of distribution, storage and use.
As necessary, the FBOs responsible for the manufacture of the product shall conduct studies to investigate compliance with the criteria throughout the shelf life. In particular, this applies to the RTE foods that are able to support the growth of L. monocytogenes and that may pose a L. monocytogenes risk for public health. As defined in Article 5.2 of the same Regulation, FBOs manufacturing RTE foods, which may pose a L. monocytogenes risk for public health, shall sample the processing areas and equipment for L. monocytogenes as part of their sample scheme.
In this Regulation RTE food is defined as ‘Food intended by the producer or the manufacturer for direct human consumption without the need for cooking or other processing effective to eliminate or reduce to acceptable level microorganisms of concern.’
Appendix B – Additional information of the time series analysis (TSA)
1.
The inputs of the time series analysis (TSA) model are presented in Tables B.1, B.2–B.3. The R‐code of the TSA model and the inputs (in Excel files containing tables) have been made available through the Knowledge Junction. The doi of the models is https://doi.org/10.5281/zenodo.1117638. Only the headings are shown hereunder with some values to clarify the content of the table.
Table B.1.
Data used for conducting the aggregated time series analysis (TSA) (read in as ‘totals.csv’ in R)
| Year | Month | Number Of Casesa | popa |
|---|---|---|---|
| 2008 | 1 | 94 | 4.7 × 10⁸ |
| 2008 | 2 | … | … |
| 2008 | … | … | … |
| 2008 | 12 | 106 | 4.7 × 10⁸ |
| … | … | … | … |
| 2015 | 12 | 167 | 4.8 × 10⁸ |
Number of cases: number of Listeria monocytogenes cases in a specific month and year; pop: total population in a specific month and year.
Some values shown for illustrative purposes. Data from The European Surveillance System – TESSy, provided by Austria, Belgium, Cyprus, the Czech Republic, Denmark, Estonia, Finland, France, Germany, Greece, Hungary, Iceland, Ireland, Italy, Latvia, Luxembourg, Malta, the Netherlands, Norway, Poland, Romania, Slovakia, Slovenia, Spain, Sweden, the United Kingdom and released by ECDC.
Table B.2.
Human invasive listeriosis data used for conducting the disaggregated age‐gender groups time series analysis (TSA) (read in as ‘merged_eu.csv’ in R)
| AgeGroup_ECDC | Gender | Month | Year | Number Of Casesa | popa | Date |
|---|---|---|---|---|---|---|
| X01‐04 | Female | 1 | 2008 | 0 | 1.0 × 10⁷ | 01‐01‐08 |
| X01‐04 | Male | 1 | 2008 | 0 | 1.0 × 10⁷ | 01‐01‐08 |
| X05‐14 | Female | 1 | 2008 | 0 | 2.5 × 10⁷ | 01‐01‐08 |
| X05‐14 | Male | 1 | 2008 | 2 | 2.6 × 10⁷ | 01‐01‐08 |
| X15‐24 | Female | 1 | 2008 | 0 | 2.9 × 10⁷ | 01‐01‐08 |
| … | … | … | … | … | … | … |
| X75+ | Female | 12 | 2015 | 27 | 2.7 × 10⁷ | 01‐12‐15 |
| X75+ | Male | 12 | 2015 | 49 | 1.7 × 10⁷ | 01‐12‐15 |
Number Of Cases: number of Listeria monocytogenes cases in a specific month and year; pop: total population in a specific month and year.
Some values shown for illustrative purposes. Data from The European Surveillance System – TESSy, provided by Austria, Belgium, Cyprus, the Czech Republic, Denmark, Estonia, Finland, France, Germany, Greece, Hungary, Iceland, Ireland, Italy, Latvia, Luxembourg, Malta, the Netherlands, Norway, Poland, Romania, Slovakia, Slovenia, Spain, Sweden, the United Kingdom and released by ECDC.
Table B.3.
Population data used for conducting the disaggregated age‐gender groups time series analysis (TSA) (read in as ‘merged_eu_wide.csv’ in R)
| Date | X01.04.Female.casesa | … | X75..Male.casesa | X01.04.Female.popa | … | X75..Male.popa |
|---|---|---|---|---|---|---|
| 01‐01‐08 | 0 | … | 17 | 1.0 × 10⁷ | … | 1.4 × 10⁷ |
| 01‐02‐08 | 0 | … | 9 | 1.0 × 10⁷ | … | 1.4 × 10⁷ |
| 01‐03‐08 | 1 | … | 13 | 1.0 × 10⁷ | … | 1.4 × 10⁷ |
| … | … | … | … | … | … | … |
| 01‐12‐15 | 0 | … | 49 | 1.0 × 10⁷ | … | 1.7 × 10⁷ |
Xxx.xx. Female/Male.cases: number of Listeria monocytogenes female/male cases in a specific age group xx.xx during a specific month in a specific year (month‐year as indicated in ‘date’). Xxx.xx. Female/Male.pop: total female/male population in a specific age group xx.xx at a specific month in a specific year (month‐year as indicated in ‘date’).
Some values shown for illustrative purposes. Data from The European Surveillance System – TESSy, provided by Austria, Belgium, Cyprus, the Czech Republic, Denmark, Estonia, Finland, France, Germany, Greece, Hungary, Iceland, Ireland, Italy, Latvia, Luxembourg, Malta, the Netherlands, Norway, Poland, Romania, Slovakia, Slovenia, Spain, Sweden, the United Kingdom and released by ECDC.
The evolution of reported human invasive listeriosis incidence rates in the EU/EEA (period 2008–2015) is shown in Figure B.1.
Figure B.1.
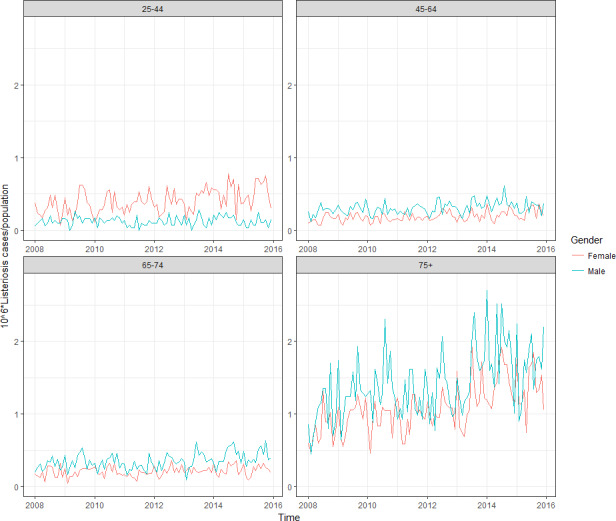
Evolution of reported human invasive listeriosis incidence rates (cases per month/1,000,000 population) in the EU/EEA, by gender for a selection of age groups, 2008–2015
Appendix C – Additional information of the Listeria monocytogenes generic QMRA (gQMRA) model
1.
The inputs of the Listeria monocytogenes generic quantitative microbiological risk assessment (gQMRA) model is shown in Tables C.1, C.2, C.3, C.4, C.5, C.6, C.7–C.8. The R‐code of the gQMRA model and the inputs (in Excel files containing tables) have been made available through the Knowledge Junction under the https://doi.org/10.5281/zenodo.1117741.
Table C.1.
Data used for calculating the prevalence of L. monocytogenes contamination of the 13 ready‐to‐eat (RTE) subcategories/packaging conditions (‘prev’ table)
| RTE category | RTE subcategory | Packaging | groupa | N | S | Groupcb |
|---|---|---|---|---|---|---|
| Fish products | Cold smoked fish | ROP | 1 | 613 | 94 | Smoked fish |
| Fish products | Hot smoked fish | ROP | 2 | 512 | 32 | Smoked fish |
| Fish products | Gravad fish | ROP | 3 | 252 | 30 | Gravad fish |
| Meat products | Cooked meat | ROP | 4 | 2,490 | 46 | Cooked meat |
| Meat products | Sausage | ROP | 5 | 762 | 13 | Sausage |
| Meat products | Pâté | ROP | 6 | 184 | 9 | Pâté |
| Fish products | Cold smoked fish | normal | 7 | 613 | 94 | Smoked fish |
| Fish products | Hot smoked fish | normal | 8 | 512 | 32 | Smoked fish |
| Fish products | Gravad fish | normal | 9 | 252 | 30 | Gravad fish |
| Meat products | Cooked meat | normal | 10 | 2,490 | 46 | Cooked meat |
| Meat products | Sausage | normal | 11 | 762 | 13 | Sausage |
| Meat products | Pâté | normal | 12 | 184 | 9 | Pâté |
| Cheese | Soft and semi‐soft cheese | normal | 13 | 3,114 | 13 | Soft and semi‐soft cheese |
N: total number of samples; ROP: reduced oxygen packaging; S: number of positive samples.
This is the designation to the Group used for further calculations.
This is the designation to the Groupc used for further calculations.
Table C.2.
Total number of eating occasions per year for the seven ready‐to‐eat (RTE) subcategories for the 14 subpopulation groups in the EU/EEA (‘conso’ table)
| Age | Gender | Smoked fish | Gravad fish | Cooked meat | Sausage | Pâté | Soft and semi‐soft cheese | Populationa |
|---|---|---|---|---|---|---|---|---|
| 01–04 | Female | 2.71E+08 | 6.03E+07 | 7.49E+08 | 1.00E+09 | 5.91E+08 | 2.32E+08 | 1 |
| 01–04 | Male | 3.06E+08 | 6.83E+07 | 8.64E+08 | 9.82E+08 | 6.50E+08 | 2.02E+08 | 2 |
| 05–14 | Female | 2.22E+08 | 4.95E+07 | 2.49E+09 | 2.44E+09 | 9.58E+08 | 4.75E+08 | 3 |
| 05–14 | Male | 2.25E+08 | 5.03E+07 | 2.78E+09 | 2.84E+09 | 1.21E+09 | 4.75E+08 | 4 |
| 15–24 | Female | 3.98E+08 | 8.87E+07 | 2.79E+09 | 1.64E+09 | 6.71E+08 | 6.79E+08 | 5 |
| 15–24 | Male | 2.63E+08 | 5.87E+07 | 4.05E+09 | 2.71E+09 | 1.06E+09 | 5.93E+08 | 6 |
| 25–44 | Female | 8.31E+08 | 1.85E+08 | 8.45E+09 | 4.70E+09 | 1.64E+09 | 2.30E+09 | 7 |
| 25–44 | Male | 9.33E+08 | 2.08E+08 | 1.13E+10 | 7.66E+09 | 2.89E+09 | 2.03E+09 | 8 |
| 45–64 | Female | 1.39E+09 | 3.10E+08 | 9.21E+09 | 5.29E+09 | 1.59E+09 | 2.46E+09 | 9 |
| 45–64 | Male | 1.57E+09 | 3.49E+08 | 1.16E+10 | 8.03E+09 | 2.73E+09 | 2.56E+09 | 10 |
| 65–74 | Female | 1.01E+09 | 2.24E+08 | 3.87E+09 | 2.05E+09 | 7.82E+08 | 1.05E+09 | 11 |
| 65–74 | Male | 9.94E+08 | 2.22E+08 | 4.00E+09 | 2.40E+09 | 1.08E+09 | 1.05E+09 | 12 |
| 75+ | Female | 1.59E+09 | 3.54E+08 | 3.56E+09 | 2.02E+09 | 1.23E+09 | 1.33E+09 | 13 |
| 75+ | Male | 1.57E+09 | 3.51E+08 | 2.78E+09 | 1.99E+09 | 1.18E+09 | 1.18E+09 | 14 |
This is the designation to the Population used for further calculations.
Table C.3.
Portion size (mass of RTE food ingested per meal; in grams) for the seven ready‐to‐eat (RTE) subcategories for the 14 subpopulation groups in the EU/EEA (‘size’ table)
| Age | Gender | Smoked fish | Gravad fisha | Cooked meat | Sausage | Pâté | Soft and semi‐soft cheese |
|---|---|---|---|---|---|---|---|
| 01–04 | Female | 26 | 26 | 22 | 38 | 19 | 21 |
| 01–04 | Male | 21 | 21 | 23 | 44 | 22 | 20 |
| 05–14 | Female | 54 | 54 | 31 | 54 | 28 | 27 |
| 05–14 | Male | 56 | 56 | 32 | 63 | 29 | 43 |
| 15–24 | Female | 56 | 56 | 39 | 68 | 36 | 40 |
| 15–24 | Male | 57 | 57 | 51 | 90 | 49 | 43 |
| 25–44 | Female | 64 | 64 | 42 | 61 | 41 | 48 |
| 25–44 | Male | 78 | 78 | 53 | 79 | 53 | 45 |
| 45–64 | Female | 61 | 61 | 42 | 63 | 41 | 46 |
| 45–64 | Male | 87 | 87 | 53 | 78 | 49 | 44 |
| 65–74 | Female | 60 | 60 | 40 | 55 | 31 | 32 |
| 65–74 | Male | 58 | 58 | 42 | 70 | 44 | 40 |
| 75+ | Female | 49 | 49 | 30 | 63 | 33 | 36 |
| 75+ | Male | 66 | 66 | 42 | 61 | 38 | 41 |
In the gQMRA model it was assumed that the serving size of gravad fish is the same as that of smoked fish.
Table C.4.
L. monocytogenes concentrations (in log10 CFU/g) per RTE food subcategory (‘conc’ table)
| RTE category | RTE subcategory | Packaging | Group | Min | Max | Shape1 | Shape2 |
|---|---|---|---|---|---|---|---|
| Fish products | Cold smoked fish | ROP | 1 | −1.69 | 5 | 0.684 | 2.655 |
| Fish products | Hot smoked fish | ROP | 2 | −1.69 | 6 | 0.684 | 2.655 |
| Fish products | Gravad fish | ROP | 3 | −1.69 | 6 | 1.210 | 5.450 |
| Meat products | Cooked meat | ROP | 4 | −1.69 | 6 | 0.502 | 2.908 |
| Meat products | Sausage | ROP | 5 | −1.69 | 6 | 0.502 | 2.908 |
| Meat products | Pâté | ROP | 6 | −1.69 | 6 | 0.502 | 2.908 |
| Fish products | Cold smoked fish | normal | 7 | −1.69 | 5 | 0.684 | 2.655 |
| Fish products | Hot smoked fish | normal | 8 | −1.69 | 6 | 0.684 | 2.655 |
| Fish products | Gravad fish | normal | 9 | −1.69 | 6 | 1.210 | 5.450 |
| Meat products | Cooked meat | normal | 10 | −1.69 | 6 | 0.502 | 2.908 |
| Meat products | Sausage | normal | 11 | −1.69 | 6 | 0.502 | 2.908 |
| Meat products | Pâté | normal | 12 | −1.69 | 6 | 0.502 | 2.908 |
| Cheese | Soft and semi‐soft cheese | normal | 13 | −1.69 | 7 | 0.194 | 3.177 |
ROP: reduced oxygen packaging. Listeria monocytogenes concentrations (at decimal logarithm scale) in RTE food were modelled using beta‐general distributions with a minimum equal to −1.69 and maximum as indicated in the table. The two other (shape) parameters of the food‐specific beta‐general distributions (α and β) were estimated using a maximum likelihood estimation algorithm implemented in the ‘mle’ function (‘stats4’ package in R version 3.3.3 (Ihaka and Gentleman, 1996; R Core Team, 2016)).
Table C.5.
The exponential growth rate (EGR) at 5°C for the 13 ready‐to‐eat (RTE) subcategories/packaging conditions (‘EGR’ table)
| RTE category | RTE subcategory | Packaging | Group | Min | Max | m | sd | Nmax.mean | Nmax.min | Nmax.max |
|---|---|---|---|---|---|---|---|---|---|---|
| Fish products | Cold smoked fish | ROP | 1 | 0 | 0.0686 | 0.017081 | 0.013619 | 7.29 | 7.00 | 8.98 |
| Fish products | Hot smoked fish | ROP | 2 | 0 | 0.0686 | 0.017081 | 0.013619 | 7.29 | 7.00 | 8.98 |
| Fish products | Gravad fish | ROP | 3 | 0 | 0.0686 | 0.017081 | 0.013619 | 7.29 | 7.00 | 8.98 |
| Meat products | Cooked meat | ROP | 4 | 0 | 0.087206 | 0.021793 | 0.017664 | 6.23 | 3.37 | 8.91 |
| Meat products | Sausage | ROP | 5 | 0 | 0.087206 | 0.021793 | 0.017664 | 6.23 | 3.37 | 8.91 |
| Meat products | Pâté | ROP | 6 | 0 | 0.023 | 0.014 | 0.005 | 7.53 | 4.02 | 9.00 |
| Fish products | Cold smoked fish | normal | 7 | 0 | 0.0617 | 0.011959 | 0.01073 | 7.29 | 7.00 | 8.98 |
| Fish products | Hot smoked fish | normal | 8 | 0 | 0.0617 | 0.011959 | 0.01073 | 7.29 | 7.00 | 8.98 |
| Fish products | Gravad fish | normal | 9 | 0 | 0.0617 | 0.011959 | 0.01073 | 7.29 | 7.00 | 8.98 |
| Meat products | Cooked meat | normal | 10 | 0 | 0.086484 | 0.025698 | 0.019291 | 6.23 | 3.37 | 8.91 |
| Meat products | Sausage | normal | 11 | 0 | 0.086484 | 0.025698 | 0.019291 | 6.23 | 3.37 | 8.91 |
| Meat products | Pâté | normal | 12 | 0 | 0.097017 | 0.025697 | 0.0098129 | 7.53 | 4.02 | 9.00 |
| Cheese | Soft and semi‐soft cheese | normal | 13 | 0 | 0.029633848 | 0.010293 | 0.01508 | 7.28 | 7.00 | 8.99 |
ROP: reduced oxygen packaging. It was assumed that the exponential growth rate (EGR) at 5°C is log‐normally distributed.
Table C.6.
Remaining shelf life (in days) for the 13 ready‐to‐eat (RTE) subcategories/packaging conditions (‘r_time’ table)
| RTE category | RTE subcategory | Packaging | Group | Min | Max | m |
|---|---|---|---|---|---|---|
| Fish products | Cold smoked fish | ROP | 1 | 1 | 519 | 23.94 |
| Fish products | Hot smoked fish | ROP | 2 | 2 | 114 | 15.25 |
| Fish products | Gravad fish | ROP | 3 | 1 | 393 | 21.97 |
| Meat products | Cooked meat | ROP | 4 | 0 | 427 | 19.69 |
| Meat products | Sausage | ROP | 5 | 0 | 143 | 19.06 |
| Meat products | Pâté | ROP | 6 | 1 | 99 | 21.79 |
| Fish products | Cold smoked fish | normal | 7 | 6 | 37 | 11.69 |
| Fish products | Hot smoked fish | normal | 8 | 3 | 42 | 8.89 |
| Fish products | Gravad fish | normal | 9 | 3 | 370 | 86.96 |
| Meat products | Cooked meat | normal | 10 | 1 | 160 | 19.13 |
| Meat products | Sausage | normal | 11 | 0 | 106 | 15.29 |
| Meat products | Pâté | normal | 12 | 3 | 149 | 19.68 |
| Cheese | Soft and semi‐soft cheese | normal | 13 | 0 | 411 | 33.14 |
ROP: reduced oxygen packaging.
Table C.7.
Proportion of reduced oxygen packaging (ROP) and normal packaging for the seven ready‐to‐eat (RTE) subcategories (‘ROP’ table)
| RTE category | RTE subcategory | RTE2 | Packaging | Group | Pa | p2b |
|---|---|---|---|---|---|---|
| Fish products | Cold smoked fish | Smoked fish | ROP | 1 | 0.96 | 0.7 |
| Fish products | Hot smoked fish | Smoked fish | ROP | 2 | 0.73 | 0.3 |
| Fish products | Gravad fish | Gravad fish | ROP | 3 | 0.78 | 1 |
| Meat products | Cooked meat | Cooked meat | ROP | 4 | 0.87 | 1 |
| Meat products | Sausage | Sausage | ROP | 5 | 0.78 | 1 |
| Meat products | Pâté | Pâté | ROP | 6 | 0.75 | 1 |
| Fish products | Cold smoked fish | Cold smoked fish | normal | 7 | 0.04 | 0.7 |
| Fish products | Hot smoked fish | Hot smoked fish | normal | 8 | 0.27 | 0.3 |
| Fish products | Gravad fish | Gravad fish | normal | 9 | 0.22 | 1 |
| Meat products | Cooked meat | Cooked meat | normal | 10 | 0.13 | 1 |
| Meat products | Sausage | Sausage | normal | 11 | 0.22 | 1 |
| Meat products | Pâté | Pâté | normal | 12 | 0.25 | 1 |
| Cheese | Soft and semi‐soft cheese | Soft and semi‐soft cheese | normal | 13 | 1 | 1 |
ROP: reduced oxygen packaging.
This is the fraction for each RTE food subcategory split by packaging type.
This is the fraction for hot and cold‐smoked fish.
Table C.8.
Dose–response model for the 14 subpopulation groups (‘DR’ table)
| Age | Gender | RR | Path | RefSdLoga | Mean | Populationb |
|---|---|---|---|---|---|---|
| 01–04 | Female | 0.17 | Female 1–4 yo | 1.62 | −14.574 | 1 |
| 01–04 | Male | 0.20 | Male 1–4 yo | 1.62 | −14.467 | 2 |
| 05–14 | Female | 0.07 | Female 5–14 yo | 1.62 | −14.916 | 3 |
| 05–14 | Male | 0.07 | Male 5–14 yo | 1.62 | −15.005 | 4 |
| 15–24 | Female | 0.26 | Female 15–24 yo | 1.62 | −14.325 | 5 |
| 15–24 | Male | 0.08 | Male 15–24 yo | 1.62 | −15.036 | 6 |
| 25–44 | Female | 0.54 | Female 25–44 yo | 1.62 | −14.025 | 7 |
| 25–44 | Male | 0.18 | Male 25–44 yo | 1.62 | −14.764 | 8 |
| 45–64 | Female | 0.63 | Female 45–64 yo | 1.62 | −14.081 | 9 |
| 45–64 | Male | 1.07 | Male 45–64 yo | 1.62 | −14.045 | 10 |
| 65–74 | Female | 1.87 | Female 65–74 yo | 1.62 | −13.702 | 11 |
| 65–74 | Male | 3.50 | Male 65–74 yo | 1.62 | −13.560 | 12 |
| 75+ | Female | 3.40 | Female > 75 yo | 1.62 | −13.536 | 13 |
| 75+ | Male | 6.33 | Male > 75 yo | 1.62 | −13.536 | 14 |
RR: relative risk.
RefSdLog: standard deviation of the r parameter of the exponential model as in Pouillot et al. (2015b).
This is the designation to the Population used for further calculations.
In Figure C.1, an example is given of the of simulated distribution of L. monocytogenes doses per eating occasion using the three options for the initial concentration of L. monocytogenes in the three RTE food subcategories.
Figure C.1.
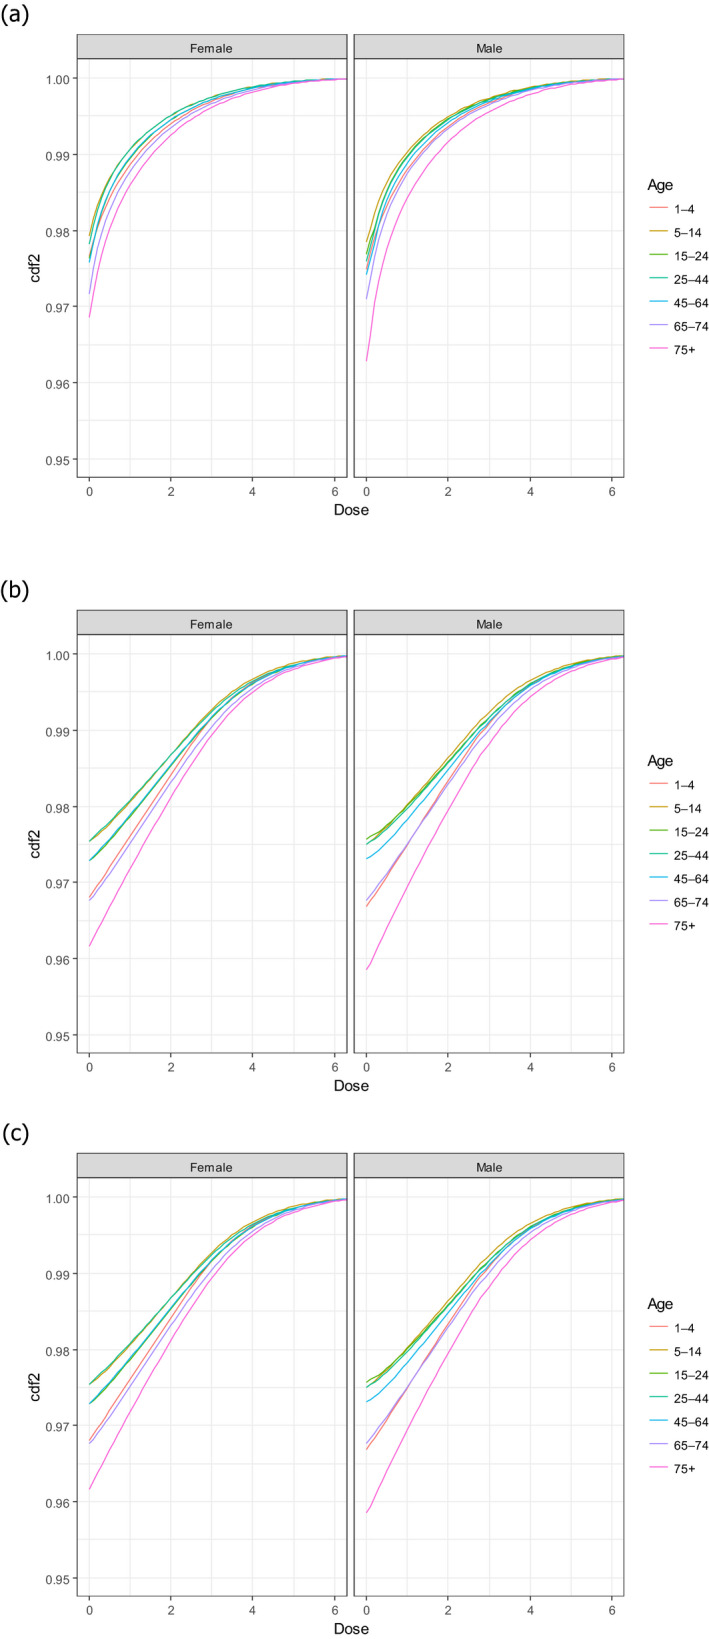
- CDF: cumulative distribution function. (a) Option 1: using only the distributions estimated with BLS data; (b) Option 2: using only the distributions estimated with US data (Gombas et al., 2003); and (c) Option 3: using fish distribution from EU BLS data, and meat and cheese distributions from US data (Gombas et al., 2003).
Appendix D – Reported human cases of confirmed human listeriosis and notification rates in the EU/EEA, 2008–2015
1.
Table D.1.
Reported cases of confirmed human invasive listeriosis and notification rates in the EU/EEA, by country and year, 2008–2015
| Country | 2008 | 2009 | 2010 | 2011 | 2012 | 2013 | 2014 | 2015 | ||||||||
|---|---|---|---|---|---|---|---|---|---|---|---|---|---|---|---|---|
| Cases | Rate | Cases | Rate | Cases | Rate | Cases | Rate | Cases | Rate | Cases | Rate | Cases | Rate | Cases | Rate | |
| Austria | 31 | 0.37 | 46 | 0.55 | 34 | 0.41 | 26 | 0.31 | 36 | 0.43 | 36 | 0.43 | 49 | 0.58 | 38 | 0.44 |
| Belgium | 64 | 0.60 | 58 | – | 40 | 0.37 | 70 | – | 83 | 0.75 | 66 | 0.59 | 84 | 0.75 | 83 | 0.74 |
| Bulgaria | 5 | 0.07 | 5 | 0.07 | 4 | 0.05 | 4 | 0.05 | 10 | 0.14 | 3 | 0.04 | 10 | 0.14 | 5 | 0.07 |
| Croatia | – | – | – | – | – | – | – | – | 0 | 0.00 | 0 | 0.00 | 4 | 0.09 | 2 | 0.05 |
| Cyprus | 0 | 0.00 | 0 | 0.00 | 1 | 0.12 | 2 | 0.24 | 1 | 0.12 | 1 | 0.12 | 0 | 0.00 | 0 | 0.00 |
| Czech Republic | 37 | 0.36 | 32 | 0.31 | 26 | 0.25 | 35 | 0.33 | 32 | 0.30 | 36 | 0.34 | 38 | 0.36 | 36 | 0.34 |
| Denmark | 51 | 0.93 | 97 | 1.76 | 62 | 1.12 | 49 | 0.88 | 50 | 0.90 | 51 | 0.91 | 92 | 1.62 | 44 | 0.78 |
| Estonia | 8 | 0.60 | 3 | 0.22 | 5 | 0.38 | 3 | 0.23 | 3 | 0.23 | 2 | 0.15 | 1 | 0.08 | 11 | 0.84 |
| Finland | 40 | 0.75 | 34 | 0.64 | 71 | 1.33 | 43 | 0.80 | 61 | 1.13 | 61 | 1.12 | 65 | 1.19 | 46 | 0.84 |
| France | 276 | 0.43 | 328 | 0.51 | 312 | 0.48 | 282 | 0.43 | 346 | 0.53 | 369 | 0.56 | 373 | 0.57 | 412 | 0.62 |
| Germany | 306 | 0.37 | 394 | 0.48 | 377 | 0.46 | 331 | 0.41 | 414 | 0.52 | 463 | 0.57 | 598 | 0.74 | 580 | 0.71 |
| Greece | 1 | 0.01 | 4 | 0.04 | 10 | 0.09 | 10 | 0.09 | 11 | 0.10 | 10 | 0.09 | 10 | 0.09 | 31 | 0.29 |
| Hungary | 19 | 0.19 | 16 | 0.16 | 20 | 0.20 | 11 | 0.11 | 13 | 0.13 | 24 | 0.24 | 39 | 0.39 | 37 | 0.38 |
| Iceland | 0 | 0.00 | 0 | 0.00 | 1 | 0.31 | 2 | 0.63 | 4 | 1.25 | 1 | 0.31 | 4 | 1.24 | 0 | 0.00 |
| Ireland | 13 | 0.29 | 10 | 0.22 | 10 | 0.22 | 7 | 0.15 | 11 | 0.24 | 8 | 0.17 | 15 | 0.33 | 19 | 0.41 |
| Italy | 118 | 0.20 | 109 | 0.18 | 157 | 0.27 | 129 | 0.22 | 112 | 0.19 | 143 | 0.24 | 132 | 0.22 | 153 | 0.25 |
| Latvia | 5 | 0.23 | 4 | 0.18 | 7 | 0.33 | 7 | 0.34 | 6 | 0.29 | 5 | 0.25 | 3 | 0.15 | 8 | 0.40 |
| Lithuania | 7 | 0.22 | 5 | 0.16 | 5 | 0.16 | 6 | 0.20 | 8 | 0.27 | 6 | 0.20 | 7 | 0.24 | 5 | 0.17 |
| Luxembourg | 1 | 0.21 | 3 | 0.61 | 0 | 0.00 | 2 | 0.39 | 2 | 0.38 | 2 | 0.37 | 5 | 0.91 | 0 | 0.00 |
| Malta | 0 | 0.00 | 0 | 0.00 | 1 | 0.24 | 2 | 0.48 | 1 | 0.24 | 1 | 0.24 | 1 | 0.24 | 4 | 0.93 |
| Netherlands | 45 | 0.27 | 44 | 0.27 | 72 | 0.43 | 87 | 0.52 | 73 | 0.44 | 72 | 0.43 | 90 | 0.53 | 71 | 0.42 |
| Norway | 34 | 0.72 | 31 | 0.65 | 22 | 0.45 | 21 | 0.43 | 30 | 0.60 | 21 | 0.42 | 29 | 0.57 | 18 | 0.35 |
| Poland | 33 | 0.09 | 32 | 0.08 | 59 | 0.16 | 62 | 0.16 | 54 | 0.14 | 58 | 0.15 | 87 | 0.23 | 70 | 0.18 |
| Portugal | – | – | – | – | – | – | – | – | – | – | – | – | – | – | 28 | 0.27 |
| Romania | 0 | 0.00 | 6 | 0.03 | 6 | 0.03 | 1 | 0.00 | 11 | 0.05 | 9 | 0.04 | 5 | 0.03 | 12 | 0.06 |
| Slovakia | 8 | 0.15 | 10 | 0.19 | 5 | 0.09 | 31 | 0.57 | 11 | 0.20 | 16 | 0.30 | 29 | 0.54 | 18 | 0.33 |
| Slovenia | 3 | 0.15 | 6 | 0.30 | 11 | 0.54 | 5 | 0.24 | 7 | 0.34 | 16 | 0.78 | 18 | 0.87 | 13 | 0.63 |
| Spaina | 88 | 0.77 | 121 | 1.05 | 129 | 1.11 | 91 | 0.78 | 109 | – | 140 | 1.00 | 161 | 0.77 | 206 | 0.99 |
| Sweden | 60 | 0.65 | 73 | 0.79 | 63 | 0.67 | 56 | 0.59 | 72 | 0.76 | 93 | 0.97 | 125 | 1.30 | 88 | 0.90 |
| United Kingdom | 206 | 0.33 | 235 | 0.38 | 176 | 0.28 | 164 | 0.26 | 183 | 0.29 | 192 | 0.30 | 201 | 0.31 | 186 | 0.29 |
| EU/EEA Total | 1,459 | 0.35 | 1,706 | 0.42 | 1,686 | 0.42 | 1,539 | 0.36 | 1,754 | 0.42 | 1,905 | 0.45 | 2,275 | 0.49 | 2,224 | 0.48 |
– = No reported data. Source: ECDC Surveillance Atlas of Infectious Diseases, 19 April 2017 – Available at: http://ecdc.europa.eu/en/data-tools/atlas/Pages/atlas.aspx#sthash.qAIHQymD.dpuf
Sentinel system; estimated population coverage of 45% in 2014–2015, 30% in 2013 and 25% in 2009–2012.
Appendix E – Data reported in the EFSA zoonoses database on occurrence of strong‐evidence food‐borne outbreaks where Listeria spp. was the causative agent, 2008–2015
1.
Table E.1.
Reported strong‐evidence food‐borne outbreaks with Listeria spp. causative agent in the reporting countries from the EU in accordance with Directive 2003/99/ECa (2007–2014)
| Food vehicleb (group) | Food vehicleb | Causative agentc | Serovar | Year | Countryd | Extente | Type of evidencef | Place of exposureg | Place of originh | Contributory factori | Food vehicle origin | Human cases | Hospitalisationsj | Deathsj | ||||||
|---|---|---|---|---|---|---|---|---|---|---|---|---|---|---|---|---|---|---|---|---|
| 1 | 2 | 3 | 4 | 5 | 6 | 7 | ||||||||||||||
| Meat and meat products | Pig meat and products thereof (sliced jellied pork) | Lm | 4b | 2008 | AT | General | X | X | X | Restaurant or Cafe or Pub or Bar or Hotel or Catering service | Restaurant or Cafe or Pub or Bar or Hotel or Catering service | Cross‐contamination | AT | 14 | 7 | 0 | ||||
| Dairy | Cheese (cheese (acid curd) made from pasteurised milk) | Lm | 1/2a | 2009 | DE | Unknown | X | X | Household | Unknown | NR | EU | 6 | 6 | 2 | |||||
| Dairy | Cheese (acid curd cheese) | Lm | 1/2a | 2009 | AT | General | X | Household | Processing plant | Cross‐contamination | AT | 25 | 25 | 5 | ||||||
| Meat and meat products | Pig meat and products thereof | Lm | 1/2a | 2009 | CZ | General | X | X | Others | Others | Cross‐contamination | CZ | 9 | 9 | 4 | |||||
| Meat and meat products | Bovine meat and products thereof (beef stew (sous vide)) | Lm | Unspecified | 2009 | DK | General | X | Processing plant | NR | NR | 8 | 8 | 0 | |||||||
| Meat and meat products | Other or mixed red meat and products thereof (tongue, beef, pork, ham, chicken, turkey) | Lm | 1/2a | 2010 | UK | General | X | X | X | Disseminated cases | Processing plant | Cross‐contamination | UK | 10 | 10 | 2 | ||||
| Other | Other foods (salmon and cress sandwiches, Egg mayonnaise sandwiches) | Lm | O4 | 2010 | UK | General | X | X | X | Hospital or medical care facility | Processing plant | Cross‐contamination; Storage time/temperature abuse; Unprocessed contaminated ingredient | UK | 4 | 4 | 1 | ||||
| Fish and seafood | Fish and fish products (herring casserole in vegetable oil) | Lm | 4b | 2010 | DE | General | X | X | Household | Processing plant | Unknown | DE | 12 | 8 | 1 | |||||
| Fish and seafood | Fish and fish products (gravad salmon) | Lm | unspecified | 2010 | DK | General | X | NR | NR | NR | NR | 9 | 0 | 0 | ||||||
| Dairy | Cheese | Lm | 1/2a | 2011 | BE | General | X | X | Disseminated cases | Unknown | Cross‐contamination | BE | 11 | 11 | 4 | |||||
| Other | Mixed food (sandwiches various and prepared salad dishes) | Lm | O4 | 2011 | UK | General | X | Hospital or medical care facility | Processing plant | Storage time/temperature abuse; Unprocessed contaminated ingredient | UK | 3 | 3 | 0 | ||||||
| Meat and meat products | Pig meat and products thereof | Lm | 1/2a | 2011 | CH | General | X | X | Household | Processing plant | Cross‐contamination | EU | 9 | NR | 0 | |||||
| Other | Bakery products (sponge cake) | Lm | NR | 2011 | FI | Household | X | X | X | Household | Processing plant | NR | Unknown | 2 | 2 | 0 | ||||
| Other | Bakery products (pork pies) | Lm | 4b | 2012 | UK | General | X | Disseminated cases | Processing plant | Cross‐contamination | UK | 14 | 14 | 1 | ||||||
| Meat and meat products | Bovine meat and products thereof (pressed beef also called potted beef and beef stew) | Lm | 1/2a | 2012 | UK | General | X | Mobile retailer or market/street vendor | Mobile retailer or market/street vendor | Cross‐contamination | UK | 4 | 4 | 2 | ||||||
| Other | Mixed food (sandwiches) | Lm | unspecified | 2012 | UK | General | X | X | Hospital or medical care facility | Unknown | Other contributory factor | Unknown | 6 | 6 | 2 | |||||
| Meat and meat products | Other or mixed red meat and products thereof (meat jelly) | Lm | NR | 2012 | FI | General | X | X | X | Hospital or medical care facility | Processing plant | Cross‐contamination | FI | 20 | 20 | 3 | ||||
| Meat and meat products | Meat and meat products | Lm | NR | 2013 | SE | General | X | Disseminated cases | Unknown | Unknown | Unknown | 34 | NR | NR | ||||||
| Food of non‐animal origin | Vegetables and juices and other products thereof (mixed salad) | Lm | 4b | 2013 | DE | General | X | X | X | Hospital or medical care facility | Unknown | Unprocessed contaminated ingredient | DE | 3 | 3 | 1 | ||||
| Fish and seafood | Crustaceans, shellfish, molluscs and products thereof (crab meat) | Lm | unspecified | 2013 | UK | General | X | X | Mobile retailer or market/street vendor | Processing plant | Cross‐contamination | UK | 4 | 4 | 1 | |||||
| Fish and seafood | Crustaceans, shellfish, molluscs and products thereof (crab meat) | Lm | unspecified | 2013 | UK | General | X | X | Mobile retailer or market/street vendor | Processing plant | Inadequate chilling | UK | 3 | 3 | 1 | |||||
| Meat and meat products | Pig meat and products thereof | Lm | 1/2a | 2013 | BE | Household | X | X | Household | Farm | NR | NR | 2 | 0 | 0 | |||||
| Dairy | Cheese | Lm | 1/2b | 2013 | BE | Household | X | X | Household | Retail | Unprocessed contaminated ingredient | NR | 2 | 0 | 0 | |||||
| Fish and seafood | Fish and fish products (half‐fermented trout) | Lm | unspecified | 2013 | NO | General | X | X | Disseminated cases | Unknown | Unknown | NO | 3 | 3 | 1 | |||||
| Fish and seafood | Crustaceans, shellfish, molluscs and products thereof | Lm | 2013 | FR | Household | X | Household | Unknown | Unknown | Unknown | 3 | 1 | 0 | |||||||
| Other | Mixed food (iceberg lettuce with yogurt dressing, gouda cheese) | Lm | 1/2a | 2014 | DE | General | X | Hospital or medical care facility | Unknown | Unknown | DE | 2 | 2 | 0 | ||||||
| Other | Other foods (cold cuts) | Lm k | NR | 2014 | DK | General | X | X | X | X | X | Others | Unknown | 41 | 0 | 0 | ||||
| Other | Mixed food (composite meal) | Lm k | NR | 2014 | DK | General | X | X | X | X | X | Hospital or medical care facility | Unknown | NR | 6 | 0 | 0 | |||
| Fish and seafood | Fish and fish products (smoked trout and smoked halibut) | Lm k | NR | 2014 | DK | General | X | X | X | X | Others | NR | Unknown | NR | 6 | 6 | 0 | |||
| Meat and meat products | Other or mixed red meat and products thereof (sausage) | Lm | 1/2a | 2014 | SE | NR | X | X | Disseminated cases | NR | NR | NR | 4 | NR | NR | |||||
| Food of non‐animal origin | Vegetables and juices and other products thereof (pre‐cut salad) | Lm | 4b | 2014 | CH | General | X | X | Household | Processing plant | Cross‐contamination | CH | 31 | NR | 4 | |||||
| Other | Buffet meals (sandwiches) | Lm | unspecified | 2014 | UK | General | X | X | Hospital or medical care facility | Hospital or medical care facility | Other contributory factor | Unknown | 4 | 4 | 0 | |||||
| Other | Mixed food | Lm | 4b | 2015 | PT | General | X | X | X | X | Hospital or medical care facility | Canteen or workplace catering | Cross‐contamination | PT | 3 | 3 | 0 | |||
| Other | Mixed food (rice pudding) | Lm | 4b | 2015 | DE | General | X | X | X | School or kindergarten | School or kindergarten | Storage time/temperature abuse | Unknown | 159 | 2 | 0 | ||||
| Meat and meat products | Pig meat and products thereof | Lm | 1/2a | 2015 | IT | General | X | X | X | X | X | Multiple places of exposure in one country | Processing plant | Unprocessed contaminated ingredient, Cross‐contamination | IT | 12 | 12 | 2 | ||
| Other | Mixed food (likely dill which then contaminated crustaceans and cheese) | Lm | 4b | 2015 | SE | NR | X | X | X | X | X | NR | NR | NR | NR | 13 | 1 | NR | ||
| Other | Buffet meals | Lm | unspecified | 2015 | FI | General | X | Restaurant or Cafe or Pub or Bar or Hotel or Catering service | Restaurant or Cafe or Pub or Bar or Hotel or Catering service | Unprocessed contaminated ingredient, Storage time/temperature abuse | EEA | 24 | 1 | 0 | ||||||
AT: Austria; BE: Belgium; CZ: the Czech Republic; DK: Denmark; EEA: European Economic Area; EU: European Union; FI: Finland; FR: France; DE: Germany; NO: Norway; NR: not reported; PT: Portugal; SE: Sweden; CH: Switzerland; UK: the United Kingdom.
Food‐borne outbreak: an incidence, observed under given circumstances, of two or more human cases of the same disease and/or infection, or a situation in which the observed number of human cases exceeds the expected number and where the cases are linked, or are probably linked, to the same food source (Directive 2003/99/EC).
Food vehicle: Food (or foodstuff) that is suspected of causing human cases.
Causative agent: The pathogen or its product, such as a toxin or bioactive amine, considered to be the cause of the food‐borne outbreak.
EU countries including Norway and Switzerland. Data from Spain have not been included in this table because they were provided outside the EFSA zoonoses database and in a different format of aggregation.
Extent of outbreak: General outbreak: outbreak involving human cases from more than one household. Outbreaks in residential homes (e.g. nursing homes), schools and other similar institutions are considered to be general outbreaks. Household outbreak: outbreak where all the human cases live in one single household.
Type of evidence: (1) Analytical epidemiological evidence: a statistically significant association between consumption of a foodstuff and being a case in an analytical epidemiological study (e.g. cohort or case–control study), (2) Detection in a food vehicle or its component: identification of the causative agent in a food vehicle or its component taken in the course of the investigation, (3) Detection in human cases: direct (e.g. culture) or indirect (e.g. serological) identification of the causative agent in clinical samples taken from outbreak cases, (4) Descriptive epidemiological evidence: suspicion of a food vehicle in an outbreak based on the identification of common food exposures, from the systematic evaluation of cases and their characteristics and food histories over the likely incubation period by standardised means (such as standard questionnaires) from all, or an appropriate subset of, cases, (5) Descriptive environmental evidence: e.g. evidence from food hygiene inspections, (6) Detection in food chain or its environment: identification of the causative agent in samples taken from the preparation or processing environment of the suspected food vehicle, or from batches of similar foodstuffs produced under the same conditions or in primary production where the suspected food vehicle originated, (7) Symptoms and onset of illness pathognomonic to causative agent.
Place of exposure: this is the location (‘setting’) where the food was consumed or where the final stages of preparation of the food vehicle took place (e.g. cafe/restaurant, institution, home, takeaway outlet).
Place of origin of problem: place where the contributory factors occurred.
Contributory factor: fault or circumstance that singly or in combination led to the food‐borne outbreak.
The figure could be higher as for some outbreaks this was not reported.
The database indicated Listeria spp., but the Annual Report on Zoonoses in Denmark 2014 (http://www.food.dtu.dk/english/publications) mentioned L. monocytogenes.
Appendix F – Overview of gene mutations in Listeria monocytogenes leading to a reduced virulence
1.
Table F.1.
Overview of important gene mutations in L. monocytogenes leading to a reduced virulence (reduced invasion, PI‐PLC activity or cell‐to‐cell spread)
| Source | Mutation‐type | Gene targeted | AA position | Genetic lineage/serotype |
|---|---|---|---|---|
| Human, Food | PMSC (type 2) | inlA | 656 | I (1/2b) |
| Human | PMSC (type 18) | inlA | 404 | I (4b) |
| n. s. | PMSC (type 16, 17) | inlA | 170, 253 | I (1/2b) |
| Food | PMSC (type 8, 10) | inlA | 460, 677 | II (1/2a) |
| Human, Food, FPE | PMSC (type 5, 7) | inlA | 189, 562 | II (1/2a, 3a) |
| n. s. | PMSC (type 15) | inlA | 77 | II (1/2a) |
| Food | PMSC (type 9) | inlA | 519 | II (1/2c) |
| Human | PMSC (type 14) | inlA | 539 | II (1/2c, 3c) |
| Human, Food, FPE | PMSC (type 3) | inlA | 700 | II (1/2a, 3a; 3c) |
| Food, FPE | PMSC (type 4) | inlA | 9 | II (1/2a, 3a; 1/2c, 3c) |
| Human, Food | PMSC (type 1) | inlA | 606 | I (1/2b, 4b) + II (1/2a, 3a) |
| Human, Food | PMSC (type 6) | inlA | 492 | I (1/2b, 4b) + II (1/2a, 3a) |
| Human, Food, FPE | PMSC (type 12) | inlA | 576 | I (4b) + II (1/2c, 3c) |
| Food | PMSC (type 11) | inlA | 685 | I (1/2b) + II (1/2c) |
| Seafood | PMSC (type 13) | inlA | 527 | n. s. |
| Food (dairy products) | Substitution (9 bp) | inlB | LRR‐region | II (1/2a) |
| Food (dairy products) | Substitution (12 bp) | plcA | 17, 119, 262 | II (1/2a) |
| Human | Deletion (188 bp) | brtA | 79 | II (1/2c) |
| Bovine placenta (abortion) | Deletion | prfA | 701 | II (1/2a, 3a) |
| Pet food | Deletion (1 kb) | prfA | n.s. | II (1/2a) |
| Human, Food | Deletion (105 bp) | actA | n.s. | I (4a, 4b) |
| Multiple sources (mostly non‐clinical) | Mutations, truncations, insertion | prfA, hly | Different positions | I and II |
PI‐PLC: Phosphatidylinositol phospholipase C; AA: Amino acid; PMSC: Premature stop codon; LRR: Leucine‐rich repeat region; n.s.: not specified; FPE: food processing environment.
Appendix G – Summary statistics from the most recent surveys from the EFSA food consumption database
1.
The summary statistics for the three RTE food categories sampled in the EU‐wide BLS extracted from the EFSA food consumption database are provided in this Appendix. Tables G.1, G.2, G.3–G.4 provide the summary statistics from the most recent surveys while Table G.5 provides the comparison between two surveys in the same country for the age group 65–75 years old.
Table G.1.
Means of the median serving sizes (g) in the most recent (1997–2012 as starting date) national surveys from the EFSA food consumption database
| Age group (years) | Fish products | Meat products | Cheese | |||||||||
|---|---|---|---|---|---|---|---|---|---|---|---|---|
| Gravad fish | Smoked fish | Cooked meat | Heat‐treated sausages | Pâté | Soft and semi‐soft cheese | |||||||
| F | M | F | M | F | M | F | M | F | M | F | M | |
| 1–4 | 25 | –a | 22 | 18 | 17 | 17 | 32 | 39 | 18 | 20 | 19 | 18 |
| 5–14 | 45 | 68 | 49 | 48 | 24 | 24 | 44 | 53 | 25 | 24 | 25 | 38 |
| 15–24 | 132 | 101 | 47 | 54 | 31 | 40 | 60 | 73 | 33 | 42 | 38 | 41 |
| 25–44 | 70 | 122 | 49 | 74 | 32 | 40 | 50 | 63 | 36 | 46 | 45 | 39 |
| 45–64 | 89 | 113 | 54 | 76 | 33 | 43 | 52 | 61 | 38 | 42 | 39 | 40 |
| 65–74 | 132 | 162 | 45 | 48 | 33 | 33 | 46 | 56 | 27 | 38 | 28 | 35 |
| ≥ 75 | 154 | 132 | 45 | 65 | 23 | 33 | 54 | 54 | 30 | 34 | 29 | 35 |
F: female; M: male.
There were no servings in this group.
Table G.2.
Means of the 25th percentile of serving sizes (g) in the most recent (1997–2012 as starting date) national surveys from the EFSA food consumption database
| Age group (years) | Fish products | Meat products | Cheese | |||||||||
|---|---|---|---|---|---|---|---|---|---|---|---|---|
| Gravad fish | Smoked fish | Cooked meat | Heat‐treated sausages | Pâté | Soft and semi‐soft cheese | |||||||
| F | M | F | M | F | M | F | M | F | M | F | M | |
| 1–4 | 20 | –a | 17 | 13 | 9 | 11 | 20 | 24 | 12 | 13 | 14 | 14 |
| 5–14 | 45 | 60 | 32 | 35 | 14 | 14 | 29 | 32 | 18 | 17 | 15 | 27 |
| 15–24 | 132 | 89 | 30 | 34 | 21 | 23 | 39 | 35 | 24 | 33 | 29 | 32 |
| 25–44 | 54 | 96 | 29 | 45 | 20 | 24 | 28 | 37 | 27 | 37 | 34 | 28 |
| 45–64 | 57 | 112 | 32 | 50 | 20 | 23 | 29 | 37 | 23 | 33 | 31 | 26 |
| 65–74 | 88 | 74 | 32 | 33 | 24 | 22 | 28 | 36 | 18 | 26 | 19 | 26 |
| ≥ 75 | 154 | 132 | 30 | 39 | 17 | 18 | 36 | 33 | 23 | 22 | 24 | 27 |
F: female; M: male.
There were no servings in this group.
Table G.3.
Means of the 75th percentile of serving sizes (g) in the most recent national surveys (1997–2012 as starting date) from the EFSA food consumption database
| Age group (years) | Fish products | Meat products | Cheese | |||||||||
|---|---|---|---|---|---|---|---|---|---|---|---|---|
| Gravad fish | Smoked fish | Cooked meat | Heat‐treated sausages | Pâté | Soft and semi‐soft cheese | |||||||
| F | M | F | M | F | M | F | M | F | M | F | M | |
| 1–4 | 30 | –a | 32 | 25 | 29 | 32 | 51 | 56 | 23 | 28 | 27 | 24 |
| 5–14 | 45 | 75 | 72 | 73 | 38 | 39 | 69 | 84 | 33 | 38 | 37 | 55 |
| 15–24 | 132 | 113 | 81 | 77 | 47 | 67 | 89 | 125 | 46 | 60 | 47 | 53 |
| 25–44 | 96 | 211 | 89 | 104 | 55 | 67 | 78 | 104 | 51 | 64 | 57 | 57 |
| 45–64 | 148 | 156 | 85 | 121 | 53 | 69 | 81 | 99 | 55 | 62 | 57 | 57 |
| 65–74 | 180 | 165 | 79 | 74 | 49 | 50 | 72 | 91 | 39 | 58 | 41 | 49 |
| ≥ 75 | 154 | 132 | 59 | 84 | 40 | 58 | 83 | 79 | 38 | 52 | 44 | 47 |
F: female; M: male.
There were no servings in this group.
Table G.4.
Mean number of servings per person and year in the EU/EEA based on the mean number of servings per day estimated from the most recent national surveys (1997–2012 as starting date) in the EFSA food consumption database
| Age group (years) | Fish products | Meat products | Cheese | |||||||||
|---|---|---|---|---|---|---|---|---|---|---|---|---|
| Gravad fish | Smoked fish | Cooked meat | Heat‐treated sausages | Pâté | Soft and semi‐soft cheese | |||||||
| F | M | F | M | F | M | F | M | F | M | F | M | |
| 1–4 | 0.63 | 0 | 26 | 28 | 71 | 78 | 95 | 88 | 56 | 59 | 22 | 18 |
| 5–14 | 0.49 | 0.19 | 8.3 | 8.0 | 93 | 99 | 92 | 101 | 36 | 43 | 18 | 17 |
| 15–24 | 1.5 | 2.4 | 14 | 8.8 | 98 | 135 | 58 | 91 | 24 | 35 | 24 | 20 |
| 25–44 | 3.6 | 2.3 | 12 | 13 | 121 | 159 | 67 | 108 | 24 | 41 | 33 | 29 |
| 45–64 | 4.6 | 4.5 | 19 | 22 | 127 | 164 | 73 | 114 | 22 | 39 | 34 | 36 |
| 65–74 | 10 | 7.9 | 37 | 42 | 141 | 168 | 75 | 101 | 29 | 45 | 38 | 44 |
| ≥ 75 | 3.0 | 2.0 | 55 | 87 | 123 | 153 | 70 | 110 | 43 | 65 | 46 | 65 |
F: female; M: male.
Table G.5.
Estimated change in the mean number of servings per person and year for the age group above 65 years old between two survey times for ready‐to‐eat (RTE) food
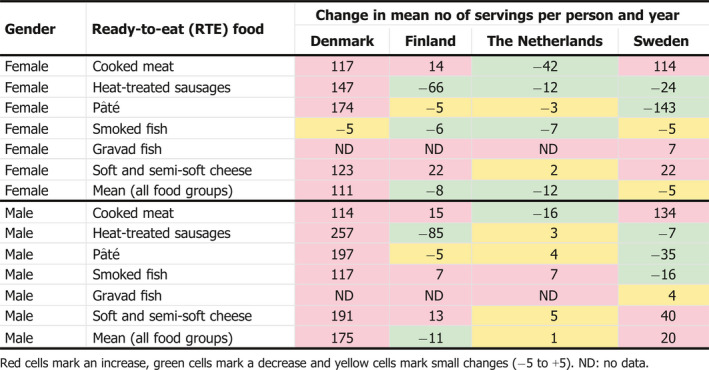
Appendix H – Growth, survival and inactivation of Listeria monocytogenes in food and the food chain
1.
Listeria monocytogenes growth/no‐growth models
Based on microbial responses, expressed as changes in numbers and/or stress tolerance, the combinations of intrinsic and extrinsic environmental determinants to which microorganisms may be exposed, are divided into the domain of growth and the domain of no‐growth which is associated with survival and/or death (inactivation) of microorganisms (Booth, 2002). The conditions that lie between these two domains refer to a zone where microbial responses are uncertain and characterised by the growth/no‐growth interface (Le Marc et al., 2005). This zone is strongly associated with the so‐called cardinal values (T, pH, aw, etc.) for growth which outlines the biokinetic range of microbial proliferation. Such values are species‐ or even strain‐dependent and thus, introduce significant variability in the assessment of the impact of marginal growth conditions on microbial growth, a common issue encountered in quantitative microbiological risk assessment. For instance, van der Veen et al. (2008) demonstrated variability in pH growth limits of 138 strains of L. monocytogenes at various temperatures from 7 to 46°C, at high salt level and in the presence of sodium lactate. More recently, the impact of strain variability on maximum specific growth rates was quantified for twenty different L. monocytogenes strains as a function of pH, aw [NaCl], undissociated lactic acid (HLac) and temperature (T) by (Aryani et al., 2015a). To address growth limit variability in predictive modelling, mathematical models have been proposed that include theoretical growth limiting, cardinal values for critical hurdles, such as temperature, aw, pH, %CO2 and preservatives, as biological meaningful parameters expressed either deterministically as fixed values or stochastically as probability distributions (Sanaa et al., 2004; Ostergaard et al., 2015) or simply as 5–95% prediction intervals of the cardinal parameters in secondary models used to predict μmax (Aryani et al., 2015a). Estimates of cardinal parameters may be obtained from fitting cardinal secondary models to the μmax of different strains in response to the biokinetic range of intrinsic (e.g. pH, aw, organic acids) and extrinsic (e.g. temperature, CO2) variables (Aryani et al., 2015a).
The available probability (growth/no‐growth) models for L. monocytogenes are commonly based on logistic regression (Table H.1). They include polynomial expressions (Koutsoumanis et al., 2004; Mataragas et al., 2006; Gysemans et al., 2007; Skandamis et al., 2007; Vermeulen et al., 2007) or nonlinear equations (Tienungoon et al., 2000; Le Marc et al., 2005) with cardinal parameters, that describe the impact of growth controlling factors, such as temperature, pH, sodium chloride, organic acids and preservatives, on the probability of growth through a logit function. Assessment of the probability of growth in meat, dairy and seafood products has also been carried out through new growth models based on the gamma concept with interaction terms, as detailed in subsequent paragraphs. A few alternative (not based on logistic regression) cardinal growth/no‐growth models are also detailed in Table H.1. For instance, model #12 is based on the assumption that the minimum (cardinal) values for growth as well as the minimum inhibitory concentration (MIC) of preservatives are not independent of the other growth conditions in the food, suggesting the existence of synergistic effects).
Growth models
The most common secondary model types for predicting the microbial growth rate in responses to multiple combined inhibitors are the polynomial models (Dussault et al., 2016), the expanded square root models and the models based on the gamma concept, the latter two which are cardinal parameter models (CPM).
A recent version of polynomial models included sodium nitrite (0–200 ppm), pH (5.53–6.30), sodium chloride (0.51–1.85%), sodium acetate (0–0.74%), sodium lactate syrup (0–2.05%), calcium propionate (0–0.20%) and a blend of nisin and hop alpha acids (0–13.6 ppm) as predictor variables for the growth rate of L. monocytogenes in ham as a model of RTE meat products (Dussault et al., 2016).
The basic idea behind CPMs is to use model parameters that have a biological and/or graphical interpretation. This has the advantage that appropriate starting values are easy to determine when models are fitted to experimental data by non‐linear regression. In addition, the models may be easily adjusted to account for different pathogen‐food combinations by introducing the cardinal values and the maximum specific growth rate at optimum conditions (μopt) of the organisms in the target (e.g. new) food. Given that cardinal values may vary with strain, strain variability can be incorporated into the relevant models by replacing fixed point values with distributions, thereby converting the initial deterministic model into a stochastic one (Ostergaard et al., 2015).
In general, it has been recommended that variability should be quantitatively expressed in risk estimates to the greatest scientifically achievable extent (WHO and FAO, 2007. An assumption frequently made by food microbiologists is that strain‐to‐strain variation of microbial behaviour is equal to or smaller than the experimental variation, and, as such, is not necessary to be determined and characterised (Whiting and Golden, 2002). Nevertheless, intraspecies variability of microbial behaviour may have an important impact on the accuracy of microbiological risk assessment outcomes (Delignette‐Muller and Rosso, 2000).
Strain variability
The inherent differences among identically treated strains of the same species, referred to as ‘strain variability,’ constitute an important source of variability in microbiological studies (Whiting and Golden, 2002). The variability of the growth kinetic behaviour among L. monocytogenes strains has been demonstrated in several studies (Rosenow and Marth, 1987; Junttila et al., 1988; Walker et al., 1990). Barbosa et al. (1994) compared 39 L. monocytogenes strains with respect to their growth potential at 4, 10 and 37°C, and demonstrated a highly strain‐dependent growth behaviour of the pathogen as evaluated based on the estimated values of lag phase, exponential growth rate and generation time. Growth differences among four strains of the organism were also documented in vacuum‐packaged ground beef of normal or high pH stored at 4°C (Barbosa et al., 1995). Avery and Buncic (1997) reported that clinical L. monocytogenes isolates exhibited on average a shorter lag phase compared to meat isolates in culture broth at 37°C, a difference which was even more evident when cultures were previously stored at 4°C under starvation. When growth of 58 L. monocytogenes strains was evaluated in meat broth under different combinations of temperature (10 or 37°C), pH (5.6 or 7.0) and aw (0.960 or 1.00), the observed strain variability of the estimated lag phase was up to a factor of 25 and in growth rates up to a factor of three under the tested conditions (Begot et al., 1997). The findings of subsequent investigations characterising the growth behaviour of L. monocytogenes were similar with regard to strain variability (Buncic et al., 2001; De Jesus and Whiting, 2003; Uyttendaele et al., 2004; Lianou et al., 2006). For instance, De Jesus and Whiting (2003) characterised 21 L. monocytogenes strains with respect to their growth behaviour in culture broth (pH 6.5 and 0.1 M lactate) at 5 or 35°C, and reported considerable strain and, in some cases, intra‐lineage variation; at 5°C, the estimated lag phase values ranged from 0.9 to 4.83 days and growth rate values from 0.33 to 0.59 log units per day. Similarly, as reported by Uyttendaele et al. (2004), the response of L. monocytogenes to suboptimal growth conditions in culture broth (at different combinations of temperature, pH, aw, and NaCl and sodium lactate concentrations) was shown to be strain dependent, while strain variability was also observed when growth of selected strains was evaluated in modified broth simulating conditions associated with cooked ham or pâté. Strain variability was also quantified by (Aryani et al., 2015a), who reported the growth rates of twenty different L. monocytogenes strains as a function of pH, aw [NaCl], undissociated lactic acid (HLac) and temperature (T). In general, the growth variability among strains of L. monocytogenes appears to increase at growth conditions, and particularly temperatures, away from the optimum for this organism, or otherwise close to the growth boundaries (Barbosa et al., 1994; Begot et al., 1997; Lebert et al., 1998; De Jesus and Whiting, 2003; Lianou et al., 2006).
With the newly proposed CPM with interactions (#4b in Table H.1), both the growth rate and the growth/no‐growth interface of L. monocytogenes could be predicted simultaneously by identifying those combinations of growth factors (e.g. pH, aw and T) that result in a psi value (‘ψ’) equal to 1 or higher. The latter is involved in the calculation of the of the model interaction term (‘ξ’) equal to 1 or higher. This concept may be applicable to a variety of foods. The most updated version of the above model (#4b in Table H.1) was presented by Mejlholm et al. (2010), using the values of 1.168, 0.565, 1.168 and 0.742/h for the μopt of meat, seafood, poultry and dairy products, respectively, by the paper of Augustin et al. (2005).
Figure H.1 shows the impact of strain variability for the growth/no‐growth interface and that some strains are capable of growing also at psi‐values greater than one. These effects are more pronounced at 10 than at 4°C. In comparison, the grey shaded area in the figure indicates pH and aw combinations defined in the Regulation (EC) No 2073/2005 as conditions that do not allow growth of L. monocytogenes. This comparison illustrates the importance of taking strain and storage temperature variability as well as model uncertainty into consideration when defining no‐growth conditions.
Figure H.1.
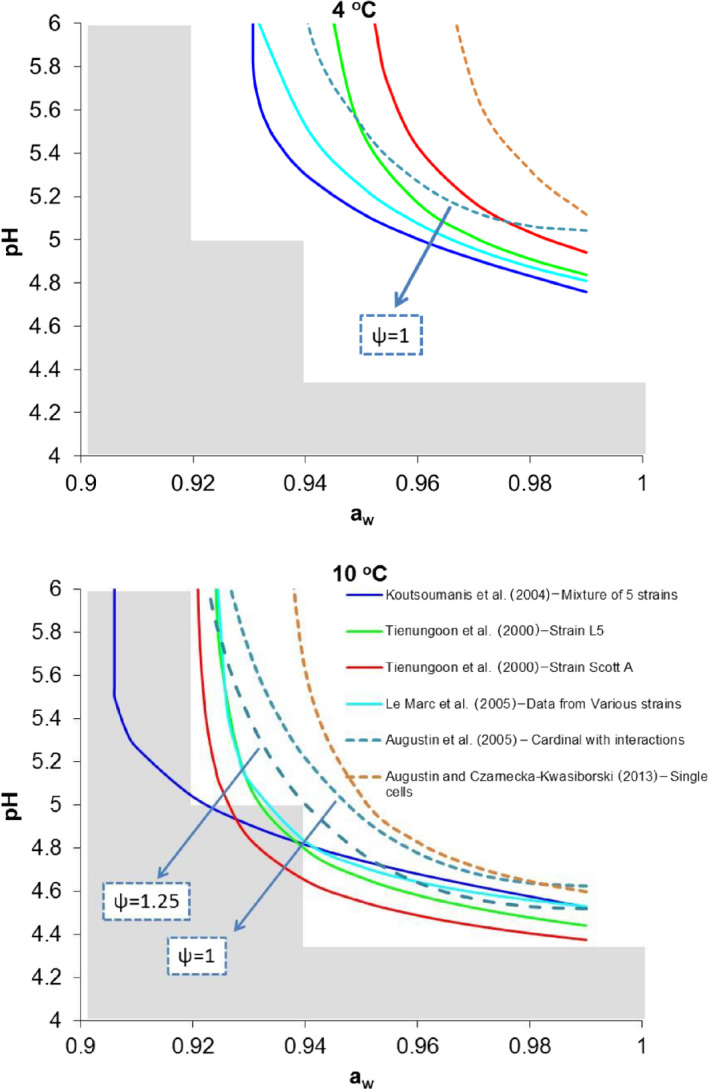
- Note: Psi‐values greater than 1 indicate the predicted no‐growth zone based on a cardinal model with interactions (Augustin et al., 2005). Shaded area indicate pH and aw combination defined in Regulation (EC) No 2073/2005 as conditions that do not allow growth of L. monocytogenes (pH ≤ 4.4 or aw ≤ 0.92, or pH ≤ 5.0 and aw ≤ 0.94).
Cardinal models are easily expandable to account for variability and for the increasing number of factors influencing microbial growth, especially organic acids which are naturally occurring (e.g. lactic acid) or added as preservatives (e.g. organic acid salts). Tables H.2, H.3–H.4 list different reported MIC, optimum specific growth rates and other cardinal parameter values as an illustration on the variability and types of available data.
Table H.2.
Summary or reported minimum inhibitory concentrations of compounds that may inhibit growth of Listeria monocytogenes and that have been proposed for use in cardinal models
| Compound | MIC | Comments – additional information | Reference |
|---|---|---|---|
| Undissociated lactic acid |
5.40 mM 3.79 mM 1.76 mM 8.00 mM 5.1 mM (max. 6.35 mM) |
Median Estimated Estimated at 20°C Estimated 20°C Estimated at 30°C. The 5–95% prediction intervals were 4.2–5.9 mM, representing 20 strains | Augustin and Carlier (2000a) Mejlholm et al. (2010) Zuliani et al. (2007) Le Marc et al. (2002) Aryani et al. (2015a) |
| Undissociated acetic acid |
20.1 mM 10.3 mM 5.83 mM 20.3 mM |
Median Estimated Estimated at 20°C Estimated at 20°C | Augustin and Carlier (2000a) Mejlholm et al. (2010) Zuliani et al. (2007) Le Marc et al. (2002) |
| Undissociated propionic acid | 8.8 mM | Estimated at 20°C | Le Marc et al. (2002) |
| Undissociated citric acid | 1.6 mM | Median | Augustin and Carlier (2000a)) |
| Potassium sorbate |
5.1 mM 4.31 mM |
SingleMean | Augustin and Carlier (2000a) Zuliani et al. (2007) |
| Sodium benzoate | 0.7 mM | Single | Augustin and Carlier (2000a) |
| Sodium diacetate | 4.8 mM | Estimated at 8°C | Mejlholm and Dalgaard (2009) |
| 0.25% | At 4°C, 2.5% NaCl, anaerobic conditions | Skandamis et al. (2007) | |
| 0.3–0.5% | At 4°C and 0.5%, or aerobic conditions, or > 4°C | ||
| NO2 |
11.4 μΜ 25.0 μΜ 7.61 μΜ 54.2 μΜ |
Median Mean Equals to 350 ppm Median | Augustin and Carlier (2000a) Augustin et al. (2005) Mejlholm et al. (2005) Augustin and Carlier (2000b) |
| Sodium lactate | 5.95% | Fitted | Devlieghere et al. (2001) |
| 4–5% | At 4°C, 2.5% NaCl, anaerobic conditions | Skandamis et al. (2007) | |
| > 6% | At 4°C and 0.5%, or aerobic conditions, or > 4°C | ||
| Phenol |
31.9 ppm 28.1 ppm 12.5 ppm 32.0 ppm |
Fitted (smoked salmon) | Augustin et al. (2005) Gimenez and Dalgaard (2004) Mejlholm and Dalgaard (2007) Augustin and Carlier (2000a) Mejlholm et al. (2010) |
| CO2 |
3.04% 1.64% 5.08% |
Partial pressure of CO2 above atmospheric Proportion Proportion | Augustin et al. (2005) Augustin and Carlier (2000a) Augustin and Carlier (2000b) |
| 3,140 ppm | Dissolved CO2 at equilibrium | Mejlholm and Dalgaard (2007); Mejlholm et al. (2010) |
MIC: minimum inhibitory concentration.
Table H.3.
Reported optimum or reference specific growth rates (h−1) used in cardinal growth models
| Cardinal parameter | Value | Concomitant variables or associated foods | Reference |
|---|---|---|---|
| μopt | 1.14 | 30°C, pH 7.0 | Le Marc et al. (2002) |
| μopt | 0.85 | pH 7.1, Topt = 37°C, aw = 0.997 | Zuliani et al. (2007) |
| μopt | 0.700 | Dairy | Augustin and Carlier (2000a) |
| 1.318 | Meats | ||
| 1.061 | Seafoods | ||
| μopt | 0.742 | Dairy | Augustin et al. (2005) |
| 1.168 | Meat | ||
| 0.565 | Seafoods | ||
| μref | 0.419 | Seafood at 25°C | Mejlholm et al. (2010) |
| 1.056 | Median | Augustin and Carlier (2000b) | |
| μref | 0.99 | Milk and ham at 30°C | Aryani et al. (2015a) |
aw: water activity.
Table H.4.
Reported cardinal values for growth of Listeria monocytogenes
| Parameter | Value | Additional information | Reference |
|---|---|---|---|
| Tmin | −2.0 | Fitted | Le Marc et al. (2005) |
| −2.7 | Median | Augustin and Carlier (2000b) | |
| −3.0 | Median | Augustin and Carlier (2000b) | |
| −1.72 | Median | Augustin et al. (2005) | |
| −4.5 | Fitted | Le Marc et al. (2002) | |
| −2.83 | Fitted (seafood) | Mejlholm et al. (2010) | |
| −2.3 | Fitted (seafood) | Mejlholm and Dalgaard (2007) | |
| −1.623a; 0.4164b | Fitted | Tienungoon et al. (2000) | |
| −2.2 | Fitted: 5–95% prediction intervals for 20 strains were −3.3 to −1.1 | Aryani et al. (2015a) | |
| Topt | 37 | All sources | |
| 37.4 | Fitted | Le Marc et al. (2002) | |
| Tmax | 45.5 | All sources | |
| pHmin (acetic acid) | 4.79 | Median | Augustin and Carlier (2000b) |
| pHmin (lactic acid) | 4.54 | Median | Augustin and Carlier (2000b) |
| 4.71 | Mean | Augustin et al. (2005) | |
| 4.97 | Fitted | Mejlholm et al. (2010) | |
| pHmin (citric acid) | 4.37 | Median | Augustin and Carlier (2000b) |
| pHmin (propionic acid) | 5.0 | Median | Augustin and Carlier (2000b) |
| pHmin (malic acid) | 4.4 | Median | Augustin and Carlier (2000b) |
| pHmin HCl | 4.38 | Median | Augustin and Carlier (2000b) |
| 4.26 | Mean | Augustin et al. (2005) | |
| 4.21 | Fitted | Le Marc et al. (2002) | |
| 4.20 | Fitted | Le Marc et al. (2005) | |
| 3.350 | Fitted | Tienungoon et al. (2000) | |
| 4.5 | Fitted: 5–95% prediction intervals for 20 strains were 4.4–4.7 | Aryani et al. (2015a) | |
| pHmin (various studies) | 4.55 | Median | Augustin and Carlier (2000a) |
| pHopt | 7.1 | All sources | |
| 7.21 | Fitted | Le Marc et al. (2002) | |
| pHmax | 9.61 | Median | Augustin and Carlier (2000a) |
| pHmax | 9.61 | Median | Augustin and Carlier (2000a) |
| 10.07 | Fitted | Le Marc et al. (2002) | |
| NaClmax | 2 mM | Fitted: 5–95% prediction intervals for 20 strains were 1.8–2.1 | Aryani et al. (2015a) |
| aw,min (NaCl) | 0.915 | Fitted | Le Marc et al. (2005) |
| 0.914 | Fitted | Tienungoon et al. (2000) | |
| 0.913 | Mean | Augustin et al. (2005) | |
| 0.910 | Median | Augustin and Carlier (2000a) | |
| aw,min (glycerol) | 0.888 | Median | Augustin and Carlier (2000b) |
| aw,min (sucrose) | 0.918 | Median | Augustin and Carlier (2000b) |
| aw,min (propylene glycol) | 0.930 | Median | Augustin and Carlier (2000b) |
| aw,min (drying) | 0.949 | Median | Augustin and Carlier (2000b) |
| aw,min | 0.923 | Fitted | Mejlholm et al. (2010) |
| aw,optaw,max | 0.997 | Arbitrary | Augustin and Carlier (2000a) |
| 1.000 | Mean | Augustin and Carlier (2000a) |
strain L5.
strain Scott A.
The inhibitory effect of organic acids is mainly a result of the presence of the acids in the water phase in the undissociated protonated form, and to some extent to acidification (pH‐reducing potential). At lower pH values, the concentration of the undissociated form is higher than at high pH values (where the acid may be fully dissociated). As a result, the effect of organic acids is generally higher at lower pH values. The MIC values of L. monocytogenes to various organic acids is shown to be strain‐ and pH‐dependent, especially close to the growth limiting pH (e.g. < 4.8), with the highest observed variation, being almost 9.0 mM (Wemmenhove et al., 2016). Wemmenhove et al. (2016) reported average MICs of undissociated lactic, acetic, citric, and propionic acid of 5.0 ± 1.5 mM, 19.0 ± 6.5 mM, 3.8 ± 0.9 mM, and 11.0 ± 6.3 mM, respectively, for six L. monocytogenes strains tested in a pH range of 5.2 to 5.6. The magnitude of MIC of undissociated lactic acid in the latter pH range was a higher than at pH 4.6 where the pH is very close to the minimum pH at which growth can occur. In the study by (Aryani et al., 2015a), the maximum concentration of undissociated acid was established for 20 strains of L. monocytogenes as 5.1 mM, with a 5–95% prediction interval (PI) of 4.2–5.9 mM, and the average minimum pH was 4.5 (PI 4.4–4.7).
Impact of food microflora on growth of Listeria monocytogenes
Most foods are complex with a heterogeneous microbial population. In the natural pursuit of growth and survival, interactions with either negative, neutral or positive effects on growth and survival may occur between different strains and species. For instance, L. monocytogenes present a different growth behaviour when inoculated in sterile meat than in natural contaminated meat (Marshall et al., 1992). In the latter case, growth of pseudomonads stimulates this pathogen. The hydrolysis of proteins, which could provide free amino acids, has been considered as a likely explanation for the stimulus of L. monocytogenes growth by pseudomonads. Conversely, the growth of L. monocytogenes is known to be negatively affected by the competitive growth of lactic acid bacteria, naturally present as indigenous (spoilage) microbiota or added as starter or aroma cultures in dairy products (Ostergaard et al., 2014). The proposed mathematical approaches to model the interaction between lactic acid bacteria and L. monocytogenes are mainly based on the Jameson effect model or the Lotka‐Volterra competition model (Cornu et al., 2011), which consider that the growth of the pathogen starts to be affected (retarded or even halted but rarely stimulated) as the population of lactic acid bacteria (or of the competitor in general) approaches a critical level, that is close to stationary phase of growth. Such an approach has been successfully applied to model L. monocytogenes growth in processed seafood, mayonnaise‐based seafood salads pork products and cottage cheese, both at constant and fluctuation temperatures, deterministically and stochastically (Gimenez and Dalgaard, 2004; Cornu et al., 2011; Ostergaard et al., 2014; Mejlholm and Dalgaard, 2015).
Limited information is available about the relation between growth of pathogens (safety) and spoilage (shelf life) of foods. In most microbiological risk assessments published up now, spoilage is not taken into account. Ignoring spoilage, however, may lead to erroneous estimations of risk because conditions leading to critical levels of the hazard usually favour spoilage. For example, abusive storage temperatures increase the probability of high concentrations of a pathogen at the time of consumption but also reduce the probability of consumption since spoilage is more likely to occur and prevent consumer from being exposed by functioning as warning of unacceptable products (Koutsoumanis, 2009). Thus, being able to consider the impact of products wasted by the consumers due to evident spoilage at the time of consumption, on the exposure to L. monocytogenes would lead to more realistic risk assessments.
Food structure and composition
The chemical composition and structure of food (e.g. liquid vs solid foods, planktonic growth vs surface growth) is a crucial determinant of microbial growth and survival.
Furthermore, the microstructure of the food matrix can affect the growth of a colony by imposing physical restraints on microorganisms, by limiting the diffusion of essential nutrients and oxygen or by preventing the diffusion of metabolic products (Robins and Wilson, 1994). Microbial growth in liquid laboratory media, in which most of the existing models have been developed, can differ significantly from growth on a solid food since in the latter the rates of diffusion of molecules are lower, the nutrients around a microcolony are utilised rapidly and not quickly replaced, while metabolites diffuse away slowly from the colony. If bacteria are suspended in liquids, their growth is planktonic and the motility of microorganisms may enable taxis to certain nutrient‐rich sites of the food (Wilson et al., 2002).
Growth and survival of pathogens in foods can also be different than growth on meat surface due to oxygen availability while fat concentration is an additional parameter that may affect microbial behaviour on meat products. If bacteria are growing in structured aqueous phase, e.g. due to addition of thickeners, or gelling (structure‐inducing) agents, such as gelatin, pectins, starch, gums, etc., microbial cells are immobilised within the gelled regions and constrained to grow as submerged colonies in three dimensions. Their growth rates as colonies tend to be lower than that of planktonically growing cells (Wilson et al., 2002; Theys et al., 2008; Aspridou et al., 2014; Boons et al., 2014; Skandamis and Jeanson, 2015). This can be further enhanced by increasing the fat concentration on the expense of water phase, thereby increasing the size of oil droplets.
If bacteria are growing on the surface of foods, such as meat and vegetables, growth is also colonial, initially in two dimensions (mono‐layer), whereas the centre of colony gradually develops in the third dimension most likely upward, depending on aeration and nutrient availability (Skandamis and Jeanson, 2015). Replenishment of nutrients takes place only from the bottom or the perimeter of the colony and soon cells in the centre of colony experience starvation and self‐toxication. This places growth constraints to the surface colony as a whole and causes suppression of the growth rate as compared to submerged growth within the food matrix or planktonic growth.
Impact of stresses and shifts in the environment on lag time of Listeria monocytogenes
The number of models for the growth rate of L. monocytogenes is markedly higher than that for lag time. Lag time depends on current growth conditions and on cell ‘history’, which defines the capacity of the organism to adapt and re‐grow in the new environment.
In physiological terms, lag represents a transition period during which cells adjust to their new environment. Possible causes of lag could be change in nutrition, change in physical environment, presence of an inhibitor and state of the inoculum. Despite the numerical definition of the lag time as a time period (e.g. in min, h or days), from a biological (mechanistic) standpoint it represents the physiological state of cells (termed ‘qo’ in the well‐known Baranyi model; (Baranyi et al., 1995)) entering a new environment. The most common approach for introducing lag time in growth models is to describe it as a function of a unitless variable representing the adaptation work that is the work needed so that cells enter the exponential phase. This work has been termed ‘work‐to‐be‐done’ or ‘relative lag time’ (also termed ‘ho’ in the Baranyi model).
Many studies have demonstrated the effect of pre‐incubation conditions (composition of the medium, temperature, pH, aw etc.) on the lag duration of a number of pathogens and recent reports quantitatively describe the impact of up‐ and down‐ shifts in salinity and pH on the lag time of L. monocytogenes (Le Marc et al., 2010; Belessi et al., 2011b). Another situation that may strongly impact the physiological state of cells is their life within a biofilm. Detachment of such cells from the biofilm and translocation to a food (e.g. due to contamination) may be sensed as a shift in the environment and thus, induce lag time. Attached cells may be subjected to a metabolic repression that makes them behave more as stationary phase cells, when they are dislodged from surfaces, compared to those cells that had never been attached (Poimenidou et al., 2009; Belessi et al., 2011a).
Belessi et al. (2011b) reported that the lag time increased with osmotic downshifts, as well as by pH downshift from optimum to 5.1. Conversely, any type of shift within pH 5.5–7.2 did not markedly affect the lag times of L. monocytogenes. The longer the cells were incubated at no‐growth aw (0.90), the faster they initiated growth subsequently, suggesting adaptation to osmotic stress. Conversely, extended habituation at pH 4.9 had the opposite effect on subsequent growth of L. monocytogenes. These results suggest that there is an adaptation or injury rate induced at conditions inhibiting the growth of the pathogen. Therefore, exposure at no‐growth conditions may also trigger adaptation phenomena, which could enhance or impair growth of the bacterium upon subsequent transfer to growth‐supporting conditions.
Single cell heterogeneity
Population‐wise, not all cells of a genetically homogeneous population are capable of initiating growth simultaneously when they experience a shift in growth conditions. This implies the existence of individual cell heterogeneity and suggests that a fraction of cells continues to grow unaffected by the shift (e.g. see the definition of the ‘ao’ value of the Baranyi model), while the remaining population will gradually enter the exponential phase with the lag time of individual cells following probability distributions (Francois et al., 2006; Guillier and Augustin, 2006; Koutsoumanis and Lianou, 2013).
Traditional predictive microbiology uses deterministic mathematical models which describe the growth of large microbial populations as a whole without considering the variability in responses of individual cells. Koutsoumanis and Lianou (2013) showed that as a result of the heterogeneity in cell division time, growth of single cells or small microbial populations presents a high variability, and can be considered as a pool of events each one of which has its own probability to occur. In addition, the apparent variability in population growth gradually decreases with increasing the number of cells of this population at the beginning of incubation (time 0). A significant heterogeneity has been also observed in the ability of individual cells to initiate growth. Aguirre and Koutsoumanis (2016) showed that the aw growth limits of L. monocytogenes individual cells varied from 0.940 to 0.997 and 0.951 to 0.997 for unheated and heat stressed cells, respectively. Due to the variability in the growth limits of individual cells, stressful conditions result in the presence of a non‐growing fraction within the bacterial population which results in a longer apparent lag time and an increased variability in the population growth.
The importance of single cell variability was raised after the recent developments in quantitative microbiological risk assessment. Deterministic models which provide point estimates are generally not sufficient to satisfactorily inform management of microbial safety risks. Indeed, if, for instance, the consequences of unacceptable levels of pathogenic microorganisms in a food are grave, knowledge only of the mean population growth is unlikely to be a sufficient basis for management decisions on the safety risk. Since contamination with pathogens usually occurs with very low numbers, the development of stochastic approaches that can describe the variability of single cell behaviour is necessary for realistic estimations of safety risks.
Modelling inactivation/survival of Listeria monocytogenes
Inactivation may be the result of heat (thermal) or non‐thermal inimical factors, such as low pH (< 4.0), low aw (< 0.90), high hydrostatic pressure or a lethal combination of those. Fewer inactivation models than growth models have been reported and in Table H.5, an overview of the available inactivation models for L. monocytogenes is provided. Meta‐analysis of existing (scattered) inactivation data over the last 20 years has assisted in modelling thermal inactivation of L. monocytogenes in various foods with different intrinsic properties and over a wide temperature range. van Lieverloo et al. (2013) investigated the thermal inactivation of L. monocytogenes in liquid food products by means of multiple regression models, taking into account 51 different strains of the pathogen and 6 cocktails of strains. The food products assayed were dairy (milk, cream, butter), fruit and vegetable juices, liquid eggs and meat gravy. The purpose of the work was to develop a model that could predict thermal inactivation of the pathogen while accounting for effects of food composition (pH, sodium chloride, sugar) and processing conditions (storage temperature, heat shock). The authors demonstrated that multiple regression modelling can be used effectively to predict the inactivation of the pathogen with a limited and realistic uncertainty level while retaining the variability of heat resistance observed among all strains assayed.
Recently, single or double Weibull inactivation models (Mafart et al., 2002; Coroller et al., 2006) have become increasingly popular. This is due to their capacity to fit all types of inactivation curves, including linear and non‐linear, convex or concave, thus, describing curves with shoulder, tail and double inactivation phases. They are based on the alternative hypothesis that microbial inactivation is a cumulative form of a temporal distribution of lethal events that represent the spectrum of resistances of the treated microbial population to the lethal agent (Peleg and Penchina, 2000).
Since most RTE foods of concern for listeriosis are commonly contaminated post‐processing, the non‐thermal inactivation is an important trend that needs to be quantified in order to estimate the likely dose reaching the consumer in the context of QMRA.
Non‐thermal inactivation
Non‐thermal inactivation is usually the result of the single or combined effect of low pH (< 4.5) or aw (< 0.90) and moisture (< 60%) at refrigeration or ambient temperatures in the presence or not of preservative agents close to their minimum inhibitory concentration (MIC). Such conditions may be encountered in various RTE foods, mainly involving fermentation or ripening/drying, such as fermented meat and cheese. Although the lethality is attributed to heat‐independent factors, temperature values within the bio‐kinetic range of growth from the minimum (suboptimal, 0–5°C) to the maximum (super‐optimal: 45–47°C) value for growth, remain the factor governing the non‐thermal inactivation rate of bacteria (Shadbolt et al., 1999; Ross et al., 2008; McQuestin et al., 2009; Zhang et al., 2010b). The latter studies sufficiently demonstrated this concept for non‐thermal inactivation of E. coli and L. monocytogenes at pH (3.5 to 5.1) and aw (0.76 to 0.94) combinations commonly applying to various dry and fermented meats.
The work of Coroller et al. (2012) presents a modelling approach for non‐thermal inactivation based on the gamma hypothesis that predicts the global behaviour of L. monocytogenes in various media. The proposed model postulates that only two microbial responses can be observed: growth or inactivation. When the maximum growth rate (as estimated from the gamma concept) is greater than zero, microbial growth is predicted. When the maximum growth rate is equal to zero, then the bacterial population is inactivated. The underlying principle is that growth, survival or inactivation of microorganisms are time‐dependent and it can be reasonably postulated that if the microbial behaviour was observed in static conditions for an infinite time period, only growth or inactivation would be observed. A microbial population would therefore be characterised by either slow growth or slow inactivation and the concept of infinite lag would have no meaning in this context. The environmental factors of interest are commonly temperature, pH, sodium chloride salt, aw and commonly encountered organic acids such as sorbic acid, lactic acid and acetic acid. For further application in an industrial set up, the modelling approach of Coroller et al. (2012) had to meet the additional requirements which are described in Coroller et al. (2012).
Appendix I – Results from the outsourcing activity to risk assessment
1.
Table I.1.
Number of human listeriosis cases per million servings associated to the scenarios in RTE food subcategories
| Scenarios | Population subgroups | ||
|---|---|---|---|
| Healthy | Elderly | Pregnant | |
| Cold‐smoked fish | |||
| ROP/sliced | 5.74 × 10⁻⁴ (4.36 × 10⁻⁴, 7.11 × 10⁻⁴) | 4.37 × 10⁻³ (3.32 × 10⁻³, 5.42 × 10⁻³) | 1.27 × 10⁻¹ (9.68 × 10⁻², 1.58 × 10⁻¹) |
| ROP/non‐sliced | 6.88 × 10⁻⁴ (4.13 × 10⁻⁴, 1.05 × 10⁻³) | 5.24 × 10⁻³ (3.15 × 10⁻³, 8.04 × 10⁻³) | 1.53 × 10⁻¹ (9.16 × 10⁻², 2.34 × 10⁻¹) |
| Normal/sliced | 4.19 × 10⁻⁴ (3.19 × 10⁻⁴, 5.20 × 10⁻⁴) | 6.46 × 10⁻³ (4.91 × 10⁻³, 8.01 × 10⁻³) | 7.89 × 10⁻² (6.00 × 10⁻², 9.78 × 10⁻²) |
| Normal/non‐sliced | 5.03 × 10⁻⁴ (3.02 × 10⁻⁴, 7.71 × 10⁻⁴) | 7.72 × 10⁻³ (4.63 × 10⁻³, 1.18 × 10⁻²) | 9.46 × 10⁻² (5.68 × 10⁻², 1.45 × 10⁻¹) |
| Hot‐smoked fish | |||
| ROP/sliced | 3.26 × 10⁻⁶ (2.01 × 10⁻⁶, 5.02 × 10⁻⁶) | 3.72 × 10⁻⁵ (2.29 × 10⁻⁵, 5.73 × 10⁻⁵) | 2.96 × 10⁻⁴ (1.82 × 10⁻⁴, 4.55 × 10⁻⁴) |
| ROP/non‐sliced | 1.51 × 10⁻⁶ (7.53 × 10⁻⁷, 2.76 × 10⁻⁶) | 1.72 × 10⁻⁵ (8.59 × 10⁻⁶, 3.15 × 10⁻⁵) | 1.37 × 10⁻⁴ (6.83 × 10⁻⁵, 2.50 × 10⁻⁴) |
| Normal/sliced | 9.89 × 10⁻⁷ (4.94 × 10⁻⁷, 1.81 × 10⁻⁶) | 1.36 × 10⁻⁵ (6.78 × 10⁻⁶, 2.48 × 10⁻⁵) | 7.48 × 10⁻⁵ (3.74 × 10⁻⁵, 1.37 × 10⁻⁴) |
| Normal/non‐sliced | 2.14 × 10⁻⁶ (1.32 × 10⁻⁶, 3.30 × 10⁻⁶) | 2.94 × 10⁻⁵ (1.81 × 10⁻⁵, 4.52 × 10⁻⁵) | 1.62 × 10⁻⁴ (9.97 × 10⁻⁵, 2.49 × 10⁻⁴) |
| Gravad fish | |||
| ROP/sliced | 5.27 × 10⁻³ (3.44 × 10⁻³, 7.33 × 10⁻³) | 5.86 × 10⁻² (3.82 × 10⁻², 8.16 × 10⁻²) | 1.13 × 100 (7.35 × 10⁻¹, 1.57 × 100) |
| ROP/non‐sliced | 4.58 × 10⁻⁴ (2.16 × 10⁻³, 3.66 × 10⁻³) | 5.10 × 10⁻³ (6.85 × 10⁻², 4.08 × 10⁻²) | 9.80 × 10⁻² (5.08 × 10⁻¹, 7.84 × 10⁻¹) |
| Normal/sliced | 3.72 × 10⁻³ (2.42 × 10⁻³, 5.17 × 10⁻³) | 3.73 × 10⁻² (2.44 × 10⁻², 5.20 × 10⁻²) | 1.09 × 100 (7.09 × 10⁻¹, 1.51 × 100) |
| Normal/non‐sliced | 3.23 × 10⁻⁴ (2.30 × 10⁻³, 2.59 × 10⁻³) | 3.25 × 10⁻³ (6.90 × 10⁻², 2.60 × 10⁻²) | 9.46 × 10⁻² (5.10 × 10⁻¹, 7.57 × 10⁻¹) |
| Cooked meat | |||
| ROP/sliced | 6.19 × 10⁻⁴ (3.09 × 10⁻⁴, 9.28 × 10⁻⁴) | 1.48 × 10⁻² (7.41 × 10⁻³, 2.22 × 10⁻²) | 4.23 × 10⁻¹ (2.11 × 10⁻¹, 6.34 × 10⁻¹) |
| ROP/non‐sliced | 6.25 × 10⁻⁴ (3.79 × 10⁻⁴, 1.87 × 10⁻³) | 1.49 × 10⁻² (2.72 × 10⁻⁴, 4.47 × 10⁻²) | 4.19 × 10⁻¹ (1.59 × 10⁻², 1.26 × 100) |
| Normal/sliced | 6.29 × 10⁻⁴ (3.14 × 10⁻⁴, 9.43 × 10⁻⁴) | 1.48 × 10⁻² (7.39 × 10⁻³, 2.22 × 10⁻²) | 4.17 × 10⁻¹ (2.09 × 10⁻¹, 6.26 × 10⁻¹) |
| Normal/non‐sliced | 6.16 × 10⁻⁴ (3.29 × 10⁻⁴, 1.85 × 10⁻³) | 1.48 × 10⁻² (2.80 × 10⁻⁴, 4.43 × 10⁻²) | 4.17 × 10⁻¹ (1.59 × 10⁻², 1.25 × 100) |
| Sausage | |||
| ROP/sliced | 1.42 × 10⁻³ (7.11 × 10⁻⁴, 2.84 × 10⁻³) | 1.62 × 10⁻² (8.12 × 10⁻³, 3.25 × 10⁻²) | 4.04 × 10⁻¹ (2.02 × 10⁻¹, 8.17 × 10⁻¹) |
| ROP/non‐sliced | 7.25 × 10⁻⁴ (1.96 × 10⁻⁵, 2.90 × 10⁻³) | 8.26 × 10⁻³ (2.43 × 10⁻³, 3.30 × 10⁻²) | 2.07 × 10⁻¹ (8.51 × 10⁻³, 8.28 × 10⁻¹) |
| Normal/sliced | 1.42 × 10⁻³ (7.08 × 10⁻⁴, 2.83 × 10⁻³) | 1.61 × 10⁻² (8.04 × 10⁻³, 3.22 × 10⁻²) | 4.04 × 10⁻¹ (2.02 × 10⁻¹, 8.08 × 10⁻¹) |
| Normal/non‐sliced | 7.14 × 10⁻⁴ (1.96 × 10⁻⁵, 2.86 × 10⁻³) | 8.17 × 10⁻³ (2.43 × 10⁻³, 3.27 × 10⁻²) | 2.04 × 10⁻¹ (8.51 × 10⁻³, 8.15 × 10⁻¹) |
| Pâté | |||
| ROP/sliced | 1.67 × 10⁻⁴ (7.55 × 10⁻⁵, 4.42 × 10⁻⁴) | 1.15 × 10⁻³ (5.19 × 10⁻⁴, 6.72 × 10⁻³) | 3.03 × 10⁻² (1.37 × 10⁻², 1.33 × 10⁻¹) |
| ROP/non‐sliced | 2.20 × 10⁻³ (2.14 × 10⁻⁵, 6.60 × 10⁻³) | 6.27 × 10⁻³ (1.47 × 10⁻³, 1.64 × 10⁻²) | 6.54 × 10⁻¹ (3.88 × 10⁻², 1.96 × 100) |
| Normal/sliced | 4.45 × 10⁻³ (1.78 × 10⁻³, 8.45 × 10⁻³) | 6.76 × 10⁻² (2.71 × 10⁻², 1.29 × 10⁻¹) | 1.32 × 100 (5.29 × 10⁻¹, 2.51 × 100) |
| Normal/non‐sliced | 2.19 × 10⁻³ (2.20 × 10⁻⁵, 6.58 × 10⁻³) | 3.20 × 10⁻² (1.47 × 10⁻³, 9.59 × 10⁻²) | 6.25 × 10⁻¹ (3.88 × 10⁻², 1.95 × 100) |
| Soft and semi‐soft cheese | |||
| Sliced | 2.04 × 10⁻⁵ (4.39 × 10⁻⁶, 7.84 × 10⁻⁵) | 1.15 × 10⁻⁴ (4.49 × 10⁻⁵, 9.78 × 10⁻⁴) | 1.98 × 10⁻³ (7.69 × 10⁻⁴, 1.40 × 10⁻²) |
| Non‐sliced | 1.11 × 10⁻⁵ (5.27 × 10⁻⁶, 2.01 × 10⁻⁵) | 6.27 × 10⁻⁵ (2.98 × 10⁻⁵, 1.14 × 10⁻⁴) | 1.07 × 10⁻³ (5.10 × 10⁻⁴, 1.95 × 10⁻²) |
ROP: reduced oxygen packaging. Numbers outside brackets represent 50th percentile; numbers between brackets represent 2.5 and 97.5th percentiles reflecting mostly the variability of the estimated number of cases per 1 million servings.
Appendix J – Uncertainty analysis of the Listeria monocytogenes generic quantitative microbiological risk assessment (gQMRA) model
1.
Suggested citation: EFSA BIOHAZ Panel (EFSA Panel on Biological Hazards) , Ricci A, Allende A, Bolton D, Chemaly M, Davies R, Fernández Escámez PS, Girones R, Herman L, Koutsoumanis K, Nørrung B, Robertson L, Ru G, Sanaa M, Simmons M, Skandamis P, Snary E, Speybroeck N, Ter Kuile B, Threlfall J, Wahlström H, Takkinen J, Wagner M, Arcella D, Da Silva Felicio MT, Georgiadis M, Messens W and Lindqvist R, 2018. Scientific Opinion on the Listeria monocytogenes contamination of ready‐to‐eat foods and the risk for human health in the EU. EFSA Journal 2018;16(1):5134, 173 pp. 10.2903/j.efsa.2018.5134
Requestor: EFSA
Question number: EFSA‐Q‐2015‐00597
Panel members: Ana Allende, Declan Bolton, Marianne Chemaly, Robert Davies, Pablo Salvador Fernández Escámez, Rosina Girones, Lieve Herman, Kostas Koutsoumanis, Roland Lindqvist, Birgit Nørrung, Antonia Ricci, Lucy Robertson, Giuseppe Ru, Moez Sanaa, Marion Simmons, Panagiotis Skandamis, Emma Snary, Niko Speybroeck, Benno Ter Kuile, John Threlfall and Helene Wahlström.
Acknowledgements: The Panel wishes to thank the hearing experts: Andrew Hart and Sophie Roussel for the support provided to this scientific output. The Panel also wishes to thank the consortia of the three outsourcing activities under ‘Closing gaps for performing a risk assessment on L. monocytogenes in RTE foods’ for their collaboration. In addition, Régis Pouillot is thanked for sharing the dose response model as described in Pouillot et al. (2015). Also the epidemiologists and microbiologists of the nominated public health contact points for listeriosis and Listeria isolates in the European Food‐ and Waterborne Diseases and Zoonoses network (FWD‐Net) are thanked for replying to the questionnaire related to the surveillance of listeriosis.
Adopted: 6 December 2017
Reproduction of the images listed below is prohibited and permission must be sought directly from the copyright holder: Figure 14: © Emerald Group Publishing Limited all rights reserved. Marklinder I and Eriksson MK, British Food Journal, 117, 6, 1764–1776.
This publication is linked to the following EFSA Supporting Publications article: http://onlinelibrary.wiley.com/doi/10.2903/sp.efsa.2018.EN-1352/full
Notes
Commission Regulation (EC) No 2073/2005 of 15 November 2005 on microbiological criteria for foodstuffs. OJ L 338, 22.12.2005, p. 1–26.
Commission Decision of 5 November 2010 concerning a financial contribution from the Union towards a coordinated monitoring programme on the prevalence of Listeria monocytogenes in certain ready‐to‐eat foods to be carried out in the Member States (2010/678/EU). OJ L 292, 10.11.2010, p. 40–54.
These activities were ongoing at the moment of launching the mandate.
Commission Regulation (EC) No 2073/2005 of 15 November 2005 on microbiological criteria for foodstuffs. OJ L 338, 22.12.2005, 26 pp.
According to the draft Guidance on Uncertainty in EFSA Scientific Assessment (EFSA Scientific Committee, 2016), an assessment question is ‘a question to be addressed by an assessment. Assessment questions may be quantitative (estimation of a quantity) or categorical (e.g. yes/no questions). Many questions may usefully be divided into subquestions for assessment.’
Decision No 1082/2013/EC of the European Parliament and of the Council of 22 October 2013 on serious cross‐border threats to health and repealing Decision No 2119/98/EC. OJ L 293, 5.11.2013, p. 1–15.
Commission implementing Decision of 8 August 2012 amending Decision 2002/253/EC laying down case definitions for reporting communicable diseases to the Community network under the Decision No 2119/98/EC of the European Parliament and of the Council (2012/506/EU). OJ L 262, 29.9.2012, p. 1–57.
Directive 2003/99/EC of the European Parliament and of the Council of 17 November 2003 on the monitoring of zoonoses and zoonotic agents, amending Council Decision 90/424/EEC and repealing Council Directive 92/117/EEC. OJ L 325, 12.12.2003, p. 31–40.
Regulation (EU) No 1260/2013 of the European Parliament and of the Council of 20 November 2013 on European demographic statistics. OJ L 330/39, 10.12.2013.
Commission Regulation (EU) No 16/2011 of 10 January 2011 laying down implementing measures for the Rapid alert system for food and feed. OJ L 6, 11.1.2011, p. 7–10.
Hierarchical system based on 20 main food categories that are further divided into subgroups up to a maximum of four levels.
FAO. ©2016. Fishery and Aquaculture Statistics. Global Fisheries commodities production and trade 1976‐2013 (FishstatJ). In: FAO Fisheries and Aquaculture Department [online or CD‐ROM]. Rome. Updated 2016. http://www.fao.org/fishery/statistics/software/fishstatj/en
TESSy data as of 20 December 2016.
‘RTE fish,’ ‘RTE meat’ and ‘RTE fish,’ according to specifications from the EU‐wide baseline survey.
References
- ACMSF (Advisory Committee on the Microbiological Safety of Food), 2009a. Ad hoc group on vulnerable groups. Report on the increased incidence of listeriosis in the UK. Food Standards Agency, 92 pp. FSA/1439/0709. Available online: https://www.food.gov.uk/sites/default/files/multimedia/pdfs/committee/acmsflisteria.pdf
- ACMSF (Advisory Committee on the Microbiological Safety of Food), 2009b. Discussion paper report of the Social Science Research Committee Working Group on Listeria monocytogenes and the food storage and food handling practices of the over 60s at home. Food Standards Agency, Social Science Research Committee, 42 pp. ACM/954. Available online: https://www.food.gov.uk/sites/default/files/multimedia/pdfs/committee/acm954ssrcrep.pdf,
- Adak GK, Long SM and O'Brien SJ, 2002. Trends in indigenous foodborne disease and deaths, England and Wales: 1992 to 2000. Gut, 51, 832–841. 10.1136/gut.51.6.832 [DOI] [PMC free article] [PubMed] [Google Scholar]
- Afchain AL, Derens E, Guilpart J and Cornu M, 2005. Statistical modelling of cold‐smoked salmon temperature profiles for risk assessment of Listeria monocytogenes. Proceedings of the 3rd International Symposium on Applications of Modelling as an Innovative Technology in the Agri‐Food Chain. 10.17660/actahortic.2005.674.47, pp. 383–388. [DOI]
- Aguirre JS and Koutsoumanis KP, 2016. Towards lag phase of microbial populations at growth‐limiting conditions: The role of the variability in the growth limits of individual cells. International Journal of Food Microbiology, 224, 1–6. 10.1016/j.ijfoodmicro.2016.01.021 [DOI] [PubMed] [Google Scholar]
- Alali WQ and Schaffner DW, 2013. Relationship between Listeria monocytogenes and Listeria spp. in seafood processing plants. Journal of Food Protection, 76, 1279–1282. 10.4315/0362-028x.jfp-13-030 [DOI] [PubMed] [Google Scholar]
- Alibabic V, Mujic I, Rudic D, Bajramovic M, Jokic S, Sertovic E and Ruznic A, 2012. Labeling of food products on the B&H market and consumer behavior towards nutrition and health information of the product. Procedia ‐ Social and Behavioral Sciences, 46, 973–979. 10.1016/j.sbspro.2012.05.233 [DOI] [Google Scholar]
- Almanza BA, Namkung Y, Ismail JA and Nelson DC, 2007. Clients’ safe food‐handling knowledge and risk behavior in a home‐delivered meal program. Journal of the American Dietetic Association, 107, 816–821. 10.1016/j.jada.2007.02.043 [DOI] [PubMed] [Google Scholar]
- Andersen JB, Roldgaard BB, Christensen BB and Licht TR, 2007. Oxygen restriction increases the infective potential of Listeria monocytogenes in vitro in Caco‐2 cells and in vivo in guinea pigs. BMC Microbiology, 7, 55. 10.1186/1471-2180-7-55 [DOI] [PMC free article] [PubMed] [Google Scholar]
- Angelidis AS and Koutsoumanis K, 2006. Prevalence and concentration of Listeria monocytogenes in sliced ready‐to‐eat meat products in the Hellenic retail market. Journal of Food Protection, 69, 938–942. 10.4315/0362-028x-69.4.938 [DOI] [PubMed] [Google Scholar]
- Angelidis AS and Smith GM, 2003. Role of the glycine betaine and carnitine transporters in adaptation of Listeria monocytogenes to chill stress in defined medium. Applied and Environmental Microbiology, 69, 7492–7498. 10.1128/aem.69.12.7492-7498.2003 [DOI] [PMC free article] [PubMed] [Google Scholar]
- Annous BA, Becker LA, Bayles DO, Labeda DP and Wilkinson BJ, 1997. Critical role of anteiso‐C‐15:0 fatty acid in the growth of Listeria monocytogenes at low temperatures. Applied and Environmental Microbiology, 63, 3887–3894. [DOI] [PMC free article] [PubMed] [Google Scholar]
- Anses (French Agency for Food, Environmental and Occupational Health & Safety), 2017. AVIS de l'Agence nationale de sécurité sanitaire de l'alimentation, de l'environnement et du travail relatif à « la troisième étude individuelle nationale des consommations alimentaires (Etude INCA3) ». Saisine n° 2014‐SA‐0234
- Aragon TJ, 2012. Applied epidemiology using R ‐ an open access book. University of California, Berkeley School of Public Health, and the San Francisco Department of Public Health, 302 pp.
- Aryani DC, den Besten HMW, Hazeleger WC and Zwietering MH, 2015a. Quantifying strain variability in modeling growth of Listeria monocytogenes . International Journal of Food Microbiology, 208, 19–29. 10.1016/j.ijfoodmicro.2015.05.006 [DOI] [PubMed] [Google Scholar]
- Aryani DC, den Besten HMW, Hazeleger WC and Zwietering MH, 2015b. Quantifying variability on thermal resistance of Listeria monocytogenes . International Journal of Food Microbiology, 193, 130–138. 10.1016/j.ijfoodmicro.2014.10.021 [DOI] [PubMed] [Google Scholar]
- Aryani DC, Zwietering MH and den Besten HMW, 2016. The effect of different matrices on the growth kinetics and heat resistance of Listeria monocytogenes and Lactobacillus plantarum . International Journal of Food Microbiology, 238, 326–337. 10.1016/j.ijfoodmicro.2016.09.012 [DOI] [PubMed] [Google Scholar]
- Aspridou Z, Moschakis T, Biliaderis CG and Koutsoumanis KP, 2014. Effect of the substrate's microstructure on the growth of Listeria monocytogenes . Food Research International, 64, 683–691. 10.1016/j.foodres.2014.07.031 [DOI] [PubMed] [Google Scholar]
- Augustin JC and Carlier V, 2000a. Mathematical modelling of the growth rate and lag time for Listeria monocytogenes . International Journal of Food Microbiology, 56, 29–51. 10.1016/s0168-1605(00)00223-3 [DOI] [PubMed] [Google Scholar]
- Augustin JC and Carlier V, 2000b. Modelling the growth rate of Listeria monocytogenes with a multiplicative type model including interactions between environmental factors. International Journal of Food Microbiology, 56, 53–70. 10.1016/s0168-1605(00)00224-5 [DOI] [PubMed] [Google Scholar]
- Augustin JC and Czarnecka‐Kwasiborski A, 2012. Single‐cell growth probability of Listeria monocytogenes at suboptimal temperature, pH, and water activity. Frontiers in Microbiology, 3, 157. 10.3389/fmicb.2012.00157. [DOI] [PMC free article] [PubMed] [Google Scholar]
- Augustin JC, Ferrier R, Hezard B, Lintz A and Stahl V, 2015. Comparison of individual‐based modeling and population approaches for prediction of foodborne pathogens growth. Food Microbiology, 45, 205–215. 10.1016/j.fm.2014.04.006 [DOI] [PubMed] [Google Scholar]
- Augustin JC, Zuliani V, Cornu M and Guillier L, 2005. Growth rate and growth probability of Listeria monocytogenes in dairy, meat and seafood products in suboptimal conditions. Journal of Applied Microbiology, 99, 1019–1042. 10.1111/j.1365-2672.2005.02710.x [DOI] [PubMed] [Google Scholar]
- Autio T, Hielm S, Miettinen M, Sjoberg AM, Aarnisalo K, Bjorkroth J, Mattila‐Sandholm T and Korkeala H, 1999. Sources of Listeria monocytogenes contamination in a cold‐smoked rainbow trout processing plant detected by pulsed‐field gel electrophoresis typing. Applied and Environmental Microbiology, 65, 150–155. [DOI] [PMC free article] [PubMed] [Google Scholar]
- Avery SM and Buncic S, 1997. Differences in pathogenicity for chick embryos and growth kinetics at 37°C between clinical and meat isolates of Listeria monocytogenes previously stored at 4°C. International Journal of Food Microbiology, 34, 319–327. 10.1016/s0168-1605(96)01191-9 [DOI] [PubMed] [Google Scholar]
- Azevedo I, Regalo M, Mena C, Almeida G, Carneiro L, Teixeira P, Hogg T and Gibbs PA, 2005. Incidence of Listeria spp. in domestic refrigerators in Portugal. Food Control, 16, 121–124. 10.1016/j.foodcont.2003.12.006 [DOI] [Google Scholar]
- Bai J and Perron P, 2003. Critical values for multiple structural change tests. The Econometrics Journal, 6, 72–78. [Google Scholar]
- Bai JS and Perron P, 1998. Estimating and testing linear models with multiple structural changes. Econometrica, 66, 47–78. 10.2307/2998540 [DOI] [Google Scholar]
- Bakalis S, Giannakourou MC and Taoukis P, 2003. Effect of domestic storage and cooking conditions on the risk distribution in ready to cook meat products. Proceedings of the 9th international congress on engineering and food (ICEF9), Montpellier, France.
- Baranyi J, Robinson TP, Kaloti A and Mackey BM, 1995. Predicting growth of Brochothrix thermosphacta at changing temperature. International Journal of Food Microbiology, 27, 61–75. 10.1016/0168-1605(94)00154-x [DOI] [PubMed] [Google Scholar]
- Barbosa dos Reis‐Teixeira F, Farias Alves V and Pereira de Martinis E, 2017. Growth, viability and architecture of biofilms of Listeria monocytogenes formed on abiotic surfaces. Brazilian Journal of Microbiology, 48, 587–591. [DOI] [PMC free article] [PubMed] [Google Scholar]
- Barbosa WB, Cabedo L, Wederquist HJ, Sofos JN and Schmidt GR, 1994. Growth variation among species and strains of Listeria in culture broth. Journal of Food Protection, 57, 765–769. [DOI] [PubMed] [Google Scholar]
- Barbosa WB, Sofos JN, Schmidt GR and Smith GC, 1995. Growth‐potential of individual strains of Listeria monocytogenes in fresh vacuum‐packaged refrigerated ground top rounds of beef. Journal of Food Protection, 58, 398–403. [DOI] [PubMed] [Google Scholar]
- Barre L, Angelidis AS, Boussaid D, Brasseur ED, Manso E and Gnanou‐Besse N, 2016. Applicability of the EN ISO 11290‐1 standard method for Listeria monocytogenes detection in presence of new Listeria species. International Journal of Food Microbiology, 238, 281–287. 10.1016/j.ijfoodmicro.2016.09.028 [DOI] [PubMed] [Google Scholar]
- Bavishi C and DuPont HL, 2011. Systematic review: the use of proton pump inhibitors and increased susceptibility to enteric infection. Alimentary Pharmacology & Therapeutics, 34, 1269–1281. 10.1111/j.1365-2036.2011.04874.x [DOI] [PubMed] [Google Scholar]
- Bayles DO, Annous BA and Wilkinson BJ, 1996. Cold stress proteins induced in Listeria monocytogenes in response to temperature downshock and growth at low temperatures. Applied and Environmental Microbiology, 62, 1116–1119. [DOI] [PMC free article] [PubMed] [Google Scholar]
- Bayles DO and Wilkinson BJ, 2000. Osmoprotectants and cryoprotectants for Listeria monocytogenes . Letters in Applied Microbiology, 30, 23–27. 10.1046/j.1472-765x.2000.00646.x [DOI] [PubMed] [Google Scholar]
- Begley M, Sleator RD, Gahan CGM and Hill C, 2005. Contribution of three bile‐associated loci, bsh, pva, and btlB, to gastrointestinal persistence and bile tolerance of Listeria monocytogenes . Infection and Immunity, 73, 894–904. 10.1128/iai.73.2.894-904.2005 [DOI] [PMC free article] [PubMed] [Google Scholar]
- Begot C, Lebert I and Lebert A, 1997. Variability of the response of 66 Listeria monocytogenes and Listeria innocua strains to different growth conditions. Food Microbiology, 14, 403–412. 10.1006/fmic.1997.0097 [DOI] [Google Scholar]
- Belessi CEA, Gounadaki AS, Schvartzman S, Jordan K and Skandamis PN, 2011a. Evaluation of growth/no growth interface of Listeria monocytogenes growing on stainless steel surfaces, detached from biofilms or in suspension, in response to pH and NaCl. International Journal of Food Microbiology, 145, S53–S60. 10.1016/j.ijfoodmicro.2010.10.031 [DOI] [PubMed] [Google Scholar]
- Belessi CIA, Le Marc Y, Merkouri SI, Gounadaki AS, Schvartzman S, Jordan K, Drosinos EH and Skandamis PN, 2011b. Adaptive growth responses of Listeria monocytogenes to acid and osmotic shifts above and across the growth boundaries. Journal of Food Protection, 74, 78–85. 10.4315/0362-028x.jfp-10-117 [DOI] [PubMed] [Google Scholar]
- Bertrand S, Ceyssens PJ, Yde M, Dierick K, Boyen F, Vanderpas J, Vanhoof R and Mattheus W, 2016. Diversity of Listeria monocytogenes strains of clinical and food chain origins in Belgium between 1985 and 2014. PLoS ONE, 11, e0164283. 10.1371/journal.pone.0164283 [DOI] [PMC free article] [PubMed] [Google Scholar]
- Bierne H, Sabet C, Personnic N and Cossart R, 2007. Internalins: a complex family of leucine‐rich repeat‐containing proteins in Listeria monocytogenes . Microbes and Infection, 9, 1156–1166. 10.1016/j.micinf.2007.05.003 [DOI] [PubMed] [Google Scholar]
- Boelaert F, Amore G, Van der Stede Y and Hugas M, 2016. EU‐wide monitoring of biological hazards along the food chain: achievements, challenges and EFSA vision for the future. Current Opinion in Food Science, 12, 52–62. 10.1016/j.cofs.2016.08.004 [DOI] [Google Scholar]
- Bonazzi M, Lecuit M and Cossart P, 2009. Listeria monocytogenes internalin and E‐cadherin: from structure to pathogenesis. Cellular Microbiology, 11, 693–702. 10.1111/j.1462-5822.2009.01293.x [DOI] [PubMed] [Google Scholar]
- Boons K, Noriega E, Van den Broeck R, David CC, Hofkens J and Van Impe JF, 2014. Effect of microstructure on population growth parameters of Escherichia coli in gelatin‐dextran systems. Applied and Environmental Microbiology, 80, 5330–5339. 10.1128/aem.00817-14 [DOI] [PMC free article] [PubMed] [Google Scholar]
- Booth IR, 2002. Stress and the single cell: Intrapopulation diversity is a mechanism to ensure survival upon exposure to stress. International Journal of Food Microbiology, 78, 19–30. 10.1016/s0168-1605(02)00239-8 [DOI] [PubMed] [Google Scholar]
- Borucki MK, Peppin JD, White D, Loge F and Call DR, 2003. Variation in biofilm formation among strains of Listeria monocytogenes . Applied and Environmental Microbiology, 69, 7336–7342. 10.1128/aem.69.12.7336-7342.2003 [DOI] [PMC free article] [PubMed] [Google Scholar]
- Bouwknegt M, van Pelt W, Kubbinga ME, Weda M and Havelaar AH, 2014. Potential association between the recent increase in campylobacteriosis incidence in the Netherlands and proton‐pump inhibitor use ‐ an ecological study. Eurosurveillance, 19, 21–26. [DOI] [PubMed] [Google Scholar]
- Brandt P and Williams JT, 2001. A linear Poisson autoregressive model: the Poisson AR(p) model. Political Analysis, 9, 164–184. [Google Scholar]
- Bredholt S, Nesbakken T and Holck A, 1999. Protective cultures inhibit growth of Listeria monocytogenes and Escherichia coli O157:H7 in cooked, sliced, vacuum‐ and gas‐packaged meat. International Journal of Food Microbiology, 53, 43–52. 10.1016/s0168-1605(99)00147-6 [DOI] [PubMed] [Google Scholar]
- Breen A, Brock S, Crawford K, Docherty M, Drummond G, Gill L, Lawton S, Mankarious V, Oustayiannis A, Rushworth G and Kerr KG, 2006. The refrigerator safari ‐ An educational tool for undergraduate students learning about the microbiological safety of food. British Food Journal, 108, 487–494. 10.1108/00070700610668450 [DOI] [Google Scholar]
- Brennan M, McCarthy M and Ritson C, 2007. Why do consumers deviate from best microbiological food safety advice? An examination of ‘high‐risk’ consumers on the island of Ireland. Appetite, 49, 405–418. 10.1016/j.appet.2006.12.006 [DOI] [PubMed] [Google Scholar]
- Brondsted L, Kallipolitis BH, Ingmer H and Knochel S, 2003. kdpE and a putative RsbQ homologue contribute to growth of Listeria monocytogenes at high osmolarity and low temperature. FEMS Microbiology Letters, 219, 233–239. 10.1016/s0378-1097(03)00052-1 [DOI] [PubMed] [Google Scholar]
- Bruhn JB, Vogel BF and Gram L, 2005. Bias in the Listeria monocytogenes enrichment procedure: Lineage 2 strains outcompete lineage 1 strains in University of Vermont selective enrichments. Applied and Environmental Microbiology, 71, 961–967. 10.1128/aem.71.2.961-967.2005 [DOI] [PMC free article] [PubMed] [Google Scholar]
- Buchanan RL and Golden MH, 1995. Model for the nonthermal inactivation of Listeria monocytogenes in a reduced oxygen environment. Food Microbiology, 12, 203–212. 10.1016/s0740-0020(95)80099-9 [DOI] [Google Scholar]
- Buchanan RL, Golden MH and Phillips JG, 1997. Expanded models for the non‐thermal inactivation of Listeria monocytogenes . Journal of Applied Microbiology, 82, 567–577. 10.1111/j.1365-2672.1997.tb02865.x [DOI] [PubMed] [Google Scholar]
- Buchanan RL, Gorris LGM, Hayman MM, Jackson TC and Whiting RC, 2017. A review of Listeria monocytogenes: An update on outbreaks, virulence, dose‐response, ecology, and risk assessments. Food Control, 75, 1–13. 10.1016/j.foodcont.2016.12.016 [DOI] [Google Scholar]
- Buncic S, Avery SM, Rocourt J and Dimitrijevic M, 2001. Can food‐related environmental factors induce different behaviour in two key serovars, 4b and 1/2a, of Listeria monocytogenes? International Journal of Food Microbiology, 65, 201–212. 10.1016/s0168-1605(00)00524-9 [DOI] [PubMed] [Google Scholar]
- Burall LS, Grim C, Gopinath G, Laksanalamai P and Datta AR, 2014. Whole‐genome sequencing identifies an atypical Listeria monocytogenes strain isolated from pet foods. Genome Announcements, 2, e01243–01214. 10.1128/genomeA.01243-14 [DOI] [PMC free article] [PubMed] [Google Scholar]
- Burgess CM, Gianotti A, Gruzdev N, Holah J, Knochel S, Lehner A, Margas E, Esser SS, Sela S and Tresse O, 2016. The response of foodborne pathogens to osmotic and desiccation stresses in the food chain. International Journal of Food Microbiology, 221, 37–53. 10.1016/j.ijfoodmicro.2015.12.014 [DOI] [PubMed] [Google Scholar]
- Busschaert P, Geeraerd AH, Uyttendaele M and Van Impe JF, 2011. Sensitivity analysis of a two‐dimensional quantitative microbiological risk assessment: keeping variability and uncertainty separated. Risk Analysis, 31, 1295–1307. 10.1111/j.1539-6924.2011.01592.x [DOI] [PubMed] [Google Scholar]
- Cabanes D, Sousa S, Cebria A, Lecuit M, Garcia‐del Portillo F and Cossart P, 2005. Gp96 is a receptor for a novel Listeria monocytogenes virulence factor, Vip, a surface protein. EMBO Journal, 24, 2827–2838. 10.1038/sj.emboj.7600750 [DOI] [PMC free article] [PubMed] [Google Scholar]
- Carpentier B and Cerf O, 2011. Review ‐ Persistence of Listeria monocytogenes in food industry equipment and premises. International Journal of Food Microbiology, 145, 1–8. 10.1016/j.ijfoodmicro.2011.01.005 [DOI] [PubMed] [Google Scholar]
- Carrasco E, Perez‐Rodriguez F, Valero A, Garcia‐Gimeno RM and Zurera G, 2007. Survey of temperature and consumption patterns of fresh‐cut leafy green salads: risk factors for listeriosis. Journal of Food Protection, 70, 2407–2412. [DOI] [PubMed] [Google Scholar]
- Carrasco E, Perez‐Rodriguez F, Valero A, Garcia‐Gimeno RM and Zurera G, 2010. Risk assessment and management of Listeria monocytogenes in ready‐to‐eat lettuce salads. Comprehensive Reviews in Food Science and Food Safety, 9, 498–512. 10.1111/j.1541-4337.2010.00123.x [DOI] [PubMed] [Google Scholar]
- Cassini A, Colzani E, Kramarz P, Kretzschmar ME and Takkinen J, 2016. Impact of food and water‐borne diseases on European population health. Current Opinion in Food Science, 12, 21–29. 10.1016/j.cofs.2016.06.002 [DOI] [Google Scholar]
- Chen YH, Ross EH, Scott VN and Gombas DE, 2003. Listeria monocytogenes: low levels equal low risk. Journal of Food Protection, 66, 570–577. [DOI] [PubMed] [Google Scholar]
- Cleveland WS, Grosse E and Shyu WM, 1992. Local regression models (chapter 8). In: Chambers JM, Hastie TJ (eds.). Statistical Models in S. Wadsworth & Brooks/Cole, California, USA. pp. 309–376. [Google Scholar]
- Cornu M, Billoir E, Bergis H, Beaufort A and Zuliani V, 2011. Modeling microbial competition in food: Application to the behavior of Listeria monocytogenes and lactic acid flora in pork meat products. Food Microbiology, 28, 639–647. 10.1016/j.fm.2010.08.007 [DOI] [PubMed] [Google Scholar]
- Cornu M, Kalmokoff M and Flandrois JP, 2002. Modelling the competitive growth of Listeria monocytogenes and Listeria innocua in enrichment broths. International Journal of Food Microbiology, 73, 261–274. 10.1016/s0168-1605(01)00658-4 [DOI] [PubMed] [Google Scholar]
- Coroller L, Kan‐King‐Yu D, Leguerinel I, Mafart P and Membre JM, 2012. Modelling of growth, growth/no‐growth interface and nonthermal inactivation areas of Listeria in foods. International Journal of Food Microbiology, 152, 139–152. 10.1016/j.ijfoodmicro.2011.09.023 [DOI] [PubMed] [Google Scholar]
- Coroller L, Leguerinel I, Mettler E, Savy N and Mafart P, 2006. General model, based on two mixed Weibull distributions of bacterial resistance, for describing various shapes of inactivation curves. Applied and Environmental Microbiology, 72, 6493–6502. 10.1128/aem.00876-06 [DOI] [PMC free article] [PubMed] [Google Scholar]
- Cossart P, 2011. Illuminating the landscape of host‐pathogen interactions with the bacterium Listeria monocytogenes . Proceedings of the National Academy of Sciences of the United States of America, 108, 19484–19491. 10.1073/pnas.1112371108 [DOI] [PMC free article] [PubMed] [Google Scholar]
- Cotter PD, O'Reilly K and Hill C, 2001. Role of the glutamate decarboxylase acid resistance system in the survival of Listeria monocytogenes LO28 in low pH foods. Journal of Food Protection, 64, 1362–1368. [DOI] [PubMed] [Google Scholar]
- Cotter PD, Ryan S, Gahan CGM and Hill C, 2005. Presence of GadD1 glutamate decarboxylase in selected Listeria monocytogenes strains is associated with an ability to grow at low pH. Applied and Environmental Microbiology, 71, 2832–2839. 10.1128/aem.71.6.2832-2839.2005 [DOI] [PMC free article] [PubMed] [Google Scholar]
- Dailey RC, Martin KG and Smiley RD, 2014. The effects of competition from non‐pathogenic foodborne bacteria during the selective enrichment of Listeria monocytogenes using buffered Listeria enrichment broth. Food Microbiology, 44, 173–179. 10.1016/j.fm.2014.05.004 [DOI] [PMC free article] [PubMed] [Google Scholar]
- Dailey RC, Welch LJ, Hitchins AD and Smiley RD, 2015. Effect of Listeria seeligeri or Listeria welshimeri on Listeria monocytogenes detection in and recovery from buffered Listeria enrichment broth. Food Microbiology, 46, 528–534. 10.1016/j.fm.2014.09.008 [DOI] [PMC free article] [PubMed] [Google Scholar]
- Dalton CB, Austin CC, Sobel J, Hayes PS, Bibb WF, Graves LM, Swaminathan B, Proctor ME and Griffin PM, 1997. An outbreak of gastroenteritis and fever due to Listeria monocytogenes in milk. New England Journal of Medicine, 336, 100–105. 10.1056/nejm199701093360204 [DOI] [PubMed] [Google Scholar]
- Danyluk MD, Friedrich LM and Schaffner DW, 2014. Modeling the growth of Listeria monocytogenes on cut cantaloupe, honeydew and watermelon. Food Microbiology, 38, 52–55. 10.1016/j.fm.2013.08.001 [DOI] [PubMed] [Google Scholar]
- De Jesus AJ and Whiting RC, 2003. Thermal inactivation, growth, and survival studies of Listeria monocytogenes strains belonging to three distinct genotypic lineages. Journal of Food Protection, 66, 1611–1617. [DOI] [PubMed] [Google Scholar]
- de Lezenne Coulander PA, 1994. Koelkast temperaturen thuis. Report of the regional Inspectorate for Health Protection. Leeuwarden, the Netherlands, 27 pp.
- de Noordhout CM, Devleesschauwer B, Angulo FJ, Verbeke G, Haagsma J, Kirk M, Havelaar A and Speybroeck N, 2014. The global burden of listeriosis: a systematic review and meta‐analysis. Lancet Infectious Diseases, 14, 1073–1082. 10.1016/s1473-3099(14)70870-9 [DOI] [PMC free article] [PubMed] [Google Scholar]
- Delignette‐Muller ML and Rosso L, 2000. Biological variability and exposure assessment. International Journal of Food Microbiology, 58, 203–212. 10.1016/s0168-1605(00)00274-9 [DOI] [PubMed] [Google Scholar]
- den Besten HMW, Aryani DC, Metselaar KI and Zwietering MH, 2017. Microbial variability in growth and heat resistance of a pathogen and a spoiler: All variabilities are equal but some are more equal than others. International Journal of Food Microbiology, 240, 24–31. 10.1016/j.ijfoodmicro.2016.04.025 [DOI] [PubMed] [Google Scholar]
- Derens‐Bertheau E, Osswald V, Laguerre O and Alvarez G, 2015. Cold chain of chilled food in France. International Journal of Refrigeration‐Revue Internationale du Froid, 52, 161–167. 10.1016/j.ijrefrig.2014.06.012 [DOI] [Google Scholar]
- Derens E, Palagos B and Guilpart J, 2006. The cold chain of chilled products under supervision in France. Proceedings of the IUFOST, 13th world congress of food science & technology “Food is life”, Nantes, France.
- Devleesschauwer B, Havelaar AH, de Noordhout CM, Haagsma JA, Praet N, Dorny P, Duchateau L, Torgerson PR, Van Oyen H and Speybroeck N, 2014. Calculating disability‐adjusted life years to quantify burden of disease. International Journal of Public Health, 59, 565–569. 10.1007/s00038-014-0552-z [DOI] [PubMed] [Google Scholar]
- Devlieghere F, Geeraerd AH, Versyck KJ, Vandewaetere B, Van Impe J and Debevere J, 2001. Growth of Listeria monocytogenes in modified atmosphere packed cooked meat products: a predictive model. Food Microbiology, 18, 53–66. 10.1006/fmic.2000.0378 [DOI] [Google Scholar]
- Ding T, Iwahori J, Kasuga F, Wang J, Forghani F, Park MS and Oh DH, 2013. Risk assessment for Listeria monocytogenes on lettuce from farm to table in Korea. Food Control, 30, 190–199. 10.1016/j.foodcont.2012.07.014 [DOI] [Google Scholar]
- Disson O and Lecuit M, 2013. In vitro and in vivo models to study human listeriosis: mind the gap. Microbes and Infection, 15, 971–980. 10.1016/j.micinf.2013.09.012 [DOI] [PubMed] [Google Scholar]
- Dominguez‐Bernal G, Muller‐Altrock S, Gonzalez‐Zorn B, Scortti M, Herrmann P, Monzo HJ, Lacharme L, Kreft J and Vazquez‐Boland JA, 2006. A spontaneous genomic deletion in Listeria ivanovii identifies LIPI‐2, a species‐specific pathogenicity island encoding sphingomyelinase and numerous internalins. Molecular Microbiology, 59, 415–432. 10.1111/j.1365-2958.2005.04955.x [DOI] [PubMed] [Google Scholar]
- Doumith M, Buchrieser C, Glaser P, Jacquet C and Martin P, 2004. Differentiation of the major Listeria monocytogenes serovars by multiplex PCR. Journal of Clinical Microbiology, 42, 3819–3822. 10.1128/JCM.42.8.3819-3822.2004 [DOI] [PMC free article] [PubMed] [Google Scholar]
- Dowe MJ, Jackson ED, Mori JG and Bell CR, 1997. Listeria monocytogenes survival in soil and incidence in agricultural soils. Journal of Food Protection, 60, 1201–1207. [DOI] [PubMed] [Google Scholar]
- Duche O, Tremoulet F, Glaser P and Labadie J, 2002. Salt stress proteins induced in Listeria monocytogenes . Applied and Environmental Microbiology, 68, 1491–1498. 10.1128/aem.68.4.1491-1498.2002 [DOI] [PMC free article] [PubMed] [Google Scholar]
- Duodu S, Holst‐Jensen A, Skjerdal T, Cappelier JM, Pilet MF and Loncarevic S, 2010. Influence of storage temperature on gene expression and virulence potential of Listeria monocytogenes strains grown in a salmon matrix. Food Microbiology, 27, 795–801. 10.1016/j.fm.2010.04.012 [DOI] [PubMed] [Google Scholar]
- Duret S, Guillier L, Hoang HM, Flick D and Laguerre O, 2014. Identification of the significant factors in food safety using global sensitivity analysis and the accept‐and‐reject algorithm: application to the cold chain of ham. International Journal of Food Microbiology, 180, 39–48. 10.1016/j.ijfoodmicro.2014.04.009 [DOI] [PubMed] [Google Scholar]
- Dussault D, Vu KD and Lacroix M, 2016. Development of a model describing the inhibitory effect of selected preservatives on the growth of Listeria monocytogenes in a meat model system. Food Microbiology, 53, 115–121. 10.1016/j.fm.2015.09.011 [DOI] [PubMed] [Google Scholar]
- Dussurget O, Cabanes D, Dehoux P, Lecuit M, Buchrieser C, Glaser P and Cossart P, 2002. Listeria monocytogenes bile salt hydrolase is a PrfA‐regulated virulence factor involved in the intestinal and hepatic phases of listeriosis. Molecular Microbiology, 45, 1095–1106. 10.1046/j.1365-2958.2002.03080.x [DOI] [PubMed] [Google Scholar]
- ECDC (European Centre for Disease Prevention and Control), 2015. Surveillance of seven priority food‐ and waterborne diseases in the EU/EEA (2010‐2012). ECDC, Stockholm, 277 pp. [Google Scholar]
- EFSA (European Food Safety Authority), 2013. Analysis of the baseline survey on the prevalence of Listeria monocytogenes in certain ready‐to‐eat foods in the EU, 2010‐2011 part A: Listeria monocytogenes prevalence estimates. EFSA Journal 2013;11(6):3241, 75 pp. 10.2903/j.efsa.2013.3241 [DOI] [Google Scholar]
- EFSA (European Food Safety Authority), 2014a. Analysis of the baseline survey on the prevalence of Listeria monocytogenes in certain ready‐to‐eat foods in the EU, 2010‐2011. Part B: analysis of factors related to prevalence and exploring compliance. EFSA Journal 2014;12(8):3810, 73 pp. 10.2903/j.efsa.2014.3810 [DOI] [Google Scholar]
- EFSA (European Food Safety Authority), 2014b. Update of the technical specifications for harmonised reporting of food‐borne outbreaks through the European Union reporting system in accordance with Directive 2003/99/EC. EFSA Journal 2014;12(3):3598, 25 pp. 10.2903/j.efsa.2014.3598 [DOI] [Google Scholar]
- EFSA and ECDC (European Food Safety Authority and European Centre for Disease Prevention and Control), 2015. The European Union summary report on trends and sources of zoonoses, zoonotic agents and food‐borne outbreaks in 2013. EFSA Journal 2015;13(1):3991, 162 pp. 10.2903/j.efsa.2015.3991 [DOI] [PMC free article] [PubMed] [Google Scholar]
- EFSA and ECDC (European Food Safety Authority and European Centre for Disease Prevention and Control), 2016. The European Union summary report on trends and sources of zoonoses, zoonotic agents and food‐borne outbreaks in 2015. EFSA Journal 2016;14(12):4634, 231 pp. 10.2903/j.efsa.2016.4634 [DOI] [PMC free article] [PubMed] [Google Scholar]
- EFSA BIOHAZ Panel (EFSA Panel on Biological Hazards), 2008. Scientific Opinion for updating the former SCVPH opinion on Listeria monocytogenes risk related to ready‐to‐eat foods and scientific advice on different levels of Listeria monocytogenes in ready‐to‐eat foods and the related risk for human illness. EFSA Journal 2008;6(1):599, 42 pp. 10.2903/j.efsa.2008.599 [DOI] [Google Scholar]
- EFSA Scientific Committee , 2016. Guidance on uncertainty in EFSA scientific assessment. Revised draft for internal testing, 274 pp. Available online: https://www.efsa.europa.eu/sites/default/files/160321DraftGDUncertaintyInScientificAssessment.pdf
- Elhanafi D, Dutta V and Kathariou S, 2010. Genetic characterization of plasmid‐associated benzalkonium chloride resistance determinants in a Listeria monocytogenes strain from the 1998‐1999 outbreak. Applied and Environmental Microbiology, 76, 8231–8238. 10.1128/aem.02056-10 [DOI] [PMC free article] [PubMed] [Google Scholar]
- Ellouze M, Gauchi JP and Augustin JC, 2010. Global sensitivity analysis applied to a contamination assessment model of Listeria monocytogenes in cold smoked salmon at consumption. Risk Analysis, 30, 841–852. 10.1111/j.1539-6924.2010.01380.x [DOI] [PubMed] [Google Scholar]
- Endrikat S, Gallagher D, Pouillot R, Quesenberry HH, Labarre D, Schroeder CM and Kause J, 2010. A comparative risk assessment for Listeria monocytogenes in prepackaged versus retail‐sliced deli meat. Journal of Food Protection, 73, 612–619. [DOI] [PubMed] [Google Scholar]
- Evans EW and Redmond EC, 2014. Behavioral Risk Factors Associated with Listeriosis in the Home: A Review of Consumer Food Safety Studies. Journal of Food Protection, 77, 510–521. 10.4315/0362-028x.jfp-13-238 [DOI] [PubMed] [Google Scholar]
- Evans EW and Redmond EC, 2016a. Older adult consumer knowledge, attitudes, and self‐reported storage practices of ready‐to‐eat food products and risks associated with listeriosis. Journal of Food Protection, 79, 263–272. 10.4315/0362-028x.jfp-15-312 [DOI] [PubMed] [Google Scholar]
- Evans EW and Redmond EC, 2016b. Time‐temperature profiling of United Kingdom consumers’ domestic refrigerators. Journal of Food Protection, 79, 2119–2127. 10.4315/0362-028x.jfp-16-270 [DOI] [PubMed] [Google Scholar]
- Evans JA, Scarcelli S and Swain MVL, 2007. Temperature and energy performance of refrigerated retail display and commercial catering cabinets under test conditions. International Journal of Refrigeration‐Revue Internationale du Froid, 30, 398–408. 10.1016/j.ijrefrig.2006.10.006 [DOI] [Google Scholar]
- Evans JA, Stanton JI, Russell SL and James SJ, 1991. Consumer handling of chilled foods: A survey of time and temperature conditions. MAFF Publications, London, PB 0682. [Google Scholar]
- Fagerlund A, Langsrud S, Schirmer BCT, Moretro T and Heir E, 2016. Genome analysis of Listeria monocytogenes sequence type 8 strains persisting in salmon and poultry processing environments and comparison with related strains. PLoS ONE, 11, e0151117. 10.1371/journal.pone.0151117 [DOI] [PMC free article] [PubMed] [Google Scholar]
- Fang T, Liu YH and Huang LH, 2013. Growth kinetics of Listeria monocytogenes and spoilage microorganisms in fresh‐cut cantaloupe. Food Microbiology, 34, 174–181. 10.1016/j.fm.2012.12.005 [DOI] [PubMed] [Google Scholar]
- FAO (Food and Agriculture Organization of the United Nations), 2016. Fishery and Aquaculture Statistics. Global Fisheries commodities production and trade 1976‐2013 (FishstatJ). In: FAO Fisheries and Aquaculture Department [online or CD‐ROM]. Rome. Updated 2016. http://www.fao.org/fishery/statistics/software/fishstatj/en
- FAO and WHO (Food and Agriculture Organization of the United Nations and World Health Organization), 2004. Risk assessment of Listeria monocytogenes in ready‐to‐eat foods: Technical report. FAO, Rome. Microbiological Risk Assessment Series, 98 pp. ISBN 978‐92‐5‐105762‐9. Available online: http://www.fao.org/docrep/010/y5394e/y5394e00.htm
- FAO and WHO (Food and Agriculture Organization of the United Nations and World Health Organization), 2014. Risk assessment of Listeria monocytogenes in ready‐to‐eat foods. Microbiological Risk Assessment Series. 63 pp. ISBN 92 4 156262 5 (WHO), ISBN 92 5 105 127 5 (FAO), ISSN 1726‐5274.
- Farber JM, Ross WH and Harwig J, 1996. Health risk assessment of Listeria monocytogenes in Canada. International Journal of Food Microbiology, 30, 145–156. 10.1016/0168-1605(96)01107-5 [DOI] [PubMed] [Google Scholar]
- FDA and FSIS (Food and Drug Administration of the US Department of Health and Human Services and Food Safety and Inspection Service of the US Department of Agriculture), 2003. Quantitative assessment of relative risk to public health from foodborne Listeria monocytogenes among selected categories of ready‐to‐eat foods. FDA, 572 pp. Available online: https://www.fda.gov/food/foodscienceresearch/risksafetyassessment/ucm183966
- FDA and Health Canada (Food and Drug Administration of the United States and Health Canada), 2015. Joint FDA/Health Canada Quantitative assessment of the risk of listeriosis from soft‐ripened cheese consumption in the United States and Canada. 177 pp. Available online: https://www.fda.gov/Food/FoodScienceResearch/RiskSafetyAssessment/ucm429410.htm
- Fischer ARH and Frewer LJ, 2008. Food‐safety practices in the domestic kitchen: demographic, personality, and experiential determinants. Journal of Applied Social Psychology, 38, 2859–2884. [Google Scholar]
- Flynn OMJ, Blair I and McDowell D, 1992. The efficiency and consumer operation of domestic refrigerators. International Journal of Refrigeration‐Revue Internationale du Froid, 15, 307–312. 10.1016/0140-7007(92)90046-w [DOI] [Google Scholar]
- Francois K, Devlieghere F, Standaert AR, Geeraerd AH, Van Impe JF and Debevere J, 2006. Effect of environmental parameters (temperature, pH and aw) on the individual cell lag phase and generation time of Listeria monocytogenes . International Journal of Food Microbiology, 108, 326–335. 10.1016/j.ijfoodmicro.2005.11.017 [DOI] [PubMed] [Google Scholar]
- Franz E, Tromp SO, Rijgersberg H and van der Fels‐Klerx HJ, 2010. Quantitative microbial risk assessment for Escherichia coli O157:H7, Salmonella, and Listeria monocytogenes in leafy green vegetables consumed at salad bars. Journal of Food Protection, 73, 274–285. [DOI] [PubMed] [Google Scholar]
- Freitag NE, Port GC and Miner MD, 2009. Listeria monocytogenes ‐ from saprophyte to intracellular pathogen. Nature Reviews Microbiology, 7, 623–628. 10.1038/nrmicro2171. [DOI] [PMC free article] [PubMed] [Google Scholar]
- Fritsch L, Guillier L, Lebouleux C and Augustin JC, 2017. Including genotypic data into quantitative microbial risk assessment: application on Listeria monocytogenes in cold smoked salmon. Proceedings of the 10th International Conference on Predictive Modelling in Food, Cordoba, Spain.
- FSIS (Food Safety and Inspection Service of the US Department of Agriculture), 2010. FSIS comparative risk assessment for Listeria monocytogenes in ready‐to‐eat meat and poultry deli meats. 60 pp. Available online: https://www.fsis.usda.gov/shared/PDF/Comparative_RA_Lm_Report_May2010.pdf
- FSIS and FDA (Food Safety and Inspection Service of the US Department of Agriculture and Center for Food Safety and Applied Nutrition of the Food and Drug Administration), 2013. Draft interagency risk assessment: Listeria monocytogenes in retail delicatessens ‐ technical report. 160 pp. Available online: https://www.fsis.usda.gov/wps/wcm/connect/c0c6dfbc-ad83-47c1-bcb8-8db6583f762b/Lm-Retail-Technical-Report.pdf?MOD=AJPERES
- Gallagher D, Ebel ED, Gallagher O, LaBarre D, Williams MS, Golden NJ, Pouillot R, Dearfield KL and Kause J, 2013. Characterizing uncertainty when evaluating risk management metrics: risk assessment modeling of Listeria monocytogenes contamination in ready‐to‐eat deli meats. International Journal of Food Microbiology, 162, 266–275. 10.1016/j.ijfoodmicro.2013.01.016 [DOI] [PubMed] [Google Scholar]
- Gandhi M and Chikindas ML, 2007. Listeria: A foodborne pathogen that knows how to survive. International Journal of Food Microbiology, 113, 1–15. 10.1016/j.ijfoodmicro.2006.07.008 [DOI] [PubMed] [Google Scholar]
- Garner D and Kathariou S, 2016. Fresh produce‐associated listeriosis outbreaks, sources of concern, teachable moments, and insights. Journal of Food Protection, 79, 337–344. 10.4315/0362-028x.jfp-15-387 [DOI] [PubMed] [Google Scholar]
- Garrido V, Garcia‐Jalon I and Vitas AI, 2010a. Temperature distribution in Spanish domestic refrigerators and its effect on Listeria monocytogenes growth in sliced ready‐to‐eat ham. Food Control, 21, 896–901. 10.1016/j.foodcont.2009.12.007 [DOI] [Google Scholar]
- Garrido V, Garcia‐Jalon I, Vitas AI and Sanaa M, 2010b. Listeriosis risk assessment: simulation modelling and “what if” scenarios applied to consumption of ready‐to‐eat products in a Spanish population. Food Control, 21, 231–239. 10.1016/j.foodcont.2009.05.019 [DOI] [Google Scholar]
- Gaul LK, Farag NH, Shim T, Kingsley MA, Silk BJ and Hyytia‐Trees E, 2013. Hospital‐acquired listeriosis outbreak caused by contaminated diced celery‐Texas, 2010. Clinical Infectious Diseases, 56, 20–26. 10.1093/cid/cis817 [DOI] [PubMed] [Google Scholar]
- Gedde MM, Higgins DE, Tilney LG and Portnoy DA, 2000. Role of listeriolysin O in cell‐to‐cell spread of Listeria monocytogenes . Infection and Immunity, 68, 999–1003. 10.1128/IAI.68.2.999-1003.2000 [DOI] [PMC free article] [PubMed] [Google Scholar]
- Ghebrehewet S and Stevenson L, 2003. Effectiveness of home‐based food storage training: a community development approach. International Journal of Environmental Health Research, 13, S169–S174. 10.1080/0960312031000102930 [DOI] [PubMed] [Google Scholar]
- Giacometti F, Bonilauri P, Albonetti S, Amatiste S, Arrigoni N, Bianchi M, Bertasi B, Bilei S, Bolzoni G, Cascone G, Comin D, Daminelli P, Decastelli L, Merialdi G, Mioni R, Peli A, Petruzzelli A, Tonucci F, Bonerba E and Serraino A, 2015. Quantitative risk assessment of human salmonellosis and listeriosis related to the consumption of raw milk in Italy. Journal of Food Protection, 78, 13–21. 10.4315/0362-028x.jfp-14-171 [DOI] [PubMed] [Google Scholar]
- Gillespie IA, Mook P, Little CL, Grant K and Adak GK, 2010. Listeria monocytogenes infection in the over‐60s in England between 2005 and 2008: a retrospective case‐control study utilizing market research panel data. Foodborne Pathogens and Disease, 7, 1373–1379. 10.1089/fpd.2010.0568 [DOI] [PubMed] [Google Scholar]
- Gilmour MW, Graham M, Van Domselaar G, Tyler S, Kent H, Trout‐Yakel KM, Larios O, Allen V, Lee B and Nadon C, 2010. High‐throughput genome sequencing of two Listeria monocytogenes clinical isolates during a large foodborne outbreak. BMC Genomics, 11, 120. 10.1186/1471-2164-11-120 [DOI] [PMC free article] [PubMed] [Google Scholar]
- Gimenez B and Dalgaard P, 2004. Modelling and predicting the simultaneous growth of Listeria monocytogenes and spoilage micro‐organisms in cold‐smoked salmon. Journal of Applied Microbiology, 96, 96–109. 10.1046/j.1365-2672.2003.02137.x [DOI] [PubMed] [Google Scholar]
- Gkogka E, Reij MW, Gorris LGM and Zwietering MH, 2013. The application of the Appropriate Level of Protection (ALOP) and Food Safety Objective (FSO) concepts in food safety management, using Listeria monocytogenes in deli meats as a case study. Food Control, 29, 382–393. 10.1016/j.foodcont.2012.04.020 [DOI] [Google Scholar]
- Glaser P, Frangeul L, Buchrieser C, Rusniok C, Amend A, Baquero F, Berche P, Bloecker H, Brandt P, Chakraborty T, Charbit A, Chetouani F, Couve E, de Daruvar A, Dehoux P, Domann E, Dominguez‐Bernal G, Duchaud E, Durant L, Dussurget O, Entian KD, Fsihi H, Garcia‐Del Portillo F, Garrido P, Gautier L, Goebel W, Gomez‐Lopez N, Hain T, Hauf J, Jackson D, Jones LM, Kaerst U, Kreft J, Kuhn M, Kunst F, Kurapkat G, Madueno E, Maitournam A, Vicente JM, Ng E, Nedjari H, Nordsiek G, Novella S, de Pablos B, Perez‐Diaz JC, Purcell R, Remmel B, Rose M, Schlueter T, Simoes N, Tierrez A, Vazquez‐Boland JA, Voss H, Wehland J and Cossart P, 2001. Comparative genomics of Listeria species. Science, 294, 849–852. [DOI] [PubMed] [Google Scholar]
- Glass KA, Golden MC, Wanless BJ, Bedale W and Czuprynski C, 2015. Growth of Listeria monocytogenes within a caramel‐coated apple microenvironment. MBio, 6, e01232–01215. 10.1128/mBio.01232-15 [DOI] [PMC free article] [PubMed] [Google Scholar]
- Gnanou‐Besse N, Barre L, Buhariwalla C, Vignaud ML, Khamissi E, Decourseulles E, Nirsimloo M, Chelly M and Kalmokoff M, 2010. The overgrowth of Listeria monocytogenes by other Listeria spp. in food samples undergoing enrichment cultivation has a nutritional basis. International Journal of Food Microbiology, 136, 345–351. 10.1016/j.ijfoodmicro.2009.10.025 [DOI] [PubMed] [Google Scholar]
- Golnazarian CA, Donnelly CW, Pintauro SJ and Howard DB, 1989. Comparison of infectious dose of Listeria monocytogenes F5817 as determined for normal versus compromised C57B1/6J mice. Journal of Food Protection, 52, 696–701. [DOI] [PubMed] [Google Scholar]
- Gombas DE, Chen YH, Clavero RS and Scott VN, 2003. Survey of Listeria monocytogenes in ready‐to‐eat foods. Journal of Food Protection, 66, 559–569. [DOI] [PubMed] [Google Scholar]
- Gorski L, Flaherty D and Mandrell RE, 2006. Competitive fitness of Listeria monocytogenes serotype 1/2a and 4b strains in mixed cultures with and without food in the US Food and Drug Administration enrichment protocol. Applied and Environmental Microbiology, 72, 776–783. 10.1128/aem.72.1.776-783.2006 [DOI] [PMC free article] [PubMed] [Google Scholar]
- Goulet V, Hebert M, Hedberg C, Laurent E, Vaillant V, De Valk H and Desenclos JC, 2012. Incidence of listeriosis and related mortality among groups at risk of acquiring listeriosis. Clinical Infectious Diseases, 54, 652–660. 10.1093/cid/cir902 [DOI] [PubMed] [Google Scholar]
- Goulet V, Jacquet C, Laurent E, Rocourt J, Vaillant V and De Valk H, 2001. La surveillance de la listeriose humaine en France en 1999. Bulletin Epidemiologique Hebdomadaire, 34, 9. [Google Scholar]
- Gracieux P, Roche SM, Pardon P and Velge P, 2003. Hypovirulent Listeria monocytogenes strains are less frequently recovered than virulent strains on PALCAM and Rapid’ L. mono media. International Journal of Food Microbiology, 83, 133–145. 10.1016/s0168-1605(02)00321-5 [DOI] [PubMed] [Google Scholar]
- Guillier L and Augustin JC, 2006. Modelling the individual cell lag time distributions of Listeria monocytogenes as a function of the physiological state and the growth conditions. International Journal of Food Microbiology, 111, 241–251. 10.1016/j.ijfoodmicro.2006.05.011 [DOI] [PubMed] [Google Scholar]
- Gysemans KPM, Bernaerts K, Vermeulen A, Geeraerd AH, Debevere J, Devlieghere F and Van Impe JF, 2007. Exploring the performance of logistic regression model types on growth/no growth data of Listeria monocytogenes . International Journal of Food Microbiology, 114, 316–331. 10.1016/j.ijfoodmicro.2006.09.026 [DOI] [PubMed] [Google Scholar]
- Haagsma JA, Geenen PL, Ethelberg S, Fetsch A, Hansdotter F, Jansen A, Korsgaard H, O'Brien SJ, Scavia G, Spitznagel H, Stefanoff P, Tam CC, Havelaar AH and Med Vet Net Working G , 2013. Community incidence of pathogen‐specific gastroenteritis: reconstructing the surveillance pyramid for seven pathogens in seven European Union Member States. Epidemiology and Infection, 141, 1625–1639. 10.1017/s0950268812002166 [DOI] [PMC free article] [PubMed] [Google Scholar]
- Hain T, Ghai R, Billion A, Kuenne CT, Steinweg C, Izar B, Mohamed W, Abu Mraheil M, Domann E, Schaffrath S, Karst U, Goesmann A, Oehm S, Puhler A, Merkl R, Vorwerk S, Glaser P, Garrido P, Rusniok C, Buchrieser C, Goebel W and Chakraborty T, 2012. Comparative genomics and transcriptomics of lineages I, II, and III strains of Listeria monocytogenes . BMC Genomics, 13, 17. 10.1186/1471-2164-13-144 [DOI] [PMC free article] [PubMed] [Google Scholar]
- Hamon MA, Ribet D, Stavru F and Cossart P, 2012. Listeriolysin O: the Swiss army knife of Listeria . Trends in Microbiology, 20, 360–368. 10.1016/j.tim.2012.04.006 [DOI] [PubMed] [Google Scholar]
- Hein I, Klinger S, Dooms M, Flekna G, Stessl B, Leclercq A, Hill C, Allerberger F and Wagner M, 2011. Stress Survival Islet 1 (SSI‐1) survey in Listeria monocytogenes reveals an insert common to Listeria innocua in sequence type 121 L. monocytogenes strains. Applied and Environmental Microbiology, 77, 2169–2173. 10.1128/aem.02159-10 [DOI] [PMC free article] [PubMed] [Google Scholar]
- Hingston P, Chen J, Dhillon BK, Laing C, Bertelli C, Gannon V, Tasara T, Allen K, Brinkman FSL, Hansen LT and Wang SY, 2017. Genotypes associated with Listeria monocytogenes isolates displaying impaired or enhanced tolerances to cold, salt, acid, or desiccation stress. Frontiers in Microbiology, 8, 10.3389/fmicb.2017.00369 [DOI] [PMC free article] [PubMed] [Google Scholar]
- Hoelzer K, Chen Y, Dennis S, Evans P, Pouillot R, Silk BJ and Walls I, 2013. New data, strategies, and insights for Listeria monocytogenes dose‐response models: summary of an interagency workshop, 2011. Risk Analysis, 33, 1568–1581. 10.1111/risa.12005 [DOI] [PubMed] [Google Scholar]
- Ihaka R and Gentleman R, 1996. R: a language for data analysis and graphics. Journal of Computational and Graphical Statistics, 5, 299–314. [Google Scholar]
- Jacxsens L, Ibanez IC, Gomez‐Lopez VM, Fernandes JA, Allende A, Uyttendaele M and Huybrechts I, 2015. Belgian and Spanish consumption data and consumer handling practices for fresh fruits and vegetables useful for further microbiological and chemical exposure assessment. Journal of Food Protection, 78, 784–795. 10.4315/0362-028x.jfp-14-376 [DOI] [PubMed] [Google Scholar]
- Jensen AK, Simonsen J and Ethelberg S, 2017. Use of proton pump inhibitors and the risk of listeriosis: a nationwide registry‐based case‐control study. Clinical Infectious Diseases, 64, 845–851. 10.1093/cid/ciw860 [DOI] [PubMed] [Google Scholar]
- Jiang LL, Olesen I, Andersen T, Fang WH and Jespersen L, 2010. Survival of Listeria monocytogenes in simulated gastrointestinal system and transcriptional profiling of stress‐ and adhesion‐related genes. Foodborne Pathogens and Disease, 7, 267–274. 10.1089/fpd.2009.0361 [DOI] [PubMed] [Google Scholar]
- Jofré A, Garriga M, Aymerich T, Pérez‐Rodríguez F, Valero A, Carrasco E and Bover‐Cid S, 2016. Closing gaps for performing a risk assessment on Listeria monocytogenes in ready‐to‐eat (RTE) foods: activity 1, an extensive literature search and study selection with data extraction on L. monocytogenes in a wide range of RTE food. EFSA Supporting Publication 2016;13(12):EN‐1141, 184 pp. 10.2903/sp.efsa.2016.EN-1141. [DOI] [Google Scholar]
- Johnson AE, Donkin AJM, Morgan K, Lilley JM, Neale RJ, Page RM and Silburn R, 1998. Food safety knowledge and practice among elderly people living at home. Journal of Epidemiology and Community Health, 52, 745–748. [DOI] [PMC free article] [PubMed] [Google Scholar]
- Juneja VK, Altuntas EG, Ayhan K, Hwang CA, Sheen S and Friedman M, 2013. Predictive model for the reduction of heat resistance of Listeria monocytogenes in ground beef by the combined effect of sodium chloride and apple polyphenols. International Journal of Food Microbiology, 164, 54–59. 10.1016/j.ijfoodmicro.2013.03.008 [DOI] [PubMed] [Google Scholar]
- Juneja VK and Eblen BS, 1999. Predictive thermal inactivation model for Listeria monocytogenes with temperature, pH, NaCl, and sodium pyrophosphate as controlling factors. Journal of Food Protection, 62, 986–993. [DOI] [PubMed] [Google Scholar]
- Junttila JR, Niemela SI and Hirn J, 1988. Minimum growth temperatures of Listeria monocytogenes and non‐hemolytic Listeria . Journal of Applied Bacteriology, 65, 321–327. 10.1111/j.1365-2672.1988.tb01898.x [DOI] [PubMed] [Google Scholar]
- Kazmierczak MJ, Mithoe SC, Boor KJ and Wiedmann M, 2003. Listeria monocytogenes sigma(B) regulates stress response and virulence functions. Journal of Bacteriology, 185, 5722–5734. 10.1128/jb.185.19.5722-5734.2003 [DOI] [PMC free article] [PubMed] [Google Scholar]
- Kendall H, Kuznesof S, Seal C, Dobson S and Brennan M, 2013. Domestic food safety and the older consumer: a segmentation analysis. Food Quality and Preference, 28, 396–406. 10.1016/j.foodqual.2012.11.006 [DOI] [Google Scholar]
- Kennedy J, Jackson V, Blair IS, McDowell DA, Cowan C and Bolton DJ, 2005a. Food safety knowledge of consumers and the microbiological and temperature status of their refrigerators. Journal of Food Protection, 68, 1421–1430. [DOI] [PubMed] [Google Scholar]
- Kennedy J, Jackson V, Cowan C, Blair I, McDowell D and Bolton D, 2005b. Consumer food safety knowledge ‐ Segmentation of Irish home food preparers based on food safety knowledge and practice. British Food Journal, 107, 441–452. 10.1108/00070700510606864 [DOI] [Google Scholar]
- Keto‐Timonen R, Tolvanen R, Lunden J and Korkeala H, 2007. An 8‐year surveillance of the diversity and persistence of Listeria monocytogenes in a chilled food processing plant analyzed by amplified fragment length polymorphism. Journal of Food Protection, 70, 1866–1873. [DOI] [PubMed] [Google Scholar]
- Keys AL, Dailey RC, Hitchins AD and Smiley RD, 2013. Postenrichment population differentials using buffered Listeria enrichment broth: implications of the presence of Listeria innocua on Listeria monocytogenes in food test samples. Journal of Food Protection, 76, 1854–1862. 10.4315/0362-028x.jfp-13-089 [DOI] [PMC free article] [PubMed] [Google Scholar]
- Koseki S and Isobe S, 2005. Prediction of pathogen growth on iceberg lettuce under real temperature history during distribution from farm to table. International Journal of Food Microbiology, 104, 239–248. 10.1016/j.ijfoodmicro.2005.02.012 [DOI] [PubMed] [Google Scholar]
- Koutsoumanis K, 2009. Modeling food spoilage in microbial risk assessment. Journal of Food Protection, 72, 425–427. [DOI] [PubMed] [Google Scholar]
- Koutsoumanis K, Pavlis A, Nychas GJE and Xanthiakos K, 2010. Probabilistic model for Listeria monocytogenes growth during distribution, retail storage, and domestic storage of pasteurized milk. Applied and Environmental Microbiology, 76, 2181–2191. 10.1128/aem.02430-09 [DOI] [PMC free article] [PubMed] [Google Scholar]
- Koutsoumanis KP, Kendall PA and Sofos JN, 2004. A comparative study on growth limits of Listeria monocytogenes as affected by temperature, pH and aw when grown in suspension or on a solid surface. Food Microbiology, 21, 415–422. 10.1016/j.fm.2003.11.003 [DOI] [Google Scholar]
- Koutsoumanis KP and Lianou A, 2013. Stochasticity in colonial growth dynamics of individual bacterial cells. Applied and Environmental Microbiology, 79, 2294–2301. 10.1128/aem.03629-12 [DOI] [PMC free article] [PubMed] [Google Scholar]
- Kuenne C, Billion A, Abu Mraheil M, Strittmatter A, Daniel R, Goesmann A, Barbuddhe S, Hain T and Chakraborty T, 2013. Reassessment of the Listeria monocytogenes pan‐genome reveals dynamic integration hotspots and mobile genetic elements as major components of the accessory genome. BMC Genomics, 14, 47. 10.1186/1471-2164-14-47 [DOI] [PMC free article] [PubMed] [Google Scholar]
- Laguerre O, Derens E and Palagos B, 2002. Study of domestic refrigerator temperature and analysis of factors affecting temperature: a French survey. International Journal of Refrigeration‐Revue Internationale du Froid, 25, 653–659. 10.1016/s0140-7007(01)00047-0 [DOI] [Google Scholar]
- Lakicevic B and Nastasijevic I, 2017. Listeria monocytogenes in retail establishments: contamination routes and control strategies. Food Reviews International, 33, 247–269. 10.1080/87559129.2016.1175017 [DOI] [Google Scholar]
- Laksanalamai P, Joseph LA, Silk BJ, Burall LS, Tarr CL, Gerner‐Smidt P and Datta AR, 2012. Genomic characterization of Listeria monocytogenes strains involved in a multistate listeriosis outbreak associated with cantaloupe in US. PLoS ONE, 7, e42448. 10.1371/journal.pone.0042448 [DOI] [PMC free article] [PubMed] [Google Scholar]
- Lardeux AL, Guillier L, Brasseur E, Doux C, Gautier J and Gnanou‐Besse N, 2015. Impact of the contamination level and the background flora on the growth of Listeria monocytogenes in ready‐to‐eat diced poultry. Letters in Applied Microbiology, 60, 481–490. 10.1111/lam.12395 [DOI] [PubMed] [Google Scholar]
- Latorre AA, Pradhan AK, Van Kessel JAS, Karns JS, Boor KJ, Rice DH, Mangione KJ, Grohn YT and Schukken YH, 2011. Quantitative risk assessment of listeriosis due to consumption of raw milk. Journal of Food Protection, 74, 1268–1281. 10.4315/0362-028x.jfp-10-554 [DOI] [PubMed] [Google Scholar]
- Le Marc Y, Huchet V, Bourgeois CM, Guyonnet JP, Mafart P and Thuault D, 2002. Modelling the growth kinetics of Listeria as a function of temperature, pH and organic acid concentration. International Journal of Food Microbiology, 73, 219–237. 10.1016/s0168-1605(01)00640-7 [DOI] [PubMed] [Google Scholar]
- Le Marc Y, Pin C and Baranyi J, 2005. Methods to determine the growth domain in a multidimensional environmental space. International Journal of Food Microbiology, 100, 3–12. 10.1016/j.ijfoodmicro.2004.10.003 [DOI] [PubMed] [Google Scholar]
- Le Marc Y, Skandamis PN, Belessi CIA, Merkouri SI, George SM, Gounadaki AS, Schvartzman S, Jordan K, Drosinos EH and Baranyi J, 2010. Modeling the effect of abrupt acid and osmotic shifts within the growth region and across growth boundaries on adaptation and growth of Listeria monocytogenes . Applied and Environmental Microbiology, 76, 6555–6563. 10.1128/aem.00847-10 [DOI] [PMC free article] [PubMed] [Google Scholar]
- Lebert I, Begot C and Lebert A, 1998. Development of two Listeria monocytogenes growth models in a meat broth and their application to beef meal. Food Microbiology, 15, 499–509. 10.1006/fmic.1997.0184 [DOI] [Google Scholar]
- Lecuit M, 2005. Understanding how Listeria monocytogenes targets and crosses host barriers. Clinical Microbiology and Infection, 11, 430–436. 10.1111/j.1469-0691.2005.01146.x [DOI] [PubMed] [Google Scholar]
- Lecuit M and Cossart P, 2001. A transgenic model for listeriosis: role of internalin with E‐cadherin in crossing the intestinal barrier. Medecine Sciences, 17, 1333–1335. 10.1051/medsci/200117121333 [DOI] [PubMed] [Google Scholar]
- Lecuit M, Dramsi S, Gottardi C, Fedor‐Chaiken M, Gumbiner B and Cossart P, 1999. A single amino acid in E‐cadherin responsible for host specificity towards the human pathogen Listeria monocytogenes . EMBO Journal, 18, 3956–3963. 10.1093/emboj/18.14.3956 [DOI] [PMC free article] [PubMed] [Google Scholar]
- Lenhart J, Kendall P, Medeiros L, Doorn J, Schroeder M and Sofos J, 2008. Consumer assessment of safety and date labeling statements on ready‐to‐eat meat and poultry products designed to minimize risk of listeriosis. Journal of Food Protection, 71, 70–76. [DOI] [PubMed] [Google Scholar]
- Lianou A, Stopforth JD, Yoon Y, Wiedmann M and Sofos JN, 2006. Growth and stress resistance variation in culture broth among Listeria monocytogenes strains of various serotypes and origins. Journal of Food Protection, 69, 2640–2647. [DOI] [PubMed] [Google Scholar]
- Likar K and Jevsnik M, 2006. Cold chain maintaining in food trade. Food Control, 17, 108–113. 10.1016/j.foodcont.2004.09.009 [DOI] [Google Scholar]
- Lindqvist R and Westoo A, 2000. Quantitative risk assessment for Listeria monocytogenes in smoked or gravad salmon and rainbow trout in Sweden. International Journal of Food Microbiology, 58, 181–196. 10.1016/s0168-1605(00)00272-5 [DOI] [PubMed] [Google Scholar]
- Linke K, Ruckerl I, Brugger K, Karpiskova R, Walland J, Muri‐Klinger S, Tichy A, Wagner M and Stessl B, 2014. Reservoirs of Listeria species in three environmental ecosystems. Applied and Environmental Microbiology, 80, 5583–5592. 10.1128/aem.01018-14 [DOI] [PMC free article] [PubMed] [Google Scholar]
- Lomonaco S, Nucera D and Filipello V, 2015. The evolution and epidemiology of Listeria monocytogenes in Europe and the United States. Infection Genetics and Evolution, 35, 172–183. 10.1016/j.meegid.2015.08.008 [DOI] [PubMed] [Google Scholar]
- Lundén J, 2004. Persistent Listeria monocytogenes contamination in food processing plants. PhD Thesis, University of Helsinki, Helsinki, Finland, 68 pp., ISBN 952‐991‐6697‐6694 (paperback), ISBN 6952‐6610‐1507‐6691 (PDF). Available online: http://ethesis.helsinki.fi/julkaisut/ela/elint/vk/lunden/ pp.
- Lunden J, Tolvanen R and Korkeala H, 2008. Acid and heat tolerance of persistent and nonpersistent Listeria monocytogenes food plant strains. Letters in Applied Microbiology, 46, 276–280. 10.1111/j.1472-765X.2007.02305.x [DOI] [PubMed] [Google Scholar]
- Lunden J, Vanhanen V, Myllymaki T, Laamanen E, Kotilainen K and Hemminki K, 2014. Temperature control efficacy of retail refrigeration equipment. Food Control, 45, 109–114. 10.1016/j.foodcont.2014.04.041 [DOI] [Google Scholar]
- Lungu B, Ricke SC and Johnson MG, 2009. Growth, survival, proliferation and pathogenesis of Listeria monocytogenes under low oxygen or anaerobic conditions: A review. Anaerobe, 15, 7–17. 10.1016/j.anaerobe.2008.08.001 [DOI] [PubMed] [Google Scholar]
- Maertens De Noordhout C, Devleesschauwer B, Maertens De Noordhout A, Blocher J, Haagsma JA, Havelaar AH and Speybroeck N, 2016. Comorbidities and factors associated with central nervous system infections and death in non‐perinatal listeriosis: a clinical case series. BMC Infectious Diseases, 16, 10.1186/s12879-016-1602-3 [DOI] [PMC free article] [PubMed] [Google Scholar]
- Mafart P, Couvert O, Gaillard S and Leguerinel I, 2002. On calculating sterility in thermal preservation methods: application of the Weibull frequency distribution model. International Journal of Food Microbiology, 72, 107–113. 10.1016/s0168-1605(01)00624-9 [DOI] [PubMed] [Google Scholar]
- Mahoney M and Henriksson A, 2003. The effect of processed meat and meat starter cultures on gastrointestinal colonization and virulence of Listeria monocytogenes in mice. International Journal of Food Microbiology, 84, 255–261. 10.1016/s0168-1605(02)00400-2 [DOI] [PubMed] [Google Scholar]
- Malley TJV, Butts J and Wiedmann M, 2015. Seek and destroy process: Listeria monocytogenes process controls in the ready‐to‐eat meat and poultry industry. Journal of Food Protection, 78, 436–445. 10.4315/0362-028x.jfp-13-507 [DOI] [PubMed] [Google Scholar]
- Marklinder I and Eriksson MK, 2015. Best‐before date ‐ food storage temperatures recorded by Swedish students. British Food Journal, 117, 1764–1776. 10.1108/bfj-07-2014-0236 [DOI] [Google Scholar]
- Marshall DL, Andrews LS, Wells JH and Farr AJ, 1992. Influence of modified atmosphere packaging on the competitive growth of Listeria monocytogenes and Pseudomonas fluorescens on precooked chicken. Food Microbiology, 9, 303–309. 10.1016/0740-0020(92)80038-6 [DOI] [Google Scholar]
- Mataragas M, Drosinos EH, Siana P, Skandamis P and Metaxopoulos I, 2006. Determination of the growth limits and kinetic behavior of Listeria monocytogenes in a sliced cooked cured meat product: Validation of the predictive growth model under constant and dynamic temperature storage conditions. Journal of Food Protection, 69, 1312–1321. [DOI] [PubMed] [Google Scholar]
- Mataragas M, Zwietering MH, Skandamis PN and Drosinos EH, 2010. Quantitative microbiological risk assessment as a tool to obtain useful information for risk managers ‐ Specific application to Listeria monocytogenes and ready‐to‐eat meat products. International Journal of Food Microbiology, 141, S170–S179. 10.1016/j.ijfoodmicro.2010.01.005 [DOI] [PubMed] [Google Scholar]
- Maury M, Chenal‐Francisque V, Bracq‐Dieye H, Han L, Leclercq A, Vales G, Moura A, Gouin E, Scortti M, Disson O, Vázquez‐Boland J and Lecuit M, 2017. Spontaneous loss of virulence in natural populations of Listeria monocytogenes . Infection and Immunity, 85, e00541‐17. 10.1128/IAI.00541-17. [DOI] [PMC free article] [PubMed] [Google Scholar]
- Maury MM, Tsai YH, Charlier C, Touchon M, Chenal‐Francisque V, Leclercq A, Criscuolo A, Gaultier C, Roussel S, Brisabois A, Disson O, Rocha EPC, Brisse S and Lecuit M, 2016. Uncovering Listeria monocytogenes hypervirulence by harnessing its biodiversity. Nature Genetics, 48, 308–313. 10.1038/ng.3501 [DOI] [PMC free article] [PubMed] [Google Scholar]
- Mazza R, Mazzette R, McAuliffe O, Jordan K and Fox EM, 2015. Differential gene expression of three gene targets among persistent and nonpersistent Listeria monocytogenes strains in the presence or absence of benzethonium chloride. Journal of Food Protection, 78, 1569–1573. 10.4315/0362-028x.jfp-14-510 [DOI] [PubMed] [Google Scholar]
- Mazzotta AS, 2001a. Thermal inactivation of stationary‐phase and salt‐adapted Listeria monocytogenes during postprocess pasteurization of surimi‐based imitation crab meat. Journal of Food Protection, 64, 483–485. [DOI] [PubMed] [Google Scholar]
- Mazzotta AS, 2001b. Thermal inactivation of stationary‐phase and acid‐adapted Escherichia coli O157:H7, Salmonella, and Listeria monocytogenes in fruit juices. Journal of Food Protection, 64, 315–320. [DOI] [PubMed] [Google Scholar]
- McCarthy M, Brennan M, Kelly AL, Ritson C, de Boer M and Thompson N, 2007. Who is at risk and what do they know? Segmenting a population on their food safety knowledge. Food Quality and Preference, 18, 205–217. 10.1016/j.foodqual.2005.10.002 [DOI] [Google Scholar]
- McCollum JT, Cronquist AB, Silk BJ, Jackson KA, O'Connor KA, Cosgrove S, Gossack JP, Parachini SS, Jain NS, Ettestad P, Ibraheem M, Cantu V, Joshi M, DuVernoy T, Fogg NW, Gorny JR, Mogen KM, Spires C, Teitell P, Joseph LA, Tarr CL, Imanishi M, Neil KP, Tauxe RV and Mahon BE, 2013. Multistate outbreak of listeriosis associated with cantaloupe. New England Journal of Medicine, 369, 944–953. 10.1056/NEJMoa1215837 [DOI] [PubMed] [Google Scholar]
- McQuestin OJ, Shadbolt CT and Ross T, 2009. Quantification of the relative effects of temperature, pH, and water activity on inactivation of Escherichia coli in fermented meat by meta‐analysis. Applied and Environmental Microbiology, 75, 6963–6972. 10.1128/aem.00291-09 [DOI] [PMC free article] [PubMed] [Google Scholar]
- Mead PS, Slutsker L, Dietz V, McCaig LF, Bresee JS, Shapiro C, Griffin PM and Tauxe RV, 1999. Food‐related illness and death in the United States. Emerging Infectious Diseases, 5, 607–625. [DOI] [PMC free article] [PubMed] [Google Scholar]
- Mejlholm O, Boknaes N and Dalgaard P, 2005. Shelf life and safety aspects of chilled cooked and peeled shrimps (Pandalus borealis) in modified atmosphere packaging. Journal of Applied Microbiology, 99, 66–76. 10.1111/j.1365-2672.2005.02582.x [DOI] [PubMed] [Google Scholar]
- Mejlholm O and Dalgaard P, 2007. Modeling and predicting the growth boundary of Listeria monocytogenes in lightly preserved seafood. Journal of Food Protection, 70, 70–84. [DOI] [PubMed] [Google Scholar]
- Mejlholm O and Dalgaard P, 2009. Development and validation of an extensive growth and growth boundary model for Listeria monocytogenes in lightly preserved and ready‐to‐eat shrimp. Journal of Food Protection, 72, 2132–2143. [DOI] [PubMed] [Google Scholar]
- Mejlholm O and Dalgaard P, 2015. Modelling and predicting the simultaneous growth of Listeria monocytogenes and psychrotolerant lactic acid bacteria in processed seafood and mayonnaise‐based seafood salads. Food Microbiology, 46, 1–14. 10.1016/j.fm.2014.07.005 [DOI] [PubMed] [Google Scholar]
- Mejlholm O, Gunvig A, Borggaard C, Blom‐Hanssen J, Mellefont L, Ross T, Leroi F, Else T, Visser D and Dalgaard P, 2010. Predicting growth rates and growth boundary of Listeria monocytogenes ‐ An international validation study with focus on processed and ready‐to‐eat meat and seafood. International Journal of Food Microbiology, 141, 137–150. 10.1016/j.ijfoodmicro.2010.04.026 [DOI] [PubMed] [Google Scholar]
- Mellefont LA, McMeekin TA and Ross T, 2008. Effect of relative inoculum concentration on Listeria monocytogenes growth in co‐culture. International Journal of Food Microbiology, 121, 157–168. 10.1016/j.ijfoodmicro.2007.10.010 [DOI] [PubMed] [Google Scholar]
- Midelet‐Bourdin G, Beaufort A, Leroi F, Cardinal M, Rudelle S, Leleu G, Copin S and Malle P, 2008. Impact of‐2 degrees C Superchilling before Refrigerated Storage (4 and 8 degrees C) on the Microbiological and Sensory Qualities of Cold‐Smoked Salmon. Journal of Food Protection, 71, 2198–2207. [DOI] [PubMed] [Google Scholar]
- Møller Nielsen E, Björkman JT, Kiil K, Grant K, Dallman T, Painset A, Amar C, Roussel S, Guillier L, Félix B, Rotariu O, Perez‐Reche F, Forbes K and Strachan N, 2017. Closing gaps for performing a risk assessment on Listeria monocytogenes in ready‐to‐eat (RTE) foods: activity 3, the comparison of isolates from different compartments along the food chain, and in humans using whole genome sequencing (WGS) analysis. EFSA Supporting Publication 2017; EN‐1151. 170 pp. 10.2903/sp.efsa.2017.en-1151 [DOI] [Google Scholar]
- Molloy EM, Cotter PD, Hill C, Mitchell DA and Ross RP, 2011. Streptolysin S‐like virulence factors: the continuing sagA . Nature Reviews Microbiology, 9, 670–681. 10.1038/nrmicro2624 [DOI] [PMC free article] [PubMed] [Google Scholar]
- Møretrø T and Langsrud S, 2004. Listeria monocytogenes: biofilm formation and persistence in food‐processing environments. Biofilms, 1, 107–121. 10.1017/S1479050504001322 [DOI] [Google Scholar]
- Moura A, Criscuolo A, Pouseele H, Maury MM, Leclercq A, Tarr C, Bjorkman JT, Dallman T, Reimer A, Enouf V, Larsonneur E, Carleton H, Bracq‐Dieye H, Katz LS, Jones L, Touchon M, Tourdjman M, Walker M, Stroika S, Cantinelli T, Chenal‐Francisque V, Kucerova Z, Rocha EPC, Nadon C, Grant K, Nielsen EM, Pot B, Gerner‐Smidt P, Lecuit M and Brisse S, 2017. Whole genome‐based population biology and epidemiological surveillance of Listeria monocytogenes . Nature Microbiology, 2, 16185. 10.1038/nmicrobiol.2016.185 [DOI] [PMC free article] [PubMed] [Google Scholar]
- Muhterem‐Uyar M, Dalmasso M, Bolocan AS, Hernandez M, Kapetanakou AE, Kuchta T, Manios SG, Melero B, Minarovicovaa J, Nicolau AI, Rovira J, Skandamis PN, Jordan K, Rodriguez‐Lazaro D, Stessl B and Wagner M, 2015. Environmental sampling for Listeria monocytogenes control in food processing facilities reveals three contamination scenarios. Food Control, 51, 94–107. 10.1016/j.foodcont.2014.10.042 [DOI] [Google Scholar]
- Muller A, Rychli K, Muhterem‐Uyar M, Zaiser A, Stessl B, Guinane CM, Cotter PD, Wagner M and Schmitz‐Esser S, 2013. Tn6188 ‐ a novel transposon in Listeria monocytogenes responsible for tolerance to benzalkonium chloride. PLoS ONE, 8, e76835. 10.1371/journal.pone.0076835 [DOI] [PMC free article] [PubMed] [Google Scholar]
- Nadon CA, Bowen BM, Wiedmann M and Boor KJ, 2002. Sigma B contributes to PrfA‐mediated virulence in Listeria monocytogenes . Infection and Immunity, 70, 3948–3952. 10.1128/iai.70.7.3948-3952.2002 [DOI] [PMC free article] [PubMed] [Google Scholar]
- Nauta MJ, 2002. Modelling bacterial growth in quantitative microbiological risk assessment: is it possible? International Journal of Food Microbiology, 73, 297–304. 10.1016/s0168-1605(01)00664-x [DOI] [PubMed] [Google Scholar]
- NicAogain K and O'Byrne CP, 2016. The role of stress and stress adaptations in determining the fate of the bacterial pathogen Listeria monocytogenes in the food chain. Frontiers in Microbiology, 7, 10.3389/fmicb.2016.01865 [DOI] [PMC free article] [PubMed] [Google Scholar]
- Nightingale KK, Ivy RA, Ho AJ, Fortes ED, Njaa BL, Peters RM and Wiedmann M, 2008. inlA premature stop codons are common among Listeria monocytogenes isolates from foods and yield virulence‐attenuated strains that confer protection against fully virulent strains. Applied and Environmental Microbiology, 74, 6570–6583. 10.1128/AEM.00997-08 [DOI] [PMC free article] [PubMed] [Google Scholar]
- Nightingale KK, Schukken YH, Nightingale CR, Fortes ED, Ho AJ, Her Z, Grohn YT, McDonough PL and Wiedmann M, 2004. Ecology and transmission of Listeria monocytogenes infecting ruminants and in the farm environment. Applied and Environmental Microbiology, 70, 4458–4467. 10.1128/aem.70.8.4458-4467.2004 [DOI] [PMC free article] [PubMed] [Google Scholar]
- Notermans S, Dufrenne J, Teunis P and Chackraborty T, 1998. Studies on the risk assessment of Listeria monocytogenes . Journal of Food Protection, 61, 244–248. [DOI] [PubMed] [Google Scholar]
- O'Driscoll B, Gahan CGM and Hill C, 1996. Adaptive acid tolerance response in Listeria monocytogenes: Isolation of an acid‐tolerant mutant which demonstrates increased virulence. Applied and Environmental Microbiology, 62, 1693–1698. [DOI] [PMC free article] [PubMed] [Google Scholar]
- Ooi ST and Lorber B, 2005. Gastroenteritis due to Listeria monocytogenes . Clinical Infectious Diseases, 40, 1327–1332. 10.1086/429324. [DOI] [PubMed] [Google Scholar]
- Orsi RH, den Bakker HC and Wiedmann M, 2011. Listeria monocytogenes lineages: genomics, evolution, ecology, and phenotypic characteristics. International Journal of Medical Microbiology, 301, 79–96. 10.1016/j.ijmm.2010.05.002 [DOI] [PubMed] [Google Scholar]
- Orsi RH and Wiedmann M, 2016. Characteristics and distribution of Listeria spp., including Listeria species newly described since 2009. Applied Microbiology and Biotechnology, 100, 5273–5287. 10.1007/s00253-016-7552-2 [DOI] [PMC free article] [PubMed] [Google Scholar]
- Osaili T, Griffis CL, Martin EM, Beard BL, Keener A and Marcy JA, 2006. Thermal inactivation studies of Escherichia coli O157:H7, Salmonella, and Listeria monocytogenes in ready‐to‐eat chicken‐fried beef patties. Journal of Food Protection, 69, 1080–1086. [DOI] [PubMed] [Google Scholar]
- Ostergaard NB, Christiansen LE and Dalgaard P, 2015. Stochastic modelling of Listeria monocytogenes single cell growth in cottage cheese with mesophilic lactic acid bacteria from aroma producing cultures. International Journal of Food Microbiology, 204, 55–65. 10.1016/j.ijfoodmicro.2015.03.022 [DOI] [PubMed] [Google Scholar]
- Ostergaard NB, Eklow A and Dalgaard P, 2014. Modelling the effect of lactic acid bacteria from starter‐ and aroma culture on growth of Listeria monocytogenes in cottage cheese. International Journal of Food Microbiology, 188, 15–25. 10.1016/j.ijfoodmicro.2014.07.012 [DOI] [PubMed] [Google Scholar]
- Pan YW, Breidt F and Kathariou S, 2009. Competition of Listeria monocytogenes serotype 1/2a and 4b strains in mixed‐culture biofilms. Applied and Environmental Microbiology, 75, 5846–5852. 10.1128/aem.00816-09 [DOI] [PMC free article] [PubMed] [Google Scholar]
- Peleg M and Penchina CM, 2000. Modeling microbial survival during exposure to a lethal agent with varying intensity. Critical Reviews in Food Science and Nutrition, 40, 159–172. 10.1080/10408690091189301 [DOI] [PubMed] [Google Scholar]
- Pereboom MTR, Mannien J, van Almkerk KDJ, Spelten ER, Gitsels JT, Martin L, Hutton EK and Schellevis FG, 2014. What information do Dutch midwives give clients about toxoplasmosis, listeriosis and cytomegalovirus prevention? An exploratory study of videotaped consultations. Patient Education and Counseling, 96, 29–35. 10.1016/j.pec.2014.04.001 [DOI] [PubMed] [Google Scholar]
- Pérez‐Rodríguez F, Carrasco E, Bover‐Cid S, Jofré A and Valero A, 2017. Closing gaps for performing a risk assessment on Listeria monocytogenes in ready‐to‐eat (RTE) foods: activity 2, a quantitative risk characterization on L. monocytogenes in RTE foods; starting from the retail stage. EFSA Supporting Publication 2017;EN‐1252, 211 pp. 10.2903/sp.efsa.2017.en-1252 [DOI] [Google Scholar]
- Petris G, 2010. An R Package for Dynamic Linear Models. Journal of Statistical Software, 36, 1–16. [Google Scholar]
- Petris G, Petrone S and Campagnoli P, 2009. Dynamic linear models. In: Gentleman R, Hornik K, Parmigiani G (eds.). Dynamic Linear Models with R. Springer, Milano, Italy. pp. 31–84 pp. [Google Scholar]
- Pfaff NF and Tillett J, 2016. Listeriosis and toxoplasmosis in pregnancy essentials for healthcare providers. Journal of Perinatal & Neonatal Nursing, 30, 131–138. 10.1097/jpn.0000000000000164 [DOI] [PubMed] [Google Scholar]
- Pharris A, Quinten C, Noori T, Amato‐Gauci AJ, van Sighem A and Surveillance EHA, 2016. Estimating HIV incidence and number of undiagnosed individuals living with HIV in the European Union/European Economic Area, 2015. Eurosurveillance, 21, 4–7. 10.2807/1560-7917.es.2016.21.48.30417 [DOI] [PMC free article] [PubMed] [Google Scholar]
- Piercey MJ, Hingston PA and Hansen LT, 2016. Genes involved in Listeria monocytogenes biofilm formation at a simulated food processing plant temperature of 15 degrees C. International Journal of Food Microbiology, 223, 63–74. 10.1016/j.ijfoodmicro.2016.02.009 [DOI] [PubMed] [Google Scholar]
- Pierre O, 1996. Temperature de conservation de certaines denrées alimentaires très périssables dans les rayons ‘‘libre service’’ des grandes et moyenne surfaces. Option Qualité, 138, 12–18. [Google Scholar]
- Poimenidou S, Belessi CA, Giaouris ED, Gounadaki AS, Nychas GJE and Skandamis PN, 2009. Listeria monocytogenes attachment to and detachment from stainless steel surfaces in a simulated dairy processing environment. Applied and Environmental Microbiology, 75, 7182–7188. 10.1128/aem.01359-09 [DOI] [PMC free article] [PubMed] [Google Scholar]
- Pouillot R, Gallagher D, Tang J, Hoelzer K, Kause J and Dennis SB, 2015a. Listeria monocytogenes in Retail Delicatessens: An Interagency Risk Assessment‐Model and Baseline Results. Journal of Food Protection, 78, 134–145. 10.4315/0362-028x.jfp-14-235 [DOI] [PubMed] [Google Scholar]
- Pouillot R, Goulet V, Delignette‐Muller ML, Mahe A and Cornu M, 2009. Quantitative risk assessment of Listeria monocytogenes in French cold‐smoked salmon: II. Risk characterization. Risk Analysis, 29, 806–819. 10.1111/j.1539-6924.2008.01200.x [DOI] [PubMed] [Google Scholar]
- Pouillot R, Hoelzer K, Chen YH and Dennis SB, 2015b. Listeria monocytogenes dose response revisited‐incorporating adjustments for variability in strain virulence and host susceptibility. Risk Analysis, 35, 90–108. 10.1111/risa.12235 [DOI] [PubMed] [Google Scholar]
- Pouillot R, Klontz KC, Chen Y, Burall LS, Macarisin D, Doyle M, Bally KM, Strain E, Datta AR, Hammack TS and Van Doren JM, 2016. Infectious dose of Listeria monocytogenes in outbreak linked to ice cream, United States, 2015. Emerging Infectious Diseases, 22, 2113–2119. 10.3201/eid2212.160165 [DOI] [PMC free article] [PubMed] [Google Scholar]
- Pouillot R and Lubran MB, 2011. Predictive microbiology models vs. modeling microbial growth within Listeria monocytogenes risk assessment: What parameters matter and why. Food Microbiology, 28, 720–726. 10.1016/j.fm.2010.06.002 [DOI] [PubMed] [Google Scholar]
- Pouillot R, Miconnet N, Afchain AL, Delignette‐Muller ML, Beaufort A, Rosso L, Denis JB and Cornu M, 2007. Quantitative risk assessment of Listeria monocytogenes in French cold‐smoked salmon: I. Quantitative exposure assessment. Risk Analysis, 27, 683–700. 10.1111/j.1539-6924.2007.00921.x [DOI] [PubMed] [Google Scholar]
- Pradhan AK, Ivanek R, Grohn YT, Bukowski R, Geornaras I, Sofos JN and Wiedmann M, 2010. Quantitative risk assessment of listeriosis‐associated deaths due to Listeria monocytogenes contamination of deli meats originating from manufacture and retail. Journal of Food Protection, 73, 620–630. [DOI] [PubMed] [Google Scholar]
- Pradhan AK, Ivanek R, Grohn YT, Bukowski R and Wiedmann M, 2011. Comparison of public health impact of Listeria monocytogenes product‐to‐product and environment‐to‐product contamination of deli meats at retail. Journal of Food Protection, 74, 1860–1868. 10.4315/0362-028x.jfp-10-351 [DOI] [PubMed] [Google Scholar]
- Preussel K, Milde‐Busch A, Schmich P, Wetzstein M, Stark K and Werber D, 2015. Risk factors for sporadic non‐pregnancy associated listeriosis in Germany‐immunocompromised patients and frequently consumed ready‐to‐eat products. PLoS ONE, 10, e0142986. 10.1371/journal.pone.0142986 [DOI] [PMC free article] [PubMed] [Google Scholar]
- Pricope‐Ciolacu L, Nicolau AI, Wagner M and Rychli K, 2013. The effect of milk components and storage conditions on the virulence of Listeria monocytogenes as determined by a Caco‐2 cell assay. International Journal of Food Microbiology, 166, 59–64. 10.1016/j.ijfoodmicro.2013.05.027 [DOI] [PubMed] [Google Scholar]
- R Core Team , 2016. R: A language and environment for statistical computing. R Foundation for Statistical Computing, Vienna, Austria. Available online: https://www.R-project.org/ [Google Scholar]
- Rakhmawati TW, Nysen R and Aerts M, 2014. Statistical analysis of the Listeria monocytogenes EU‐wide baseline survey in certain ready‐to‐eat foods ‐ Part B: analysis of factors related to the prevalence of Listeria monocytogenes, predictive models for the microbial growth and for compliance with food safety criteria. EFSA Supporting Publication 2014;11(8):EN–606, 368 pp. 10.2903/sp.efsa.2014.en-606 [DOI] [Google Scholar]
- Rantsiou K, Mataragas M, Alessandria V and Cocolin L, 2012. Expression of virulence genes of Listeria monocytogenes in food. Journal of Food Safety, 32, 161–168. 10.1111/j.1745-4565.2011.00363.x [DOI] [Google Scholar]
- Redmond EC and Griffith CJ, 2003. Consumer food handling in the home: A review of food safety studies. Journal of Food Protection, 66, 130–161. [DOI] [PubMed] [Google Scholar]
- Reij MW, Den Aantrekker ED and ILSI Europe Risk Analysis in Microbiology Task Force , 2004. Recontamination as a source of pathogens in processed foods. International Journal of Food Microbiology, 91, 1–11. 10.1016/s0168-1605(03)00295-2 [DOI] [PubMed] [Google Scholar]
- Robins MM and Wilson PDG, 1994. Food structure and microbial‐growth. Trends in Food Science & Technology, 5, 289–293. 10.1016/0924-2244(94)90137-6 [DOI] [Google Scholar]
- Robinson TP, Ocio MJ, Kaloti A and Mackey BM, 1998. The effect of the growth environment on the lag phase of Listeria monocytogenes . International Journal of Food Microbiology, 44, 83–92. 10.1016/s0168-1605(98)00120-2 [DOI] [PubMed] [Google Scholar]
- Roccato A, Uyttendaele M and Membre JM, 2017. Analysis of domestic refrigerator temperatures and home storage time distributions for shelf‐life studies and food safety risk assessment. Food Research International, 96, 171–181. 10.1016/j.foodres.2017.02.017 [DOI] [PubMed] [Google Scholar]
- Roche SM, Gracieux P, Milohanic E, Albert I, Virlogeux‐Payant I, Temoin S, Grepinet O, Kerouanton A, Jacquet C, Cossart P and Velge P, 2005. Investigation of specific substitutions in virulence genes characterizing phenotypic groups of low‐virulence field strains of Listeria monocytogenes . Applied and Environmental Microbiology, 71, 6039–6048. 10.1128/AEM.71.10.6039-6048.2005 [DOI] [PMC free article] [PubMed] [Google Scholar]
- Roche SM, Gracieux P and Velge P, 2009. Poor detection of low‐virulence field strains of L. monocytogenes is related to selective agents in selective media and is unrelated to PrfA. Food Microbiology, 26, 21–26. 10.1016/j.fm.2008.08.001 [DOI] [PubMed] [Google Scholar]
- Rose SA, Steadman S and Brunskill R, 1990. A temperature survey of domestic refrigerators. CCFRA Technical Memorandum No. 577.
- Rosenow EM and Marth EH, 1987. Growth of Listeria monocytogenes in skim, whole and chocolate milk, and in whipping cream during incubation at 4°C, 8°C, 13°C, 21°C and 35°C. Journal of Food Protection, 50, 452–459. [DOI] [PubMed] [Google Scholar]
- Ross T, Zhang D and McQuestin OJ, 2008. Temperature governs the inactivation rate of vegetative bacteria under growth‐preventing conditions. International Journal of Food Microbiology, 128, 129–135. 10.1016/j.ijfoodmicro.2008.07.023 [DOI] [PubMed] [Google Scholar]
- Rosso L, Lobry JR, Bajard S and Flandrois JP, 1995. Convenient model to describe the combined effects of temperature and pH on microbial‐growth. Applied and Environmental Microbiology, 61, 610–616. [DOI] [PMC free article] [PubMed] [Google Scholar]
- Rossvoll EH, Lavik R, Ueland O, Jacobsen E, Hagtvedt T and Langsrud S, 2013. Food safety practices among Norwegian consumers. Journal of Food Protection, 76, 1939–1947. 10.4315/0362-028x.jfp-12-269 [DOI] [PubMed] [Google Scholar]
- Rupp S, Aguilar‐Bultet L, Jagannathan V, Guldimann C, Drogemuller C, Pfarrer C, Vidondo B, Seuberlich T, Frey J and Oevermann A, 2015. A naturally occurring prfA truncation in a Listeria monocytogenes field strain contributes to reduced replication and cell‐to‐cell spread. Veterinary Microbiology, 179, 91–101. 10.1016/j.vetmic.2015.03.002 [DOI] [PubMed] [Google Scholar]
- Ryan S, Begley M, Hill C and Gahan CGM, 2010. A five‐gene stress survival islet (SSI‐1) that contributes to the growth of Listeria monocytogenes in suboptimal conditions. Journal of Applied Microbiology, 109, 984–995. 10.1111/j.1365-2672.2010.04726.x [DOI] [PubMed] [Google Scholar]
- Rychli K, Grunert T, Ciolacu L, Zaiser A, Razzazi‐Fazeli E, Schmitz‐Esser S, Ehling‐Schulz M and Wagner M, 2016. Exoproteome analysis reveals higher abundance of proteins linked to alkaline stress in persistent Listeria monocytogenes strains. International Journal of Food Microbiology, 218, 17–26. 10.1016/j.ijfoodmicro.2015.11.002 [DOI] [PubMed] [Google Scholar]
- Rychli K, Muller A, Zaiser A, Schoder D, Allerberger F, Wagner M and Schmitz‐Esser S, 2014. Genome sequencing of Listeria monocytogenes “Quargel” listeriosis outbreak strains reveals two different strains with distinct in vitro virulence potential. PLoS ONE, 9, e89964. 10.1371/journal.pone.0089964 [DOI] [PMC free article] [PubMed] [Google Scholar]
- Sanaa M, Coroller L and Cerf O, 2004. Risk assessment of listeriosis linked to the consumption of two soft cheeses made from raw milk: Camembert of Normandy and Brie of Meaux. Risk Analysis, 24, 389–399. 10.1111/j.0272-4332.2004.00440.x [DOI] [PubMed] [Google Scholar]
- Sant'Ana AS, Franco B and Schaffner DW, 2012. Modeling the growth rate and lag time of different strains of Salmonella enterica and Listeria monocytogenes in ready‐to‐eat lettuce. Food Microbiology, 30, 267–273. 10.1016/j.fm.2011.11.003 [DOI] [PubMed] [Google Scholar]
- Sant'Ana AS, Franco B and Schaffner DW, 2014. Risk of infection with Salmonella and Listeria monocytogenes due to consumption of ready‐to‐eat leafy vegetables in Brazil. Food Control, 42, 1–8. 10.1016/j.foodcont.2014.01.028 [DOI] [Google Scholar]
- Schmitz‐Esser S, Muller A, Stessl B and Wagner M, 2015. Genomes of sequence type 121 Listeria monocytogenes strains harbor highly conserved plasmids and prophages. Frontiers in Microbiology, 6, 10. 10.3389/fmicb.2015.00380 [DOI] [PMC free article] [PubMed] [Google Scholar]
- Schvartzman MS, Belessi C, Butler F, Skandamis PN and Jordan KN, 2011. Effect of pH and water activity on the growth limits of Listeria monocytogenes in a cheese matrix at two contamination levels. Journal of Food Protection, 74, 1805–1813. 10.4315/0362-028x.jfp-11-102 [DOI] [PubMed] [Google Scholar]
- Schvartzman MS, Belessi X, Butler F, Skandamis P and Jordan K, 2010. Comparison of growth limits of Listeria monocytogenes in milk, broth and cheese. Journal of Applied Microbiology, 109, 1790–1799. 10.1111/j.1365-2672.2010.04807.x [DOI] [PubMed] [Google Scholar]
- Schwartz KT, Carleton JD, Quillin SJ, Rollins SD, Portnoy DA and Leber JH, 2012. Hyperinduction of host beta interferon by a Listeria monocytogenes strain naturally overexpressing the multidrug efflux pump MdrT. Infection and Immunity, 80, 1537–1545. 10.1128/IAI.06286-11 [DOI] [PMC free article] [PubMed] [Google Scholar]
- Sergelidis D, Abrahim A, Sarimvei A, Panoulis C, Karaioannoglou P and Genigeorgis C, 1997. Temperature distribution and prevalence of Listeria spp. in domestic, retail and industrial refrigerators in Greece. International Journal of Food Microbiology, 34, 171–177. 10.1016/s0168-1605(96)01175-0 [DOI] [PubMed] [Google Scholar]
- Shadbolt CT, Ross T and McMeekin TA, 1999. Nonthermal death of Escherichia coli . International Journal of Food Microbiology, 49, 129–138. 10.1016/s0168-1605(99)00060-4 [DOI] [PubMed] [Google Scholar]
- Shellman SM, 2004. Time series intervals and statistical inference: the effects of temporal aggregation on event data analysis. Political Analysis, 12, 97–104. [Google Scholar]
- Silk BJ, McCoy MH, Iwamoto M and Griffin PM, 2014. Foodborne listeriosis acquired in hospitals. Clinical Infectious Diseases, 59, 532–540. 10.1093/cid/ciu365 [DOI] [PubMed] [Google Scholar]
- Skandamis PN and Jeanson S, 2015. Colonial vs. planktonic type of growth: mathematical modeling of microbial dynamics on surfaces and in liquid, semi‐liquid and solid foods. Frontiers in Microbiology, 6, 10.3389/fmicb.2015.01178 [DOI] [PMC free article] [PubMed] [Google Scholar]
- Skandamis PN, Stopforth JD, Yoon Y, Kendall PA and Sofos JN, 2007. Modeling the effect of storage atmosphere on growth ‐ no growth interface of Listeria monocytogenes as a function of temperature, sodium lactate, sodium diacetate, and NaCl. Journal of Food Protection, 70, 2329–2338. [DOI] [PubMed] [Google Scholar]
- Stasiewicz MJ, Martin N, Laue S, Grohn YT, Boor KJ and Wiedmann M, 2014. Responding to bioterror concerns by increasing milk pasteurization temperature would increase estimated annual deaths from listeriosis. Journal of Food Protection, 77, 696–705. 10.4315/0362-028x.jfp-13-191 [DOI] [PubMed] [Google Scholar]
- Stasiewicz MJ, Oliver HF, Wiedmann M and den Bakker HC, 2015. Whole‐genome sequencing allows for improved identification of persistent Listeria monocytogenes in food‐associated environments. Applied and Environmental Microbiology, 81, 6024–6037. 10.1128/aem.01049-15 [DOI] [PMC free article] [PubMed] [Google Scholar]
- Sue D, Fink D, Wiedmann M and Boor KJ, 2004. Sigma(B)‐dependent gene induction and expression in Listeria monocytogenes during osmotic and acid stress conditions simulating the intestinal environment. Microbiology‐Sgm, 150, 3843–3855. 10.1099/mic.0.27257-0 [DOI] [PubMed] [Google Scholar]
- Taoukis PS, Giannakourou MC, Koutsoumanis K and Bakalis S, 2005. Modelling the effect of house hold chilled storage conditions on the risk distribution in meat products. Proceedings of the 3rd international symposium on applications of modelling, as an innovative technology in the Agri‐Food Chain, Louvain, Belgium. 29 May – 2 June 2005.
- Tasara T and Stephan R, 2006. Cold stress tolerance of Listeria monocytogenes: a review of molecular adaptive mechanisms and food safety implications. Journal of Food Protection, 69, 1473–1484. [DOI] [PubMed] [Google Scholar]
- Temoin S, Roche SM, Grepinet O, Fardini Y and Velge P, 2008. Multiple point mutations in virulence genes explain the low virulence of Listeria monocytogenes field strains. Microbiology‐Sgm, 154, 939–948. 10.1099/mic.0.2007/011106-0 [DOI] [PubMed] [Google Scholar]
- Tenenhaus‐Aziza F, Daudin JJ, Maffre A and Sanaa M, 2014. Risk‐based approach for microbiological food safety management in the dairy industry: the case of Listeria monocytogenes in soft cheese made from pasteurized milk. Risk Analysis, 34, 56–74. 10.1111/risa.12074 [DOI] [PubMed] [Google Scholar]
- Terpstra MJ, Steenbekkers LPA, de Maertelaere NCM and Nijhuis S, 2005. Food storage and disposal: consumer practices and knowledge. British Food Journal, 107, 526–533. 10.1108/00070700510606918 [DOI] [Google Scholar]
- Theys TE, Geeraerd AH, Verhulst A, Poot K, Van Bree I, Devlieghere F, Moldenaers R, Wilson D, Brocklehurst T and Van Impe JF, 2008. Effect of pH, water activity and gel micro‐structure, including oxygen profiles and rheological characterization, on the growth kinetics of Salmonella Typhimurium . International Journal of Food Microbiology, 128, 67–77. 10.1016/j.ijfoodmicro.2008.06.031 [DOI] [PubMed] [Google Scholar]
- Thomas MK, Murray R, Flockhart L, Pintar K, Pollari F, Fazil A, Nesbitt A and Marshall B, 2013. Estimates of the burden of foodborne illness in Canada for 30 specified pathogens and unspecified agents, circa 2006. Foodborne Pathogens and Disease, 10, 639–648. 10.1089/fpd.2012.1389 [DOI] [PMC free article] [PubMed] [Google Scholar]
- Tienungoon S, Ratkowsky DA, McMeekin TA and Ross T, 2000. Growth limits of Listeria monocytogenes as a function of temperature, pH, NaCl, and lactic acid. Applied and Environmental Microbiology, 66, 4979–4987. 10.1128/aem.66.11.4979-4987.2000 [DOI] [PMC free article] [PubMed] [Google Scholar]
- Tromp SO, Rijgersberg H and Franz E, 2010. Quantitative microbial risk assessment for Escherichia coli O157:H7, Salmonella enterica, and Listeria monocytogenes in leafy green vegetables consumed at salad bars, based on modeling supply chain logistics. Journal of Food Protection, 73, 1830–1840. [DOI] [PubMed] [Google Scholar]
- Uyttendaele M, Rajkovic A, Benos G, Francois K, Devlieghere F and Debevere J, 2004. Evaluation of a challenge testing protocol to assess the stability of ready‐to‐eat cooked meat products against growth of Listeria monocytogenes . International Journal of Food Microbiology, 90, 219–236. 10.1016/s0168-1605(03)00305-2 [DOI] [PubMed] [Google Scholar]
- van der Veen S, Moezelaar R, Abee T and Wells‐Bennik MHJ, 2008. The growth limits of a large number of Listeria monocytogenes strains at combinations of stresses show serotype‐ and niche‐specific traits. Journal of Applied Microbiology, 105, 1246–1258. 10.1111/j.1365-2672.2008.03873.x [DOI] [PubMed] [Google Scholar]
- van Lier A, McDonald SA, Bouwknegt M, Kretzschmar ME, Havelaar AH, Mangen MJJ, Wallinga J, de Melker HE and Grp EPI, 2016. Disease burden of 32 infectious diseases in the Netherlands, 2007‐2011. PLoS ONE, 11, e0153106. 10.1371/journal.pone.0153106. [DOI] [PMC free article] [PubMed] [Google Scholar]
- van Lieverloo JHM, de Roode M, Fox MB, Zwietering MH and Wells‐Bennik MHJ, 2013. Multiple regression model for thermal inactivation of Listeria monocytogenes in liquid food products. Food Control, 29, 394–400. 10.1016/j.foodcont.2012.05.078 [DOI] [Google Scholar]
- Van Stelten A and Nightingale KK, 2008. Development and implementation of a multiplex single‐nucleotide polymorphism genotyping assay for detection of virulence‐attenuating mutations in the Listeria monocytogenes virulence‐associated gene inlA . Applied and Environmental Microbiology, 74, 7365–7375. 10.1128/AEM.01138-08. [DOI] [PMC free article] [PubMed] [Google Scholar]
- Van Stelten A, Simpson JM, Ward TJ and Nightingale KK, 2010. Revelation by single‐nucleotide polymorphism genotyping that mutations leading to a premature stop codon in inlA are common among Listeria monocytogenes isolates from ready‐to‐eat foods but not human listeriosis cases. Applied and Environmental Microbiology, 76, 2783–2790. 10.1128/AEM.02651-09 [DOI] [PMC free article] [PubMed] [Google Scholar]
- Vasquez GA, Busschaert P, Haberbeck LU, Uyttendaele M and Geeraerd AH, 2014. An educationally inspired illustration of two‐dimensional Quantitative Microbiological Risk Assessment (QMRA) and sensitivity analysis. International Journal of Food Microbiology, 190, 31–43. 10.1016/j.ijfoodmicro.2014.07.034 [DOI] [PubMed] [Google Scholar]
- Vazquez‐Boland JA, Kuhn M, Berche P, Chakraborty T, Dominguez‐Bernal G, Goebel W, Gonzalez‐Zorn B, Wehland J and Kreft J, 2001. Listeria pathogenesis and molecular virulence determinants. Clinical Microbiology Reviews, 14, 584–640. 10.1128/CMR.14.3.584-640.2001 [DOI] [PMC free article] [PubMed] [Google Scholar]
- Vegara A, Festino AR, Di Ciccio P, Costanzo C, Pennisi L and Ianieri A, 2014. The management of the domestic refrigeration: microbiological status and temperature. British Food Journal, 116, 1047–1057. 10.1108/bfj-05-2012-0103 [DOI] [Google Scholar]
- Velge P and Roche SM, 2010. Variability of Listeria monocytogenes virulence: a result of the evolution between saprophytism and virulence? Future Microbiology, 5, 1799–1821. 10.2217/fmb.10.134 [DOI] [PubMed] [Google Scholar]
- Vermeulen A, Gysemans KPM, Bernaerts K, Geeraerd AH, Van Impe JF, Debevere J and Devlieghere F, 2007. Influence of pH, water activity and acetic acid concentration on Listeria monocytogenes at 7°C: Data collection for the development of a growth/no growth model. International Journal of Food Microbiology, 114, 332–341. 10.1016/j.ijfoodmicro.2006.09.023 [DOI] [PubMed] [Google Scholar]
- Victoria R, 1993. Ne joues pas avec le froid. 50 millions de consommateur, 267, 36–37. [Google Scholar]
- Wagner M, Melzner D, Bago Z, Winter P, Egerbacher M, Schilcher F, Zangana A and Schoder D, 2005. Outbreak of clinical listeriosis in sheep: evaluation from possible contamination routes from feed to raw produce and humans. Journal of Veterinary Medicine Series B‐Infectious Diseases and Veterinary Public Health, 52, 278–283. 10.1111/j.1439-0450.2005.00866.x [DOI] [PubMed] [Google Scholar]
- Walderhaug MO, Polarek JW, Voelkner P, Daniel JM, Hesse JE, Altendorf K and Epstein W, 1992. KdpD and KdpE, proteins that control expression of the kdpABC operon, are members of the 2‐component sensor‐effector class of regulators. Journal of Bacteriology, 174, 2152–2159. [DOI] [PMC free article] [PubMed] [Google Scholar]
- Walecka E, Molenda J, Karpiskova R and Bania J, 2011. Effect of osmotic stress and culture density on invasiveness of Listeria monocytogenes strains. International Journal of Food Microbiology, 144, 440–445. 10.1016/j.ijfoodmicro.2010.10.032 [DOI] [PubMed] [Google Scholar]
- Walker SJ, Archer P and Banks JG, 1990. Growth of Listeria monocytogenes at refrigeration temperatures. Journal of Applied Bacteriology, 68, 157–162. 10.1111/j.1365-2672.1990.tb02561.x [DOI] [PubMed] [Google Scholar]
- Wemmenhove E, van Valenberg HJF, Zwietering MH, van Hooijdonk TCM and Wells‐Bennik MHJ, 2016. Minimal inhibitory concentrations of undissociated lactic, acetic, citric and propionic acid for Listeria monocytogenes under conditions relevant to cheese. Food Microbiology, 58, 63–67. 10.1016/j.fm.2016.03.012 [DOI] [PubMed] [Google Scholar]
- West M and Harrison J, 1997. Bayesian forecasting and dynamic models, 2nd Edition. Springer‐Verlag, New York, 681 pp. [Google Scholar]
- Whiting RC and Golden MH, 2002. Variation among Escherichia coli O157:H7 strains relative to their growth, survival, thermal inactivation, and toxin production in broth. International Journal of Food Microbiology, 75, 127–133. 10.1016/s0168-1605(02)00003-x [DOI] [PubMed] [Google Scholar]
- WHO and FAO (World Health Organization and Food and Agriculture Organization of the United Nations), 2007. Working principles for risk analysis for food safety for application by governments. Rome, Italy. 41 pp. CAC/GL 62‐2007. Available online: www.codexalimentarius.net/input/download/standards/10751/CXG_062e.pdf
- Williams D, Castleman J, Lee CC, Mote B and Smith MA, 2009. Risk of fetal mortality after exposure to Listeria monocytogenes based on dose‐response data from pregnant Guinea pigs and primates. Risk Analysis, 29, 1495–1505. 10.1111/j.1539-6924.2009.01308.x [DOI] [PubMed] [Google Scholar]
- Wilson PDG, Brocklehurst TF, Arino S, Thuault D, Jakobsen M, Lange M, Farkas J, Wimpenny JWT and Van Impe JF, 2002. Modelling microbial growth in structured foods: towards a unified approach. International Journal of Food Microbiology, 73, 275–289. 10.1016/s0168-1605(01)00660-2 [DOI] [PubMed] [Google Scholar]
- Winkowski K, Crandall AD and Montville TJ, 1993. Inhibition of Listeria monocytogenes by Lactobacillus bavaricus MN in beef systems at refrigeration temperatures. Applied and Environmental Microbiology, 59, 2552–2557. [DOI] [PMC free article] [PubMed] [Google Scholar]
- Worsfold D and Griffith C, 1997. Food safety behaviour in the home. British Food Journal, 93, 97–104. [Google Scholar]
- WRAP (Waste and Resources Action Programme), 2010. Reducing food waste through the chill chain. Available online: http://www.wrap.org.uk/content/report-insights-around-domestic-refrigerator
- Yang H, Mokhtari A, Jaykus LA, Morales RA, Cates SC and Cowen P, 2006. Consumer phase risk assessment for Listeria monocytogenes in deli meats. Risk Analysis, 26, 89–103. 10.1111/j.1539-6924.2006.00717.x [DOI] [PubMed] [Google Scholar]
- Zhang DL, McQuestin OJ, Mellefont LA and Ross T, 2010b. The influence of non‐lethal temperature on the rate of inactivation of vegetative bacteria in inimical environments may be independent of bacterial species. Food Microbiology, 27, 453–459. 10.1016/j.fm.2009.12.006 [DOI] [PubMed] [Google Scholar]
- Zhang DL, Ross T and Bowman JP, 2010a. Physiological aspects of Listeria monocytogenes during inactivation accelerated by mild temperatures and otherwise non‐growth permissive acidic and hyperosmotic conditions. International Journal of Food Microbiology, 141, 177–185. 10.1016/j.ijfoodmicro.2010.05.015 [DOI] [PubMed] [Google Scholar]
- Zilelidou E, Karmiri CV, Zoumpopoulou G, Mavrogonatou E, Kletsas D, Tsakalidou E, Papadimitriou K, Drosinos E and Skandamis P, 2016b. Listeria monocytogenes strains underrepresented during selective enrichment with an ISO method might dominate during passage through simulated gastric fluid and in vitro infection of Caco‐2 cells. Applied and Environmental Microbiology, 82, 6846–6858. 10.1128/aem.02120-16 [DOI] [PMC free article] [PubMed] [Google Scholar]
- Zilelidou E, Manthou E and Skandamis P, 2016a. Growth differences and competition between Listeria monocytogenes strains determine their predominance on ham slices and lead to bias during selective enrichment with the ISO protocol. International Journal of Food Microbiology, 235, 60–70. 10.1016/j.ijfoodmicro.2016.07.016 [DOI] [PubMed] [Google Scholar]
- Zilelidou EA, Rychli K, Manthou E, Ciolacu L, Wagner M and Skandamis PN, 2015. Highly invasive Listeria monocytogenes strains have growth and invasion advantages in strain competition. PLoS ONE, 10, 10.1371/journal.pone.0141617 [DOI] [PMC free article] [PubMed] [Google Scholar]
- Zitz U, Zunabovic M, Domig KJ, Wilrich PT and Kneifel W, 2011. Reduced detectability of Listeria monocytogenes in the presence of Listeria innocua . Journal of Food Protection, 74, 1282–1287. 10.4315/0362-028x.jfp-11-045 [DOI] [PubMed] [Google Scholar]
- Zuliani V, Lebert I, Augustin JC, Garry P, Vendeuvre JL and Lebert A, 2007. Modelling the behaviour of Listeria monocytogenese in ground and pork as a function of pH, water activity, nature and concentration of organic acid salts. Journal of Applied Microbiology, 103, 536–550. 10.1111/j.1365-2672.2007.03283.x [DOI] [PubMed] [Google Scholar]
- Zwietering MH, Wijtzes T, Dewit JC and Vantriet K, 1992. A decision support system for prediction of the microbial spoilage in foods. Journal of Food Protection, 55, 973–979. [DOI] [PubMed] [Google Scholar]