

Abstract
Objective
To investigate the prognostic value of serum amyloid A (SAA) in the patients with Corona Virus Disease 2019 (COVID-19).
Methods
The medical data of 89 COVID-19 patients admitted to Renmin Hospital of Wuhan University from January 3, 2020 to February 26, 2020 were collected. Eighty-nine cases were divided into survival group (53 cases) and non-survival group (36 cases) according to the results of 28-day follow-up. The SAA levels of all patients were recorded and compared on 1 day after admission (before treatment) and 3 days, 5 days, and 7 days after treatment. The ROC curve was drawn to analyze the prognosis of patients with COVID-19 by SAA.
Results
The difference of comparison of SAA between survival group and non-survival group before treatment was not statistically significant, Z1 = − 1.426, P = 0.154. The Z1 values (Z1 is the Z value of the rank sum test) of the two groups of patients at 3 days, 5 days, and 7 days after treatment were − 5.569, − 6.967, and − 7.542, respectively. The P values were all less than 0.001, and the difference was statistically significant. The ROC curve results showed that SAA has higher sensitivity to the prognostic value of 1 day (before treatment), 3 days, 5 days, and 7 days after treatment, with values of 0.806, 0.972, 0.861, and 0.961, respectively. Compared with SAA on the 7th day and C-reactive protein, leukocyte count, neutrophil count, lymphocyte count, and hemoglobin on the 7th day, the sensitivities were: 96.1%, 83.3%, 88.3%, 83.3%, 67.9%, and 83.0%, respectively, of which SAA has the highest sensitivity.
Conclusion
SAA can be used as a predictor of the prognosis in patients with COVID-19.
Keywords: COVID-19, Serum amyloid A, Prognosis
Introduction
Since December 2019, cases of pneumonia of unknown origin have been reported in Wuhan, Hubei Province. On January 7, 2020, the virus was identified as severe acute respiratory syndrome coronavirus 2 (SARS-CoV-2) [1]. The World Health Organization named it COVID-19. Until 5 pm on March 10, 2020, a total of 113,702 COVID-19 cases have been diagnosed and 4012 deaths all over the world, affecting 110 countries [2, 3], with a fatality rate of 3.53%, and a higher mortality rate among older men with severe underlying diseases [4]. It is important for those patients with COVID-19 to judge the prognosis of patients accurately, and to take more active and effective treatment measures. Currently serum amyloid A (SAA) is commonly used as one of the indicators of inflammation monitoring in clinical practice [5–9]. This article analyzes the dynamic changes of SAA in 89 patients with COVID-19 in Renmin Hospital of Wuhan University to evaluate the clinical prognostic value of SAA, which is reported as follows.
Methods
Research objective
The data of 89 patients with COVID-19 who were admitted to Renmin Hospital of Wuhan University from January 3, 2020 to February 26, 2020 were collected, according to “Guidance for Corona Virus Disease 2019 Prevention, Control, Diagnosis and Management” [10]. All cases follow-up visited, according the 28-day follow-up results. And the follow-up date was March 26, 2020.
Inclusion criteria [10]: those who meet one of the following criteria for the diagnosis of severe cases: (1) respiratory distress, RR ≥ 30 breaths/min; (2) pulse oxygen saturation (SpO2) ≤ 93% on room air at rest state; (3) arterial partial pressure of oxygen (PaO2)/oxygen concentration (FiO2) ≤ 300 mmHg (1 mmHg = 0.133 kPa); (4) patients with > 50% lesions progression within 24–48 h in pulmonary imaging; those who meet one of the following criteria are diagnosed as critically ill cases: (1) respiratory failure occurs and mechanical ventilation is required; (2) shock occurs; (3) complicated with other organ failure that requires monitoring and treatment.
Exclusion criteria: (1) age < 18 years; (2) pregnant or lactating women; (3) treatment period less than 7 days; (4) patients with end-stage liver and kidney failure, advanced malignant tumors and other serious underlying diseases; (5) patients and their families who signed do not resuscitate (DNR) beforehand; (6) patients who lost contact during follow-up.
Research method
Materials and grouping method
Collect general information, physical examination, and supporting information of all patients within 6 h after admission, and collect blood samples of patients within 24 h including blood routine, blood biochemistry, coagulation function, d-dimer, etc. There were 26 severe cases and 63 critical cases among total 89 patients, with no mild and common cases included. Indicators including the SAA results of all patients were recorded on the 1 day of admission (before treatment), 3 days, 5 days, and 7 days after treatment, and to follow up, we contacted all patients by telephone after 28 days. Based on the 28-day follow-up results, we divided 89 cases with COVID-19 into survival groups (53 cases) and non-survival group (36 patients).
Monitoring indicators and detection methods
Patients in both groups were treated according to the guidelines [10], including conventional treatment including early effective oxygen therapy, glucocorticoids, and antiviral and nutritional support. 5 mL of venous blood was drawn by fasting in the early morning to measure the SAA level on the 1 day (before treatment), 3 days, 5 days, and 7 days after treatment.
After the venous blood was collected, it was centrifuged at 4 °C (speed of rotation: 3000 r/min × 3 min, and the centrifuge radius was 22 cm). The upper serum was taken and stored in a refrigerator at − 20 °C for testing. SAA was detected by immunoturbidimetry (Hitachi 7170 automatic biochemical instrument), and SAA normal value < 10 mg/L. All parameter settings and experimental steps are carried out in strict accordance with its operating procedures.
Statistical methods
After data collection, SPSS 26.0 software was used to analyze the data. The count data were expressed as [cases (%)], and comparison between groups was performed using Chi-square test. Measurement data were expressed as mean ± standard deviation (). Comparison between groups was performed using the independent sample t test, and multivariate logistic regression analysis was used to analyze the statistically significant indicators between groups. The two groups of patients used SAA on the 1 day (before treatment), and 3 days, 5 days, 7 days after treatment were compared using rank sum tests. The ROC curve was used to evaluate the predictive value of SAA at the 1 day, 3 day, 5 day, and 7 day levels, and the value of SAA on the 7th day compared with other indexes on the 7th day for prognosis judgment of patients with COVID-19. The Z2 value (Z2 is the Z value of the ROC curve using the DeLong method) was used for comparison between groups. P < 0.05 was considered statistically significant.
Results
Comparison of baseline data between survival and non-survival groups
Eighty-nine patients included 49 males and 40 females, aged 21–96 years, mean age (59.74 ± 16.42) years old. As shown in the baseline data in Table 1, the non-survival group was older than the survival group (P < 0.001), the non-survival group the patients number with dyspnea symptoms and decreased blood oxygen saturation was more than the survival group (P = 0.043, P < 0.001); the non-survival group patients number with hypertension and cluster-onset was more than those in the survival group (P < 0.001, P = 0.014); there were no statistically significant differences in gender composition ratio, heart rate, blood pressure, respiratory frequency, body temperature, and other symptoms and previous medical history in the two groups.
Table 1.
Comparison of general data of study population ()
| project | Survival group (n = 53) | Non-survival group (n = 36) | t/ value | P value |
|---|---|---|---|---|
| Age (years) | 53.58 ± 15.760 | 68.81 ± 12.932 | − 4.798 | < 0.001 |
| Male/female (cases) | 29/24 | 20/16 | 0.006 | 0.938 |
| Heart rate (bpm) | 85.13 ± 12.639 | 86.50 ± 18.434 | − 0.416 | 0.679 |
| Respiratory rate (bpm) | 19.62 ± 2.297 | 20.56 ± 5.174 | − 1.158 | 0.250 |
| Systolic pressure (mmHg) | 125.13 ± 20.414 | 133.78 ± 21.469 | − 1.920 | 0.058 |
| Diastolic pressure(mmHg) | 73.77 ± 10.606 | 75.81 ± 14.867 | − 0.753 | 0.454 |
| SpO2 (%) | 95.28 ± 2.656 | 91.53 ± 6.222 | 3.908 | < 0.001 |
| Body temperature (°C) | 37.19 ± 0.816 | 37.01 ± 0.887 | 1.040 | 0.301 |
| Clinical manifestation n (%) | ||||
| Fever | 45 (84.9) | 28 (77.8) | 0.739 | 0.390 |
| Cough | 26 (49.1) | 14 (38.9) | 0.896 | 0.344 |
| Expectoration | 12 (22.6) | 8 (22.2) | 0.002 | 0.963 |
| Sore throat | 3 (5.7) | 0 (0) | 0.269b | 0.206 |
| Blocked nose | 3 (5.7) | 1 (2.8) | 0.015a | 0.902 |
| Runny nose | 3 (5.7) | 1 (2.8) | 0.015a | 0.902 |
| Chest tightness | 15 (28.3) | 13 (36.1) | 0.606 | 0.436 |
| Shortness of breath | 8 (15.1) | 11 (30.6) | 3.052 | 0.081 |
| Dyspnea | 8 (15.1) | 12 (33.3) | 4.093 | 0.043 |
| Fatigue | 17 (32.1) | 19 (52.8) | 3.814 | 0.051 |
| Basic disease n (%) | ||||
| Hypertension | 6 (11.3) | 18 (50.0) | 16.285 | < 0.001 |
| Cardiovascular diseases | 2 (3.8) | 5 (13.9) | 1.792a | 0.181 |
| Diabetes | 3 (5.7) | 6 (16.7) | 1.774a | 0.183 |
| COPD | 2 (3.8) | 4 (11.1) | 0.854a | 0.355 |
| Cerebrovascular disease | 1 (1.9) | 3 (8.3) | 0.845a | 0.358 |
| History of cancer | 3 (5.7) | 2 (5.6) | 0.000a | 1.000 |
| History of taking hormones | 4 (7.5) | 3 (8.3) | 0.000a | 1.000 |
| Connective tissue disease | 1 (1.9) | 2 (5.6) | 0.118a | 0.732 |
| History of smoking n (%) | 6 (11.3) | 5 (13.9) | 0.131 | 0.718 |
| History of drinking n (%) | 1 (1.9) | 1 (2.8) | 0.000a | 1.000 |
| Cluster onset n (%) | 20 (37.7) | 5 (13.9) | 6.036 | 0.014 |
COPD chronic obstructive pulmonary disease, SPO2 blood oxygen saturation
aChi-square value of continuous correction
bFisher test
Comparison of indicators before treatment in survival group and non-survival group
As shown in Table 2, the leukocyte count, neutrophil count, procalcitonin, lactate dehydrogenase, urea nitrogen, creatinine, blood glucose, and d-dimer in the death group were higher than those in the survival group, all P < 0.05, The difference was statistically significant; the lymphocyte counts, hemoglobin, albumin, and antithrombin III activity values in the non-survival group were all lower than those in the survival group, all P < 0.05, and the difference was statistically significant.
Table 2.
Analysis and comparison of various indicators of the study population on the first day of admission
| Survival group (n = 53) | Non-survival group (n = 36) | z value | P value | |
|---|---|---|---|---|
| Leukocyte count (109/L) | 4.59 (3.57, 5.935) | 8.91 (5.627, 13.442) | − 5.095 | < 0.001 |
| Neutrophil count (109/L) | 2.58 (2.115, 4.035) | 7.865 (4.365, 12.215) | − 5.538 | < 0.001 |
| Lymphocyte count (109/L) | 1.11 (0.865, 1.525) | 0.71 (0.435, 1.087) | − 3.553 | < 0.001 |
| Hemoglobin (g/L) | 129 (116.5, 140) | 121.50 (91.75, 134) | − 2.425 | 0.015 |
| Platelet count (109/L) | 176 (132, 230) | 185 (131.25, 264.25) | − 0.435 | 0.664 |
| CRP(mg/L) | 24.0 (12.5, 49.6) | 47.8 (13, 112.925) | − 1.915 | 0.056 |
| Serum amyloid A (mg/L) | 200 (87.52, 200) | 133.88 (63.635, 200) | − 1.426 | 0.154 |
| Procalcitonin (μg/L) | 0.04 (0.04, 0.04) | 0.194 (0.069, 2.111) | − 6.419 | < 0.001 |
| ALT/AST | 0.79 (0.595, 1.00) | 0.755 (0.57, 0.895) | − 0.928 | 0.353 |
| Albumin (g/L) | 38.9 (37.0, 41.8) | 34.6 (30.4, 37.1) | − 5.020 | < 0.001 |
| Lactate dehydrogenase (μ/L) | 242 (175, 309) | 417 (234, 511) | − 3.849 | < 0.001 |
| Urea nitrogen (μmol/L) | 4.02 (3.405, 5.08) | 9.81 (5.47, 20.875) | − 5.480 | < 0.001 |
| Creatinine (μmol/L) | 58 (51, 72) | 87 (57.75, 182.25) | − 3.734 | < 0.001 |
| Blood glucose (mmol/L) | 5.2 (4.81, 6.375) | 6.285 (5.072, 8.655) | − 2.934 | 0.003 |
| GFR (mL/min) | 103.55 (96.83, 113.35) | 66.595 (27.977, 96.732) | − 5.726 | < 0.001 |
| Prothrombin time (s) | 11.8 (11.3, 12.25) | 12.35 (11.525, 14.6) | − 1.774 | 0.076 |
| PT activity (%) | 89.7 (81.5, 95) | 78.15 (58.125, 92.995) | − 2.512 | 0.012 |
| INR | 1.05 (1, 1.20) | 1.09 (0.99, 1.27) | − 0.280 | 0.779 |
| APTT (s) | 29.8 (26.8, 34.635) | 30.15 (25.5, 34.15) | − 0.581 | 0.561 |
| Fibrinogen (g/L) | 4.05 (3.29, 5.045) | 4.16 (3.395, 5.76) | − 0.614 | 0.539 |
| d-dimer (mg/L) | 0.66 (0.54, 0.915) | 1.61 (0.677, 4.49) | − 4.035 | < 0.001 |
| Antithrombin III activity (%) | 87.8 (80.5, 90.615) | 79.15 (72.025, 87.545) | − 3.185 | 0.001 |
ALT alanine aminotransferase, AST aspartate aminotransferase, GFR glomerular filtration rate, INR PT international standardized ratio, APTT activated partial thrombin time, CRP C-reactive protein
The indexes of the two groups in Tables 1 and 2 have been compared, and their statistically significant indicators have been analyzed by multivariate logistic regression analysis. We have come to the following conclusion: the SPO2 and leukocyte count on the first day of admission are statistically significant in the comparison between the survival group and the non-survival group, P < 0.05, as shown in Table 3.
Table 3.
The results of multivariate logistic regression analysis of each index
| Variable | β | SE | Wald χ2 value | P value | OR value | 95% CI |
|---|---|---|---|---|---|---|
| SPO2 | − 0.613 | 0.288 | 4.533 | 0.033 | 0.542 | 0.308–0.952 |
| Age | 0.140 | 0.085 | 2.667 | 0.102 | 1.150 | 0.972–1.360 |
| Hypertension | − 0.328 | 1.617 | 0.041 | 0.839 | 0.720 | 0.030–17.126 |
| Dyspnea | 0.372 | 1.676 | 0.049 | 0.824 | 1.450 | 0.54–38.706 |
| Leukocyte count | 0.665 | 0.315 | 4.465 | 0.035 | 1.944 | 1.049–3.601 |
| Lymphocyte count | 0.619 | 1.459 | 0.180 | 0.672 | 1.857 | 0.106–32.440 |
| Hemoglobin | − 0.069 | 0.039 | 3.233 | 0.072 | 0.933 | 0.865–1.006 |
| Lactate dehydrogenase | 0.005 | 0.006 | 0.523 | 0.469 | 1.005 | 0.992–1.017 |
| Urea nitrogen | 0.081 | 0.275 | 0.086 | 0.769 | 1.084 | 0.633–1.857 |
| Creatinine | 0.060 | 0.036 | 2.837 | 0.092 | 1.062 | 0.990–1.139 |
| d-dimer | − 0.043 | 0.183 | 0.054 | 0.816 | 0.958 | 0.670–1.371 |
| Antithrombin III activity | 0.072 | 0.083 | 0.763 | 0.383 | 1.075 | 0.914–1.265 |
| Albumin | − 0.007 | 0.010 | 0.576 | 0.448 | 0.993 | 0.974–1.012 |
| PT | 0.022 | 0.072 | 0.095 | 0.758 | 1.022 | 0.888–1.177 |
| Constant | 4.580 | 29009.071 | 0.000 | 1.000 | 97.523 |
β regression coefficients, SE standard error, OR odds ratio, CI confidence interval
Comparison of SAA before and after treatment in survival group and non-survival group
With the progress of treatment, the Z1 value of SAA before treatment in patients in the survival group and the non-survival group was − 1.426, P = 0.154, and the difference was not statistically significant. The Z1 value of SAA was compared between the two groups at 3 days, 5 days, and 7 days after treatment which was, respectively, − 5.569, − 6.967, − 7.542, P < 0.001, with statistical significance (Fig. 1). It is suggested that the difference of SAA levels between the two groups becomes larger and larger with the extension of treatment time. The significant increases in SAA levels indicates that the patient is at higher risk of eventual death.
Fig. 1.
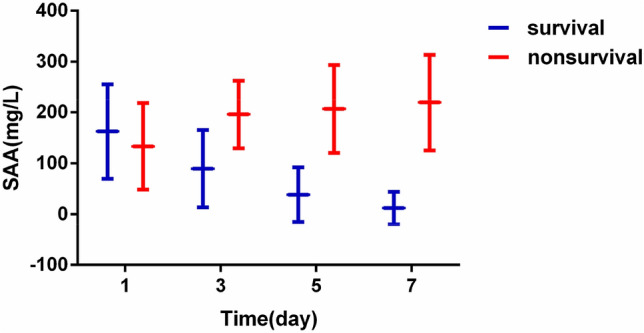
Comparison of serum SAA levels in survival and non-survival groups at various time points
The predictive value of SAA in the outcome of COVID-19 patients
According to the analysis results of the ROC curve, the AUC of SAA at each time point are: 0.588, 0.848, 0.935, and 0.947, respectively, the sensitivity is 80.6%, 97.2%, 86.1%, 96.1%, and the specificity is 15.1%, 60.4%, 96.2%, 94.3%, P < 0.05, all have statistical significance in judging the outcome of COVID-19 patients, of which the sensitivity of SAA on the 7 days is the highest (Fig. 2). Then, the differences between the groups under the curve before and after 3 days, 5 days, and 7 days were compared. The Z2 results were 3.086, 5.616, and 5.671, respectively, and the P values were all < 0.05, with statistical significance. It is suggested that the SAA is more meaningful to predict the prognosis of patients with prolonged treatment time.
Fig. 2.
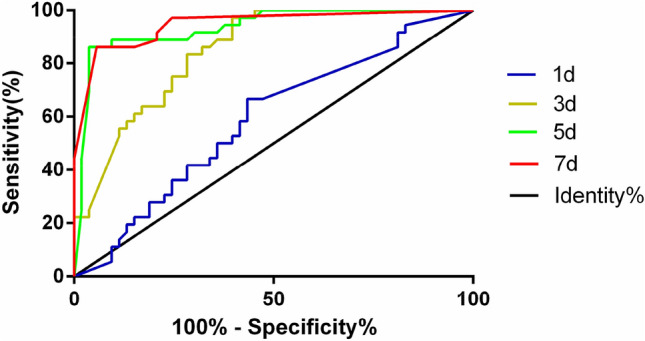
ROC curve of SAA against clinical outcomes of COVID-19 patients
The value of SAA on the 7th day compared with other indexes on the 7th day for prognosis judgment of patients with COVID-19
According to the results of ROC curve analysis, the areas under the curve (AUC) of SAA on the 7th day and CRP, leukocyte count, neutrophil count, lymphocyte count, and hemoglobin on the 7th day were 0.947, 0.921, 0.878, 0.864, 0.740, and 0.721, respectively, and the sensitivity were 96.1%, 83.3%, 88.3%, 83.3%, 67.9%, and 83.0%, respectively, and the specificity is 94.3%, 88.7%, 88.7%, 86.8%, 77.8%, and 58.3% respectively, of which SAA has the highest sensitivity and specificity (Fig. 3). Next, we used the method of Jordan index to calculate the optimal critical values of them and obtained 183.6, 27.1, 7.395, 5.440, 1.175, and 105.5 for SAA, CRP, leukocyte count, neutrophil count, lymphocyte count, and hemoglobin, respectively. At the same time, compared SAA with hemoglobin (Z2 = 4.310, P < 0.0001) and compared SAA with leukocyte count (Z2 = 4.121, P < 0.0001), the differences were statistically significant, suggesting that SAA was better than hemoglobin and leukocyte count in predicting the prognosis of patients with COVID-19. While SAA was compared with CRP, neutrophil count, and leukocyte count, respectively (P > 0.05), the difference was not statistically significant. Compared CRP with hemoglobin (Z2 = 3.812, P = 0.0001) and compared CRP with lymphocyte count (Z2 = 3.230, P = 0.0012), the differences were statistically significant, suggesting that CRP was better than hemoglobin and lymphocyte count in predicting the prognosis of patients with COVID-19. While CRP was compared with neutrophil count, leukocyte count, respectively (P > 0.05), the difference was not statistically significant.
Fig. 3.
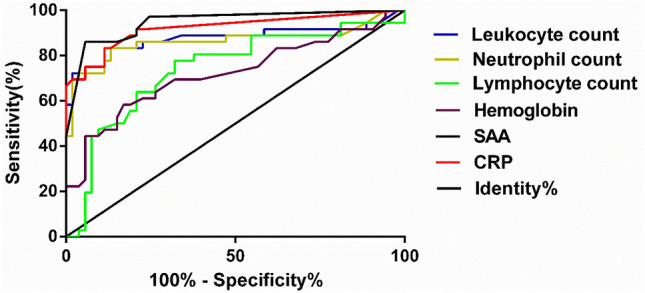
ROC curve of prognosis judgment of patients with COVID-19 compared with each index on the 7th day
Discussion
COVID-19 is a serious infectious disease caused by SARS-CoV-2. Similar to SARS and MERS, COVID-19 has atypical early symptoms [11, 12], most of which are characterized by fever, dry cough, and fatigue. A few may be accompanied by symptoms such as nasal congestion, runny nose, sore throat, muscle soreness, and diarrhea. However, SARS-CoV-2 is highly contagious, and COVID-19 has posed a great threat to life and health worldwide. It is necessary to control the spread of the epidemic as soon as possible, accurately determine the prognosis of patients, and perform more effective treatment for patients with poor prognosis, such as early active and effective oxygen therapy programs. At the same time, early application of protection of important organ functions such as myocardium, kidney, and liver may save the lives of more patients, which has important clinical value.
The baseline data in this study showed that the age of the non-survival group, early onset of dyspnea symptoms, and monitoring of blood oxygen saturation decreased. The non-survival group with hypertension and clustered onset were higher than the survival group. In the blood test, the white blood cell count, neutrophil count, procalcitonin, lactate dehydrogenase, urea nitrogen, creatinine, blood glucose, and d-dimer were higher in the non-survival group than in the survival group. Protein and antithrombin III activity values were lower than those in the survival group. This is similar to the clinical characteristics in 50 cases reported by Qian-Zhi Cheng et al. [13] and in 62 patients with COVID-19 studied by Xu Shen et al. [14], but different from those reported by Fei Zhou et al. [15], which may be related to the sample size.
At present, there are very few reports about the factors affecting the prognosis of patients with COVID-19 at home and abroad. Zhang et al. [16] have reported that the level of lymphocytes in COVID-19 critically ill patients was generally low, and the proportion of lymphocytes was gradually decreasing, indicating a poor prognosis. Rong Qu et al. [17] studied 30 cases of patients with COVID-19. The larger the platelet/lymphocyte ratio in peripheral blood during treatment, the more severe the cytokine storm, the longer the hospital stay, and the worse the prognosis. Wei Liu et al. [18] reported 78 patients with COVID-19, and concluded that elevated C-reactive protein and decreased albumin were important factors affecting prognosis. The “New Coronary Virus Pneumonia Seventh Edition Diagnosis and Treatment Plan” [19] believes that the absolute count of peripheral blood lymphocytes decreased significantly, interleukin 6, C-reactive protein, increased lactic acid, and DIC screening indicators persistent abnormalities (such as d-dimer, fibrin degradation products), high levels of blood lactate dehydrogenase, and rapid progression of lesions on chest CT are all high-risk factors affecting prognosis. A retrospective analysis of the routine coagulation function of 183 confirmed COVID-19 patients by Ning Tang et al. [20] showed that the abnormal coagulation function results in death group, especially d-dimer and fibrin degradation products, were significantly increased, indicating a poor prognosis. By statistical analysis of the SAA of 89 COVID-19 patients in our hospital, we believe that dynamic changes in SAA can predict the prognosis.
SAA belongs to the apolipoprotein family, mainly from the liver, plays an important role in inflammatory response and lipid metabolism, and is one of the main acute phase proteins of the body [6, 9]. Normally, the body can secrete a small amount, but in the body after being stimulated by inflammation and trauma, it is activated by inflammatory factors such as interleukin 1 (IL-1), interleukin 6 (IL-6), and tumor necrosis factor α (TNF-α), and its secretion increases sharply, even exceeding 2000 times the normal value, which is one of the most sensitive markers of body inflammation at present [7, 8]. SAA can be used as an independent factor to judge the severity of infectious diseases and inflammations such as bacteria and viruses. In terms of prognosis evaluation, antibiotic treatment can be judged to be effective by the decrease of SAA by 30% after 24 h of treatment. The difference between SAA and CRP is that in viral infectious diseases, SAA is significantly increased, but CRP is not elevated; in bacterial infectious diseases, SAA is more sensitive than CRP, with an early and large increase; and SAA combined with CRP detection can provide early identification of viral and bacterial infections [21]. At present, SAA has a wide range of clinical applications. It can be used as a new index of assistant diagnosis of infectious diseases, risk prediction of coronary heart disease, dynamic observation of curative effect and prognosis of tumor patients, observation of transplant rejection, and improvement of rheumatoid arthritis. It has been reported in the literature [22] that the protein chip analysis of patients with severe acute respiratory syndrome (SARS) found that SAA may be one of the biomarkers for monitoring the degree of pneumonia and has certain value in predicting the prognosis. However, there are a few reports on the value of SAA on the prognostic evaluation of COVID-19.
This study analyzes the dynamic changes of SAA in patients with COVID-19, studies the correlation between SAA in different groups, before and after treatment, and draws ROC curves to focus on the prognosis of SAA at different time points in COVID-19 patients. The research results suggest that the protein in the acute stage SAA has a certain predictive value for the final clinical outcome of COVID-19, and its mechanism may be that SAA can activate inflammatory cells such as neutrophils, promote the release of inflammatory factors, and exacerbate inflammation in the body. At the same time, it can be combined with high-density lipoprotein (HDL) to form an SAA/HDL complex, which chemoattracts inflammatory cells; in addition, it may have an interference effect on the lipoxin signaling pathway, which can increase the survival time of neutrophils, and aggravate the degree of inflammation and infection, leading to a worsening of the patient's condition [23].
In summary, this study is based on the clinical outcomes of COVID-19 patients after admission, affirming the value of SAA in the prognosis judgment of patients with COVID-19. Dynamically monitoring the changes in SAA to adopt an effective diagnosis and treatment strategy for COVID-19 patients in the early stage may improve the survival rate of patients, which is worth promoting in daily clinical work, but the sample size of this study is relatively small, leading to certain limitations of this observational study, and may lead to biased results. Therefore, multi-center, large-sample related research is the direction of future efforts. At the same time, multiple indicators such as hs-CRP, IL-6, LDH, d-dimer, and lactic acid can be jointly predicted. At present, the best diagnosis and treatment plan for COVID-19 is still under investigation. Early diagnosis and dynamic monitoring of prognostic indicators have certain value to improve the survival rate of COVID-19.
Author contributions
We would like to thank the general practices and patients that participated in follow-up.
Funding
No funding.
Data availability
All collected data and material are true.
Compliance with ethical standards
Conflict of interest
The authors declare that they have no conflict of interest.
Ethical approval
It is retrospective observational study.
Consent to participate
It is retrospective observational study.
Consent for publication
All authors agree to the public publication of this article.
Footnotes
Li Cheng, Jian-Zhong Yang, and Wen-Hui Bai have contributed equally to this work.
Contributor Information
Li Cheng, Email: 304558638@qq.com.
Jian-Zhong Yang, Email: yjz6542@126.com.
Wen-Hui Bai, Email: 529454653@qq.com.
Zhuan-Yun Li, Email: 2577008209@qq.com.
Li-Fang Sun, Email: 673115056@qq.com.
Juan-Juan Yan, Email: yanjuan1997@126.com.
Chen-Liang Zhou, Email: rm002106@whu.edu.cn.
Bao-Peng Tang, Email: Tangbaopeng1111@163.com.
References
- 1.Xu X, Chen P, Wang J, et al. Evolution of the novel coronavirus from the ongoing Wuhan outbreak and modeling of its spike protein for risk of human transmission. Sci China Life Sci. 2020;63:457–460. doi: 10.1007/s11427-020-1637-5. [DOI] [PMC free article] [PubMed] [Google Scholar]
- 2.Yan G, Junmu H, Yinzi J, et al. Global epidemic situation of new coronavirus pneumonia and its impact on China and policy opinions. Chin J Epidemiol. 2020;41:643–647. [Google Scholar]
- 3.Zhang YP. Analysis of epidemiological characteristics of new coronavirus pneumonia. Chin J Epidemiol. 2020;41:145–151. [Google Scholar]
- 4.Li M, Liang X, Jiang Q, et al. The latest understanding of the epidemiological characteristics of new coronavirus pneumonia. Chin J Epidemiol. 2020;41:139–143. [Google Scholar]
- 5.Wei G, Lu R, Li J. Predictive value of serum high-sensitivity c-reactive protein, serum-like amylase a and procalcitonin in patients with sepsis. Chin J Crit Care Med. 2015;8:235–240. [Google Scholar]
- 6.Lin HY, Tan GQ, Liu Y, et al. The prognostic value of serum amyloid A in solid tumors: a meta-analysis. Cancer Cell Int. 2019;20:62. doi: 10.1186/s12935-019-0783-4. [DOI] [PMC free article] [PubMed] [Google Scholar]
- 7.Ghweil AA, Osman HA, Hassan MH, et al. Validity of serum amyloid A and HMGB1 as biomarkers for early diagnosis of gastric cancer. Cancer Manag Res. 2020;8:117–126. doi: 10.2147/CMAR.S207934. [DOI] [PMC free article] [PubMed] [Google Scholar]
- 8.Deng J, Yu J. The value of serum amyloid A in the diagnosis and prognosis of septic shock. J Pract Shock. 2018;2:87–90. [Google Scholar]
- 9.Zhang Q, Liang Z, Yuan Y, et al. Predictive value of serum amyloid A combined with qSOFA score in septic shock. J Clin Emerg Med. 2019;20:971–974. [Google Scholar]
- 10.Zhenqiang BI, Qingwu J, Peng W, et al. Guidance for Corona Virus Disease 2019 prevention, control, diagnosis and management. People’s Medical Publishing House. First published: 2020. ISBN 978-7-117-29817-9.
- 11.Chan JF, Yuan S, Kok K, et al. A familial cluster of pneumonia associated with the 2019 novel corona virus indicating person to person transmission: a study of a family cluster. Lancet. 2020;395:514–523. doi: 10.1016/S0140-6736(20)30154-9. [DOI] [PMC free article] [PubMed] [Google Scholar]
- 12.Li-sheng W, Yi-ru W, Da-wei Y, et al. A review of the 2019 Novel Coronavirus (COVID-19) based on current evidence. Int J Antimicrob Agents. 2020 doi: 10.1016/j.ijantimicag.2020.105948. [DOI] [Google Scholar]
- 13.Qian Z, Song X, Li S, et al. Epidemiological and clinical characteristics of severe and critical new coronavirus pneumonia. Wuhan Univ J. 2020;41(4):533–536. doi: 10.14188/j.1671-8852.2020.0170. [DOI] [Google Scholar]
- 14.Xu S, Hu H, Hu Y, et al. Clinical features of 62 cases of critical new coronavirus pneumonia complicated with acute renal injury. J Wuhan Univ. 2020;41(4):537–541. doi: 10.14188/j.1671-8852.2020.0152. [DOI] [Google Scholar]
- 15.Fei Z, Ting Y, Ronghui D, et al. Clinical course and risk factors for mortality of adult inpatients with COVID-19 in Wuhan, China: a retrospective cohort study. Lancet. 2020;3:9. doi: 10.1016/S0140-6736(20)30566-3. [DOI] [PMC free article] [PubMed] [Google Scholar]
- 16.Zhang MQ, Wang XH, Chen YL, et al. Clinical features of 2019 novel coronavirus pneumonia in the early stage from a fever clinic in Beijing. Zhonghua Jie He He Hu Xi Za Zhi. 2020;43:E013. doi: 10.3760/cma.j.issn.1001-0939.2020.0013. [DOI] [PubMed] [Google Scholar]
- 17.Qu R, Ling Y, Y-h-z Zhang, et al. Platelet-to-lymphocyte ratio is associated with prognosis in patients with coronavirus disease-19. J Med Virol. 2020 doi: 10.1002/jmv.25767. [DOI] [PMC free article] [PubMed] [Google Scholar]
- 18.Liu W, Tao Z-W, Wang L, et al. Analysis of factors associated with disease outcomes in hospitalized patients with 2019 novel coronavirus disease. Chin Med J. 2020 doi: 10.1097/CM9.0000000000000775. [DOI] [PMC free article] [PubMed] [Google Scholar]
- 19.General Office of the National Health and Health Commission, Office of the State Administration of Traditional Chinese Medicine. Notice regarding the issuance of a new coronavirus-infected pneumonia diagnosis and treatment plan (trial implementation of the seventh edition) (National Health Office Medical Letter [2020] No. 184) [EB/OL]. https://www.nhc.gov.cn/yzygj/s7653p/202003/46c9294a7dfe4cef80dc7f5912eb1989.shtml (2020). Accessed 4 Mar 2020.
- 20.Tang N, Li D, Wang X, et al. Abnormal coagulation parameters are associated with poor prognosis in patients with novel coronavirus pneumonia. J Thromb Haemost. 2020 doi: 10.1111/jth.14768. [DOI] [PMC free article] [PubMed] [Google Scholar]
- 21.Professional Committee of Laboratory Medicine of Chinese Society of Integrated Chinese and Western Medicine Expert consensus on clinical application of serum amyloid A in infectious diseases. Chin J Lab Med. 2019;42:186–190. [Google Scholar]
- 22.Arnon S, Litmanovitz I, Regev RH, et al. Serum amyloid A: an early and accurate marker of neonatal early-onset sepsis. J Perinatol. 2007;27:297–302. doi: 10.1038/sj.jp.7211682. [DOI] [PubMed] [Google Scholar]
- 23.Qu J, Lu X, Liu Y, et al. Evaluation of procalcitonin C-reactive protein inter1eukin-6 & serum amyloid A as diagnostic biomarkers of bacterial infecction in febrile patient. Indian J Med Res. 2015;141:315. doi: 10.4103/0971-5916.156617. [DOI] [PMC free article] [PubMed] [Google Scholar]
Associated Data
This section collects any data citations, data availability statements, or supplementary materials included in this article.
Data Availability Statement
All collected data and material are true.