Abstract
Breast cancer is frequently characterized by calcifications in mammography. The mechanism for calcifications in breast cancer is not completely known. Understanding this mechanism will improve diagnostic accuracy. Herein, we demonstrated that calcifications occur and that alkaline phosphatase enzyme activity increases in MDA-MB-231 cells cultured using an osteogenic cocktail-containing medium. Microarray transcript analysis showed that the PI3K-Akt signaling pathway was significantly involved, with recruitment of placental alkaline phosphatase. Calcifications and alkaline phosphatase enzyme activity were suppressed by silencing placental alkaline phosphatase using a small interfering RNA. Inhibition of the PI3K-Akt signaling pathway suppressed phospho-c-Jun and placental alkaline phosphatase and resulted in absence of calcifications. These findings reveal that breast cancer cells acquire alkaline phosphatase enzyme activity via placental alkaline phosphatase expression and suggest that breast calcification formation is closely associated with the PI3K-Akt signaling pathway.
Subject terms: Breast cancer, Breast cancer
Introduction
Breast microcalcifications are an important finding on mammography. A systematic review of clinical studies beginning before 1990 showed that screening mammography reduced mortality in women aged 40 to 69 years1 by 15% to 20%. An article on the history of mammography noted that Leborgne reported in 1949 that about 30% of breast cancers had calcifications on X-ray2. Low-voltage mammography devised by Egan in 1959 became the foundation for current mammography2. Leborgne’s diagram described the characteristics of breast cancer calcifications as “scattering of countless, punctiform or elongated calcifications, very closely grouped, particularly in center”2. Benign and malignant calcifications can be discriminated by their shape. Guidelines include classifications based on the morphology and distribution of calcifications3,4. However, in cases in which it is difficult to distinguish benign from malignant calcifications based on morphology and distribution, additional investigations such as biopsy or magnetic resonance imaging are required. This limits the ability to make a diagnosis based on calcifications alone. In fact, it is not known how breast cancer calcifications are produced. If this mechanism were understood, it might be possible to improve the accuracy of diagnosis by calcifications on mammography by combining imaging with some other marker such as a blood test related to that underlying mechanism.
Although breast calcifications were previously thought to be produced passively as the final stage of cell regression, recent studies have shown active production5. In another context, vascular smooth muscle cells have been found to produce vascular calcifications by acquiring osteoblast-like characteristics6. The same mechanism has been suggested to account for breast calcifications. Cox et al. showed that breast calcifications are clearly generated by the mouse breast cancer cell line 4T1 through osteoblast-like characteristics7, the details underlying such a mechanism of mammary calcification is unknown.
We induced calcifications using the human breast cancer MDA-MB-231 cell line. Our hypothesis was that breast cancer calcifications are generated in a process similar to that of osteoblast differentiation. By a comprehensive analysis of transcription compared with osteoblastic cell line MC3T3-E1 in a microarray, we showed that placental alkaline phosphatase (PLAP) is involved in producing calcifications through PI3K-Akt signaling pathways.
Results
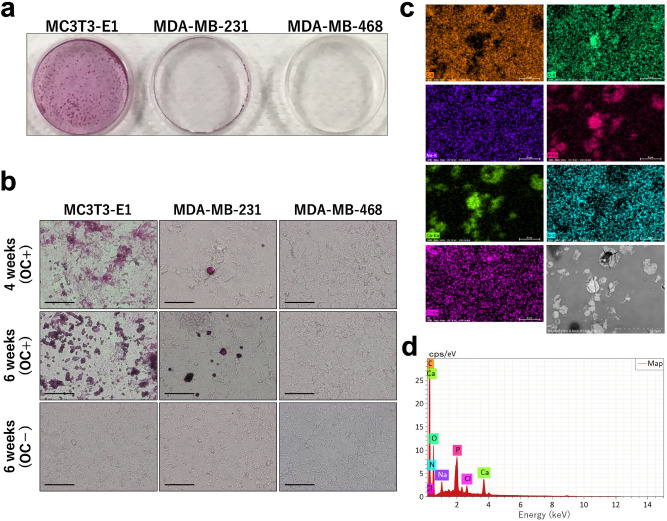
Human breast cancer cell lines MDA-MB-231and MDA-MB-468 and mouse preosteoblast cell line MC3T3-E1 were cultured in medium containing an osteogenic cocktail (OC). Alizarin staining showed formation of calcifications in 4 weeks in MDA-MB-231 cells, and the calcifications were diffusely spread by 6 weeks (Fig. 1a,b). Compared with MC3T3-E1 cells, MDA-MB-231 cells started to produce calcifications later and less abundantly. MDA-MB-468 cells did not produce calcifications until 6 weeks. We used MDA-MB-468 cells as a negative control in this experiment. The compound produced by MC3T3-E1 cells is calcium phosphate8, which is what is often clinically observed in breast cancer9. Elemental analysis of MDA-MB-231 cells indicated they were rich in calcium and phosphorous, confirming that the calcifications produced by MDA-MB-231 cells in this experiment were calcium phosphate (Fig. 1c).
Figure 1.
MDA-MB-231 cells produced calcifications that are rich in calcium and phosphorous. (a) Alizarin staining shows calcifications in MC3T3-E1, MDA-MB-231, and MDA-MB-468 cells cultured with an osteogenic cocktail (OC) for 6 weeks. (b) Cells cultured with OC for 4 weeks and with or without OC for 6 weeks (magnification × 20, scale bar 10 µm). (c,d) Elemental analysis of MDA-MB-231 cells; HITACHI TM4000 HV 15.0 keV 1,000 × WD 9.4 mm. The mass of each element is C: 55.09%, N: 6.14%, O: 29.32%, Na: 1.27, P: 3.63%, Cl: 0.93%, and Ca: 3.62%.
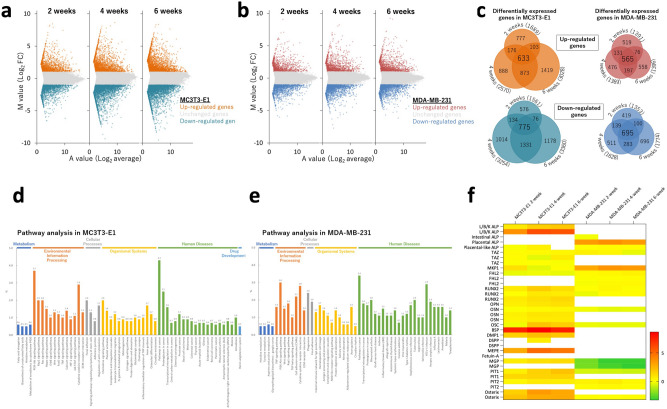
Microarray analysis was performed to explore biological differences between MDA-MB-231 and MC3T3-E1 with regard to formation of calcifications. MA plots showed genes that were differentially expressed by administering OC to MC3T3-E1 and MDA-MB-231 cells at weeks 2, 4, and 6 (Fig. 2a,b). In MC3T3-E1 cells, 633 genes were upregulated and 775 were downregulated. In MDA-MB-231 cells, 565 genes were upregulated and 695 were downregulated (Fig. 2c). There were therefore 1,408 differentially expressed genes in MC3T3-E1 and 1,260 in MDA-MB-231. Pathway analysis using KEGG pathway indicated high frequencies of PI3K-Akt signaling and pathways in cancer in both MDA-MB-231 and MC3T3-E1 cells, suggesting a relationship between these pathways and formation of calcifications (Fig. 2d,e). Gene set enrichment analysis revealed that the mTOR signaling pathway factors tend to increase in MDA-MB-231 cells cultured using OC (NES: 1.77, p-value: 0.076, q-value: 0.099) and that PI3K-AKT signaling in cancer is associated with the formation of calcifications (NES: 1.46, p-value: 0.047, q-value: 0.169) (Supplementary Fig. 1).
Figure 2.
Microarray analysis shows the difference in differentially expressed genes between MC3T3-E1 and MDA-MB-231 cells cultured with or without an osteogenic cocktail MA plots of (a) MC3T3-E1 and (b) MDA-MB-231 cells. (c) Diagram of differentially expressed genes after 2, 4, and 6 weeks of culture. Pathway analysis of (d) MC3T3-E1 and (e) MDA-MB-231 cells. (f) Bone-related gene expressions on MC3T3E1 and MDA-MB-231 cells.
Microarray analysis data were used to see if there was a difference in mRNA expression between MC3T3-E1 and MDA-MB-231 cells for reported bone-related genes. There were more bone-related genes with increased expression in MC3T3-E1 cells and fewer in MDA-MB-231 cells (Fig. 2f). Although ALPL, a gene for tissue-nonspecific alkaline phosphatase (TNAP), was upregulated in MC3T3-E1 cells, it was not detected in MDA-MB-231 cells. Instead, ALPP, a gene for placental alkaline phosphatase, was upregulated in MDA-MB-231 cells. This suggests that PLAP may be involved in the formation of calcifications in MDA-MB-231 cells.
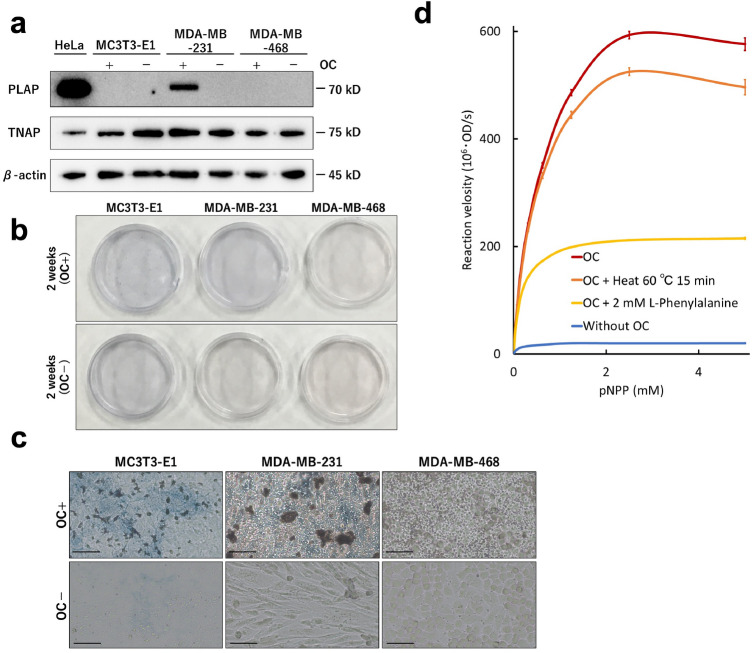
Western blot showed that PLAP expression in MDA-MB-231 cells cultured with OC (Fig. 3a). In addition, in all cell lines, TNAP was expressed regardless of the presence or absence of OC (Fig. 3a). Alkaline phosphatase (ALP) staining was performed to confirm ALP enzyme activity. After 2 weeks of culture with OC, MDA-MB-468 cells did not stain for ALP, but MDA-MB-231 cells were blue-stained similarly to MC3T3-E1 cells (Fig. 3b,c). Therefore, in MDA-MB-231 cells, PLAP or TNAP expression was activated. We measured ALP enzyme activity after heat block and pharmacologic inhibition based on the difference between PLAP and TNAP10. The ALP enzyme activity of MDA-MB-231 cells in the presence of OC was increased, and the activity was retained with heat treatment at 60 °C. The enzyme activity was inhibited by L-phenylalanine. Since PLAP is resistant to heat denaturation and is inhibited by L-phenylalanine, it was shown that addition of OC to MDA-MB-231 cells resulted in PLAP enzyme activity stronger than that for TNAP.
Figure 3.
Cultured with an osteogenic cocktail (OC), MDA-MB-231 cells have the expression and enzyme activity of placental alkaline phosphatase (PLAP) MC3T3-E1, MDA-MB-231, and MDA-MB-468 cells which were cultured with and without OC for 2 weeks. (a) Western blot for PLAP, tissue-nonspecific alkaline phosphatase (TNAP), and β-actin. (b,c) ALP indicating ALP enzyme activity (c: magnification × 20, scale bar 10 µm). (d) Pharmacologic inhibition of ALP enzyme activity in MDA-MB-231 cells. Red line: with OC, orange: with OC + heat treatment (60 °C for 15 min), yellow: with OC + 2 mM L-phenylalanine and blue: without OC. OD: optical density, pNPP: Para-nitrophenyl phosphate.
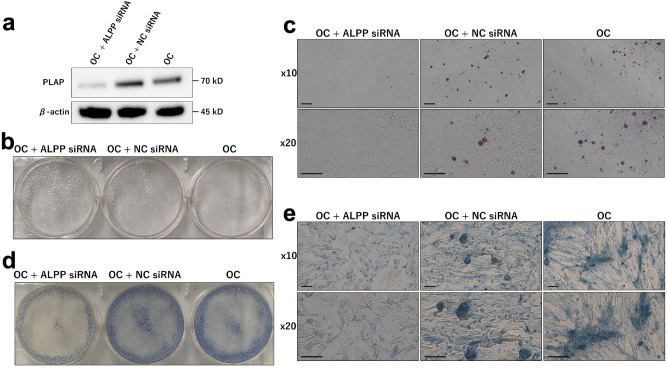
SiRNA assays were performed to determine if PLAP is required for formation of calcifications in MDA-MB-231 cells. First, we confirmed that the PLAP protein expression was decreased when the cells were cultured with OC and ALPP siRNA for 2 weeks (Fig. 4a). After 6 weeks of incubation with OC and ALPP siRNA, no calcifications were seen on alizarin staining (Fig. 4b,c), and ALP enzyme activity was weakened as demonstrated by ALP staining (Fig. 4d,e). Moreover, MDA-MB-468 cells with vector-based enforced expression of PLAP induced calcification when they were cultured with OC for 6 weeks (Supplementary Fig. 2). Therefore, breast cancer cells including MDA-MB-231 cells can induce calcification through PLAP enzyme activity.
Figure 4.
ALPP knock-down MDA-MB-231 cells cultured with an osteogenic cocktail (OC) do not show placental alkaline phosphatase (PLAP) expression, calcifications, and alkaline phosphatase (ALP) enzyme activity MDA-MB-231 cells were cultured for 6 weeks with OC including an ALPP siRNA or a negative control of OC alone (a) Western blot for PLAP after culture for 2 weeks. (b,c) Alizarin staining shows calcifications (c: magnification × 10 and × 20, scale bar 10 µl). (d,e) ALP staining shows ALP enzyme activity (e: magnification × 10 and × 20, scale bar 10 µm).
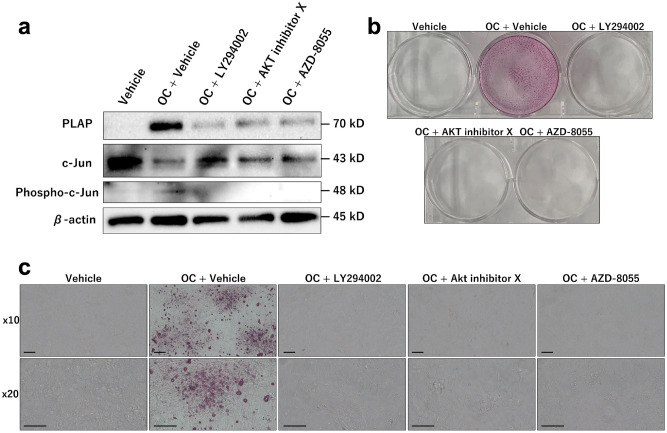
As microarray analysis indicated that the PI3K-Akt signaling pathway was associated with calcifications in MDA-MB-231 cells, we inhibited the PI3K-Akt signaling pathway in MDA-MB-231 cells cultured using OC. PLAP expression and calcification formation were suppressed by PI3K-Akt signaling pathway inhibitors, namely, LY294002, AKT inhibitor X, and AZD-8055 (Fig. 5). Quantitative reverse transcription PCR (qRT-PCR) showed that the transcription of PLAP was suppressed in MDA-MB-231 cells cultured with OC + Akt inhibitor X and OC + AZD-8055 compared with that in MDA-MB-231 cells cultured with OC only (Supplementary Fig. 3a). Transcription of PLAP in MDA-MB-231 cells cultured with OC + LY294002 was suppressed depending on LY294002 concentration (Supplementary Fig. 3b). RNA-seq in a previous study revealed that c-Jun binds to the promoter region of ALPP in MDA-MB-231 cells11. Phospho-c-Jun expression level increased following the addition of OC inhibitors, whereas c-Jun expression level decreased following the addition of OC (Fig. 5a). The results suggest that OC induces c-Jun phosphorylation, which is associated with the PI3K-Akt signaling pathway, and that PLAP transcription would be activated when phospho-c-Jun enters the nucleus and binds to the promoter region of PLAP.
Figure 5.
Pharmacologically inhibited PI3K-Akt pathway, MDA-MB-231 cells cultured with an osteogenic cocktail (OC) do not show placental alkaline phosphatase (PLAP) expression and production of calcifications MDA-MB-231 cells were cultured for 6 weeks with vehicle, OC + vehicle, OC + LY294002, OC + Akt inhibitor X, and OC + AZD-8055. (a) Western blot for placental alkaline phosphatase (PLAP), c-Jun, and phospho-c-Jun after culture for 2 weeks. (b,c) Alizarin staining shows calcifications only with OC + vehicle (c: magnification × 10 and × 20, scale bar 10 µm).
Discussion
Human breast cancer cell line MDA-MB-231 produced calcifications when cultured with OC, which is used as a standard reagent for osteogenic differentiation from preosteoblast cells in the present study. Interfering RNA technology unveiled that PLAP is as essential for MDA-MB-231 cells to produce calcifications. Furthermore, we found that PI3K-Akt signaling pathway plays an important role in PLAP expression and MDA-MB-231 calcification induction when cultured with OC.
OC is often used in experiments to induce bone differentiation12–15. Jaiswal et al. showed that the most appropriate concentrations for bone differentiation are 100 nM of dexamethasone, 0.05 nM of L-ascorbic acid, and 10 mM of β-glycerophosphate16. Hamidauche et al. demonstrated that dexamethasone induces mesenchymal cell differentiation when FHL2 is upregulated by attaching dexamethasone to the promoter of the LIM-domain protein with 4.5 LIM domains (FHL2), and it activates WNT/β-catenin signaling-dependent Runx217. Ascorbic acid primarily promotes the formation of collagen, which is the basis of calcification18. β-Glycerophosphate is a source of phosphate. In any case, calcification can be induced in osteoblasts simply by supplying these three factors. In this study, we showed that calcifications also occur in breast cancer cell line when cultured in a medium containing OC.
Human breast cancer cell lines have been cultured with several factors to produce calcifications. Cox et al. reported that calcifications in a more invasive subclone of human breast cancer cell line Hs578T using a similar OC7. Dang et al. demonstrated production of calcifications in the human breast cancer cell lines MCF7 and Hs578T using ascorbic acid, dexamethasone, and inorganic phosphate rather than β-glycerophosphate19. Although calcifications can therefore be induced in breast cancer cells in the presence of inorganic phosphorus, it has been unclear whether it occurs without an inorganic phosphorus in the presence of a phosphoric ester.
ALP enzyme activity is essential to convert phosphoric ester to inorganic phosphorus, allowing utilization of phosphorus in vivo. Hypophosphatasia, which is deficient of ALP, patients have bone fragility20 and high levels of phosphomonoester, such as pyridoxal 5′-phosphate and inorganic pyrophosphate21. ALP is activated during the process of osteoblast mineralization22,23. In the same way, it is presumed that phosphoric ester is the source of phosphorus in breast cancer calcifications and ALP is locally activated on the cancer cells24. In fact, O’Grady et al. showed that ALP enzyme activity was increased by OC in MDA-MB-231 and SKBR3 cells with calcium deposition25. However, the study did not completely unveil how breast cancer cells acquire ALP enzyme activity, although they showed that ALP inhibitor levamisole suppress mineralization in MDA-MB-231 cells cultured using OC.
Our results suggest that PLAP produces ALP enzyme activity required for calcification in MDA-MB-231 cells. PLAP is clinically expressed in some breast cancers26. Chang et al. showed that dexamethasone induces PLAP enzyme activity and mRNA in the human breast cancer BC-M1 cell line27. Therefore, dexamethasone in OC may be associated with PLAP expression in the MDA-MB-231 cells. On the other hand, c-Jun binds to the promoter region of ALPP in MDA-MB-23111, and we showed that c-Jun phosphorylation appears in MDA-MB-231 cells cultured using OC (Fig. 5). This may explain why MDA-MB-468 cells did not express PLAP and did not produce calcifications using OC because c-Jun expression of MDA-MB-468 cells is lower than that of MDA-MB-231 cells28. We suggest that PLAP transcript would be activated when phospho-c-Jun enters the nucleus and binds to the promoter region of PLAP.
The precise pathway leading to PLAP expression; however, has not yet been reported. In this study, we found that the PI3K-Akt signaling pathway was active in both the MC3T3-E1 osteoblast and the MDA-MB-231 human breast cancer cell lines. Culturing the cells with inhibitors of this pathway decreased PLAP expression and c-Jun phosphorylation, and the cells failed to produce calcifications. The PI3K-Akt signaling pathway plays an important role in cell proliferation and survival and in angiogenesis. Mutations in this pathway are common in breast cancer29. Furthermore, calcifications in blood vessels are triggered by increased apoptosis, a cellular event associated with the PI3K-Akt signaling pathway30–33. We therefore speculate that the PI3K-Akt signaling pathway may also be involved in calcifications in breast cancer.
Our proposed mechanism in breast calcifications is that OC induces c-Jun phosphorylation via PI3K-Akt signaling pathway and that PLAP transcription would be activated when phospho-c-Jun enters the nucleus and binds to the promoter region of PLAP. Future research might assess whether increased PLAP levels are the main driver of intracellular calcifications in breast cancer, as well as whether the PI3K-Akt signaling pathway has a similar effect in vivo that we demonstrated to cause calcifications in vitro.
Materials and methods
Cell culture and reagents
Two human breast cancer cell lines, MDA-MB-231 and MDA-MB-468 and the mouse preosteoblast MC3T3-E1 cell line were provided by ATCC. The cells were cultured with alpha-modified minimum essential medium and 10% fetal bovine serum (Sigma-Aldrich, MO, USA), the latter prepared by heat inactivation. HeLa cells, provided by ATCC, were cultured using Dulbecco’s modified Eagle Medium and 10% fetal bovine serum. Culture of all cell lines was carried out in a 5% CO2 air incubator at 37 °C. The medium was changed twice a week. OC was an osteoblast-inducer reagent (Takara Bio. Shiga, Japan) consisting of ascorbic acid 1% (v/v), hydrocortisone 0.2% (v/v), and β-glycerophosphate 2% (v/v).
Alizarin and ALP staining
For alizarin staining, we fixed the cells for 20 min in ice-cold 100% methanol and then stained with alizarin red using a Calcified Nodule Staining kit (Cosmo Bio, Tokyo, Japan). For ALP staining, we fixed the cells for 20 min in 4% paraformaldehyde and used an alkaline phosphatase staining kit (Cosmo Bio).
Elemental analysis
For electron microscopic observation, the specimens stained by alizarin were refixed with 2% glutaraldehyde in 0.1 M phosphate buffer overnight at 4 °C. Dehydration was carried out using graded concentrations of ethanol, then the specimens were placed in propylene oxide and subsequently embedded in Epok 812 (Oken, Tokyo, Japan). The specimens were examined with a TM4000 (Hitachi, Tokyo, Japan) electron microscope at 15 kV to analyze their elemental composition.
Microarray analysis
MDA-MB-231, MDA-MB-468, and MC3T3-E1 cells were seeded into 35-mm dishes at a cell density of 2.0 × 10⁵ cells/ml for 3 days. The cells were cultured with or without OC for 2, 4, and 6 weeks. Total RNA was extracted using TRIzol Reagent (Thermo Fisher Scientific, MA, USA). We measured the RNA integrity number of total RNA using an Agilent RNA 6000 Nano Kit (Agilent technologies, CA, USA) to verify the quality of total RNA. Microarray analysis was performed using Agilent SureScan G4900DA (Agilent technologies).
MA plots were reported from normalized microarray data. We defined Log2FC > 1 as upregulated genes and Log2FC ≤ 1 as downregulated genes. Pathway analysis of differentially expressed genes was performed using genes up- or downregulated at 2, 4, and 6 weeks. Frequent pathways were extracted in the KEGG pathway from functional analysis of The Database for Annotation, Visualization and Integrated Discovery https://david.ncifcrf.gov)34,35. The threshold of count was 2 and the Expression Analysis Systematic Explorer score was 0.1. Gene set enrichment analysis was performed using Qlucore Omics Explorer version 3.4 (Qlucore AB, Lund, Sweden).
Western blotting
MDA-MB-231, MDA-MB-468, and MC3T3-E1 cells treated were cultured as described above with or without OC for 2 weeks. The cells were then lysed with CHAPS buffer (Cell Signaling Technology, MA, USA). As a positive control for PLAP and TNAP, HeLa cells were cultured for 3 days and their protein extracted. The cell lysates were heated at 100 °C for 5 min with SDS sample buffer, and 10 µg of protein was electrophoresed in 10% acrylamide gel at 150 V for 1 h. The gel was blotted to a cellulose nitrate membrane at 150 mA. Anti-PLAP antibody (EPR6141, Abcam, Cambridge, UK) diluted 1,000 times, anti-TNAP antibody (EPR4477, Abcam) diluted 4,000 times, anti-c-Jun antibody (9165S, Cell Signaling Technology; diluted 2,000 times), anti-phospho-c-Jun antibody (3270S, Cell Signaling Technology; diluted 2,000 times), and anti-β-actin antibody (8H10D10, Cell Signaling Technology) were used as the primary antibodies. Peroxidase AffiniPure goat anti-rabbit IgG (H + L) (111-035-144, Jackson ImmunoResearch, West Grove, PA, USA) diluted 2,000 times for PLAP, TNAP, c-Jun, and phospho-c-Jun and anti-mouse IgG horseradish peroxidase (GE Healthcare, IL, USA) diluted 1,000 times for β-actin were used as secondary antibodies. After adding Thermo Pierce Western Blotting Substrate (Thermo Fisher Scientific), images were acquired with chemiluminescence detection using ChemiDoc Touch (Bio-Rad, CA, USA).
ALP enzyme kinetics by pharmacologic inhibition
MDA-MB-231 cells were seeded into 96-well plates at a cell density of 2.0 × 10⁵ cells/ml for 3 days. Cells were cultured with and without OC. The cells were fixed for 20 min in 4% paraformaldehyde. The cells cultured with OC were heated at 60 °C for 15 min with and without the addition of 2 mM L-phenylalanine. Para-nitrophenyl phosphate (pNPP) was added at concentrations of 0.01–5 mM. The solution was examined at 405 nm for 30 min every one minute using a microplate reader (Bio-Rad). Michaelis–Menten plots were generated based on the initial reaction velocities that were calculated at each concentration in each group.
siRNA assay
ALPP siRNA (Silencer™ Select Pre-designed & Validated siRNA; s1300 and s1301, Thermo Fisher Scientific) and negative control siRNA (Silencer™ Select Negative Control No. 1 siRNA, Thermo Fisher Scientific) were added 1:1 to Lipofectamine RNAiMAX (Thermo Fisher Scientific). MDA-MB-231 was seeded into 6-well plates at a cell density of 2.0 × 10⁵ cells/ml for 3 days. Cells were cultured after addition of OC, OC with siRNA 10 µM (s1300 + s1301), or OC with negative control siRNA 10 µM. We performed western blot after 2 weeks and alizarin and ALP staining after 6 weeks.
Pharmacologic inhibition for PI3K-Akt signaling pathway
LY294002 (FUJIFILM Wako Pure Chemical, Osaka, Japan) 20 µM, AKT inhibitor X (Cayman Chemical, MI, USA) 20 µM, and AZD-8055 (ChemScene, NJ, USA) 1 µM were added to medium, OC, and vehicle (0.04% DMSO). MDA-MB-231 cells were seeded into 6-well plates at a cell density of 2.0 × 10⁵ cells/ml for 3 days. The cells were with vehicle alone or with OC with added vehicle, LY294002, AKT inhibitor X, or AZD-8055. We performed western blot at 2 weeks and alizarin staining at 6 weeks.
qRT-PCR
Total cellular RNA was isolated using the TRIzol Reagent (Thermo Fisher Scientific). cDNAs were synthesized using the High Capacity cDNA Reverse Transcription Kit (Applied Biosystems, Grand Island, NY, USA). cDNA samples were amplified using the Power SYBR Green PCR Master Mix (Applied Biosystems) and CFX96 Real-Time PCR System (Bio-Rad). Primers used for qRT-PCR are listed in Supplementary Table 2.
Vector-based enforced expression
ALPP insert was purified from cDNAs that were synthesized from total cellular RNA in HeLa cells using PrimeSTAR (Takara Bio) and the primers of ALPP (Supplementary Table 2). The insert was inserted into the multiple cloning site of the pcDNA3.1( +) plasmid using the pBlueScript II SK( +) plasmid. Next, MDA-MB-468 cells were transfected with pcDNA3.1( +)–ALPP by electroporation (Bio-Rad) and selected for growth in 300 ug/l geneticin (Cosmo Bio).
Statistical analysis
Student’s t-test was used to determine differences between means of groups. P < 0.05 denoted statistical significance. All statistical analyses were performed using R version 3.6.3.
Supplementary information
Acknowledgements
We thank the staff of Core Research Facilities, The Jikei University School of Medicine, particularly Mayumi Nomura and Nobutake Akiyama, for their extraordinary support in this study. This research was supported by the Jikei University Research Fund for Graduate Students. The sponsor had no role in the design or conduct of this research.
Author contributions
A.F. and Y.M. designed the study. H.T. supervised the project. T.T. performed the elemental analysis. A.F. carried out the other experiments.
Competing interests
The authors declare no competing interests.
Footnotes
Publisher's note
Springer Nature remains neutral with regard to jurisdictional claims in published maps and institutional affiliations.
Supplementary information
is available for this paper at 10.1038/s41598-020-69622-7.
References
- 1.Independent UKPoBCS The benefits and harms of breast cancer screening: an independent review. Lancet (London, England) 2012;380:1778–1786. doi: 10.1016/S0140-6736(12)61611-0. [DOI] [PubMed] [Google Scholar]
- 2.Gold RH, Bassett LW, Widoff BE. Highlights from the history of mammography. Radiographics. 1990;10:1111–1131. doi: 10.1148/radiographics.10.6.2259767. [DOI] [PubMed] [Google Scholar]
- 3.Perry N, Broeders M, de Wolf C, Tornberg S, Holland R, von Karsa L. European guidelines for quality assurance in breast cancer screening and diagnosis. Fourth edition–summary document. Ann. Oncol. 2008;19:614–622. doi: 10.1093/annonc/mdm481. [DOI] [PubMed] [Google Scholar]
- 4.Committee to Revise Mammography Guidelines e. The guidelines for mammography. 3rd ed. IGAKU-SHOIN Ltd, (2010).
- 5.Cox RF, Morgan MP. Microcalcifications in breast cancer: Lessons from physiological mineralization. Bone. 2013;53:437–450. doi: 10.1016/j.bone.2013.01.013. [DOI] [PubMed] [Google Scholar]
- 6.Giachelli CM. Vascular calcification mechanisms. J. Am. Soc. Nephrol. 2004;15:2959–2964. doi: 10.1097/01.ASN.0000145894.57533.C4. [DOI] [PubMed] [Google Scholar]
- 7.Cox RF, Hernandez-Santana A, Ramdass S, McMahon G, Harmey JH, Morgan MP. Microcalcifications in breast cancer: novel insights into the molecular mechanism and functional consequence of mammary mineralisation. Br. J. Cancer. 2012;106:525–537. doi: 10.1038/bjc.2011.583. [DOI] [PMC free article] [PubMed] [Google Scholar]
- 8.Shu R, McMullen R, Baumann MJ, McCabe LR. Hydroxyapatite accelerates differentiation and suppresses growth of MC3T3-E1 osteoblasts. J. Biomed. Mater. Res. A. 2003;67:1196–1204. doi: 10.1002/jbm.a.20021. [DOI] [PubMed] [Google Scholar]
- 9.Scimeca M, Giannini E, Antonacci C, Pistolese CA, Spagnoli LG, Bonanno E. Microcalcifications in breast cancer: an active phenomenon mediated by epithelial cells with mesenchymal characteristics. BMC Cancer. 2014;14:286. doi: 10.1186/1471-2407-14-286. [DOI] [PMC free article] [PubMed] [Google Scholar]
- 10.Sharma U, Pal D, Prasad R. Alkaline phosphatase: an overview. Indian J. Clin. Biochem. 2014;29:269–278. doi: 10.1007/s12291-013-0408-y. [DOI] [PMC free article] [PubMed] [Google Scholar]
- 11.Zanconato F, et al. Genome-wide association between YAP/TAZ/TEAD and AP-1 at enhancers drives oncogenic growth. Nat. Cell Biol. 2015;17:1218–1227. doi: 10.1038/ncb3216. [DOI] [PMC free article] [PubMed] [Google Scholar]
- 12.Langenbach F, Handschel J. Effects of dexamethasone, ascorbic acid and beta-glycerophosphate on the osteogenic differentiation of stem cells in vitro. Stem Cell Res. Therapy. 2013;4:117. doi: 10.1186/scrt328. [DOI] [PMC free article] [PubMed] [Google Scholar]
- 13.Park JB. The effects of dexamethasone, ascorbic acid, and beta-glycerophosphate on osteoblastic differentiation by regulating estrogen receptor and osteopontin expression. J. Surg. Res. 2012;173:99–104. doi: 10.1016/j.jss.2010.09.010. [DOI] [PubMed] [Google Scholar]
- 14.Lammers L, et al. Impact of DAG stimulation on mineral synthesis, mineral structure and osteogenic differentiation of human cord blood stem cells. Stem Cell Res. 2012;8:193–205. doi: 10.1016/j.scr.2011.09.004. [DOI] [PubMed] [Google Scholar]
- 15.Choi HD, Noh WC, Park JW, Lee JM, Suh JY. Analysis of gene expression during mineralization of cultured human periodontal ligament cells. J. Periodontal Implant Sci. 2011;41:30–43. doi: 10.5051/jpis.2011.41.1.30. [DOI] [PMC free article] [PubMed] [Google Scholar]
- 16.Jaiswal N, Haynesworth SE, Caplan AI, Bruder SP. Osteogenic differentiation of purified, culture-expanded human mesenchymal stem cells in vitro. J. Cell. Biochem. 1997;64:295–312. doi: 10.1002/(SICI)1097-4644(199702)64:2<295::AID-JCB12>3.0.CO;2-I. [DOI] [PubMed] [Google Scholar]
- 17.Hamidouche Z, et al. FHL2 mediates dexamethasone-induced mesenchymal cell differentiation into osteoblasts by activating Wnt/beta-catenin signaling-dependent Runx2 expression. FASEB J. 2008;22:3813–3822. doi: 10.1096/fj.08-106302. [DOI] [PubMed] [Google Scholar]
- 18.Xiao G, Gopalakrishnan R, Jiang D, Reith E, Benson MD, Franceschi RT. Bone morphogenetic proteins, extracellular matrix, and mitogen-activated protein kinase signaling pathways are required for osteoblast-specific gene expression and differentiation in MC3T3-E1 cells. J. Bone Miner. Res. 2002;17:101–110. doi: 10.1359/jbmr.2002.17.1.101. [DOI] [PubMed] [Google Scholar]
- 19.Dang D, Prasad H, Rao R. Secretory pathway Ca(2+)-ATPases promote in vitro microcalcifications in breast cancer cells. Mol. Carcinog. 2017;56:2474–2485. doi: 10.1002/mc.22695. [DOI] [PMC free article] [PubMed] [Google Scholar]
- 20.Moulin P, et al. Hypophosphatasia may lead to bone fragility: don't miss it. Eur. J. Pediatr. 2009;168:783–788. doi: 10.1007/s00431-008-0835-6. [DOI] [PubMed] [Google Scholar]
- 21.Whyte MP. Physiological role of alkaline phosphatase explored in hypophosphatasia. Ann. N. Y. Acad. Sci. 2010;1192:190–200. doi: 10.1111/j.1749-6632.2010.05387.x. [DOI] [PubMed] [Google Scholar]
- 22.Owen TA, et al. Progressive development of the rat osteoblast phenotype in vitro: reciprocal relationships in expression of genes associated with osteoblast proliferation and differentiation during formation of the bone extracellular matrix. J. Cell. Physiol. 1990;143:420–430. doi: 10.1002/jcp.1041430304. [DOI] [PubMed] [Google Scholar]
- 23.Chen J, Shapiro HS, Sodek J. Development expression of bone sialoprotein mRNA in rat mineralized connective tissues. J. Bone Miner. Res. 1992;7:987–997. doi: 10.1002/jbmr.5650070816. [DOI] [PubMed] [Google Scholar]
- 24.Sharma T, Radosevich JA, Pachori G, Mandal CC. A molecular view of pathological microcalcification in breast cancer. J. Mamm. Gland Biol. Neoplasia. 2016;21:25–40. doi: 10.1007/s10911-015-9349-9. [DOI] [PubMed] [Google Scholar]
- 25.O'Grady S, Morgan MP. Deposition of calcium in an in vitro model of human breast tumour calcification reveals functional role for ALP activity, altered expression of osteogenic genes and dysregulation of the TRPM7 ion channel. Sci. Rep. 2019;9:542. doi: 10.1038/s41598-018-36496-9. [DOI] [PMC free article] [PubMed] [Google Scholar]
- 26.Wada HG, Shindelman JE, Ortmeyer AE, Sussman HH. Demonstration of placental alkaline phosphatase in human breast cancer. Int. J. Cancer. 1979;23:781–787. doi: 10.1002/ijc.2910230608. [DOI] [PubMed] [Google Scholar]
- 27.Chang TC, Wang JK, Hung MW, Chiao CH, Tsai LC, Chang GG. Regulation of the expression of alkaline phosphatase in a human breast-cancer cell line. Biochem. J. 1994;303(Pt 1):199–205. doi: 10.1042/bj3030199. [DOI] [PMC free article] [PubMed] [Google Scholar]
- 28.Lukey MJ, Greene KS, Erickson JW, Wilson KF, Cerione RA. The oncogenic transcription factor c-Jun regulates glutaminase expression and sensitizes cells to glutaminase-targeted therapy. Nat. Commun. 2016;7:11321. doi: 10.1038/ncomms11321. [DOI] [PMC free article] [PubMed] [Google Scholar]
- 29.Network TCGA. Comprehensive molecular portraits of human breast tumours. Nature. 2012;490:61–70. doi: 10.1038/nature11412. [DOI] [PMC free article] [PubMed] [Google Scholar]
- 30.Proudfoot D, Skepper JN, Hegyi L, Bennett MR, Shanahan CM, Weissberg PL. Apoptosis regulates human vascular calcification in vitro: evidence for initiation of vascular calcification by apoptotic bodies. Circ. Res. 2000;87:1055–1062. doi: 10.1161/01.RES.87.11.1055. [DOI] [PubMed] [Google Scholar]
- 31.Collett GD, Sage AP, Kirton JP, Alexander MY, Gilmore AP, Canfield AE. Axl/phosphatidylinositol 3-kinase signaling inhibits mineral deposition by vascular smooth muscle cells. Circ. Res. 2007;100:502–509. doi: 10.1161/01.RES.0000258854.03388.02. [DOI] [PubMed] [Google Scholar]
- 32.Clarke MC, et al. Chronic apoptosis of vascular smooth muscle cells accelerates atherosclerosis and promotes calcification and medial degeneration. Circ. Res. 2008;102:1529–1538. doi: 10.1161/CIRCRESAHA.108.175976. [DOI] [PubMed] [Google Scholar]
- 33.Ponnusamy A, et al. FTI-277 inhibits smooth muscle cell calcification by up-regulating PI3K/Akt signaling and inhibiting apoptosis. PLoS ONE. 2018;13:e0196232. doi: 10.1371/journal.pone.0196232. [DOI] [PMC free article] [PubMed] [Google Scholar]
- 34.da Huang W, Sherman BT, Lempicki RA. Systematic and integrative analysis of large gene lists using DAVID bioinformatics resources. Nat. Protoc. 2009;4:44–57. doi: 10.1038/nprot.2008.211. [DOI] [PubMed] [Google Scholar]
- 35.da Huang W, Sherman BT, Lempicki RA. Bioinformatics enrichment tools: paths toward the comprehensive functional analysis of large gene lists. Nucl. Acids Res. 2009;37:1–13. doi: 10.1093/nar/gkn923. [DOI] [PMC free article] [PubMed] [Google Scholar]
Associated Data
This section collects any data citations, data availability statements, or supplementary materials included in this article.


