Abstract
Background
The aim of this study was to investigate whether myoglobin mediates the autophagy of NRK-52E via the Pink1/Parkin signaling pathway.
Material/Methods
Differentially-expressed genes were selected by PCR chip analysis of the autophagy signaling pathway. RT-PCR and Western blot analyses were used to detect the expressions of Pink1/Parkin and autophagy-related proteins in myoglobin-treated NRK-52E. LC3 double-labeled lentivirus was used to infect NRK-52E for observing autophagy. The role of myoglobin mediates autophagy was evaluated through Pink1-siRNA inhibition of the Pink1/Parkin signaling pathway.
Results
Myoglobin acted on NRK-52E, caused differential expressions of Pink1, Parkin, and Beclin 1, increased apoptosis, and decreased cell viability. myoglobin increased the levels of Pink1, Beclin 1 and ATG5, decreased the levels of P62 and Parkin. The level of LC3II/LC3I showed significant elevation in NRK-52E cells at after incubated with 100 μmol/L myoglobin. Inhibiting Pink1/Parkin signaling pathway through Pink1-siRNA could alleviate myoglobin induced apoptosis, decrease the levels of Pink, Beclin1, ATG5, LC3II/LC3I, and elevate the levels of Parkin and P62. Moreover, the autophagy spots were reduced after silencing Pink1 in myoglobin-treated NRK-52E.
Conclusions
Myoglobin mediates the autophagy of NRK-52E in rat renal tubular epithelial cells via the Pink1/Parkin signaling pathway.
MeSH Keywords: Acute Kidney Injury, Autophagy, Crush Syndrome, Myoglobin
Background
Crush syndrome (CS) occurs in various traumatic events, such as accidents or natural disasters, and natural disasters can cause injury in a large number of people at the same time, leading to an epidemic of CS [1]. CS is also known as rhabdomyolysis (RMa), which is a life-threatening potential systemic complication characterized by myoglobinuria, acute kidney injury (AKI), hyperkalemia, or sepsis [2]. AKI occurs in 10–60% of RM patients [3], and myoglobin is a key pathogenic protein [4,5]. At present, although the pathogenesis, diagnosis, and treatment of CS-related AKI have been thoroughly studied and explored, CS-complicated AKI still has a high mortality rate (3–50%) [6,7]. Therefore, a comprehensive understanding of the pathogenesis of CS-induced AKI is essential to improve these patients’ prognosis. Studies have shown that autophagy in the renal system is closely related to AKI [8–10]. Autophagy is a highly conserved degradation process that is widely found in eukaryotic cells. During emergency reactions of the body, such as cell starvation, toxicity, ischemia, or oxidative damage, damaged organelles and abnormal proteins can be eliminated through lysosomes to maintain the intracellular stability and emergency response [11–13]. Pink1 is a serine-threonine protein kinase closely involved in autophagy, apoptosis, oxidative stress, release of synaptic transmitters, and mitochondrial calcium homeostasis. The Ubl domain and ubiquitin of Parkin are regulated in an opposite manner from that of phosphorylation [14], which is mainly involved in cell physiological activities such as mitochondrial morphology, mitochondrial dynamics, and autophagy. It is also a downstream protein of Pink1 [15], and Pink1/Parkin-mediated mitochondrial autophagy plays an important role in mitochondrial quality control, renal tubular cell survival, and renal function of AKI [16]. However, it is unclear whether Pink1/Parkin-regulated autophagy participates in CS-related AKI, and the mechanism of CS-related AKI regulation requires elucidation. Our research team has conducted several studies on true animal CS platforms [17], and we also detected the autophagy lysosomes by electron microscopy in CS-kidney tissue. The purpose of the present study was to assess whether myoglobin induces autophagy of NRK-52E cells through the Pink1/Parkin signaling pathway.
Material and Methods
Cell Culture
NRK-52E cells were cultured in RPMI-1640 medium (GIBCO, USA) containing 10% FBS (GIBCO, USA) at 37°C and 5% CO2 (Thermo Electron, USA), and cells in logarithmic growth phase were harvested for cell biology experiments.
CCK-8 kit
Myoglobin (concentrations of 0, 50, 100, and 150 μm) was added to act on NRK-52E for 24 h, and NRK-52E in the logarithmic growth phase was collected for detection of cell viability using the CCK-8 kit. Cell proliferation rate was calculated as (absorbance value at 450 nm of experimental group–absorbance value at 450nm of blank control group)/absorbance value at 450 nm of blank control group×100%.
TUNEL and Annexin-V-FITC
We placed 3×10⁴ NRK-52E cells in a 24-well plate (with slides in the wells) and cultured them overnight. The cells were observed on the next day, and cells at a density of about 50% were selected for use in subsequent experiments. The cells were the treated with myoglobin at concentrations of 0 μm, 50 μm, 100 μm, and 150 μm, NRK-52E-infected Pink1-siRNA, rapamycin, myoglobin (100 μm), rapamycin+Pink1-siRNA, or myoglobin+Pink1-siRNA and cultured for 24 h. For TUNEL detection, the cells were first fixed with 4% paraformaldehyde for 15 min, followed by 0.2% TritonX-100 membrane transportation, Tdt reaction mix incubation in the dark, DAPI staining, anti-fluorescence quenching mounting, and apoptosis detection by fluorescence microscopy. The apoptosis index (%) was calculated as TUNEL-positive cells/total cells×100%. For Annexin-V-FITC, 100 ul of 1X binding buffer was used to re-suspend the cells, which were then mixed with 5 μl of Annexin V/FITC for 5-min incubation at room temperature in the dark. After 10 μl of 20 μg/ml PI was added, 400 ul of PBS was immediately added for flow cytometry.
Autophagy PCR chip
NRK-52E cells were exposed to myoglobin (0, 50, 100, and 150 μm) for 24 h, then cell RNA was extracted using the RNeasy min kit, the concentration and purity of which were measured using NanoDrop® ND-1000 and denatured agarose gel. The qualified total RNA was then reversely transcribed to cDNA and we prepared the mixed solution according to the instructions of the RT2 First Strand Kit. We then added 650 μL of 2× SuperArray PCR master mix, 102 μL of diluted cDNA, 548 μL of ddH2O, and 10 μL of the mixed solution to each well corresponding to the PCR array, which was then covered and sealed for real-time PCR reactions.
RT-PCR
Trizol reagent (Invitrogen, USA) was used to extract the total RNA of different experimental groups for reverse transcription (the reverse transcription kit was purchased from Takara, Japan). SYBR Premix Ex Taq I (Takara, Japan) was then used for real-time quantitative PCR (the instrument was purchased from Bio-Rad, USA) to detect the expression levels of Pink1, Beclin1, Parkin, P62, and ATG5. Each experiment was repeated 3 times for calibration with Actin as the internal reference. The PCR primers sequence used in this study are shown in Table 1.
Table 1.
PCR primers used in this study.
| PCR primers sequences | |
|---|---|
| Pink1-S | 5′ AGTCACTACCTATGCCCATCCATCTAA 3′ |
| Pink1-AS | 5′ TTCAGTGTCATCCGTGTTTGTCCTT 3′ |
| Parkin-S | 5′ CTGGAACTGTGGCTGTGAGTGGAA 3′ |
| Parkin-AS | 5′ AGAAGAAGAAATGGCTAACAAAGGTAGGAG 3′ |
| Beclin 1-S | 5′ GCAAGATTGAAGACACTGGAGGCA 3′ |
| Beclin 1-AS | 5′ GTGAGGACACCCAAGCAAGACCC 3′ |
| Atg5-s | 5′ ATGCAGTTGAGGCTCACTTTATGTC 3′ |
| Atg5-AS | 5′ TGGAGGGTATTCCATGAGTTTCC 3′ |
| P62-S | 5′ AAGGTGGTGGTGCCTCCCAAAGA 3′ |
| P62-AS | 5′ CACATGCTGAGTGAGCCAAATGA 3′ |
| Actin-S | 5′ AGGGAAATCGTGCGTGACAT 3′ |
| Actin-AS | 5′ CCTCGGGGCATCGGAA 3′ |
LC3 double-labeled lentivirus infection
We cultured 3×10⁴ NRK-52E from different groups (control group (CON), rapamycin (RAP), rapamycin+Pink1-siRNA (RAP-PIN), myoglobin (100 μm), and myoglobin+Pink1-siRNA (MYO+PIN)) for 24 h in 24-well plates overnight. When the cell density was about 50%, 500 μl of HIGH-DMEM medium was added into a 1.5-ml centrifuge tube, together with 10 μl of mRFP-GFP-LC3 double-labeled lentivirus (the virus titer was 1×10⁸ TU/ml, and MOI was 25), for 24-h incubation. After changing the medium, the incubation continued until the fluorescence infection efficiency was observed 72 h later. The degree of autophagy was calculated as RFP LC3+/number of total cells.
Western blot analysis
The NRK-52E cells treated with various concentrations of myoglobin were lysed and proteins were extracted. The quantified proteins were then isolated by SDS-PAGE, transferred onto PVDF membrane, and sealed with TBS containing 5% skim milk powder for 1 h, followed by rinsing in TBS 3 times, overnight incubation with corresponding primary antibodies [P62 (1: 1000), LC3 (1: 1000), Beclin1 (1: 1000), ATG5 (1: 1000), Pink1 (1: 1000), and Parkin (1: 1000), GAPDH (1: 2000), all rabbit polyclonal antibodies, purchased from Wuhan San Eagle Biotechnology Co.] at 4°C, TBST rinsing on the next day, 30~45-min incubation with horseradish peroxidase (HRP)-labeled secondary antibody (goat anti-rabbit, purchased from Wuhan Sanying Biotechnology Co.) at room temperature, TBST rinsing, 2-min coloration with ECL chemiluminescence reagent (Beijing Regen Biotechnology Co.), X-ray exposure, and photography using the BIO-RAD ChemiDocXRS image acquisition system (BIO-RAD).
Statistical analysis
The data were analyzed with SPSS 23.0 software. The measurement data were expressed as mean±standard deviation (χ̄±SD). The comparison of measurement data among multiple groups used the single-factor analysis of variance. LSD was used for pairwise comparison. The count data were tested using the χ2 test, with P<0.05 being considered as statistical significance.
Results
Impact of myoglobin on proliferation and apoptosis
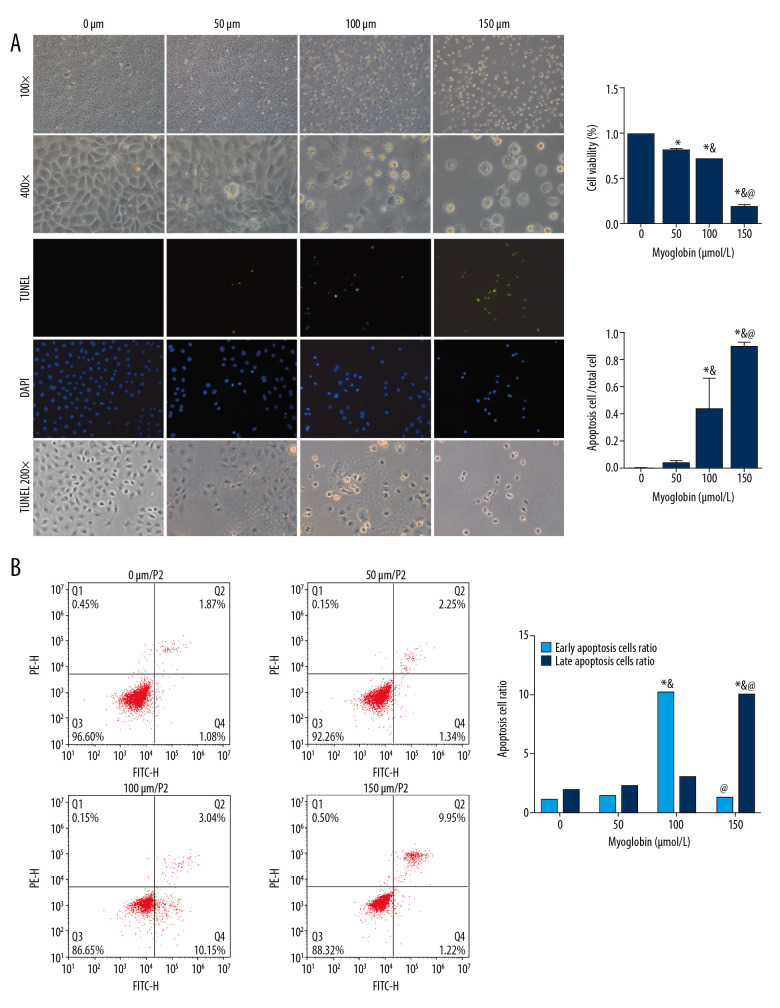
As the concentration of myoglobin increased, the inhibition of NRK-52E’s cell viability gradually increased, and the apoptosis rate of NRK-52E cells increased. Early apoptosis of NRK-52E increased in group 100, and late apoptosis of NRK-52E increased in group 150. Late apoptosis often indicates that cells begin to show more irreversible damage and eventually evolve into cell death, Figure 1.
Figure 1.
(A, B) Effect of myoglobin with different concentrations on cell viability and apoptosis of NRK-52E. Compared with group 0, * P<0.05; compared with group 50, & P<0.05; compared with group 100, @ P<0.05.
Results of autophagy PCR chip screening
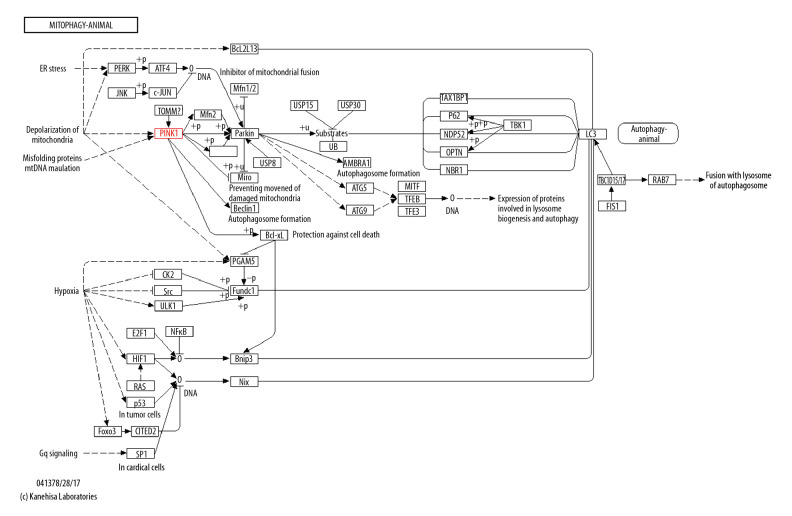
A total of 96 autophagy-related genes were screened by the autophagy PCR chip. The results showed that the highest expression of Pink1 was in group 100, but the expression in group 150 was lower than other groups. In addition, group 100 had the lowest Parkin expression. Beclin1 was expressed at a higher level, and these 3 genes were all on the Pink1/Parkin autophagy pathway by the KEGG PATHWAY database analysis (Table 2, Figure 2).
Table 2.
PCR array results.
| Symbol | 50 um/0 um | Symbol | 100 um/0 um | Symbol | 150 um/0 um |
|---|---|---|---|---|---|
| Tnf | 4.24 | Pink1 | 5.43 | Ifng | 6.70 |
| Ifng | 4.10 | Ins2 | 4.43 | Tnf | 4.47 |
| Ins2 | 3.54 | Ifng | 3.62 | Irgm | 4.17 |
| Pink1 | 2.43 | Tnf | 2.66 | Pink1 | 2.94 |
| Ctss | 2.29 | Irgm | 2.58 | Casp8 | 2.54 |
| Park7 | 2.05 | Park7 | 2.35 | Fas | 2.39 |
| Tgfb1 | 2.00 | Fas | 2.02 | Mapt | 2.32 |
| Cdkn2a | 1.96 | Sqstm1 | 1.95 | Ctss | 2.21 |
| Atg16l2 | 1.90 | Atg16l2 | 1.91 | Dram2 | 2.18 |
| Fas | 1.83 | Casp8 | 1.85 | Esr1 | 2.15 |
| Pim2 | 1.79 | Cdkn2a | 1.75 | Park7 | 2.05 |
| Bad | 1.69 | Eif2ak3 | 1.73 | Cln3 | 1.94 |
| Irgm | 1.57 | Esr1 | 1.72 | Atg16l1 | 1.89 |
| Actb | 1.53 | Beclin1 | 1.71 | Sqstm1 | 1.83 |
| Sqstm1 | 1.50 | Bad | 1.66 | Pik3r4 | 1.81 |
| Casp8 | 1.43 | Dram2 | 1.62 | Rb1cc1 | 1.68 |
| Rplp1 | 1.40 | Hdac6 | 1.54 | Cdkn2a | 1.66 |
| Cln3 | 1.38 | Mapt | 1.47 | Pik3c3 | 1.57 |
| Map1lc3a | 1.38 | Rps6kb1 | 1.47 | Atg4c | 1.56 |
| Nfkb1 | 1.35 | Cdig2 | 1.45 | Atg16l2 | 1.56 |
| Akt1 | 1.35 | Map1lc3a | 1.44 | Casp3 | 1.54 |
| Bid | 1.32 | Atg3 | 1.44 | Pik3cg | 1.53 |
| Tp53 | 1.31 | Tp53 | 1.43 | B2m | 1.51 |
| Atg4b | 1.31 | Bid | 1.33 | Map1lc3a | 1.50 |
| Bak1 | 1.29 | Atg16l1 | 1.32 | Hsp90aa1 | 1.50 |
| Atg16l1 | 1.28 | Rplp1 | 1.31 | Cdig2 | 1.47 |
| Dapk1 | 1.24 | Rb1cc1 | 1.30 | Rps6kb1 | 1.45 |
| Atg9a | 1.21 | Nfkb1 | 1.29 | Actb | 1.44 |
| Cdig2 | 1.19 | Mapk8 | 1.28 | Bak1 | 1.40 |
| Esr1 | 1.15 | B2m | 1.27 | Beclin1 | 1.39 |
| Rab24 | 1.15 | Atg4b | 1.26 | Gabarap | 1.37 |
| Hgs | 1.13 | Actb | 1.25 | Atg4b | 1.37 |
| Beclin1 | 1.12 | Gabarapl2 | 1.23 | Gabarapl2 | 1.37 |
| Gaa | 1.12 | Tgfb1 | 1.23 | Psen1 | 1.34 |
| Igf1 | 1.09 | Cln3 | 1.22 | Rab24 | 1.34 |
| Rgs19 | 1.06 | Rab24 | 1.21 | Bid | 1.31 |
| RGD1359310 | 1.04 | Pik3c3 | 1.21 | Atg3 | 1.31 |
| Mtor | 1.03 | Tm9sf1 | 1.18 | Rgs19 | 1.30 |
| Psen1 | 1.02 | Pim2 | 1.16 | Bad | 1.28 |
| Mapt | 1.01 | Htt | 1.16 | Pten | 1.27 |
| Gabarapl2 | 1.01 | Ctss | 1.16 | Bcl2 | 1.27 |
| Atg3 | 1.00 | RGD1359310 | 1.15 | Tgm2 | 1.26 |
| Fadd | −1.01 | Atg12 | 1.15 | Nfkb1 | 1.26 |
| Gabarap | −1.02 | Hdac1 | 1.12 | Lamp1 | 1.25 |
| B2m | −1.04 | Psen1 | 1.12 | Pim2 | 1.23 |
| Ctsd | −1.04 | Pik3r4 | 1.12 | Hgs | 1.23 |
| Atg5 | −1.06 | Gaa | 1.10 | Atg9a | 1.22 |
| Tm9sf1 | −1.08 | Atg9a | 1.10 | Mtor | 1.20 |
| Hdac6 | −1.08 | Casp3 | 1.09 | Ctsb | 1.18 |
| Lamp1 | −1.09 | Map1lc3b | 1.09 | Map1lc3b | 1.18 |
| Htt | −1.11 | Lamp1 | 1.07 | Htt | 1.17 |
| Map1lc3b | −1.14 | Gabarap | 1.06 | Fadd | 1.16 |
| Ctsb | −1.15 | Prkaa1 | 1.00 | Mapk14 | 1.14 |
| Wipi1 | −1.15 | Mtor | −1.00 | Gaa | 1.13 |
| Ulk1 | −1.18 | Atg5 | −1.01 | Ins2 | 1.06 |
| Mapk14 | −1.18 | Fadd | −1.02 | Tgfb1 | 1.06 |
| Arsa | −1.18 | Atg4c | −1.02 | Eif2ak3 | 1.05 |
| Hdac1 | −1.19 | Hgs | −1.03 | RGD1359310 | 1.05 |
| Pik3r4 | −1.20 | Hsp90aa1 | −1.04 | Hdac6 | 1.05 |
| Pik3c3 | −1.20 | Bcl2l1 | −1.05 | Hprt1 | 1.04 |
| App | −1.23 | Hprt1 | −1.08 | Rplp1 | 1.04 |
| Bax | −1.23 | Rgs19 | −1.09 | Atg7 | 1.03 |
| Eif2ak3 | −1.25 | Bak1 | −1.09 | Ctsd | −1.00 |
| Bcl2l1 | −1.29 | Bcl2 | −1.12 | Tm9sf1 | −1.01 |
| Atg4c | −1.33 | Ctsd | −1.12 | Mapk8 | −1.03 |
| Cdkn1b | −1.37 | Akt1 | −1.12 | Tp53 | −1.03 |
| Rps6kb1 | −1.40 | Pten | −1.13 | Atg12 | −1.05 |
| Atg7 | −1.40 | Arsa | −1.16 | Ulk1 | −1.08 |
| Ldha | −1.43 | Mapk14 | −1.17 | Bcl2l1 | −1.10 |
| Casp3 | −1.43 | Bax | −1.17 | Ambra1 | −1.14 |
| Hprt1 | −1.44 | Ctsb | −1.19 | Atg5 | −1.14 |
| Ambra1 | −1.48 | Eif4g1 | −1.22 | Rb1 | −1.18 |
| Dram2 | −1.48 | Atg7 | −1.23 | Akt1 | −1.22 |
| Pten | −1.57 | Wipi1 | −1.26 | Prkaa1 | −1.25 |
| Atg12 | −1.57 | Rb1 | −1.30 | Hdac1 | −1.35 |
| Tnfsf10 | −1.60 | Cdkn1b | −1.30 | Eif4g1 | −1.40 |
| Hsp90aa1 | −1.67 | App | −1.35 | Wipi1 | −1.46 |
| Mapk8 | −1.67 | Ulk1 | −1.42 | Cdkn1b | −1.56 |
| Rb1 | −1.70 | Ambra1 | −1.43 | Park2 | −1.64 |
| Prkaa1 | −1.80 | Park2 | −1.56 | App | −1.71 |
| Eif4g1 | −2.08 | Tgm2 | −1.68 | Bax | −1.81 |
| Bnip3 | −2.14 | Bnip3 | −1.76 | Bnip3 | −1.83 |
| Cxcr4 | −2.15 | Ldha | −1.92 | Tnfsf10 | −1.85 |
| Bcl2 | −2.34 | Cxcr4 | −2.31 | Arsa | −1.91 |
| Snca | −2.46 | Dapk1 | −2.44 | Cxcr4 | −2.36 |
| Pik3cg | −2.54 | Igf1 | −2.60 | Ldha | −2.37 |
| Park2 | −2.82 | Tnfsf10 | −2.67 | Igf1 | −3.35 |
| Rb1cc1 | −3.68 | Pik3cg | −2.73 | Snca | −7.85 |
| Tgm2 | −4.58 | Snca | −3.17 | Dapk1 | −19.76 |
Figure 2.
Autophagy PCR chip and KEGG PATHWAY database analysis.
Impact of myoglobin on expressions of Pink1, Beclin1, and Parkin mRNA
In group 50, group 100, and group 150, NRK-52E expressed higher Pink1 mRNA than that in group 0, but the expressions of Parkin mRNA were lower than in group 0. The expressions of Parkin mRNA in group 100 and group 150 were lower than in group 0. The expressions of Beclin1 mRNA in group 50, group 100, and group 150 were higher than that in group 0, and the expressions of Beclin1 mRNA in group 100 and group 150 were higher than in group 50 (Figure 3).
Figure 3.
(A–C) Effect of myoglobin with different concentrations on expressions of Pink1, Parkin and Beclin1 mRNA in NRK-52E. Compared with group 0, * P<0.05; compared with group 50, & P<0.05.
Impact of myoglobin on expressions of Pink1/Parkin and autophagy-related proteins
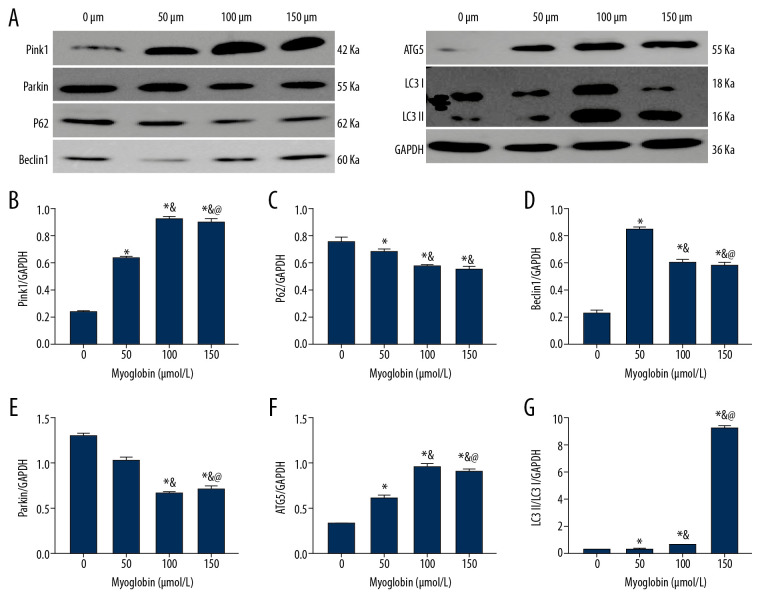
After adding myoglobin to NRK-52E, the expression of Parkin gradually decreased, but the expression of Pink1 gradually increased; the expression of P62 decreased; and the ratio of LC3II/LC3I increased. When the final myoglobin concentration was 150 μm, the expression increase was the most obvious; the expression of ATG5 gradually increased, and the expression of Beclin1 increased. When the final concentration of myoglobin was 50 μm, the expressions increased the most significantly. There were no significant differences between group 150 and group 100, so we chose 100 μm for further experiments (Figure 4).
Figure 4.
(A–G) Effect of myoglobin with different concentrations on expressions of Pink1/Parkin and autophagy-related proteins in NRK-52E. Compared with group 0, * P<0.05; compared with group 50, & P<0.05; compared with group 100, @ P<0.05.
Impact of autophagy promoter Rapamycin and Pink1-siRNA on apoptosis
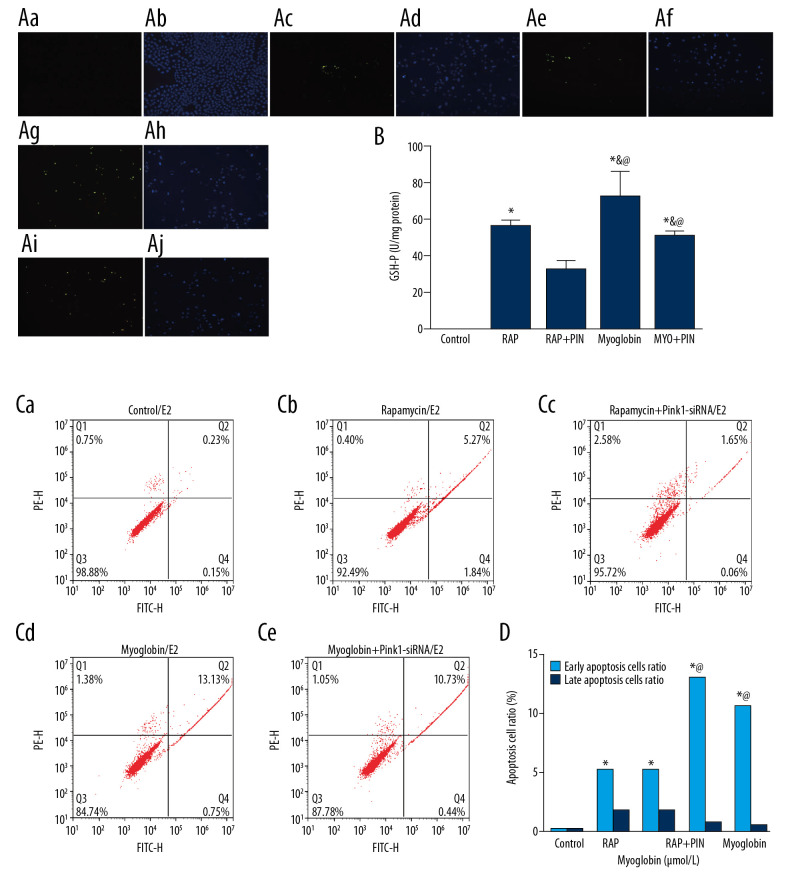
After adding rapamycin and myoglobin to NRK-52E cells, the apoptotic rate increased. However, after being infected with Pink1-siRNA, the apoptotic rate decreased, and the apoptotic rate in Pink1-siRNA-infected groups showed a downward trend (Figure 5).
Figure 5.
Effect of autophagy promoter Rapamycin and Pink1-siRNA on apoptosis of NRK-52E by TUNEL. (Aa, Ab) Control; (Ac, Ad): Rapamycin; (Ae, Af) Rapacymin+Pink1-siRNA; (Ag, Ah) Myoglobin; (Ai, Aj) Myoglobin+Pink1-siRNA. (B) The apoptosis rates of NRK-52E cells after treated with autophagy promoter rapamycin and Pink1-siRNA were detected by TUNEL assay in different groups. Compared with group CON, * P<0.05; compared with group RAP, & P<0.05; compared with group RAP+Pin, @ P<0.05; compared with group MYO, # P<0.05.
Impact of autophagy promoter Rapamycin and Pink1-siRNA on expressions of Pink1/Parkin autophagy-related mRNAs and proteins
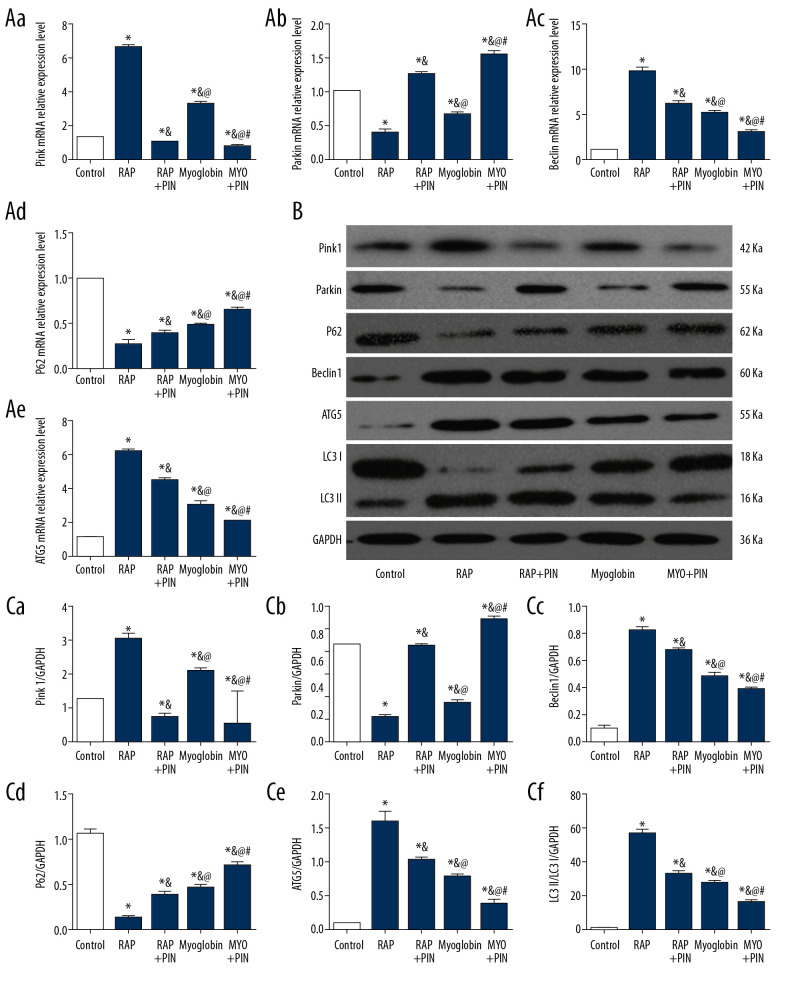
Compared with group CON, the expressions of Pink1 mRNA and protein increased in group RAP and group MYO, but the amounts of Pink1 mRNA and protein decreased in group RAP+Pin and group MYO+Pin. The expressions of Parkin mRNA and protein decreased in group RAP and group MYO, and increased in group RAP+Pin and group MYO+Pin. The expression levels of Beclin1 and ATG5 mRNAs and proteins were increased in group RAP and group MYO, but the expressions in group RAP+Pin and group MYO+Pin decreased. The expression of P62 mRNA was the opposite, which decreased in group RAP and group MYO and increased in group RAP+Pin and group MYO+Pin. The ratio of LC3II/LC3I increased in group RAP and group MYP but decreased after Pink1-siRNA infection (Figure 6).
Figure 6.
(A–C) Effect of autophagy promoter Rapamycin and Pink1-siRNA on expressions of Pink1/Parkin autophagy-related mRNAs and proteins in NRK-52E. Compared with group CON, * P<0.05; compared with group RAP, & P<0.05; compared with group RAP+Pin, @ P<0.05; compared with group MYO, # P<0.05.
Comparison of fluorescent spots of NRK-52E after LC3 double-labeled lentivirus infection
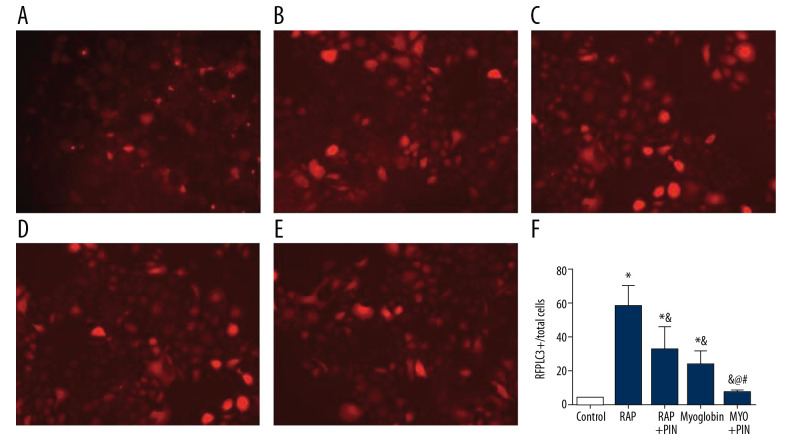
The autophagy spots were higher in group RAP and group MYO than in group CON, but the autophagy spots decreased in group RAP+Pin than in group RAP and group MYO (Figure 7).
Figure 7.
Comparison of fluorescent spots of NRK-52E among different groups after LC3 double-labeled lentivirus infection. (A) Control; (B) Rapamycin; (C) Rapacymin+Pink1-siRNA; (D) Myoglobin; (E) Myoglobin+Pink1-siRNA. Compared with group 0, * P<0.05; compared with group 50, & P<0.05; compared with group 100, @ P<0.05; compared with group MYO, # P<0.05
Discussion
AKI is a common complication of RM in CS and an important factor leading to death and poor prognosis of RM patients [18]. It has been experimentally proven that in AKI caused by ischemia/reperfusion injury, nephrotoxic drugs, or sepsis, autophagy occurs in renal tubular cells [19], which also has been successfully induced in various experimental models [20]. Loss of autophagy in the proximal tubule aggravates renal impairment [21], and non-selective autophagy and autophagy can also promote the selective degradation of damaged organelles through mitochondrial autophagy [21,22]. Pink1/Parkin pathway-mediated mitochondrial autophagy is the main pathway for clearing damaged mitochondria, and myoglobin is the main basic pathogenic factor of CS-related AKI. We speculated that myoglobin can mediate autophagy through the Pink1/Parkin pathway.
We first screened myoglobin NRK-52E for the latter three differential genes (Pink1, Beclin1, and Parkin) through an autophagy PCR chip, and found that they are all in the same autophagic pathway through bioinformatics analysis. After myoglobin acts on NRK-52E, Pink1/Parkin and autophagy-related proteins (Beclin1, P62, ATG5, and LC3II/LC3I) increase in activity, suggesting that myoglobin can trigger autophagy in NRK-52E cells through the Pink1/Parkin pathway. The autophagy activity gradually increased with increasing myoglobin concentration, but after being stimulated by 150 μm myoglobin, the ratio of LC3 II/LC3 I was significantly increased. In fluorescence-labeled LC3 lentivirus-infected NRK-52E cells, the phages also increased more significantly than in group 0; combined with decreased cell survival, we speculate that this over-enhanced autophagy results in autophagic death by type II programmed cell apoptosis [23,24].
Autophagy and apoptosis are two types of programmed cell death. Although autophagy and apoptosis are significantly different in morphological characteristics, there is some correlation between them. Recent research has shown that, in some cases, these two mechanisms can antagonize or promote each other, can coexist in the same cell one after another or at the same time, and have overlapped molecules. These molecules play positive or negative roles in the mechanisms of autophagy and apoptosis [25]. For example, many proteins such as Beclin1, ATG4, and ATG5 are involved in the regulatory network of autophagy and apoptosis in mammals [26]. Lépine found that ATG5 cleaves tATG5-N (24KDa) in neutrophils. Full experimental evidence has shown that ATG5 (33KDa in full-length) not only is involved in the formation of autophagy, but also can be lysed by Calpine and generate related amino-terminal lysate targeting mitochondria, truncated ATG5 (1-193) (tATG5-N), which promotes apoptosis [27]. Lépine also studied whether tATG5-N can regulate the apoptosis and found that its enhanced expression induces apoptosis. Unlike ATG-5, which is full-length, tATG5-N can shift to the mitochondria, suggesting that lysis occurs in the activated upstream of B-cell lymphoma protein 2 (B-cell Lymphoma Protein2, Bcl-2), so it appears that truncated tATG5-N can promote the release of cytochrome C from mitochondria to the cytoplasm, thereby inducing apoptosis.
To further confirm myoglobin’s role of inducing the autophagy of the Pink1/Parkin pathway, we added the autophagy promoters rapamycin and myoglobin, and the Pink1/Parkin pathway was activated, after which, the expressions of autophagy-related genes and proteins increased. When the expression of Pink1 was downregulated by knocking down siRNA, the Pink1/Parkin pathway was inhibited, the apoptotic rate of NRK-52 decreased, the autophagy spots decreased, and the expressions of autophagy-related genes and proteins decreased, indicating that myoglobin participates in mediating renal tubular autophagy through the Pink1/Parkin pathway and inhibiting Pink1/Parking pathway exhibits a protective effect on renal tubular cells to a certain extent. Pink1/Parkin-mediated mitochondrial autophagy may play a dual role in protecting renal function and promoting cell death, but the transformation mechanism and the specific mechanism of myoglobin regulation of the Pink1/Parkin pathway need further study. The present study elucidates the molecular biological mechanism of CS-related AKI and will help identify therapeutic targets and improve prognosis.
Conclusions
After myoglobin acts on rat renal tubular epithelial NRK-52E cells, it mediates the autophagy of NRK-52E by regulating the Pink1/Parkin signaling pathway, and inhibiting Pink1/Parkin associated autophagy has certain protective effects on renal tubular cells treated by excessively high concentration myoglobin.
Footnotes
Conflicts of interest
None.
Source of support: This work was supported by the National Key Research and Development Program (2018YFC1504402)
References
- 1.Vanholder R, Sever MS, Erek E, Lameire N. Acute renal failure related to the crush syndrome: Towards an era of seismo-nephrology? Nephrol Dial Transplant. 2000;15:1517–21. doi: 10.1093/ndt/15.10.1517. [DOI] [PubMed] [Google Scholar]
- 2.Rajagopalan S. Crush injuries and the crush syndrome. Med J Armed Forces India. 2010;66:317–20. doi: 10.1016/S0377-1237(10)80007-3. [DOI] [PMC free article] [PubMed] [Google Scholar]
- 3.Huerta-Alardín AL, Varon J, Marik PE. Bench-to-bedside review: Rhabdomyolysis – an overview for clinicians. Crit Care. 2005;9:158–69. doi: 10.1186/cc2978. [DOI] [PMC free article] [PubMed] [Google Scholar]
- 4.Boutaud O, Moore KP, Reeder BJ, et al. Acetaminophen inhibits hemoprotein-catalyzed lipid peroxidation and attenuates rhabdomyolysis-induced renal failure. Proc Natl Acad Sci USA. 2010;107:2699–704. doi: 10.1073/pnas.0910174107. [DOI] [PMC free article] [PubMed] [Google Scholar]
- 5.Devall VC, Goggs R, Hansen C, et al. Serum myoglobin, creatine kinase, and cell-free DNA in endurance sled dogs and sled dogs with clinical rhabdomyolysis. J Vet Emerg Crit Care (San Antonio) 2018;28:310–16. doi: 10.1111/vec.12731. [DOI] [PubMed] [Google Scholar]
- 6.Slater MS, Mullins RJ. Rhabdomyolysis and myoglobinuric renal failure in trauma and surgical patients – a review. J Am Coll Surg. 1998;186:693–716. doi: 10.1016/s1072-7515(98)00089-1. [DOI] [PubMed] [Google Scholar]
- 7.Ward MM. Factors predictive of acute renal failure in rhabdomyolysis. Arch Intern Med. 1988;148:1553–57. [PubMed] [Google Scholar]
- 8.Leventhal JS, Ni J, Osmond M, et al. Autophagy limits endotoxemic acute kidney injury and alters renal tubular epithelial cell cytokine expression. PLoS One. 2016;11:e0150001. doi: 10.1371/journal.pone.0150001. [DOI] [PMC free article] [PubMed] [Google Scholar]
- 9.Luo B, Lin Y, Jiang S, et al. Endoplasmic reticulum stress eIF2alpha-ATF4 pathway-mediated cyclooxygenase-2 induction regulates cadmium-induced autophagy in kidney. Cell Death Dis. 2016;7:e2251. doi: 10.1038/cddis.2016.78. [DOI] [PMC free article] [PubMed] [Google Scholar]
- 10.Yang D, Livingston MJ, Liu Z, et al. Autophagy in diabetic kidney disease: Regulation, pathological role and therapeutic potential. Cell Mol Life Sci. 2018;75:669–88. doi: 10.1007/s00018-017-2639-1. [DOI] [PMC free article] [PubMed] [Google Scholar]
- 11.De Rechter S, Decuypere JP, Ivanova E, et al. Autophagy in renal diseases. Pediatr Nephrol. 2016;31:737–52. doi: 10.1007/s00467-015-3134-2. [DOI] [PubMed] [Google Scholar]
- 12.Song X, Narzt MS, Nagelreiter IM, et al. Autophagy deficient keratinocytes display increased DNA damage, senescence and aberrant lipid composition after oxidative stress in vitro and in vivo. Redox Biol. 2017;11:219–30. doi: 10.1016/j.redox.2016.12.015. [DOI] [PMC free article] [PubMed] [Google Scholar]
- 13.Huber TB, Edelstein CL, Hartleben B, et al. Emerging role of autophagy in kidney function, diseases and aging. Autophagy. 2012;8:1009–31. doi: 10.4161/auto.19821. [DOI] [PMC free article] [PubMed] [Google Scholar]
- 14.Sauvé V, Lilov A, Seirafi M, et al. A Ubl/ubiquitin switch in the activation of Parkin. EMBO J. 2015;34:2492–505. doi: 10.15252/embj.201592237. [DOI] [PMC free article] [PubMed] [Google Scholar]
- 15.Clark IE, Dodson MW, Jiang C, et al. Drosophila pink1 is required for mitochondrial function and interacts genetically with parkin. Nature. 2006;441:1162–66. doi: 10.1038/nature04779. [DOI] [PubMed] [Google Scholar]
- 16.Tang C, Han H, Yan M, et al. PINK1-PRKN/PARK2 pathway of mitophagy is activated to protect against renal ischemia-reperfusion injury. Autophagy. 2018;14:880–97. doi: 10.1080/15548627.2017.1405880. [DOI] [PMC free article] [PubMed] [Google Scholar]
- 17.Song J, Ding H, Fan HJ, et al. Canine model of crush syndrome established by a digital crush injury device platform. Int J Clin Exp Pathol. 2015;8:6117–25. [PMC free article] [PubMed] [Google Scholar]
- 18.Grunau BE, Pourvali R, Wiens MO, et al. Characteristics and thirty-day outcomes of emergency department patients with elevated creatine kinase. Acad Emerg Med. 2014;21:631–36. doi: 10.1111/acem.12385. [DOI] [PubMed] [Google Scholar]
- 19.Jiang M, Wei Q, Dong G, et al. Autophagy in proximal tubules protects against acute kidney injury. Kidney Int. 2012;82:1271–83. doi: 10.1038/ki.2012.261. [DOI] [PMC free article] [PubMed] [Google Scholar]
- 20.Havasi A, Dong Z. Autophagy and tubular cell death in the kidney. Semin Nephrol. 2016;36:174–88. doi: 10.1016/j.semnephrol.2016.03.005. [DOI] [PMC free article] [PubMed] [Google Scholar]
- 21.Kaushal GP, Shah SV. Autophagy in acute kidney injury. Kidney Int. 2016;89:779–91. doi: 10.1016/j.kint.2015.11.021. [DOI] [PMC free article] [PubMed] [Google Scholar]
- 22.Choi ME. Autophagy in kidney disease. Annu Rev Physiol. 2019;82:297–322. doi: 10.1146/annurev-physiol-021119-034658. [DOI] [PubMed] [Google Scholar]
- 23.Denton D, Xu T, Kumar S. Autophagy as a pro-death pathway. Immunol Cell Biol. 2015;93:35–42. doi: 10.1038/icb.2014.85. [DOI] [PubMed] [Google Scholar]
- 24.Bialik S, Dasari SK, Kimchi A. Autophagy-dependent cell death – where, how and why a cell eats itself to death. J Cell Sci. 2018;131:jcs215152. doi: 10.1242/jcs.215152. [DOI] [PubMed] [Google Scholar]
- 25.Mukhopadhyay S, Panda PK, Sinha N, et al. Autophagy and apoptosis: Where do they meet? Apoptosis. 2014;19:555–66. doi: 10.1007/s10495-014-0967-2. [DOI] [PubMed] [Google Scholar]
- 26.Cheng Y, Yang JM. Autophagy and apoptosis: Rivals or mates? Chin J Cancer. 2013;32:103–5. doi: 10.5732/cjc.013.10022. [DOI] [PMC free article] [PubMed] [Google Scholar]
- 27.Lépine S, Allegood JC, Edmonds Y, et al. Autophagy induced by deficiency of sphingosine-1-phosphate phosphohydrolase 1 is switched to apoptosis by calpain-mediated autophagy-related gene 5 (Atg5) cleavage. J Biol Chem. 2011;286:44380–90. doi: 10.1074/jbc.M111.257519. [DOI] [PMC free article] [PubMed] [Google Scholar]


