Abstract
Flavonoids are a large class of polyphenols widely distributed in plants in the free form or as glycosides, and they have antioxidation, antibacterial, antitumor growth, and other pharmacological effects. As an important active component of traditional Chinese medicine, they have high medicinal value and development prospects. In this work, the biomolecular properties of 10 common flavonoids, including baicalein, baicalin, apigenin, quercetin, naringenin, hesperetin, daidzein, genistein, puerarin, and gastrodin, are studied by terahertz time-domain spectroscopy (THz-TDS) in the range of 0.2–2.5 THz. The results reveal that these flavonoids have different characteristic absorption peaks in the terahertz band. Moreover, the terahertz absorption characteristics of samples in the temperature range of 78–320 K are studied. The results show that the characteristic absorption peaks gradually increase with the decrease in temperature, and the frequency position of the absorption peak has a slight blue shift. Furthermore, qualitative identification and quantitative analysis of flavonoids are carried out by terahertz spectra combined with chemometrics. Specifically, a series of mixtures of three flavonoids with similar molecular structures under various concentrations are analyzed. The partial least-squares regression (PLSR) model and the artificial neural network (ANN) model are applied to quantitatively analyze the ternary mixture. The results confirm that the ANN model obtains the best predicted value, with the root-mean-square errors in the prediction set (RMSEP) of 1.27% for daidzein. In summary, the biomolecular properties of flavonoids are studied by the THz-TDS technique, and a rapid, effective, and nondestructive method for qualitative identification and quantitative analysis of flavonoids is provided. The results demonstrate that this method has potential application value in the detection of Chinese herbal medicine and has better referential significance for the study of other biomolecules, especially for isomers or similar molecular structures.
1. Introduction
Flavonoids generally refer to a class of compounds formed by two benzene rings connected by a central three-carbon chain. They are a large class of polyphenols, which are widely found in plants in the free form or as glycosides. They have antioxidation, antibacterial, antiviral, antitumor growth, and other pharmacological effects. At present, it is often counterfeited and of low quality in the market, which seriously disturbs the market order and consumers’ health. To ensure the quality and safety of medicines and protect the rights and interests of consumers, it is essential to adopt a reliable and effective method for detection of Chinese herbal medicine. Traditional analytical techniques, such as high-performance liquid chromatography (HPLC),1,2 gas chromatography (GC),3,4 and gas chromatography–mass spectrometry (GC–MS),5 have been used to study the biomolecules. However, these methods are costly, labor-intensive, time-consuming, and require a large number of solvents and reagents. Instead, vibrational spectroscopic technologies, such as near-infrared (NIR),6,7 midinfrared (MIR),8 and Raman spectroscopies,9 have been widely applied in the detection of biological molecules.
Terahertz (THz) spectroscopy exploits a part of the electromagnetic spectrum lying between the microwave and infrared region. In recent decades, it has emerged as a powerful investigation technique with great potential for the analysis of biological molecules. To date, it has already been used to analyze DNA, proteins, and amino acids.10,11 THz spectroscopy is commonly considered as being different from conventional far-infrared spectroscopy because the terahertz response is coupled with the collective behavior of molecules. Specifically, THz absorption spectra contain numerous molecular vibrations, including low-frequency bond vibrations and crystalline phonon vibrations. Thus, the THz spectroscopy technique has been extensively employed in the fields of biomedicine,12,13 material science,14,15 and chemistry.16 Additionally, chemometric methods in conjunction with THz spectroscopy have been successfully used for qualitative and quantitative analysis.17−22
In this article, the biomolecular properties of 10 common flavonoids, including baicalein, baicalin, apigenin, quercetin, naringenin, hesperetin, daidzein, genistein, puerarin, and gastrodin, are investigated by terahertz time-domain spectroscopy (THz-TDS) in the range of 0.2–2.5 THz. Moreover, the terahertz absorption characteristics of flavonoids in the temperature range of 78–320 K are studied. Furthermore, we perform qualitative identification and quantitative analysis of flavonoids using terahertz absorption spectra combined with chemometric methods, including principal component analysis (PCA), support vector machine (SVM), partial least-squares regression (PLSR), and artificial neural network (ANN). In previous studies, some flavonoids were characterized by well-distinct peaks in the THz frequency range, demonstrating the feasibility of the THz technique.23,24 In this work, we investigate a series of ternary mixtures based on genistein, naringenin, and daidzein in various concentrations and perform quantitative analysis for the mixtures of three flavonoids with similar molecular structures, demonstrating the characteristics of a terahertz fingerprint spectrum. The results indicate that THz spectroscopy technique in combination with chemometrics is an effective, sensitive, and nondestructive analytical approach for the detection of biomolecules, especially for isomers or similar molecular structures.
2. Results and Discussion
2.1. Spectral Analysis
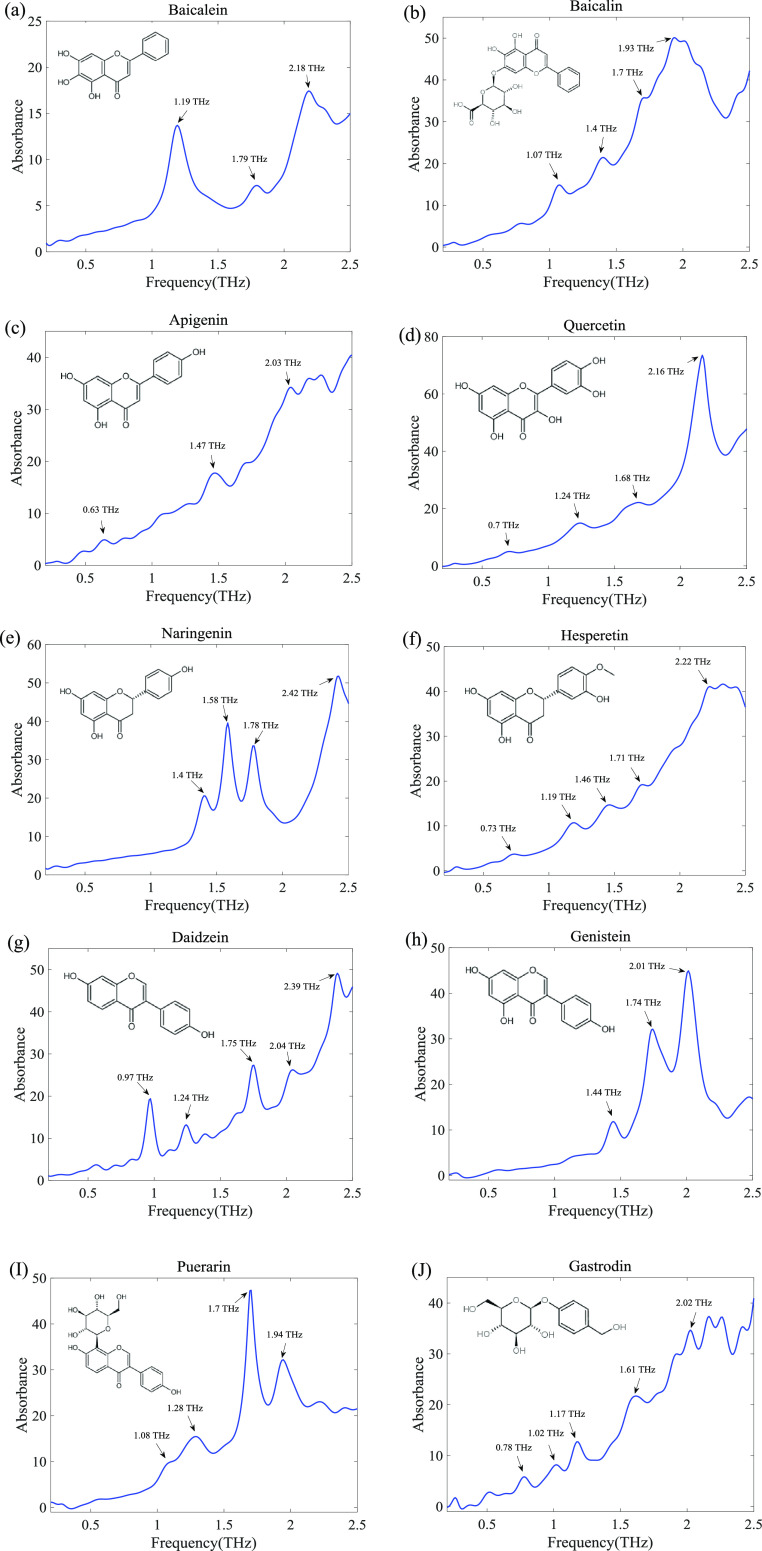
All flavonoid samples were measured at room temperature using THz-TDS. To ensure data accuracy, each sample was measured three times to get average data. To remove the echo effect caused by reflections in the sample, the time-domain waveform was cropped and zero-padded prior to Fourier transform. In this work, the spectral resolution is 10 GHz. After applying a Savitzky–Golay filter of polynomial order 3 to data frames of length 9, the original time-domain signal was calculated to obtain absorbance in the range of 0.2–2.5 THz. The THz absorption spectra of 10 kinds of flavonoids are shown in Figure 1. Although these flavonoids had a similar molecular structure, each flavonoid had significantly different characteristic absorption peaks in the terahertz band, which reflects the characteristics of the terahertz fingerprint spectrum of biological molecules. Indeed, baicalein has three absorption peaks at 1.19, 1.79, and 2.18 THz. Baicalin has four absorption peaks at 1.07, 1.4, 1.7, and 1.93 THz. Apigenin has three absorption peaks at 0.63, 1.47, and 2.03 THz. Quercetin has four absorption peaks at 0.7, 1.24, 1.68, and 2.16 THz. Naringenin has four absorption peaks at 1.4, 1.58, 1.78, and 2.42 THz. Hesperetin has five absorption peaks at 0.73, 1.19, 1.46, 1.71, and 2.22 THz. Daidzein has five absorption peaks at 0.97, 1.24, 1.75, 2.04, and 2.39 THz. Puerarin has four absorption peaks at 1.08, 1.28, 1.7, and 1.94 THz. Gastrodin has five absorption peaks at 0.78, 1.02, 1.17, 1.61, and 2.02 THz. It should be noted that biomolecules contained complex vibration modes in terahertz bands, mainly vibration, rotation, and weak intermolecular interactions, such as hydrogen bonds and van der Waals forces. Therefore, the species of flavonoids can be identified by the terahertz absorption spectrum.
Figure 1.
Terahertz absorption spectra of (a) baicalein, (b) baicalin, (c) apigenin, (d) quercetin, (e) naringenin, (f) hesperetin, (g) daidzein, (h) genistein, (i) puerarin, and (j) gastrodin in the range of 0.2–2.5 THz.
2.2. Low Temperature
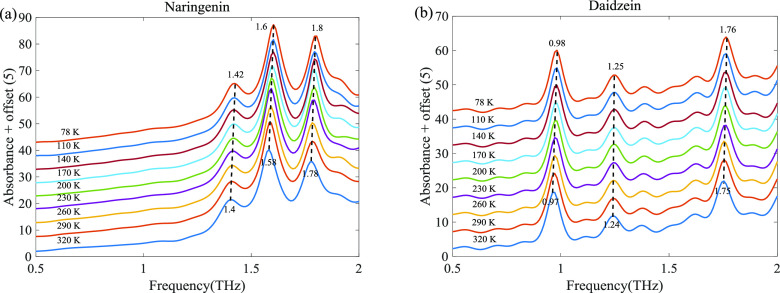
In this study, naringenin and daidzein are investigated by THz-TDS within a temperature range of 78–320 K. For naringenin, as shown in Figure 2a, the three absorption peaks gradually increase and suffer a slight blue shift with a decrease in temperature. The three absorption peaks of naringenin at 1.4, 1.58, and 1.78 THz are blue-shifted to 1.42, 1.6, and 1.8 THz, respectively. Daidzein exhibits similar behavior with the absorption peaks becoming sharper as the temperature decreases. The three absorption peaks at 0.97, 1.24, and 1.75 THz are blue-shifted to 0.98, 1.25, and 1.76 THz, respectively. The intensities and frequency positions of THz absorption peaks usually exhibit a temperature-dependent change. Generally, the absorption peak becomes sharper with the decreasing temperature mainly due to the temperature-dependent changes in the distribution of the energy vibrational states. The frequency shift of absorption peak position caused by temperature is considered to be due to various mechanisms. Among them, the blue shift was mainly due to the increase in the bond length caused by thermal expansion and the anharmonicity of vibrational potential, and the red shift was mainly due to the interaction of weak intermolecular bonding forces such as hydrogen bonds and van der Waals forces.33−36
Figure 2.
Absorption spectrum of naringenin (a) and daidzein (b) with the temperature change.
2.3. Qualitative Analysis
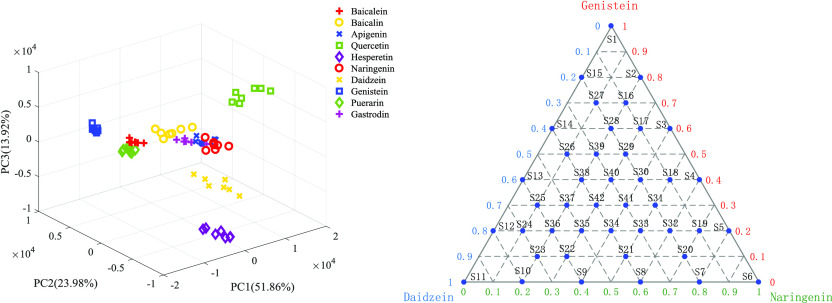
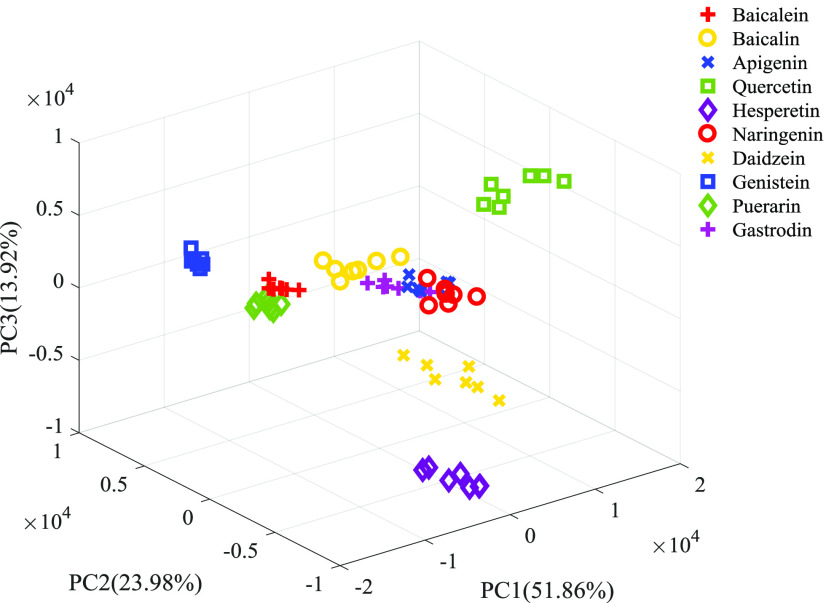
In this article, the characteristic variables were extracted from the original spectral data by the PCA method. Figure 3 shows the three-dimensional score graph obtained by principal component analysis of the absorption spectra of all samples. Among them, the cumulative variance contribution rate of the first five principal components exceeded 98%, representing the main information of the original data. Therefore, the first five principal components can be extracted as input variables of the SVM classification model. First, the calibration set was used to establish the classification model of the SVM. Then, radial basis kernel function (RBF) was applied to optimize the model, and the optimal parameters were selected by grid search with a parameter range of [−10, 10] and parameter step of 0.5. When the variables c = 2 and g = 0.5, the CV accuracy reached the highest value (100%). Finally, 10 kinds of flavonoids were classified using a trained model in the prediction set, resulting in a classification accuracy of up to 100%. Compared with the original spectral data as input variables of SVM, we used PCA to extract the first five principal components as input variables of SVM, which not only extracted the characteristic variables but also improved the computational efficiency and model accuracy.
Figure 3.
Three-dimensional score map of PCA for terahertz absorption spectra of 10 flavonoids.
2.4. Ternary Mixtures
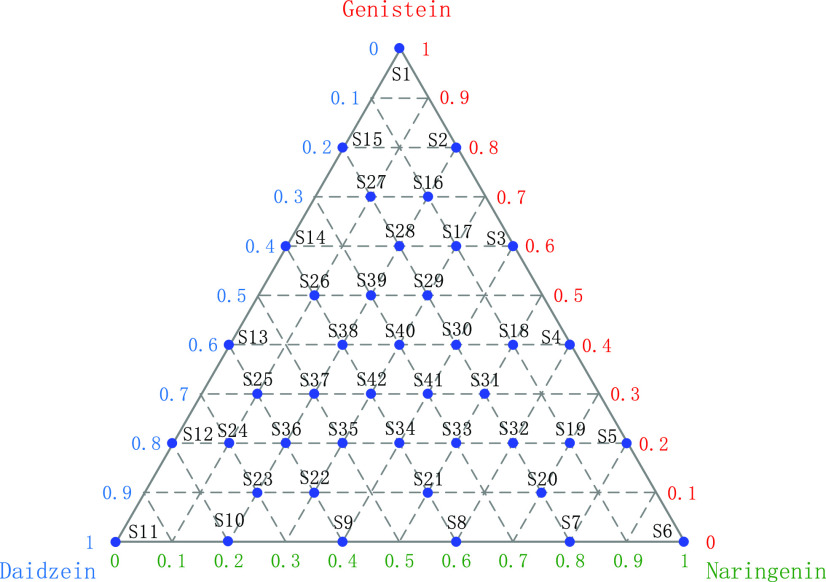
In this study, we investigated the quantitative analysis of ternary mixtures. Figure 6 displays the distribution of the three mixture analytes, namely, genistein (sample S1), naringenin (sample S6), and daidzein (sample S11). Indeed, the absorbance spectrum of the sample naturally contains the spectral features of the three pure analytes. Nevertheless, it was not simply the weighted sum of the three spectra related to the pure analytes.22 Consequently, it was difficult to achieve a direct analysis of the unknown mixture samples and this was the motivation for the use of chemometrics. In this work, two regression methods were utilized to build a quantitative prediction model for the concentration of the ternary mixture. The regression model was established through calibration set samples in the experiment, and then the prediction set was used to evaluate the performance of the model to predict the concentrations of samples. PLSR algorithm was applied to simultaneously predict the concentrations of these three analytes. The results are shown in Table 1. The mixtures were predicted by the PLSR model with different latent factors. In particular, because the sample was made of analytes and high-density polyethylene (HDPE) powder with a ratio of 1:2, RMSE expressed the value of the analytes instead of the total substance. It should be noted that the RMSE values for the three analytes were above 2%.
Figure 6.
Ternary diagram displaying the 42 samples analyzed by THz spectroscopy.
Table 1. Results of PLSR Model for Quantitative Analysis of Ternary Mixture.
|
R2 |
RMSE
(%) |
|||||
|---|---|---|---|---|---|---|
| model | analyte | latent factors | calibration | prediction | calibration | prediction |
| PLSR | genistein | 5 | 0.98 | 0.99 | 2.80 | 2.42 |
| naringenin | 6 | 0.99 | 0.99 | 2.33 | 2.14 | |
| daidzein | 7 | 0.99 | 0.99 | 2.40 | 2.16 | |
We also employ ANN model for the quantitative analysis of the samples presented above. In this work, a radial basis function neural network (RBFNN) is used to establish the model, which has a three-layer network composed of an input layer, a hidden layer, and an output layer. First, normalization was applied for the original spectral data as a preprocessing step. Then, all spectral data from samples were introduced into the ANN model as input neuron, and the hidden layer used RBF to calculate the value of the activation function. Finally, the output layer simultaneously provided the predicted result. The results are presented in Table 2. It should be noted that the RMSE values for these three analytes were lower than 2%, especially for daidzein, which was 1.27%.
Table 2. Results of ANN Model for Quantitative Analysis of Ternary Mixture.
| R2 | RMSE (%) | ||
|---|---|---|---|
| model | analyte | prediction | prediction |
| ANN | genistein | 0.99 | 1.63 |
| naringenin | 0.99 | 1.50 | |
| daidzein | 0.99 | 1.27 |
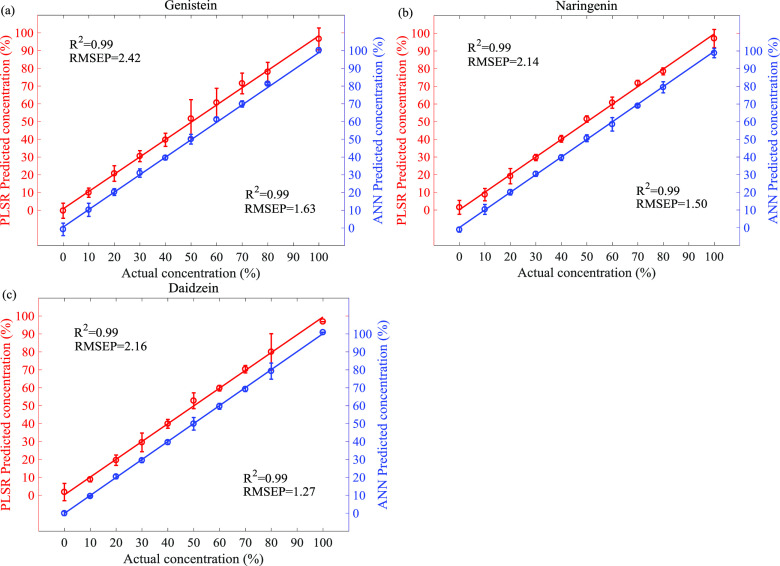
The prediction results are shown in Figure 4a–c. The figure exhibits the relationship between the actual and predicted concentrations of each flavonoid in the ternary mixture. The error bars describe the relative standard deviation obtained after the analysis of the three spectra of each sample in the prediction set, and the oblique line (solid line) represents the fitting equation. In the case of genistein, the error bars are a little large, especially for 50 and 60% of concentration. In the case of daidzein, the predicted values are very close to the actual values and the error bars are very small compared to the ones obtained for the other analytes. Comparing the prediction results of the two models, it can be seen that the ANN model has a higher correlation coefficient and lower root-mean-square error for these three analytes.
Figure 4.
Predicted concentrations of genistein (a), naringenin (b), and daidzein (c) by PLSR (red, left vertical axis) and ANN (blue, right vertical axis) versus the actual concentration values.
It should be noted that the performance and robustness of ANN regression have the best result than that of the PLSR model. The reasons could be attributed to the multivariate nonlinear relationship between the THz absorption spectra of the samples and the ternary mixture. It is known that THz absorption spectra contain numerous molecular vibrations, including molecular rotations, low-frequency bond vibrations, crystalline phonon vibrations, hydrogen bond stretches, and distortions. These complicated vibrations lead to intrinsic nonlinearity of spectrum–property relationship. Furthermore, the absorbance spectrum of the sample naturally contains the spectral features of the three pure analytes. Nevertheless, it is not simply the weighted sum of the three spectra related to pure analytes. These reasons are attributed to the ANN model adopting a nonlinear optimization strategy. Therefore, the results demonstrated that the THz absorption spectrum coupled with ANN regression is a potential analytical approach for analysis of a ternary mixture of flavonoids.
3. Conclusions
In this study, THz-TDS is used to investigate 10 kinds of common flavonoids in the range of 0.2–2.5 THz band, and the results reveal that they have distinct characteristic absorption peaks. Then, the absorption characteristics of naringenin and daidzein are investigated in the temperature range of 78–320 K, and the results show that the characteristic absorption peaks gradually increase with the decrease in temperature, mainly due to the effect of dynamic distribution of vibration energy. The blue shift of the absorption peak is mainly due to the thermal effect and anharmonic vibration. In addition, the classification and quantitative analyses of these flavonoids were carried out by means of chemometrics. First, PCA was used to extract spectral characteristic variables, and then the first five principal components as input variables of SVM were classified and identified. The optimal parameters were obtained through the optimization model, and the classification accuracy was 100%. In addition, the PLSR and ANN regression models were used for quantitative detection of the ternary mixture of flavonoids, and the results showed that the ANN model obtained the best predicted value, with RMSEP = 1.27% for daidzein. In conclusion, we used the THz-TDS technique to study the biomolecular characteristics of flavonoids in the terahertz band and provided a fast, effective, and nondestructive classification and quantitative analysis method combined with chemometrics, which has practical application in the field of detection and quality control of Chinese herbal medicine.
4. Experiments and Methods
4.1. Experimental Setup
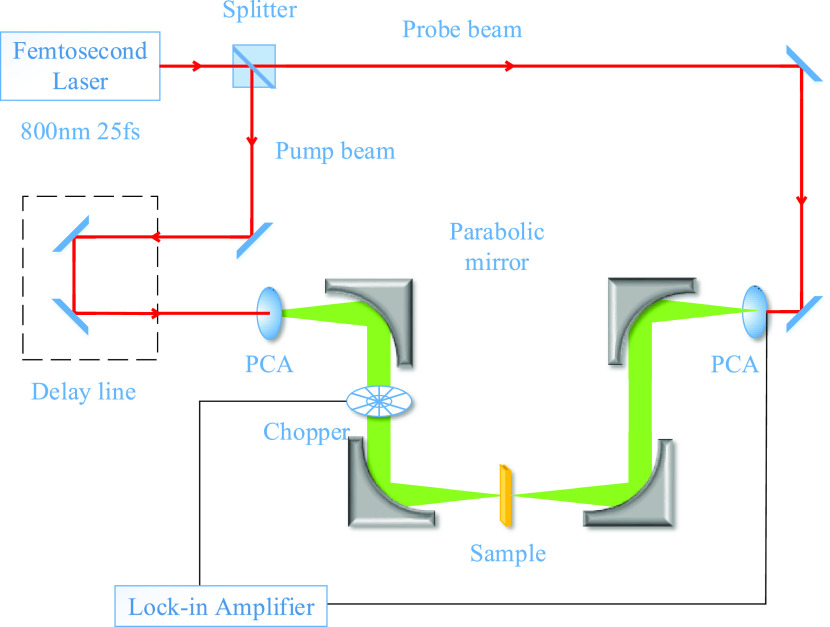
In this study, the system uses a diode-pumped mode-locked Ti/sapphire femtosecond laser, with a center wavelength of 800 nm, a pulse width of 25 fs, and a repetition rate of 84 MHz. The experimental setup is shown schematically in Figure 5. The femtosecond laser was split by a beam splitter into a pump and probe beam. On the pump side, the pump beam through a time delay device reached the antenna, which generated terahertz pulses that were collimated and focused on the sample by parabolic mirrors. On the probe side, the probe beam combined with the THz pulses through the sample to reach the antenna, which detected THz signals. Eventually, the measured signal was amplified by the phase-locked amplifier to be fed into the computer for further processing. Noticeably, the THz beam path must be purged with dry nitrogen to reduce the absorption of water vapor in the air and enhance the signal-to-noise ratio. The humidity was maintained at less than 3%, and the temperature was kept at 298 K. In general, the amplitude and phase of the THz pulses penetrating through the sample and reference can be measured. Thus, the transmission coefficient can be obtained by calculating the sample and reference spectra.10
Figure 5.
Schematic of the THz-TDS experimental equipment.
4.2. Sample Preparation
In this work, we prepared 10 common flavonoids, including baicalein, baicalin, apigenin, quercetin, naringenin, hesperetin, daidzein, genistein, puerarin, and gastrodin. All samples are standard substances (analytical grade, ≥99%) purchased from Sigma-Aldrich and J&K Scientific. Before the experiment, all samples were stored at a constant temperature in a humidity chamber without other pretreatments. The experimental sample was prepared using the powder pellet method. First, the sample was fully ground in an agate mortar, and then fully mixed with high-density polyethylene powder in a ratio of 1:2. Finally, a slice with a thickness of 1 mm was prepared under a tablet press. In the analysis of identification, 10 samples for each kind of flavonoid were prepared, and a total of 100 samples were taken as the samples to be tested. These samples were divided into a training set (30%) and a prediction set (70%) using Kennard–Stone method, and each sample was measured three times to obtain the average value. In ternary mixture analysis, we prepared a series of 42 samples. The three selected pure analytes were genistein, naringenin, and daidzein. Figure 6 displays the 42 samples inside a ternary diagram with each pure analyte as a pole. The samples were selected as follows: 3 of them contained only one pure analyte and were consequently displayed at the three poles of the triangle, 12 samples contained different mixtures of two pure analytes among the three and were consequently displayed on the three sides of the triangle, and finally, 27 samples contained different mixtures of the three pure analytes and were consequently displayed inside the triangle.22 For example, S39 contained 50% genistein, 20% naringenin, and 30% daidzein, but it should be noted that all of these samples were mixed with HDPE in a ratio of 1:2. Additionally, 10 copies of each sample were prepared, corresponding to 10 spectral data. In the establishment of quantitative models, each kind of sample containing 10 spectra was divided into a calibration set (70%) and a prediction set (30%) using Kennard–Stone method. Thus, the calibration set was made of 294 spectra, and the prediction set was composed of 126 spectra.
4.3. Chemometric Methods
4.3.1. Principal Component Analysis
The principal component analysis is a multivariate statistical method that can be used to extract feature variables and reduce the dimensionality of the data without decreasing their variance. PCA is an orthogonal transformation method that changes the original correlated variables to uncorrelated components, which are named principal components (PCs), namely, a linear combination of the original variables. The first PC (PC1) contains the largest amount of variance and the subsequent PCs contain progressively less variance.25
4.3.2. Support Vector Machines
The support vector machines, originally designed as a two-class classifier, can solve both linear and nonlinear multivariate calibration problems, which have been widely applied in machine learning, biometrics, and chemometric fields. Compared with other statistical methods, SVM does not require a large number of training samples for modeling.26,27 In addition, a support vector classifier (SVC), which is specially used for classification, is a type of SVM. Generally, the standard SVC model is a binary classifier. In the case of multiple classifications, SVC can be extended to a multiclass classification by a one-versus-one method. Specifically, a SVC model is established between any two types of samples, hence there are k(k – 1)/2 SVC models for k types of samples. When an unknown sample is classified, the label with the most votes is the category of the unknown sample. In this work, a multiclass SVC was applied to establish the classification model in the calibration set, a radial basis kernel function was employed to optimize the model, and a grid search method using 5-fold cross-validation was adopted to find the optimal parameters (regularization parameter c and the kernel parameter g) by which the model can achieve the best forecast results. To evaluate the performance of the established models, the CV accuracy was employed to evaluate the developed model’s performance.
4.3.3. Partial Least-Squares Regression
Concerning multivariate linear regression techniques, partial least-squares regression is the most widely used regression technique for spectroscopic data analysis. PLSR decomposes the predictor variables (spectral data) and response variables (Y-values) simultaneously to maximize the covariance between them by compressing the original data into latent factors. In this case, Y-values were ascribed to each sample according to the concentration of the ternary mixture in each formulation. Theory and more details about PLSR regression can be found in the literature.28,29
4.3.4. Artificial Neural Networks
An artificial neural network is a well-known nonlinear method of chemometrics. Radial basis function neural network is a feedforward neural network with strong adaptive learning and fast local optimization, which has been widely used in nonlinear systems. RBFNN model is a three-layer forward local network, including an input layer, a hidden layer, and an output layer. In the analysis of spectra, spectral data were introduced into the ANN model as input neuron, and the hidden layer was the neuron using radial basis function to obtain the activation function, and the output layer gave the predicted values.30,31
In the process of qualitative modeling, the samples were divided into a calibration set and a prediction set. Additionally, the performance of the model was evaluated by the coefficient of determination and root-mean-square errors in the calibration (i.e., Rc2, RMSEC) and the prediction set (i.e., Rp2, RMSEP). The calculation formulas for R2 and RMSE can be found in the literature.32
Acknowledgments
This research was supported by the National Natural Science Foundation of China (51627901 and 11704373), the National Key Research and Development Program of China (2016YFA0401004 and 2017YFA0402904), the Chinese Universities Scientific Fund (WK2340000071 and WK2310000076), Anhui Initiative in Quantum Information Technologies (AHY100000), and the Open Programs for the Key Science & Technology Infrastructures of CAS.
The authors declare no competing financial interest.
References
- Varghese B.; Al-Busafi S. N.; Suliman F. O.; Al-Kindy S. M. Z. 3-Naphthyl-1-phenyl-5-(4-carboxyphenyl)-2-pyrazoline-a pyrazoline based heterocyclic dye as a fluorescent label for biomolecules containing an amino group and its evaluation using HPLC. Anal. Methods 2016, 8, 2729–2736. 10.1039/C5AY02952J. [DOI] [Google Scholar]
- Zhu C. R.; Goodall D. M.; Wren S. A. C. Elevated temperature HPLC: Principles and applications to small molecules and biomolecules. LC-GC Eur. 2004, 17, 530–540. [Google Scholar]
- Pedrero Z.; Mounicou S.; Monperrus M.; Amouroux D. Investigation of Hg species binding biomolecules in dolphin liver combining GC and LC-ICP-MS with isotopic tracers. J. Anal. At. Spectrom. 2011, 26, 187–194. 10.1039/C0JA00154F. [DOI] [Google Scholar]
- Xie Y.; Ge S.; Jiang S.; Liu Z.; Chen L.; Wang L.; Chen J.; Qin L.; Peng W. Study on biomolecules in extractives of Camellia oleifera fruit shell by GC–MS. Saudi J. Biol. Sci. 2018, 25, 234–236. 10.1016/j.sjbs.2017.08.006. [DOI] [PMC free article] [PubMed] [Google Scholar]
- Razack S.; Kumar K. H.; Nallamuthu I.; Naika M.; Khanum F. Antioxidant, Biomolecule Oxidation Protective Activities of Nardostachys jatamansi DC and Its Phytochemical Analysis by RP-HPLC and GC-MS. Antioxidants 2015, 4, 185–203. 10.3390/antiox4010185. [DOI] [PMC free article] [PubMed] [Google Scholar]
- Zhegalova N. G.; He S.; Zhou H.; Kim D. M.; Berezin M. Y. Minimization of self-quenching fluorescence on dyes conjugated to biomolecules with multiple labeling sites via asymmetrically charged NIR fluorophores. Contrast Media Mol. Imaging 2014, 9, 355–362. 10.1002/cmmi.1585. [DOI] [PMC free article] [PubMed] [Google Scholar]
- Li W.; Luo R.; Lin X.; Jadhav A. D.; Zhang Z.; Yan L.; Chan C. Y.; Chen X.; He J.; Chen C.-H.; Shi P. Remote modulation of neural activities via near-infrared triggered release of biomolecules. Biomaterials 2015, 65, 76–85. 10.1016/j.biomaterials.2015.06.041. [DOI] [PubMed] [Google Scholar]
- Rodrigo D.; Limaj O.; Janner D.; Etezadi D.; Abajo F. J. G. D.; Pruneri V.; Altug H. Mid-infrared plasmonic biosensing with graphene. Science 2015, 349, 165–168. 10.1126/science.aab2051. [DOI] [PubMed] [Google Scholar]
- Mochizuki M.; Sato S.; Asatyas S.; Leśsnikowski Z. J.; Hayashi T.; Nakamura H. Raman cell imaging with boron cluster molecules conjugated with biomolecules. RSC Adv. 2019, 9, 23973–23978. 10.1039/C9RA04228H. [DOI] [PMC free article] [PubMed] [Google Scholar]
- Yin M.; Tang S. F.; Tong M. M. The application of terahertz spectroscopy to liquid petrochemicals detection: A review. Appl. Spectrosc. Rev. 2016, 51, 379–396. 10.1080/05704928.2016.1141291. [DOI] [Google Scholar]
- Qin J.; Ying Y.; Xie L. The Detection of Agricultural Products and Food Using Terahertz Spectroscopy: A Review. Appl. Spectrosc. Rev. 2013, 48, 439–457. 10.1080/05704928.2012.745418. [DOI] [Google Scholar]
- Fan S.; He Y.; Ung B. S.; Pickwell-MacPherson E. The growth of biomedical terahertz research. J. Phys. D: Appl. Phys. 2014, 47, 374009 10.1088/0022-3727/47/37/374009. [DOI] [Google Scholar]
- Yin M.; Tang S. F.; Tong M. M. Identification of edible oils using terahertz spectroscopy combined with genetic algorithm and partial least squares discriminant analysis. Anal. Methods 2016, 8, 2794–2798. 10.1039/C6AY00259E. [DOI] [Google Scholar]
- Abina A.; Puc U.; Jeglič A.; Zidanšek A. Applications of Terahertz Spectroscopy in the Field of Construction and Building Materials. Appl. Spectrosc. Rev. 2015, 50, 279–303. 10.1080/05704928.2014.965825. [DOI] [Google Scholar]
- Ferguson B.; Zhang X.-C. Materials for terahertz science and technology. Nat. Mater. 2002, 1, 26–33. 10.1038/nmat708. [DOI] [PubMed] [Google Scholar]
- Jepsen P. U.; Cooke D. G.; Koch M. Terahertz spectroscopy and imaging - Modern techniques and applications. Laser Photonics Rev. 2011, 5, 124–166. 10.1002/lpor.201000011. [DOI] [Google Scholar]
- Lu S.; Zhang X.; Zhang Z. Y.; Yang Y. P.; Xiang Y. H. Quantitative measurements of binary amino acids mixtures in yellow foxtail millet by terahertz time domain spectroscopy. Food Chem. 2016, 211, 494–501. 10.1016/j.foodchem.2016.05.079. [DOI] [PubMed] [Google Scholar]
- Lu S. H.; Li B. Q.; Zhai H. L.; Zhang X.; Zhang Z. Y. An effective approach to quantitative analysis of ternary amino acids in foxtail millet substrate based on terahertz spectroscopy. Food Chem. 2018, 246, 220–227. 10.1016/j.foodchem.2017.11.016. [DOI] [PubMed] [Google Scholar]
- Zeitler J. A.; Kogermann K.; Rantanen J.; Rades T.; Taday P. F.; Pepper M.; Aaltonen J.; Strachan C. J. Drug hydrate systems and dehydration processes studied by terahertz pulsed spectroscopy. Int. J. Pharm. 2007, 334, 78–84. 10.1016/j.ijpharm.2006.10.027. [DOI] [PubMed] [Google Scholar]
- Burnett A. D.; Fan W.; Upadhya P. C.; Cunningham J. E.; Hargreaves M. D.; Munshi T.; Edwards H. G. M.; Linfield E. H.; Davies A. G. Broadband terahertz time-domain spectroscopy of drugs-of-abuse and the use of principal component analysis. Analyst 2009, 134, 1658–1668. 10.1039/b817839a. [DOI] [PubMed] [Google Scholar]
- Sterczewski L. A.; Nowak K.; Szlachetko B.; Grzelczak M. P.; Szczesniak-Siega B.; Plinska S.; Malinka W.; Plinski E. F. Chemometric Evaluation of THz Spectral Similarity for the Selection of Early Drug Candidates. Sci. Rep. 2017, 7, 14583 10.1038/s41598-017-14819-6. [DOI] [PMC free article] [PubMed] [Google Scholar]
- El Haddad J.; de Miollis F.; Bou Sleiman J.; Canioni L.; Mounaix P.; Bousquet B. Chemometrics Applied to Quantitative Analysis of Ternary Mixtures by Terahertz Spectroscopy. Anal. Chem. 2014, 86, 4927–4933. 10.1021/ac500253b. [DOI] [PubMed] [Google Scholar]
- Ivanova B. B.; Spiteller M. On the chemical identification and determination of flavonoids in solid-state. Talanta 2012, 94, 9–21. 10.1016/j.talanta.2011.12.016. [DOI] [PubMed] [Google Scholar]
- Yan L.; Liu C.; Qu H.; Liu W.; Zhang Y.; Yang J.; Zheng L. Discrimination and Measurements of Three Flavonols with Similar Structure Using Terahertz Spectroscopy and Chemometrics. J. Infrared, Millimeter, Terahertz Waves 2018, 39, 492–504. 10.1007/s10762-018-0474-6. [DOI] [Google Scholar]
- Yang J.; Zhang D.; Frangi A. F.; Yang J.-y. Two-dimensional PCA: A new approach to appearance-based face representation and recognition. IEEE Trans. Pattern Anal. Mach. Intell. 2004, 26, 131–137. 10.1109/TPAMI.2004.1261097. [DOI] [PubMed] [Google Scholar]
- Cortes C.; Vapnik V. Support-Vector Networks. Mach. Learn. 1995, 20, 273–297. 10.1007/BF00994018. [DOI] [Google Scholar]
- Kim H.-C.; Pang S.; Je H.-M.; Kim D.; Bang S. Y. Constructing support vector machine ensemble. Pattern Recognit. 2003, 36, 2757–2767. 10.1016/S0031-3203(03)00175-4. [DOI] [Google Scholar]
- Wold S.; Sjöström M.; Eriksson L. PLS-regression: a basic tool of chemometrics. Chemom. Intell. Lab. Syst. 2001, 58, 109–130. 10.1016/S0169-7439(01)00155-1. [DOI] [Google Scholar]
- Lazraq A.; Cléroux R.; Gauchi J.-P. Selecting both latent and explanatory variables in the PLS1 regression model. Chemom. Intell. Lab. Syst. 2003, 66, 117–126. 10.1016/S0169-7439(03)00027-3. [DOI] [Google Scholar]
- Agatonovic-Kustrin S.; Beresford R. Basic concepts of artificial neural network (ANN) modeling and its application in pharmaceutical research. J. Pharm. Biomed. Anal. 2000, 22, 717–727. 10.1016/S0731-7085(99)00272-1. [DOI] [PubMed] [Google Scholar]
- Yu Y.; YuDejie; Junsheng C. A roller bearing fault diagnosis method based on EMD energy entropy and ANN. J. Sound Vib. 2006, 294, 269–277. 10.1016/j.jsv.2005.11.002. [DOI] [Google Scholar]
- Chen Q.; Jiang P.; Zhao J. Measurement of total flavone content in snow lotus (Saussurea involucrate) using near infrared spectroscopy combined with interval PLS and genetic algorithm. Spectrochim. Acta, Part A 2010, 76, 50–55. 10.1016/j.saa.2010.02.045. [DOI] [PubMed] [Google Scholar]
- Zhou L.; Chen L.; Ren G.; Zhu Z.; Zhao H.; Wang H.; Zhang W.; Han J. Monitoring cis-to-trans isomerization of azobenzene using terahertz time-domain spectroscopy. Phys. Chem. Chem. Phys. 2018, 20, 27205–27213. 10.1039/C8CP04570D. [DOI] [PubMed] [Google Scholar]
- Shen Y. C.; Upadhya P. C.; Linfield E. H.; Davies A. G. Temperature-dependent low-frequency vibrational spectra of purine and adenine. Appl. Phys. Lett. 2003, 82, 2350–2352. 10.1063/1.1565680. [DOI] [Google Scholar]
- Takahashi M.; Okamura N.; Fan X.; Shirakawa H.; Minamide H. Temperature Dependence in the Terahertz Spectrum of Nicotinamide: Anharmonicity and Hydrogen-Bonded Network. J. Phys. Chem. A 2017, 121, 2558–2564. 10.1021/acs.jpca.6b11049. [DOI] [PubMed] [Google Scholar]
- Walther M.; Fischer B. M.; Jepsen P. U. Noncovalent intermolecular forces in polycrystalline and amorphous saccharides in the far infrared. Chem. Phys. 2003, 288, 261–268. 10.1016/S0301-0104(03)00031-4. [DOI] [Google Scholar]


