Figure 5.
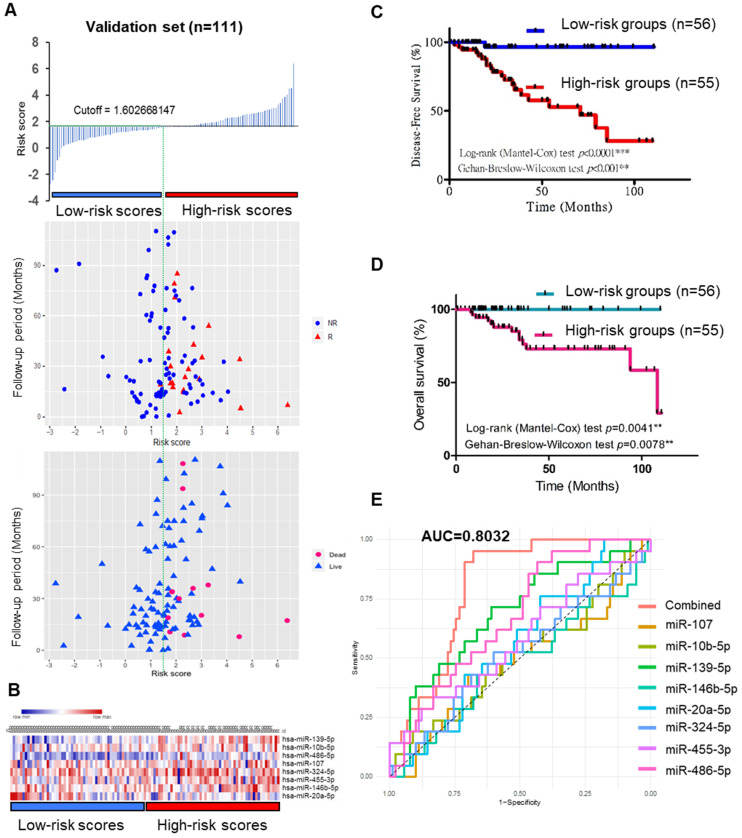
Predictive value of the 8-miRNA signature in 111 TNBC patients. (A) The 8-miRNA signature risk score distribution with the DFS and OS status of patients. The colorgram of 8-miRNA expression profiles of high- and low-risk groups with TNBC. The blue line represents the median miRNA signature cutoff dividing patients into low- and high-risk groups. (B) The expression of heatmap in 8 miRNAs for 111 TNBC patients. (C) Kaplan-Meier estimates of the low- and high-risk groups in DFS for the training set. (D) Kaplan-Meier estimates of the low- and high-risk groups in OS for the training set. (E) ROC for TNBC recurrence by the miRNA signature between patients with or without recurrence in the combined or respective miRNAs. The 8 combined miRNAs had a stronger predictive value than a single miRNA. OS: overall survival; DFS: disease-free survival; R: recurrence; NR: nonrecurrence.

