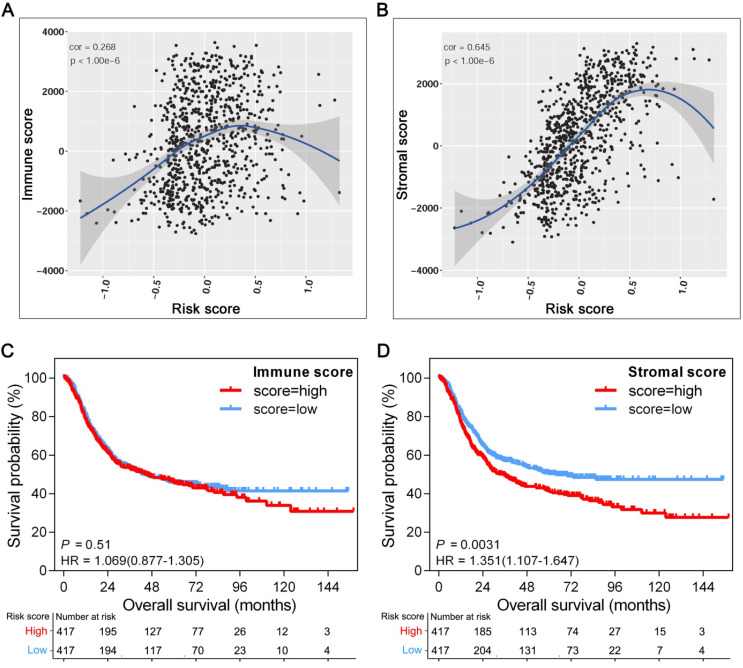
Figure 4.
Association of TME subcomponents with GPSGC risk score and outcome in patients with gastric cancer. The 834 gastric cancer patients involved in the analysis were from the TCGA-STAD (n = 342), ACRG (n = 300) and GSE15459 (n = 192) cohorts. (A) Scatter plots depicting the low positive correlation between immune score and GPSGC risk score in human gastric cancer samples. The fitted curve of the relation between immune score and GPSGC risk score was obtained by locally weighted scatterplot smoothing (LOWESS). Pearson's correlation coefficient is shown in the graphs (P < 1.0×10⁻⁶). (B) Scatter plots depicting the strong positive correlation between stromal score and GPSGC risk score in human gastric cancer samples. The fitted curve of the relation between stromal score and GPSGC risk score was obtained by LOWESS. Pearson's correlation coefficient is shown in the graphs (P < 1.0×10⁻⁶). (C) Kaplan-Meier curves for overall survival of 834 gastric cancer patients according to immune score. Log-rank test, P = 0.51. (D) Kaplan-Meier curves for overall survival of 834 gastric cancer patients according to stromal score. Log-rank test, P = 0.0031.

