

Abstract
Single-molecule resolution imaging has become an important tool in the study of cell biology. Aptamer-based approaches (e.g., MS2 and PP7) allow for detection of single RNA molecules in living cells and have been used to study various aspects of mRNA metabolism, including mRNP nuclear export. Here we outline an imaging protocol for the study of interactions between mRNPs and nuclear pore complexes (NPCs) in the yeast S. cerevisiae, including mRNP export. We describe in detail the steps that allow for high-resolution live-cell mRNP imaging and measurement of mRNP interactions with NPCs using simultaneous two-color imaging. Our protocol discusses yeast strain construction, choice of marker proteins to label the nuclear pore complex, as well as imaging conditions that allow high signal-to-noise data acquisition. Moreover, we describe various aspects of postacquisition image analysis for single molecule tracking and image registration allowing for the characterization of mRNP-NPC interactions.
Keywords: mRNP export, Nuclear pore complex, NPC, Live-cell imaging, Single molecule, Budding yeast, S. cerevisiae, Fluorescent imaging, PP7, Superregistration
1. Introduction
Transport from the nucleus to the cytoplasm is required for messenger ribonucleic acids (mRNAs) to assemble with ribosomes in the cytoplasm for translation. mRNAs in complex with associated proteins are referred to as messenger ribonucleoprotein particles (mRNPs). Export of mRNPs occurs through nuclear pore complexes (NPCs), large protein assemblies imbedded in the double membrane lipid bilayer of the nuclear envelope [1]. Built from ~30 nucleoporin proteins (Nups), NPCs form an eight-fold symmetrical assembly that can be divided into three functionally distinct domains. A central scaffold anchors the NPC into the nuclear envelope and forms the central transport channel that allows nucleocytoplamic exchange. Attached to the central scaffold are a number of asymmetrically distributed Nups on the nuclear and cytoplasmic side of the NPC. The cytoplasmic asymmetric Nups play a role in mRNP release after translocation through the central channel, a process that requires the dynamic association of the DEAD-box protein Dbp5 (DDX19b in humans) with the NPC [2]. On the nuclear side, long filamentous proteins, Mlp1/Mlp2 (TPR in humans), protrude into the nucleoplasm converging in a distal ring structure called the nuclear basket. Mlp1/2, as well as basket associated proteins, interact with mRNPs through associated RNA binding proteins (RBPs) to provide a docking site for mRNPs, thereby regulating access to the central transport channel [3,4]. Upon entering the central channel, translocation is not rate limiting, with mRNAs reaching the other side of the nuclear pore within tens of milliseconds [5–8].
The yeast S. cerevisiae has been a valuable model system to study mRNA transport. The combination of proteomic and genetic approaches were instrumental to identify most players in this process and in the development of current models describing mRNP export [9–11]. However, how this process is coordinated in space and time, or coupled to upstream and downstream events in gene expression, is still largely unexplored. Live cell single molecule microscopy is an important tool to study this process, and when combined with the power of yeast genetics, has the potential to reveal mechanistic details about this process [4, 6, 12]. However, studying mRNP export using high resolution single molecule microscopy is technically challenging. For example, the size of an NPC in relation to diffraction limited imaging makes it difficult to assign the position of a single mRNP to a subregion of the NPC. Gaussian fitting does allow for subdiffraction localization of single mRNPs, but mRNP signals have to be aligned to a reference nuclear pore signal acquired in a different channel. Moreover, a yeast cell possesses a 200 nm thick cell wall that induces significant light scattering affecting signal-to-noise ratio and therefore localization precision.
Of the various methods allowing for RNA visualization in cells, including molecular beacons and, more recently, variants of Cas9 and Cas13, not all methods allow for single molecule detection in a living cell under fast imaging regimes [13]. The PP7 and MS2 RNA labeling approaches are currently the most robust method for single molecule resolution mRNA imaging. These aptamer-based approaches use the high affinity and specificity of bacteriophage capsid proteins (CP) to bind to an RNA stem-loop that can be inserted into mRNAs of interest. Fusion of the CP to a fluorescent protein allows for the tagged RNA to be fluorescently marked and multimerizing CP binding sites increases signal-to-noise ratio, with 12–24 repeats being typically used for mRNA labeling and detection in yeast [4, 6, 14–17].
To track mRNP-NPC interactions and export events, NPCs are visualized by the labeling of specific nuclear pore proteins using fluorescent proteins. mRNP export is then measured using a microscope setup that allows simultaneous acquisition of both mRNP and NPC signals using laser illumination and sensitive EMCCD cameras for detection. Because of the spectral shift associated with imaging two channels, measuring the interaction of an mRNP with an NPC, and in particular a subregion of the NPC, requires precise registration of the two imaging channels. This is achieved by a combination of mechanical alignment and image processing using a common signal detected on both cameras [5]. Moreover, mRNP movement must be tracked in each frame using Gaussian fitting with information regarding mRNP movement in prior and subsequent frames used to identify mRNP export events.
In this chapter, we describe a detailed protocol to image mRNP transport with high spatial and temporal resolution by combining the PP7 mRNA labeling strategy with ultrafast image acquisition and image registration allowing the study mRNP export in real time.
2. Materials
2.1. Yeast Strains and Plasmids
Saccharomyces cerevisiae BY4743 with genotype MATa/α his3Δ1/his3Δ1 leu2Δ0/leu2Δ0 LYS2/lys2Δ0 met15Δ0/MET15 ura3Δ0/ura3Δ0 (EUROSCARF).
pDZ417–24xPP7-loxP-KanMX-loxP is used as a template for PCR to generate product to integrate stem loops into target gene (T7 promoter, integrating plasmid) [14].
pSH47 (pRS416-GAL1-Cre) used to express Cre recombinase (GAL1 promoter, URA3 CEN plasmid) [18].
Nuclear pore complex protein tagged using pFA6a-3xmKATE-caURA3 (pKW4019) [19].
GFP-PP7-CP is integrated using pMET25-GFP-PP7-CP plasmid (MET25 promoter, LEU2 integrating plasmid) (pKW3616) [19].
Media and Solutions
20% Dextrose stock solution: Dissolve 200 g of dextrose (d-(+)- glucose) in 800 mL of ultrapure water. Stir to dissolve and then autoclave. Store at room temperature.
YEPD liquid medium (Yeast Extract Peptone Dextrose): Dissolve 10 g of yeast extract and 20 g of peptone to 880 mL of ultrapure water. Stir to dissolve and then autoclave. Allow medium to cool and then add 100 mL of dextrose stock solution. Store at room temperature.
250 mg/ml G418 stock solution: Dissolve 2.5 g of G418 into 10 mL of ultrapure water. Store at −20 °C in 1 mL aliquots.
YEPD + G418 solid medium (Yeast Extract-Peptone-Dextrose with G418): Prepare YEPD medium described above and add 20 g of agar before autoclaving (agar will not dissolve until autoclaved). Allow solution to cool enough to be handled but not solidified (~65 °C), and then add 100 mL of the dextrose stock solution and 1 mL of the G418 stock solution. Pour medium (25 mL) into petri dishes, allow to solidify at room temperature, and then dry for ~3 days (1 L of medium will make ~40 plates). Store at 4 °C.
SC -Ura liquid or solid medium (synthetic complete medium lacking uracil): Dissolve 6.7 g of yeast nitrogenous base (without amino acids, with ammonium sulfate), and -Uracil dropout supplement in 900 mL of ultrapure water. Stir to dissolve and then autoclave. Allow medium to cool and then add 100 mL of dextrose stock solution. Store at room temperature. To make solid medium add 20 g of Agar and prepare as described above for YEPD plates. Store at 4 °C.
20% Galactose stock solution: Dissolve 200 g of D-galactose in 800 mL of ultrapure water. Stir to dissolve and then autoclave. Store at room temperature.
SC - Ura +GAL liquid medium (synthetic complete medium lacking uracil with 2% galactose): Prepare SC-Ura liquid medium as described above, but substitute glucose with a 100 mL of the galactose stock solution.
2 mg/mL Uracil stock solution: Dissolve 1 g of uracil in 500 mL of ultrapure water. Stir to dissolve and then autoclave. Store at room temperature.
SC + 5-FOA solid medium (synthetic complete medium with 5-fluoroorotic acid): Dissolve 6.7 g of yeast nitrogenous base (without amino acids, with ammonium sulfate), and complete dropout supplement in 700 mL of ultrapure water. Stir to dissolve and then add 20 g of agar and autoclave. Allow medium to cool (~65 °C) and then add 100 mL of dextrose stock solution and 200 mL of 5-FOA solution (1 g of 5-FOA dissolved in 5 mL of uracil stock solution and 195 mL of ultrapure water heated to 50 °C before adding the 5-FOA). Pour medium (25 mL) into petri dishes, allow to solidify at room temperature, and then dry for ~3 days (1 L of medium will make ~40 plates). Store at 4 °C.
SC -Leu liquid medium (synthetic complete medium lacking leucine): Dissolve 6.7 g of yeast nitrogenous base (without amino acids, with ammonium sulfate), and -Leucine dropout supplement in 900 mL of ultrapure water. Stir to dissolve and then autoclave. Allow medium to cool and then add 100 mL of dextrose stock solution. Store at room temperature.
Sporulation medium: Dissolve 10 g of potassium acetate and 1 g of yeast extract in 997.5 mL of ultrapure water. Stir to dissolve and autoclave. Allow to cool and then add 2.5 mL of dextrose stock solution. Store at room temperature.
15 g/L Methionine stock solution: Dissolve 15 g of methionine in 1 L of ultrapure water. Stir to dissolve and then filter-sterilize (0.22 μm filter). Store at room temperature.
SC-Leu +Met liquid medium (synthetic complete medium lacking leucine supplemented with methionine): Prepare SC-Leu medium as described above and supplement with 1 mL of methionine stock solution.
SC-Leu +Met + 1.2 M Sorbitol (synthetic complete medium lacking leucine supplemented with methionine and sorbitol): Dissolve 6.7 g of yeast nitrogenous base (without amino acids, with ammonium sulfate), and -Leucine dropout supplement, and 218.6 g of sorbitol to an adjusted volume of 900 mL of ultrapure water. Stir to dissolve and then autoclave. Allow medium to cool and then add 100 mL of dextrose stock solution and 1 mL of methionine stock solution. Store at room temperature.
1 M DTT stock solution: Dissolve 1.5 g of DTT in 10 mL of ultrapure water. Filter to sterilize (0.22 μm filter), and store at −20 °C in 1 mL aliquots.
1 M Tris-HCl buffer pH 9.5 stock solution: Dissolve 121.14 g of Tris base in 800 mL of ultrapure water. Adjust pH to 9.5 with concentrated HCl. Stir to dissolve and adjust volume to 1 L. Autoclave and store at room temperature.
1 M magnesium chloride (MgCl2) stock solution: Dissolve 9.52 g of magnesium chloride in 100 mL of ultrapure water. Filter to sterilize (0.22 μm filter) and store at room temperature.
20 mg/mL zymolyase (20 T) stock solution: dissolve 20 mg of zymolyase in 1 mL of spheroplast buffer (below). Aliquot and store at −20 °C.
Spheroplast buffer (1.2 M sorbitol, 50 mM KPO4 pH 7.4, 1 mM MgCl2, 250 μg/mL zymolyase): Dissolve 218.6 g of sorbitol, 3.03 g of potassium phosphate monobasic (K2HPO4), and 1.035 g of potassium phosphate dibasic (KH2PO4) in an adjusted volume of 999 mL of ultrapure water. Stir to dissolve and add 1 mL of magnesium chloride stock solution. Filter to sterilize (0.22 μm filter) and store at room temperature. Before use for spheroplasting, add zymolyase to a final concentration of 250 μg/mL.
Concanavalin A solution (ConA): Dissolve 10 mg of ConA in 10 mL of a solution of 5 mM manganese chloride, 5 mM calcium chloride, and 5 mM Tris-HCl buffer pH 7 in ultrapure water. Store in 1 mL aliquots at −20 °C.
2.3. Consumables
Toothpicks to inoculate yeast cultures.
Petri dishes for agar plates.
PCR tubes.
35 mm glass bottom plates for imaging.
Focus check beads (e.g., FocalCheck Microspheres or similar).
Diffraction limited multicolor fluorescent beads (e.g., Tetra-Speck Microspheres or similar)
2.4. Equipment
PCR machine.
Micropipettes.
Test tubes for liquid yeast cultures.
Incubators with rotators/shakers for yeast growth.
Autoclave.
Spectrophotometer to measure yeast growth.
Centrifuge.
Tetrad dissection microscope.
3. Methods
Standard yeast growth and transformation methods are followed as described previously [20, 21].
3.1. Tagging of an Endogenous Nuclear Pore Complex (NPC) Component with a Fluorescent Protein
To track mRNPs in relation to NPCs, a protein constituent of the complex must be fluorescently tagged. We do this as the first step in strain construction, since once the strain is verified, the same strain can be used for the subsequent tagging of genes of interest with the PP7 cassette. Yeast PCR-based tagging methods are followed to C-terminally tag the component of interest [22], which is only briefly described below.
Design oligos containing a sequence homologous to the end of the coding region of the target protein (see Note 1).
Use oligos and template plasmid (e.g., pKW4019) to generate a PCR product that can be transformed into the BY4743 yeast strain (see Note 2).
Test resulting transformants by PCR, western blotting, and/or microscopy for proper expression and localization of the tagged protein.
3.2. Tagging of an Endogenous Gene with the 24xPP7 Stem Loop Cassette
A detailed method to tag genes with an aptamer-based RNA-tag has been recently described in detail by Tutucci et al. [23]. Refer to this method for detailed instructions for each step including oligo design, PCR, and transformation conditions (see Note 3).
Amplify the 24xPP7 stem loop cassette from plasmid pDZ617 with oligos each containing 40 base pairs of homologous sequence to the 3′-UTR region of the target gene (see Notes 4–6).
Grow the yeast strain expressing the fluorescent NPC marker overnight, dilute, and grow to mid-log phase. Transform cells with the PCR product, allow cells to recover in liquid medium, and then plate on YEPD plates supplemented with 200 μg/mL G418 to select for transformants.
Select multiple transformants and confirm integration of the PP7 cassette in the correct location of the genome by PCR, as well as continued presence and expression of the NPC marker.
Transform two or more strains with the correct insertion with plasmid pSH47 and select for transformants on synthetic medium lacking uracil (SC-Ura) plates. Multiple transformants should then be grown overnight in SC-Ura supplemented with 2% galactose to allow for expression of Cre recombinase. Cells are then plated for single colonies on YEPD and tested for growth on G418 to identify colonies that do not grow on G418 due to excision of the selectable marker from the 3′-UTR region of the target gene. Loss of the pSH47 plasmid can be selected by growing cells on medium containing 5-FOA.
Genomic DNA PCR can be used to confirm both the genomic location of the loops, as well as the size of the 24xPP7 cassette to ensure the cassette is full length. At this step, also confirm the presence and expression of the NPC marker once again.
To generate a haploid strain expressing both the mRNA with PP7 stem loops and the NPC marker, sporulate the diploid heterozygous strain by growing cells for ~5 days (or until tetrads are formed) in 5 mL of sporulation medium.
To dissect and isolate tetrads follow the protocol previously described by Amberg et al. [24]. If insertion of the PP7 loops, tagging of the NPC component, or the combination of the two impact fitness of the cell, this is often observed here through a reduction is spore viability and/or slow growth of the haploids containing the cassette and NPC marker.
Analyze resulting haploid strains for presence of both the 24xPP7 tagged gene and fluorescently tagged NPC component to isolate haploids of each mating type. These two strains can subsequently be mated to generate a diploid strain homozygous for both the 24xPP7 cassette and NPC marker (see Note 7).
Analyze resulting 24xPP7 and NPC tagged strains to confirm functionality of the tagged mRNA and Nup protein (see Note 8).
3.3. Expression of the PP7 Coat Protein
Digest ~1 μg of the pMET-GFP-PP7-CP containing plasmid, transform into the verified haploid or homozygous diploid strains carrying the 24xPP7 cassette and NPC marker, and select for transformants on SC-Leu (see Notes 2 and 9).
Test multiple transformants for CP expression and the presence of fluorescently marked mRNPs using a fluorescence microscope under careful growth conditions in liquid culture using SC-Leu supplemented with 150 mg/liter of methionine (Met) and grown until early-log phase (O.D600 of 0.1–0.3) at 25 °C. Single mRNP particles are often visible as is a general diffuse cell fluorescence from the free PP7-CP (Fig. la and Notes 10 and 11).
Fig. 1.
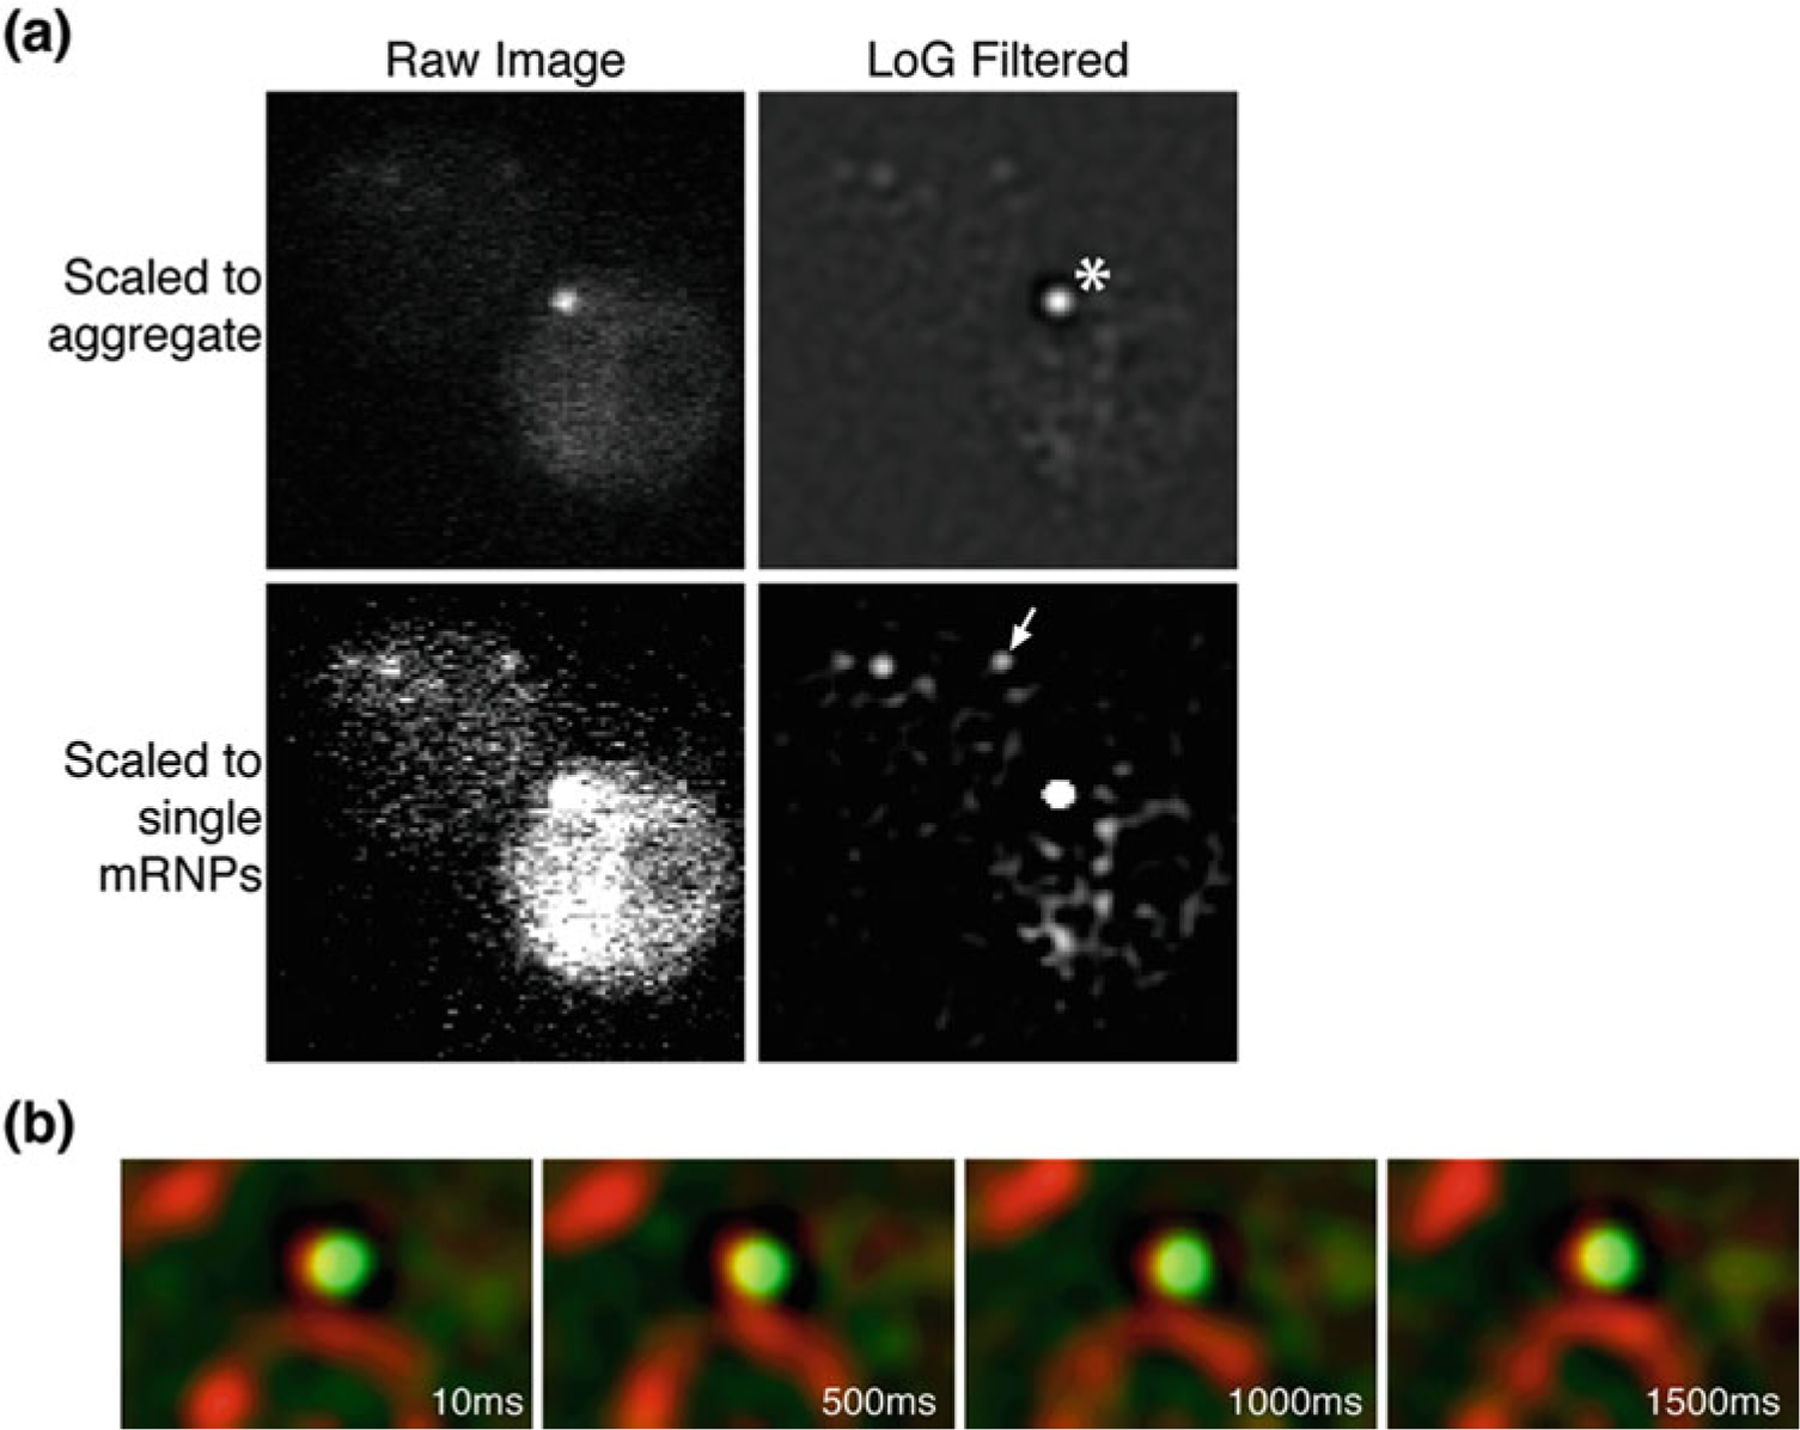
(a) Fluorescent images showing a cell in which PP7-CP has formed a bright aggregate. Raw and Laplacian filtered images are shown, each scaled to show the presence of the aggregate (asterisk) and single mRNP (arrow). Scaling to observe single mRNPs leads to difficulty in tracking single due to the presence of a bright foci. (b) Merged and registered images showing the bright PP7-CP aggregate in panel (a) persists in the same location through the imaging series, whereas single mRNPs are usually dynamic. Green channel = CP, red channel = nuclear pore complexes (NPCs)
3.4. Growth and Preparation of Budding Yeast Cells for Imaging and Data Collection
The protocol below uses spheroplasting to remove the yeast cell wall for the purpose of reducing light scatter, which improves signal-to-noise ratios for imaging rapid events (e.g., mRNP export). This may not be required for events that are longer lived (see Note 12). The protocol below can be shortened by omitting steps 2–4, which will not require sorbitol to be added to the medium in steps 7 and 8.
Grow cells overnight at 25 °C in SC-Leu+Met, being careful to not allow the cultures to reach saturation by the following morning. Dilute the culture into fresh SC-Leu+Met medium to an O.D600 of 0.05 and grow at 26 °C for at least three doublings to ~O.D600 of 0.4.
Collect 2.0 O.Ds of cells by centrifugation, wash one time with water, and resuspend in 50 mM Tris-HCl, pH 9.5 and 10 mM DTT at room temperature for 15 min.
Collect cells again by centrifugation and resuspend in 0.3 mL of spheroplast buffer and incubate at 26 °C for 45 min, while rotating.
Collect cells by centrifuging at 500 g for 2 min and gently resuspending the cells with 1 mL of synthetic complete medium supplemented with 1.2 M sorbitol.
During steps 2–4, coat the glass surface of a 35 mm glass bottom dish (MatTek or similar) with ~0.25 mL of the Concanavalin A solution for 5 min and then remove by pipetting and allow to dry.
Add 1 mL of spheroplasted cells to the ConA-coated plate and slowly move the plate to coat the glass bottom with the liquid. Allow cells to adhere to the glass surface for ~5 min, or in a swinging bucket centrifuge, spin the plate at 500 g for 2 min to adhere the cells to the glass bottom. This requires that the plate and lid be secured to the rotor. We use tape for this, being careful to prevent the dish glass imaging surface from coming in contact with the tape adhesive.
Remove unadhered cells by removing the culture liquid in the plate and gently washing the adhered cells and plate with 1 mL of fresh medium with sorbitol.
Add 2 mL of fresh SC +sorbitol and incubate the plates in the microscope room for ~30 min to allow the cells to recover from stresses induced by spheroplasting and plating (see Note 13).
3.5. Live-Cell Two-Color Imaging Setup and Data Acquisition
For imaging mRNP export events a custom microscope has been used, as described below. Commercial single and dual color imaging systems may also be used to collect data detailing NPC-mRNP interactions on different time scales depending on the instrument (Fig. 2).
Fig. 2.
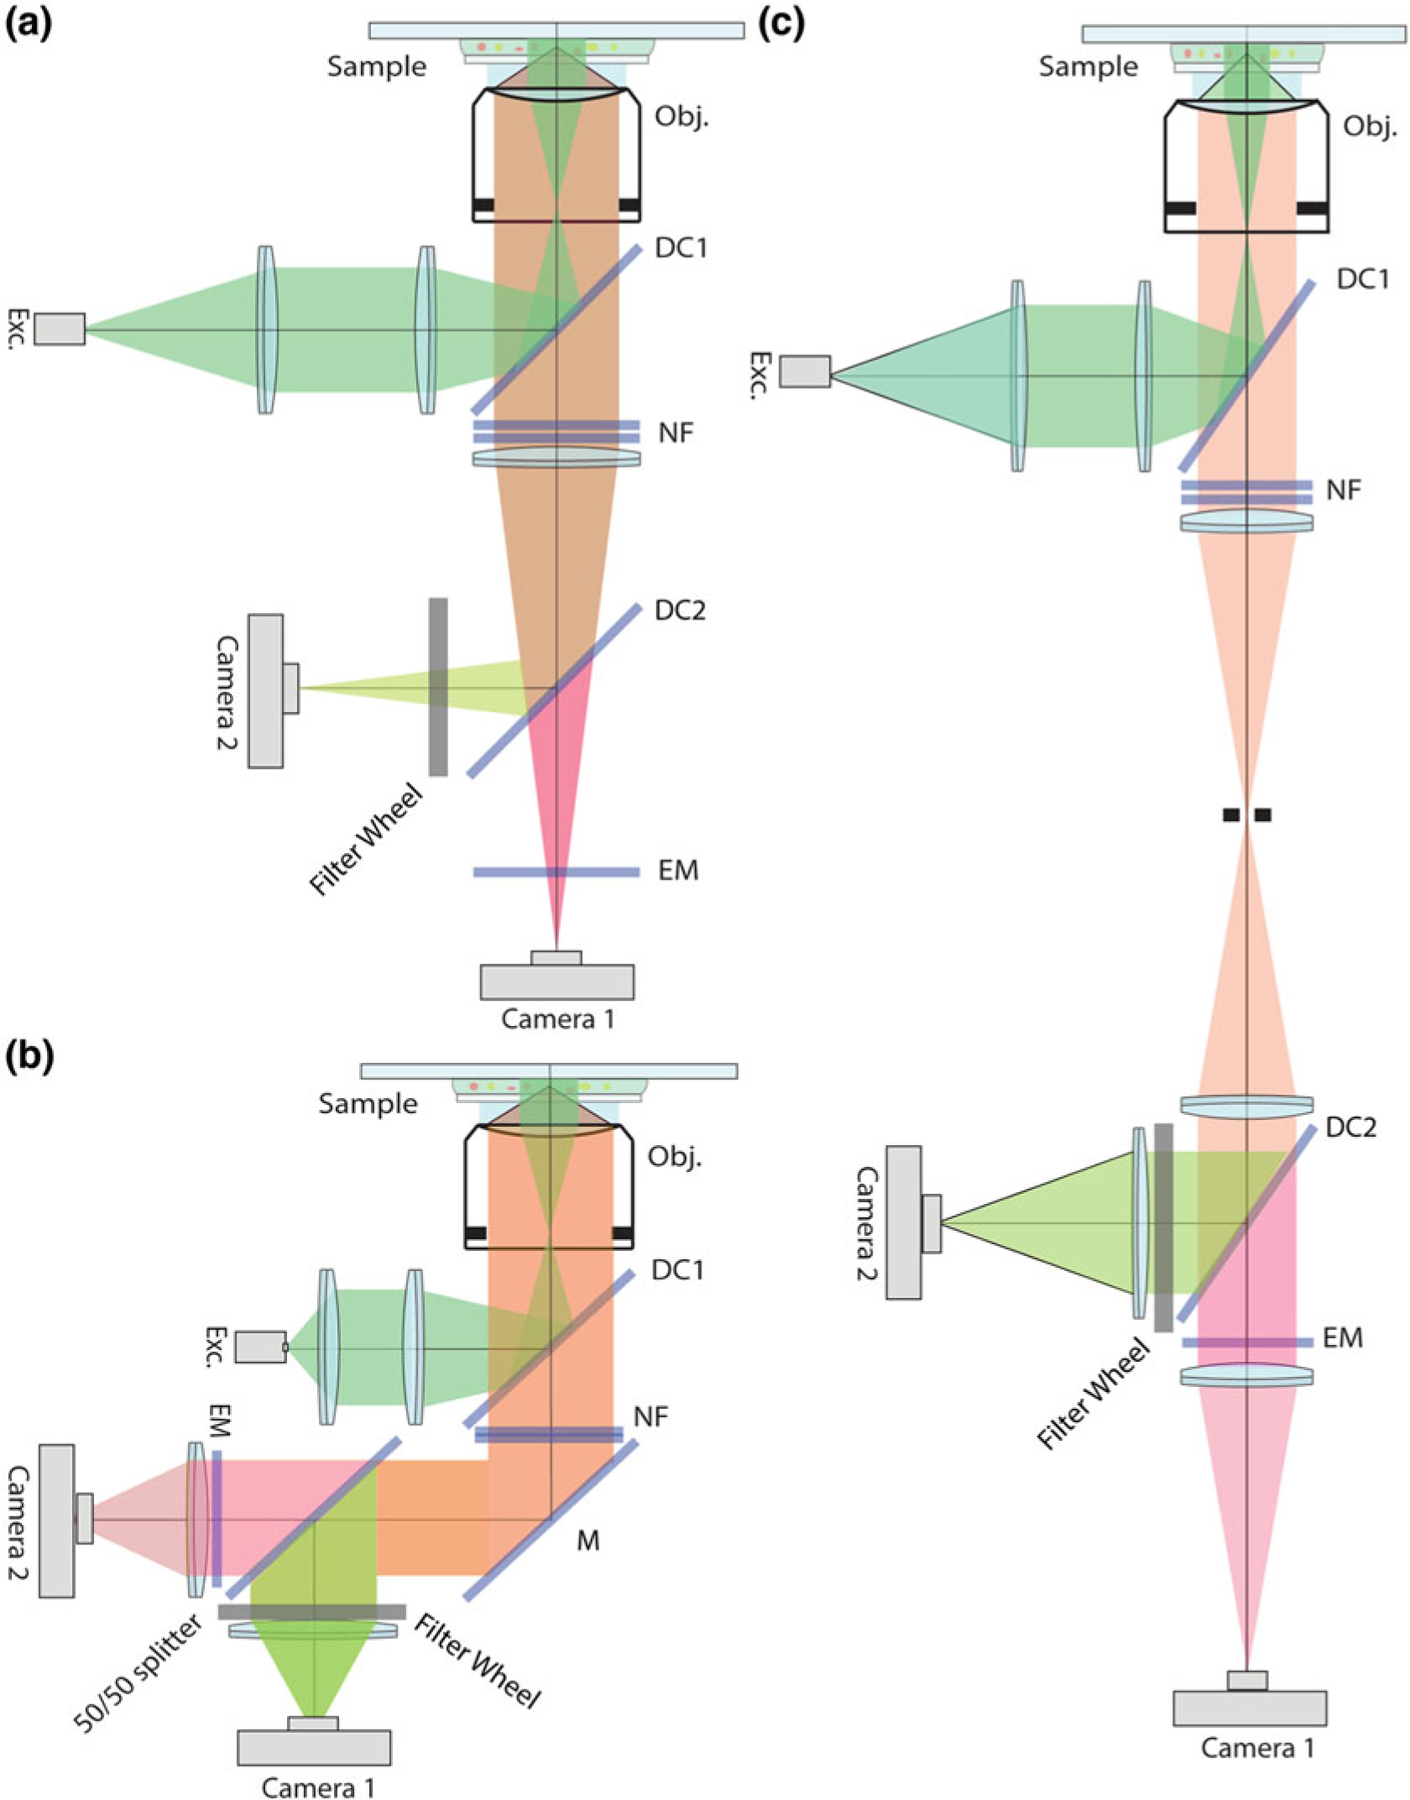
Optical design of the custom-built microscope. (a) Optical setup described previously in Grunwald et al. [5]. (b) Optical setup described here for data acquisition and described previously by Smith et al. [6]. (c) Optical setup to use as an adapter for imaging with commercial microscopes
Imaging is performed on a custom-built dual channel microscope setup using a ×60 1.3 NA silicone oil immersion objective (refractive index 1.405; Olympus) (see Note 14). The objective is combined with 500-mm focal length tube lenses, resulting in an effective x167 magnification and a back projected pixel size of 95.8-nm on sample plane. The primary emission beam path is split onto two electron-multiplying charge-coupled devices (DU897 BI; iXon; Andor Technology) by a dichroic mirror (z543rdc Chroma). For excitation of fluorescent proteins, solid-state 514-nm and 561-nm laser lines (SE; Cobolt) are used and intensity and on/off are controlled by an acoustooptic tunable filter (AA Opto-Electronics). Laser lines are merged into a mono mode optical fiber (Qioptiq). The output of the fiber is collimated and delivered through the back port of a stand (IX71) and reflected toward the objective by a dichroic mirror (z514–561-1064rpc, Chroma). Alignment onto the optical axis of the objective is achieved with a 4-axis controlled support for the collimator. An adjustable size iris is used to restrict the illumination to an area of approximately 25-μm in diameter. The intensity profile in this area has a flatness of about 5%. Each laser is utilized with a shutter (Uniblitz) controlled from the imaging software. To allow reasonably fast switching (100-ms) between high and low power settings with the 561-nm line, a motorized filter wheel with appropriate neutral density filters is placed behind the shutter and before the merging dichroic of the laser module. The notch filters 514.5-nm and 568-nm (Semrock) are used to prevent excitation light from entering the emission path. The latter filter is rotated by 17 degrees with respect to the normal to achieve blocking 561-nm scattered light (see Note 15). Mirrors and adjustable custom built camera holders are used to impose control on five degrees of freedom (x, y, z, ϕ-and θ-angle) and prealign both CCDs. CCDs are synchronized by a start signal generated by one CCD that is directly delivered to the second CCD. The offset between the two CCDs was determined to be three orders of magnitude below the integration time (2.1 ± 0.2 ns/frame/ms). The microscope is equipped with a heated stage inset (Warner Scientific) and an objective heater (Bioptechs) (see Note 16).
After initial coarse alignment, use fluorescent focus check beads and diffraction limited multicolor beads for fine mechanical alignment. To do the fine mechanical alignment, image fluorescent beads on both cameras in both channels to compare alignment. Adjust positions by changing the x,y,z of the camera holders so that beads have the same location on both cameras. To check the tilt of the camera plane, prepare a bead sample of uniform distribution that is not saturated and check the focus at center vs. the edges for each camera separately. If you see a difference, change the ϕ-and θ-angles on the camera holders accordingly.
Find cells for imaging taking care to limit bleaching. First, use transmitted light and the whole camera field of view to position 1–3 cells in the active imaging area focused on what is judged to be the middle of the cell(s). Use the reddest channel in the experiment to set the focus for the equatorial plane, as described here this is the NPC marker channel. Images need to be recorded in the equatorial plane of the yeast nucleus to minimize false-positive detection of mRNAs that diffuse above or below the nucleus. Using maximal signal amplification (for EMCCDs) and the lowest possible laser power setting that produces a very noisy live image, adjust focus to image the equatorial plane of the cell nucleus. Start automated imaging protocol for registration image and tracking data (step #4).
Perform simultaneous imaging on two channels using sub-frames (approximately two-fifths of each camera chip, e.g., 200 × 200 pixel) on both cameras at a frame rate of 67 Hz, equaling a time resolution of 15-ms. For each cell, acquire four datasets, two in each color. First, record a registration image for 375-ms, save, and 500-ms later, record the tracking dataset for 7.5 s (500 frames) in parallel for both channels. Time values refer to published work and may need to be adjusted for new experiments and the imaging system used; hence, the given values present a starting point for optimization. Imaging sub-frames is critical for data collection at fast rates, allows for cells to be selected that are present in the same imaging plane, and acquired images can be rapidly screened during data collection to determine if the dataset should be saved for analysis or discarded due to signal quality or lack of signal (i.e., cells in which no mRNAs are expressed). Finally, a small imaging area also makes it easier to fulfill the 5% intensity flatness criteria (step #1 above).
3.6. Super-Registration and Colocalization Precision
All image processing and visual analysis is done using FIJI or ImageJ [25, 26]. Custom Plugins for registration and particle tracking are available upon request.
Superregistration is achieved by a combination of precise mechanical alignment and image processing using transformations based on the registration signal that is detected on both cameras (Fig. 3a) (see Note 17).
In the registration images, make the NPC signal visible in both channels by using x10 more excitation power from the 561-nm laser than for the tracking videos. Using the sensitivity of the EM CCD cameras and the surface reflection of the dichroic, the NPC signal will be visible in both the mRNP (one image taken for 375 ms) and the NPC channel (25 images taken in 375 ms, and the mean time projected for analysis). Fine register the mRNP and NPC channels postexperimentally by shifting the NPC channel registration image onto the mRNA channel registration image to calculate the parameters to be used for registration of the tracking videos [27]. To make this alignment more robust, filter the mRNP channel with a Gaussian kernel (1.5 pixel width) before registration. Save RGB images of the two registration images before and after registration and evaluate if the correlation factor of the linear shift is better than 0.95 (see Note 18).
Determine registration precision by calculating the remaining offset between the imaging data from the two cameras after linear translation (see Note 19).
Create two copies of each tracking video (NPC and mRNP channel); one is the raw data for quantitative image analysis and the other is enhanced for visual inspection (see Note 20).
Test each dataset for drift during acquisition by generating 10 mean projections of 50 frames of the NPC signal that are normalized and fused into a color-coded hyperstack. If the color separation in the resulting stack indicates drift, these datasets should be discarded.
Fig. 3.
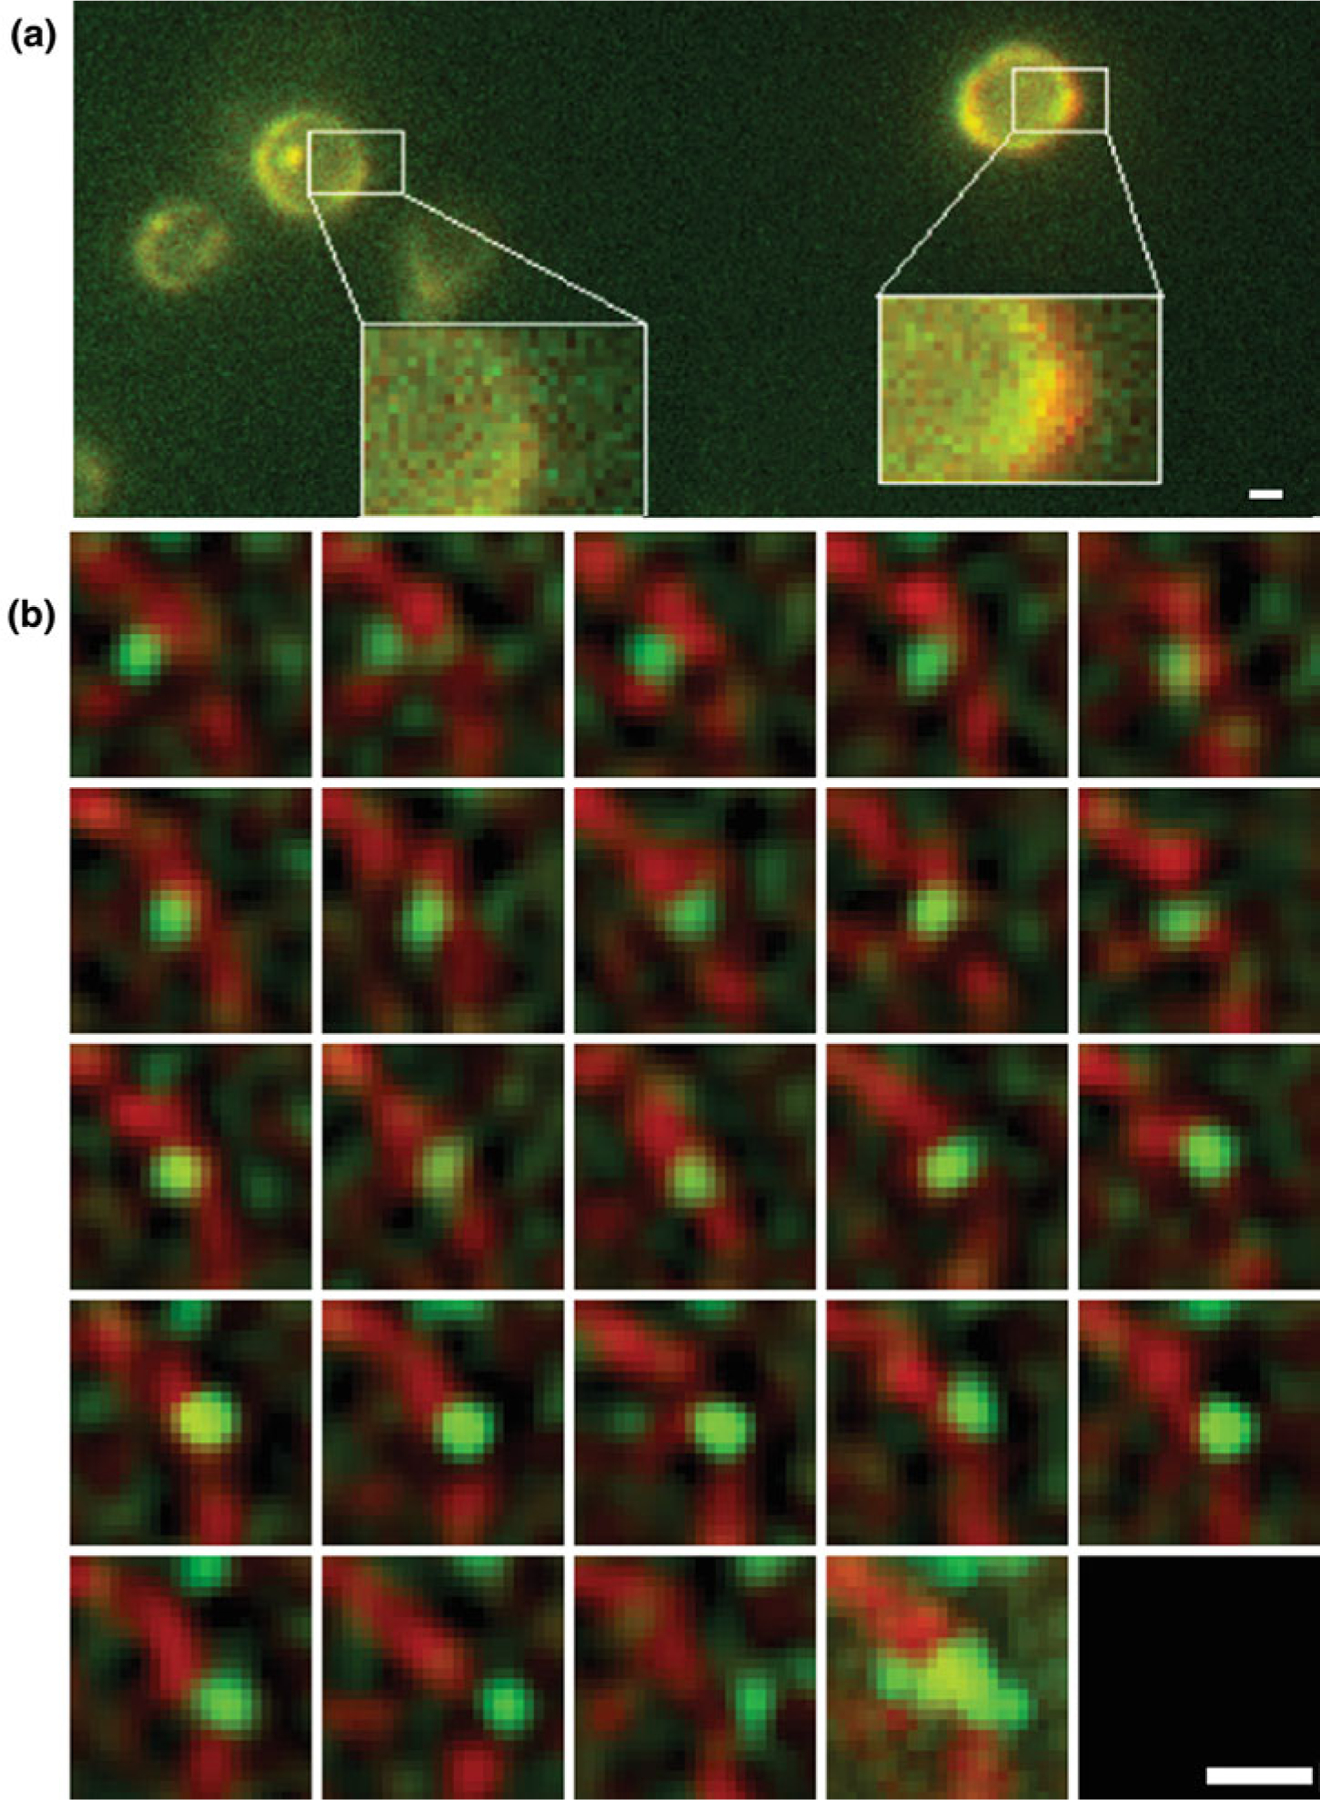
(a) Example of the color overlay used for registration. Using an RGB scheme, images before and after registration are overlaid to visualize the shift in nuclear envelope position in each cell. This method aids in quantification of whether the correlation factor for the linear shift is higher than the set threshold for 0.95 or not. The red pixels shown help to visualize the shift. (b) Example of an mRNP export event through selected frames of a tracking dataset. Second to last square shows all frames merged. Green = CP and red = nuclear pore complexes (NPCs). Scale bars = 1 μm
3.7. Tracking mRNPs and Analyzing mRNP–NPC Interactions
Data analysis is performed using a custom manual-tracking interface within FIJI, in which the filtered and raw data are presented simultaneously and a particle of interest is tracked by consecutively clicking through image frames. The maximal displacement from frame to frame is displayed in the tracking channel to identify situations where two particles can be interchanged. In such cases, tracking is stopped.
Identify mRNP signals visually in either the filtered or raw images. To do a 2D Gaussian fit, find the center of mass within 5 pixels around the signal and click the position to identify the coordinate for the fit. All fits should be done in the raw data, with all fit parameters and initiation parameters reported to the user for inspection [5].
To enhance images for visual inspection, use a running mean and a subtraction of a Laplacian filter for the NPC marker channel and a Laplacian filter for the mRNP channel. The kernel size should be set relative to the theoretical width of the emission point spread function, adjust the contrast in the final RGB videos after processing. After filtering, apply the transition matrix to the NPC marker channel to overlay it onto the mRNP channel.
During manual tracking, assign a descriptive state to the particle in each frame based on the distance from the NE using the following guidelines: nuclear diffusive or cytoplasmic diffusive if the distance is >250 nm, nuclear docked or cytoplasmic docked if the distance is between 250 and 100 nm, and transition if the distance is <100 nm. The dynamic behavior of the particle (i.e., the direction and distance the particle moved with respect to the NE) in prior and subsequent frames should also be used to inform state decisions (Fig. 3b).
Using these descriptors, perform an analysis in MATLAB (MathWorks) using routines to search for specific events (e.g., export or scanning) based on these five states [6] (see Note21).
Estimate dwell times using two methods; the dwell time fit based on the histogram (exponential distribution) and an MLE based on the assumption that the data follow an exponential distribution [28, 29] (see Note 22).
4. Notes
When choosing a nuclear pore complex component to tag with a fluorescent protein, it is important to consider both the stability and localization of the protein within the NPC. For example, some Nups are dynamic and known to localize to other structures within the cell, which may complicate analysis. Currently, we use Ndc1 and Nup188. Additionally, not every NPC component can be tagged without impacting function, which should be considered when choosing a Nup to tag. We have observed that tagging of Nup49, previously used in various studies as an NPC marker, shows a weak poly(A)-RNA accumulation phenotype and should therefore be avoided as an NPC marker (unpublished observations).
For high single-to-noise ratio, fluorophore choice should be optimized or chosen carefully. Ideally fluorophores with improved brightness and photostability should be used. Examples of enhanced fluorescent proteins include the far-red variant mKATE or GFP variants such as mNeonGreen [30, 31]. Fluorescent tagging of more than one NPC component may also result in brighter signals; however, some combinations of double tagged Nups are known to result in NPC dysfunction, and it is important to test various combinations for fitness defects [32]. Currently, dye-based labeling systems are less suited for this application (e.g., Spinach & Mango) due to the inability to fuse multiple dye binding aptamers and achieve signals that are bright enough to allow robust single mRNP detection.
Tutucci et al. have outlined a method for detection of mRNAs using a reengineered MS2 aptamer-based RNA tagging system [23]. Here, we use a stem loop tagging system derived from the Pseudomonas phage PP7, however the same methods described by Tutucci et al. can be followed to generate PP7 stem loop tagged strains. Furthermore, a shorter version of the PP7 repeat cassette containing 12 copies has been used successfully to track single mRNPs [4].
Integration of the stem loops into the 3′-UTRis preferred over the 5′-UTRregion of the target gene as it is less likely to impact expression of the gene (insertion into the 5′-UTR can affect mRNA translation and mRNA stability). In the 3’-UTR, stem loops can be inserted just after the stop codon with the endogenous terminator sequence or an exogenous terminator sequence can be used.
In order to allow single mRNP tracking in living cells, the target mRNA must be expressed at a low copy number (less than 20 transcripts per cell), as this will minimize issues related to differentiating signals from multiple mRNPs from frame to frame. Inducible reporter systems (e.g., GAL1 promoter) can also be utilized to control expression of the target mRNA, but single mRNP tracking will only be possible at early stages of induction, as transcript levels will increase rapidly and spatial separation of individual mRNPs becomes challenging [33].
Amplification of the repetitive stem loop sequence by PCR can be more difficult when compared to other templates. Tutucci et al. outline a method using Taq DNA polymerase for MS2 stem loop amplification [23]. We have had success using a high-fidelity DNA polymerase such as Phusion (New England Biolabs).
Diploid strains are preferred due to the larger size of the cell nucleus, but this does require generation of homozygous diploid strains by isolating both haploid mating types and mating the strains.
Addition of the 24xPP7 cassette will disrupt the 3′-UTR and add a significant amount of sequence to the mRNA transcript, which may impact expression, stability, and functionality. Therefore, we target essential genes, as nonfunctional transcripts will result in lethality that will be observed during tetrad dissection. Growth of the tagged strain should also be compared to the parental strain under multiple conditions to verify that there are no growth defects as a result of the addition of the PP7 stem loops when combined with the fluorescent NPC marker. Additionally, single-molecule FISH (smFISH), RT-qPCR, and/or northern blotting experiments should be used to determine expression level and proper decay of the modified mRNA, especially due to the fact that the 24xPP7 cassette can alter mRNA decay or accumulate in cells as partial decay products, [23, 34–36].
Integration of the PP7-CP coding sequence into the yeast genome is not required and PP7-CP can be expressed on a CEN plasmid instead [6, 23, 33]. However, integration of the PP7-CP cassette provides homogenous expression of the protein and less frequent aggregation of the CP. Aggregation of the CP is a common issue that causes formation of bright foci that will preclude imaging and tracking of single mRNA particles (Fig. 1a, b).
Expression of the PP7-CP is driven by the MET25 promoter, which is expressed under conditions of low available methionine. Leaky expression from this promoter is sufficient to produce enough PP7-CP required for live-cell imaging in medium containing methionine; therefore, the strain is grown in synthetic medium supplemented with methionine. Conditions with low amounts or no methionine result in high expression of the PP7-CP, which can produce CP aggregates and a high background that masks signals from individual mRNP particles. Constitutive low expression by using an ADE3 promoter has also been shown to allow robust single mRNA detection [4].
It is important to keep cells in exponential growth phase and to not allow cells to reach saturation phase of growth (O. D600 > 1) in liquid media, as this is accompanied by an increase in PP7-CP expression/aggregation and yeast autofluorescence (Fig. 1a, b).
Spheroplasting to remove the yeast cell wall decreases light scatter and significantly increases the signal-to-noise ratio of the tagged Nup and mRNA fluorescent signals [6]. However, be careful when handling the cells after digestion. DO NOT VORTEX or pipette the cells too vigorously at or beyond this point. The cells are fragile and susceptible to lysis.
After removal of the cell wall and recovery of the cells in fresh medium supplemented with sorbitol, there are ~30–60 min for imaging before the cell regrows enough of the cell wall to begin to significantly scatter light and decrease signal-to-noise ratios.
Use of a 1.3 NA objective enables imaging of ~60% of the yeast nuclear volume within a single focal plane. This allows for tracking of mRNPs for an increased number of frames.
A dedicated 561 nm NOTCH filter is commercially available from several sources.
Any heating system that fits the microscope will be suitable for this imaging setup.
Two-color colocalization by wide-field microscopy lacks the resolution to determine whether two molecules are close enough to be in physical contact or simply nearby by chance due to chromatic aberrations in the objective lens. A robust methodology can be used to generate an internal registration signal from each cell imaged that can be used to register spectrally different channels relative to each other to achieve spatial precision below the optical resolution limit. This methodology, superregistration, can be used to correct for chromatic aberration in the objective lens across the entire image field to within 10 nm, which is capable of determining whether two molecules are physically close enough to interact or not [5].
Registration can fail because of aberrations caused by heterogeneity in spheroplasting. We have found the failure rate to occur at a frequency of ~50%. In successful cases the resulting registration precision is determined to be 0.14 pixel.
To determine registration precision, NPC positions from both imaging channels must be fitted. To do this, apply a linear transformation matrix to match the NPC positions on the mRNP channel with the NPC channel [27]. We use a linear translation since we need to match the features only in 2D and on the XY plane. The transformation is needed since the quality of the registration data does not reach the level of individual nuclear pores [5]. The SD using this method is in the order of the mean.
Always display raw data images next to the enhanced images during visual analysis when tracking, and double check all traces of interest in the raw dataset to prevent a false-positive identification of an event as a result of image processing.
This classification can be made because the localization precision of single molecules follows a Gaussian distribution described by θ − Λθ ~ N(0, C(θ)), where θ = (x, y, I, bg), Λθ is the corresponding MLE, and C(θ) is CRLB [37].
Due to imaging in a single focal plane, the number of mRNP-NPC interactions that will be observed is greatly reduced. Therefore, two methods are used to estimate mRNP dwell times.
Acknowledgments
We would like to acknowledge the laboratories of Drs. Robert Singer and Karsten Weis for reagents and support of previous works related to the methods described here. A.L. was supported by a Natural Sciences and Engineering Research Council Canada Graduate Scholarship; D.Z. is supported by the Canadian Institutes of Health (Project Grant-366682), Fonds de recherche du Québec—Santé (Chercheur-boursier Junior 2), Canada Foundation for Innovation, and the Natural Sciences and Engineering Research Council; D.G. by a National Institute of General Medical Sciences award (5R01GM123541); B.M. and D.G. by a National Institute of General Medical Sciences award (5R01GM124120). The content is solely the responsibility of the authors and does not necessarily represent the official views of the National Institutes of Health.
References
- 1.Kim SJ, Fernandez-Martinez J, Nudelman I et al. (2018) Integrative structure and functional anatomy of a nuclear pore complex. Nature 555:475. [DOI] [PMC free article] [PubMed] [Google Scholar]
- 2.Folkmann A, Noble K, Cole C (2011) Dbp5, Gle1-IP6, and Nup159: a working model for mRNP export. Nucleus 2(6):540–548 [DOI] [PMC free article] [PubMed] [Google Scholar]
- 3.Green DM, Johnson CP, Hagan H, Corbett AH (2003) The C-terminal domain of myosin-like protein 1 (Mlp1p) is a docking site for heterogeneous nuclear ribonucleoproteins that are required for mRNA export. Proc Natl Acad Sci U S A 100:1010–1015. 10.1073/pnas.0336594100 [DOI] [PMC free article] [PubMed] [Google Scholar]
- 4.Saroufim M-A, Bensidoun P, Raymond P et al. (2015) The nuclear basket mediates perinuclear mRNA scanning in budding yeast. J Cell Biol 211:1131–1140. 10.1083/jcb.201503070 [DOI] [PMC free article] [PubMed] [Google Scholar]
- 5.Grünwald D, Singer RH (2010) In vivo imaging of labelled endogenous β-actin mRNA during nucleocytoplasmic transport. Nature 467:604–607. 10.1038/nature09438 [DOI] [PMC free article] [PubMed] [Google Scholar]
- 6.Smith C, Lari A, Derrer CP et al. (2015) In vivo single-particle imaging of nuclear mRNA export in budding yeast demonstrates an essential role for Mex67p. J Cell Biol 211:1121–1130. 10.1083/jcb.201503135 [DOI] [PMC free article] [PubMed] [Google Scholar]
- 7.Siebrasse JP, Kaminski T, Kubitscheck U (2012) Nuclear export of single native mRNA molecules observed by light sheet fluorescence microscopy. Proc Natl Acad Sci U S A 109:9426–9431. 10.1073/pnas.1201781109 [DOI] [PMC free article] [PubMed] [Google Scholar]
- 8.Mor A, Suliman S, Ben-Yishay R et al. (2010) Dynamics of single mRNP nucleocytoplasmic transport and export through the nuclear pore in living cells. Nat Cell Biol 12:543–552. 10.1038/ncb2056 [DOI] [PubMed] [Google Scholar]
- 9.Niño CA, Hérissant L, Babour A, Dargemont C (2013) mRNA nuclear export in yeast. Chem Rev 113:8523–8545. 10.1021/cr400002g [DOI] [PubMed] [Google Scholar]
- 10.Floch AG, Palancade B, Doye V (2014) Fifty years of nuclear pores and nucleocytoplasmic transport studies: multiple tools revealing complex rules. Methods Cell Biol 122C:1–40. 10.1016/B978-0-12-417160-2.00001-1 [DOI] [PubMed] [Google Scholar]
- 11.Oeffinger M, Zenklusen D (2012) To the pore and through the pore: a story of mRNA export kinetics. Biochim Biophys Acta 1819:494–506. 10.1016/j.bbagrm.2012.02.011 [DOI] [PMC free article] [PubMed] [Google Scholar]
- 12.Heinrich S, Derrer CP, Lari A et al. (2017) Temporal and spatial regulation of mRNA export: single particle RNA-imaging provides new tools and insights. BioEssays 39 10.1002/bies.201600124 [DOI] [PMC free article] [PubMed] [Google Scholar]
- 13.Pichon X, Lagha M, Mueller F, Bertrand E (2018) A growing toolbox to image gene expression in single cells: sensitive approaches for demanding challenges. Mol Cell 71:468–480. 10.1016/J.MOLCEL.2018.07.022 [DOI] [PubMed] [Google Scholar]
- 14.Hocine S, Raymond P, Zenklusen D et al. (2013) Single-molecule analysis of gene expression using two-color RNA labeling in live yeast. Nat Methods 10:119–121. 10.1038/nmeth.2305 [DOI] [PMC free article] [PubMed] [Google Scholar]
- 15.Bertrand E, Chartrand P, Schaefer M et al. (1998) Localization of AsH1 mRNA particles in living yeast. Mol Cell 2:437–445. 10.1016/S1097-2765(00)80143-4 [DOI] [PubMed] [Google Scholar]
- 16.Larson DR, Zenklusen D, Wu B et al. (2011) Real-time observation of transcription initiation and elongation on an endogenous yeast gene. Science 332:475–478. 10.1126/science.1202142 [DOI] [PMC free article] [PubMed] [Google Scholar]
- 17.Tutucci E, Vera M, Biswas J et al. (2018) An improved MS2 system for accurate reporting of the mRNA life cycle. Nat Methods 15:81–89. 10.1038/nmeth.4502 [DOI] [PMC free article] [PubMed] [Google Scholar]
- 18.Güldener U, Heck S, Fielder T et al. (1996) A new efficient gene disruption cassette for repeated use in budding yeast. Nucleic Acids Res 24:2519–2524 [DOI] [PMC free article] [PubMed] [Google Scholar]
- 19.Chan LY, Mugler CF, Heinrich S et al. (2018) Non-invasive measurement of mRNA decay reveals translation initiation as the major determinant of mRNA stability. elife 7 10.7554/eLife.32536 [DOI] [PMC free article] [PubMed] [Google Scholar]
- 20.Sherman BF, Sherman MF, Enzymol M (2003) Getting started with yeast. Contents 41:3–41 [Google Scholar]
- 21.Gietz RD, Woods RA (2002) Transformation of yeast by lithium acetate/single-stranded carrier DNA/polyethylene glycol method. Methods Enzymol 350:87–96. 10.1016/S0076-6879(02)50957-5 [DOI] [PubMed] [Google Scholar]
- 22.Longtine MS, McKenzie A 3rd, Demarini DJ et al. (1998) Additional modules for versatile and economical PCR-based gene deletion and modification in Saccharomyces cerevisiae. Yeast 14:953–961. [DOI] [PubMed] [Google Scholar]
- 23.Tutucci E, Vera M, Singer RH (2018) Single-mRNA detection in living S. cerevisiae using a re-engineered MS2 system. Nat Protoc 13:2268–2296. 10.1038/s41596-018-0037-2 [DOI] [PubMed] [Google Scholar]
- 24.Amberg DC, Burke DJ, Strathern JN (2006) Tetrad dissection. Cold Spring Harb Protoc 2006:pdb.prot4181 10.1101/pdb.prot4181 [DOI] [PubMed] [Google Scholar]
- 25.Schindelin J, Arganda-Carreras I, Frise E et al. (2012) Fiji: an open-source platform for biological-image analysis. Nat Methods 9:676–682. 10.1038/nmeth.2019 [DOI] [PMC free article] [PubMed] [Google Scholar]
- 26.Schneider CA, Rasband WS, Eliceiri KW (2012) NIH Image to ImageJ: 25 years of image analysis. Nat Methods 9:671–675 [DOI] [PMC free article] [PubMed] [Google Scholar]
- 27.Preibisch S, Saalfeld S, Tomancak P (2009) Globally optimal stitching of tiled 3D microscopic image acquisitions. Bioinformatics 25:1463–1465. 10.1093/bioinformatics/btp184 [DOI] [PMC free article] [PubMed] [Google Scholar]
- 28.Colquhoun D, Hawkes AG (1982) On the stochastic properties of bursts of single ion channel openings and of clusters of bursts. Philos Trans R Soc Lond Ser B Biol Sci 300:1–59 [DOI] [PubMed] [Google Scholar]
- 29.Kubitscheck U, Grünwald D, Hoekstra A et al. (2005) Nuclear transport of single molecules. J Cell biol 168:233–243. 10.1083/jcb.200411005 [DOI] [PMC free article] [PubMed] [Google Scholar]
- 30.Shaner NC, Lambert GG, Chammas A et al. (2013) A bright monomeric green fluorescent protein derived from Branchiostoma lanceolatum. Nat Methods 10:407. [DOI] [PMC free article] [PubMed] [Google Scholar]
- 31.Shcherbo D, Merzlyak EM, Chepurnykh TV et al. (2007) Bright far-red fluorescent protein for whole-body imaging. Nat Methods 4:741. [DOI] [PubMed] [Google Scholar]
- 32.Ryan KJ, McCaffery JM, Wente SR(2003) The Ran GTPase cycle is required for yeast nuclear pore complex assembly. J Cell Biol 160:1041–1053. 10.1083/jcb.200209116 [DOI] [PMC free article] [PubMed] [Google Scholar]
- 33.Bensidoun P, Raymond P, Oeffinger M, Zenklusen D (2016) Imaging single mRNAs to study dynamics of mRNA export in the yeast Saccharomyces cerevisiae. Methods 98:104–114. 10.1016/j.ymeth.2016.01.006 [DOI] [PubMed] [Google Scholar]
- 34.Trcek T, Rahman S, Zenklusen D (2018) Measuring mRNA decay in budding yeast using single molecule FISH. Methods Mol Biol 1720:35–54. 10.1007/978-1-4939-7540-2_4 [DOI] [PMC free article] [PubMed] [Google Scholar]
- 35.Garcia JF, Parker R (2015) MS2 coat proteins bound to yeast mRNAs block 5′ to 3′ degradation and trap mRNA decay products: implications for the localization of mRNAs by MS2-MCP system. RNA 21:1393–1395. 10.1261/rna.051797.115 [DOI] [PMC free article] [PubMed] [Google Scholar]
- 36.Heinrich S, Sidler CL, Azzalin CM, Weis K (2017) Stem-loop RNA labeling can affect nuclear and cytoplasmic mRNA processing. RNA 23:134–141. 10.1261/rna.057786.116 [DOI] [PMC free article] [PubMed] [Google Scholar]
- 37.Sengupta SK, Kay SM (1995) Fundamentals of statistical signal processing: estimation theory. Technometrics 37:465 10.2307/1269750 [DOI] [Google Scholar]