Abstract
Flavonoids are key components of licorice plant that directly affect its medicinal quality. Importantly, the MYB family of transcription factors serves to regulate the synthesis of flavonoids in plants. The MYB transcription factors represent one of the largest families of transcription factors in plants and play important roles in the process of plant growth and development. MYB gene expression is induced by a number of plant hormones, including the lipid-based hormone jasmonate (JA). Methyl jasmonate (MeJA) is an endogenous plant growth regulator that can induce the JA signaling pathway, which functions to regulate the synthesis of secondary metabolites, including flavonoids. In this study, MeJA was added to licorice cell suspensions, and RNA-seq analysis was performed to identify the differentially expressed genes. As a result, the MYB transcription factors GlMYB4 and GlMYB88 were demonstrated to respond significantly to MeJA induction. Subsequently, the GlMYB4 and GlMYB88 protein were shown to localize to the cell nucleus, and it was verified that GlMYB4 and GlMYB88 could positively regulate the synthesis of flavonoids in licorice cells. Overall, this research helps illustrate the molecular regulation of licorice flavonoid biosynthesis induced by MeJA.
Introduction
Flavonoids are a class of naturally occurring compounds that have a 2-phenyl-chromone structure. A large number of studies have shown that flavonoids are non-toxic and harmless; in addition, they possess many biological activities and pharmacological effects, including antioxidant, anticancer, anti-inflammatory and so on [1–3]. Licorice (Glycyrrhiza uralensis Fisch) is mainly distributed in western China, including the Inner Mongolia, Ningxia, Xinjiang, and Gansu regions. It is one of the most widely used medicinal herbs, and both its roots and rhizomes are used therapeutically [4, 5]. The primary medicinal components of licorice are flavonoids and triterpenoids [6–9]. At present, licorice is widely used in both the pharmaceutical industry and in the production of food additives. In the latest research, the team of Liang Jiangong synthesized a kind of highly biocompatible CDs (Gly-CDs) from active ingredient (glycyrrhizic acid) of Chinese herbal medicine by a hydrothermal method, and found that the Gly-CDs possess extraordinary antiviral activity with multisite inhibition mechanisms for the porcine reproductive and respiratory syndrome virus (PRRSV) [10].
The biosynthesis of flavonoids in plants begins with the phenylpropane metabolic pathway [11, 12]. Among them, cinnamic acid-4-hydroxylase (C4H) and chalcone synthase (CHS) are two enzymes in the flavonoid synthesis pathway. C4H belongs to P450 monooxygenase, which acts on the second step of the whole metabolic pathway and is a key enzyme in the phenylpropane metabolic pathway. The protein activity of C4H has a direct effect on the synthesis of flavonoids, lignin, etc., and is an important adjustment point in the metabolism of phenylpropanoids. CHS is a key enzyme that leads the phenylpropane metabolic pathway to the synthesis of flavonoids. MYB transcription factors (TFs) can affect the expression of CHS gene.
The MYB TFs comprise one of the largest families of TFs in plants and play important roles in the processes of plant growth and development. Additionally, these are the main TFs involved in the regulation of flavonoid synthesis [13–16]. In the metabolic pathway of flavonoids, including cell wall component synthesis, biosynthesis of glucosinolates, other primary and secondary metabolic reactions, they also play an important role in metabolic regulation [17–20]. Studies have shown that MYB genes can be induced by environmental factors, such as ABA (abscisic acid), SA (salicylic acid), jasmonate (JA), and others [21–24].
Methyl jasmonate (MeJA), which is a JA analog, is one of the main signal molecules in the phenylpropane metabolic pathway [25]. Studies have shown that JA signaling has a regulatory effect on the synthesis of secondary metabolites, such as terpenoids, phenylpropanoids, and alkaloids, which present with a wide range of biological functions [26]. Some secondary metabolites have been shown to accumulate in plant cells following MeJA treatment, including paclitaxel in Taxus cells [27, 28], terpenoid in Centella asiatica cells [29], and ginseng saponins in ginseng cells [30]. However, the biological mechanism underlying the induction of licorice flavonoids by MeJA and the associated changes in the transcriptome are relatively unknown.
In the present study, changes in the transcriptional profile in licorice cells were assessed following MeJA treatment via the RNA-Seq method. In total, differentially expressed MYB TFs were identified based on this analysis. The GlMYB4 and GlMYB88 gene were subsequently cloned. As these genes presented significantly altered MeJA-induced expression, and the effect of GlMYB88 was obvious. Based on bioinformatic analyses, subcellular localization, overexpression, and flavonoid accumulation, it was verified that these genes functioned as a flavonoid synthesis-related gene in licorice. These results help to illustrate the molecular regulatory mechanisms underlying the biosynthesis of licorice flavonoids induced by MeJA. Moreover, this study serves as a valuable resource for further analysis of the regulatory mechanisms involved in flavonoid biosynthesis in plants.
Materials and methods
Plant materials and reagents
The experiment was carried out in the plant cell culture room of the Inner Mongolia University of Science and Technology (China). The tested licorice variety was Glycyrrhiza uralensis Fisch, and the seeds were purchased from Erdos City, Inner Mongolia, China. A licorice cell suspension culture system was established, and the entire operation was carried out at 25±1°C, with the pH maintained at 5.8 [5]. Nicotiana benthamiana was grown in a glasshouse and used for subcellular localization analysis.
Some kits, antibiotics, pUCm-T vectors, and primers used in the experiment were purchased from Sangon Biotech (Shanghai, China). Restriction enzymes were purchased from Takara Biomedical Technology (Beijing, China). T4 DNA Ligase, ampicillin, 6-benzyladenine (6-BA), naphthaleneacetic acid (NAA), 2,4-dichlorophenoxyacetic acid (2,4-D), and MeJA were purchased from Sigma-Aldrich (USA). Escherichia coli DH5α, Escherichia coli Top10, Agrobacterium tumefaciens GV3101, and pJG054 plasmid vectors were all available and stored in the laboratory.
Establishment of cell suspension culture system and MeJA treatment
The calli were induced from the young hypocotyl of licorice aseptic seedlings, from which the licorice cells were obtained. After culturing for 20 generations on a solid medium, the cells were inoculated into 100 mL of MS liquid medium supplemented with 2,4-dichlorophenoxyacetic acid (2,4-D, 1.0 mg•L-1), naphthaleneacetic acid (NAA, 0.5 mg•L-1), and 6-benzyladenine (6-BA, 0.5 mg•L-1) and then cultured at 120 rpm for 3 weeks (S1 Fig) [5]. A well-grown suspension cell line was selected, cleaned with liquid medium, and then transferred to a fresh suspension medium containing 100 mL MeJA (LABEST, China) at a final concentration of 100 uM. Alternatively, an equal volume of anhydrous ethanol was added to the liquid medium as a control. Then, the cells were cultured at 120 rpm for 48 h. The treatment method is shown in S1 Table.
RNA extraction, cDNA acquisition, and qPCR
RNA from filtered cells was extracted using RNAiso Blood extraction reagent (Takara, China). cDNA acquisition was achieved using a PrimeScript RT reagent kit with gDNA Eraser (Takara, China). The primers used for the CHS, C4H, and Actin genes are presented in S2 Table. qPCR was performed using TB Green Premix Ex Taq (Takara, China), and run on an ABI7500 Real-Time PCR machine (ABI, USA) following the manual’s recommendations. Then the resulting data were analyzed using the 2^(-ΔΔCt) method [31].
Sequencing
After analyzing the cells in each group from the above experiments, we selected an experimental group in which the relative expression levels of the two enzyme genes changed significantly. The suspension cultured cells were selected which treatment by MeJA and filtered, the constant weight cells were sequenced in Beijing novogene company (China).
In this research, it is mainly analyzed about gene expression level, genetic function commentary, RNA-seq quality evaluation and differential expression. Among them, the genetic function commentary includes RefSeq non-redundant proteins (NR), Gene Ontology (GO), the Kyoto Encyclopedia of Genes and Genomes (KEGG).
Gene cloning and vector construction
RNA-seq was used to screen MYB TFs significantly responding to MeJA induction, and the predicted sequences were obtained, which were named GlMYB88 and GlMYB4. The cloning of GlMYB4 and GlMYB88 was performed using a TransStart FastPfu DNA Polymerase kit (Trans, China); the primers used are presented in S2 Table. The amplification period was: 95°C 20 s, 58°C 20 s, 72°C 1 min for 40 cycles. The PCR product was ligated with the pUCm-T vector at 16°C overnight, generating the T-GlMYB88 and T-GlMYB4 vector, and then transferred into E. coli Top10 sensitive cells. The positive clones were screened and sent to Sangon Biotech (Shanghai, China) for sequencing. Retrieve the results through the Pfam online database (http://pfam.sanger.ac.uk/). The protein sequences were put into the NCBI database for comparison, and MEGA7.0 software was used to construct the phylogenetic tree and analyze the genetic relationship.
For the construction of the expression vector pJG054-GlMYB88 and pJG054-GlMYB4, the T-GlMYB88 and T-GlMYB4 plasmid were used as the template for PCR using the J88-F/R and J4-F/R primers, which are presented in S2 Table. The amplification sequence was ligated with ApaI-digested pJG054 vector to generate a GlMYBs-YFP fusion construct under the control of cauliflower mosaic virus 35S (CaMV 35S) promoter, then transformed into E. coli Top10 sensitive cells. The positive clones were screened.
Subcellular localization analysis
The recombinant plasmid pJG054-GlMYB88 and pJG054-GlMYB4 were extracted and transferred into Agrobacterium GV3101 competent cells, which were then cultured at 28°C for 48 h. The positive colonies were screened and injected into tobacco leaves (6 weeks old) via the injection osmotic method. Fluorescence was then observed under a laser confocal microscope (Nikon, Japan) after 60–72 h of culture.
Expression analysis of GlMYB4 and GlMYB88 in the different structures and growth periods of licorice
RNA was extracted from root, stem, leaf, and cotyledon samples of aseptic licorice seedling at different growth periods (2, 3, 4 and 5 weeks) to obtain cDNA (methods detailed above). The primers M88D1-F/R and M4D1-F/R (S2 Table) were used, and qPCR was performed. The Actin reference gene served as a control to analyze the relative expression of GlMYB4 and GlMYB88 in these different structures and at the different growth periods.
Overexpression of GlMYB4 and GlMYB88 in licorice cells
Since the selected vector pJG054 contains kanamycin resistance gene, in order to ensure that the transformed cells can grow normally, it is necessary to screen for the kanamycin resistance concentration of licorice cells. Licorice cells in good growth condition were inoculated on cell which cultured on solid media culture medium with different kanamycin concentration, cultured in light incubator for 30 days, and their growth status was observed.
Agrobacterium harboring the pJG054-GlMYB88 and pJG054-GlMYB4 plasmid were co-cultured with suspended licorice cells for 2 days. The genomic DNA of the cells was extracted by the CTAB method to detect vector marker gene in transformed cell [32]. Total RNA was then extracted from transformed cell for qPCR validation (methods detailed above). The remaining cells were subcultured. After 40 days, the licorice cells were dried and ground to a powder, and 20 times the volume of 80% methanol was added to soak for 24 hours. The total flavonoids in the cells were extracted via an ultrasonic method, and the flavonoid content was detected using UV-Vis spectrophotometry (510 nm) [33]. The content of isoliquiritigenin was detected by High Performance Liquid Chromatography (HPLC).
Results
Expression of the CHS and C4H genes in response to MeJA induction
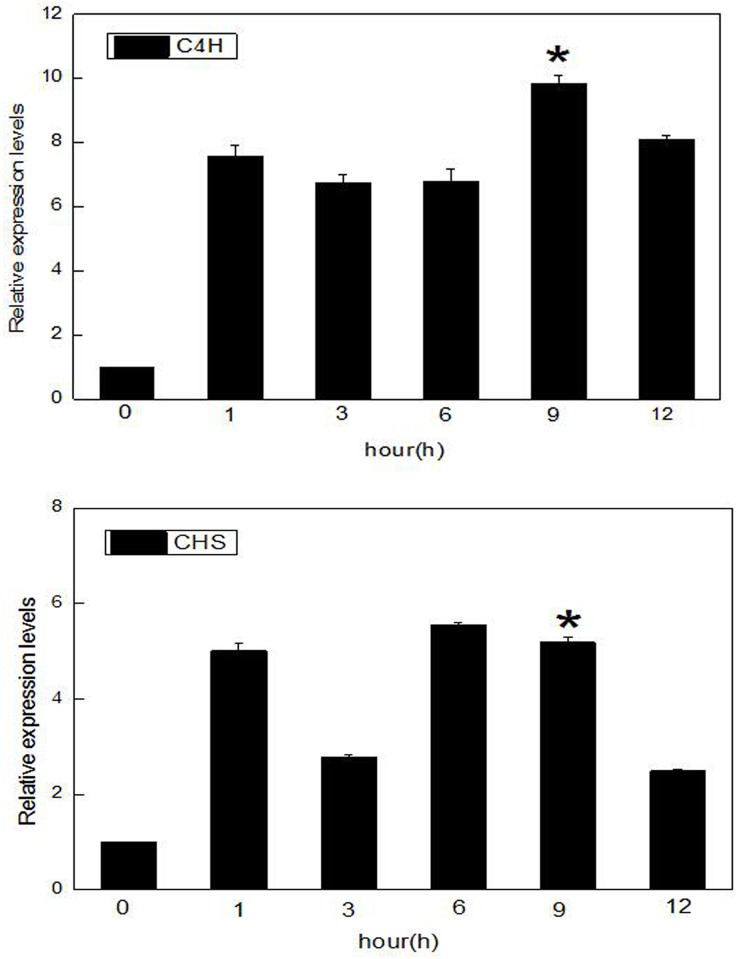
More than 20 generations of cells were selected for the establishment of the suspended cell lines, and a suspension of free cells was formed following 2–3 subcultures (S1 Fig). Total RNA was extracted from the cells following the different treatment conditions. qPCR experiments were conducted using a quantitative method, and these experiments were each repeated three times. The results showed that the relative expression levels of the C4H and CHS genes, both known flavonoids biosynthesis genes, in the MeJA treatment group were higher than those in the control group within 1–12 h, and their relative expression levels were the highest after 9 h (Fig 1). This effect was significant compared with the other treatment times. Overall, the relative expression of the C4H gene was generally greater than that of the CHS gene, and these results indicated that MeJA could regulate the expression of both of these genes.
Fig 1. Expression analysis of the CHS and C4H genes in licorice cells.
Data presented here are the mean of three replicates with error bars indicating ± SD. Asterisks indicate significant differences with values for the untreated cell: *P < 0.05. The expression levels of CHS and C4H in cells treated with MeJA at different times as based on qPCR analysis; C4H: cinnamic acid-4-hydroxylase; CHS: chalcone synthase.
Functional genetic analysis
The expression of C4H and CHS was the highest after 9 h of MeJA induction. As such, cells at this time point were selected for library building and Illumina sequencing. From the statistical table of the splicing of transcripts, the transcripts have 151,529 and unigenes have 116,07 (S3 Table). The transcriptome datasets derived from these licorice cells were submitted to the Gene Expression Omnibus (GEO) (number GSE128503).
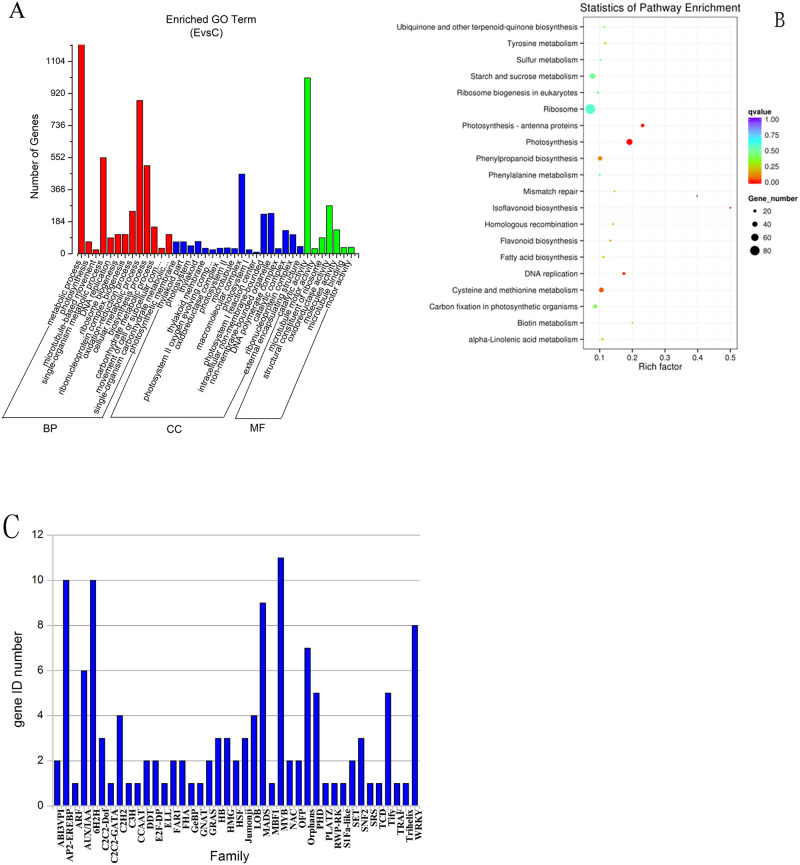
Functional annotation of the licorice transcriptome sequences was performed using the NR database available at NCBI. The NR database is a protein database that is generally used to annotate protein function and species. By comparing the experimentally obtained gene sequences with the NR database, the similarity between the gene sequence of the experimental species and the gene sequence of related species, as well as the associated functional information, can be obtained. Based on the results of the NR library comparison, the sample sequences appeared to be most similar to those of legume plants (S2 Fig). GO analysis evaluates the target genes based on three major categories: biological process, molecular function, and cell composition/localization. A total of 35,556 unigenes were successfully annotated via GO, covering up to 30.41% of the total unigenes. Using RSEM software to analyze the gene expression levels, a total of 2,650 differentially expressed genes (DEGs) were identified, with 1,464 genes shown to be up-regulated and 1,186 genes shown to be down-regulated (S3 Fig). By mapping all the DEGs to each term of the GO database, the most highly enriched GO functional items were identified among the DEGs in comparison with the genomic background. This analysis indicated that many of the DEGs were significantly related to known biological functions (Fig 2A), with most of the DEGs dominant in five terms, including cellular process, metabolic process, single-organism process, binding, and catalytic activity.
Fig 2. Sequence data analysis.
(A) Enriched GO Terms. Find out which of the different genes are higher in the GO group. (B) KEGG pathway enrichment diagram depicting the differentially expressed genes (DEGs) among the metabolic pathways. (C) Classification of the genes with significant differential expression. Identity of the genes with the most apparent changes in their expression levels.
The KEGG database is used to systematically analyze the metabolic pathways associated with gene products and compounds in the cells and helps establish the functions of the target genes by integrating genome, chemical, molecular, and biochemical systems data. To search for metabolic and signal transduction-related genes, all of the DEGs present in the KEGG database were mapped. The KEGG enrichment analysis results were converted into scatter diagrams (Fig 2B), and the rich factor in this figure represents the ratio of the number of genes under the pathway entry among the DEGs relative to the total number of genes for the pathway entry among all the annotated genes. The closer the q-value is to 0, the more significant the enrichment is. Overall, the results indicated that the gene change for the isoflavonoid biosynthesis pathway was most apparent and that the enrichment degree was large.
TFs regulate the spatiotemporal expression of plant defense genes in response to abiotic and biotic stresses. This analysis showed that the DEGs that responded to MeJA elicitation were largely represented by the TF families regulating secondary metabolism and stress responses in plants, including the AP2-EREBP, bHLH, MADS, MYB, and WRKY families (Fig 2C). The most of up-regulated TFs were MYB TFs, which are known to play key roles in MeJA-mediated flavonoids biosynthesis and the MeJA response network in licorice cells.
Cloning and bioinformatic analyses of GlMYB4 and GlMYB88
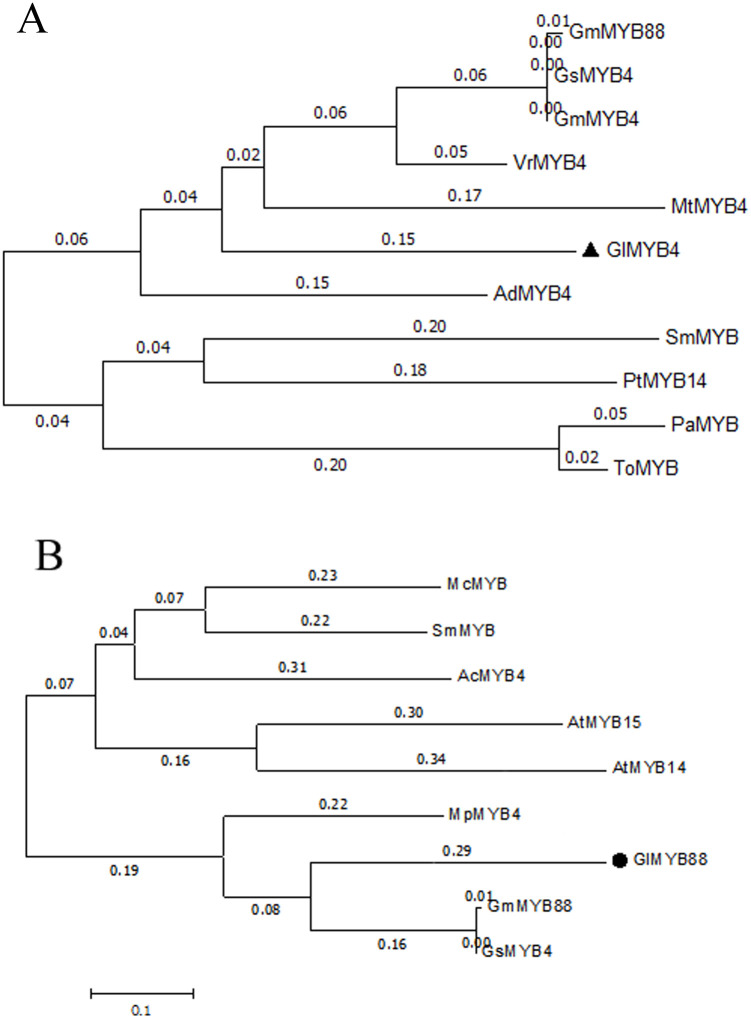
The GlMYB4 gene was cloned (S4A Fig) and sequenced, and the sequencing results were compiled using DNAMAN software. The cDNA sequence contained a 753 bp ORF encoding a total of 251 amino acids. The GlMYB4 gene sequence was submitted to GenBank for sequence alignment, and the related TF protein sequences from other plants were downloaded. The phylogenetic tree was constructed using MEGA7.0 software. A shown in Fig 3A, several MYB genes were identified that are closely related to the typical R2R3-MYB TF. The genetic relationship between GlMYB4 and VrMYB4, GsMYB4, GmMYB4, and GmMYB88 are very close, and they all harbor the typical R2R3 structure.
Fig 3. GlMYBs phylogenetic tree.
(A) GlMYB4 phylogenetic tree. (B) GlMYB88 phylogenetic tree.
The GlMYB88 gene was cloned (S4B Fig) and sequenced. The cDNA sequence contained a 1077 bp ORF encoding a total of 359 amino acids. The phylogenetic tree was constructed using MEGA7.0 software. A shown in Fig 3B, several MYB genes were identified that are closely related to the typical R2R3-MYB TF. The genetic relationship between GlMYB88 and GmMYB88, GsMYB88, MpMYB4 are very close, and they all harbor the typical R2R3 structure.
Subcellular localization of GlMYB4 and GlMYB88
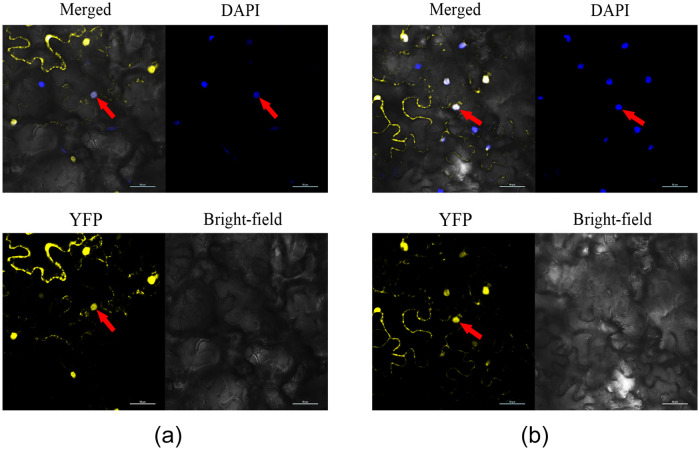
The linearized pJG054 vector was ligated to the GlMYB4 PCR product to construct the recombinant expression plasmid pJG054-GlMYB4 (S5 Fig), which was transferred into Agrobacterium GV3101 competent cells. Tobacco leaves were then injected with the transformed Agrobacterium and observed under laser confocal fluorescence microscope after 60 h. As shown in Fig 6, the yellow fluorescence carried by the recombinant vector p054-GlMYB4 overlaps with the DAPI blue fluorescence showing the nuclear position, then it appears white. It was found that the expressed GlMYB4 protein was localized to the nucleus (Fig 4A). Similarly, GlMYB88 protein is located in the nucleus (Fig 4B).
Fig 6. Expression analysis of GlMYB88 in different structures and growth periods of licorice.
Data presented here are the mean of three replicates with error bars indicating ± SD. Asterisks indicate significant differences with values for aseptic licorice seedling at different structures and growth periods: *P < 0.05; **P < 0.01. (A) Expression analysis of GlMYB88 in different growth periods of licorice. (B) Expression analysis of GlMYB88 in different structures of licorice.
Fig 4. GlMYBs subcellular localization analysis.
DAPI is used as the nuclear dye, and YFP is the fluorescent protein carried by the target gene. Bright-field image of the cellular morphology under unexcited light. Merged represents the overlapping of all three images. The red arrow indicates the position of the nucleus and GlMYBs protein co-localization. (A) GlMYB4 subcellular localization analysis. (B) GlMYB88 subcellular localization analysis.
Expression analysis of GlMYB4 and GlMYB88 in different structures and growth periods of licorice
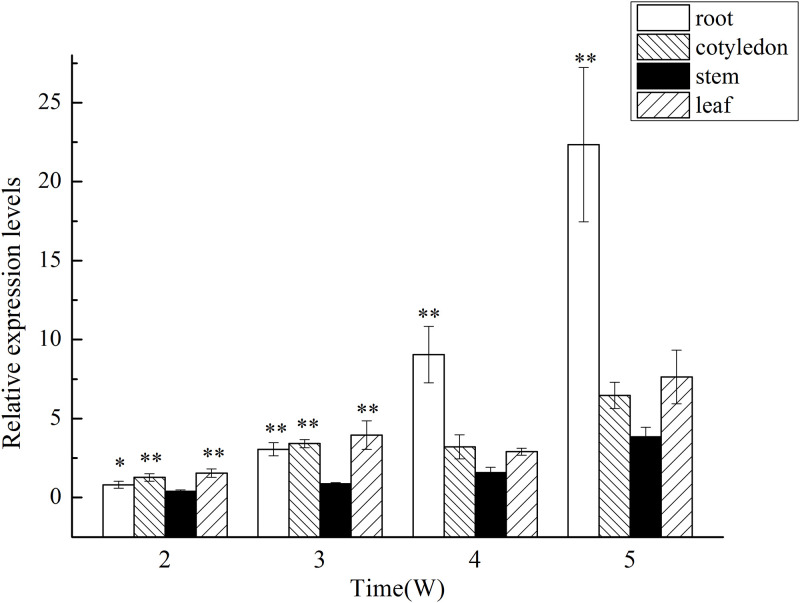
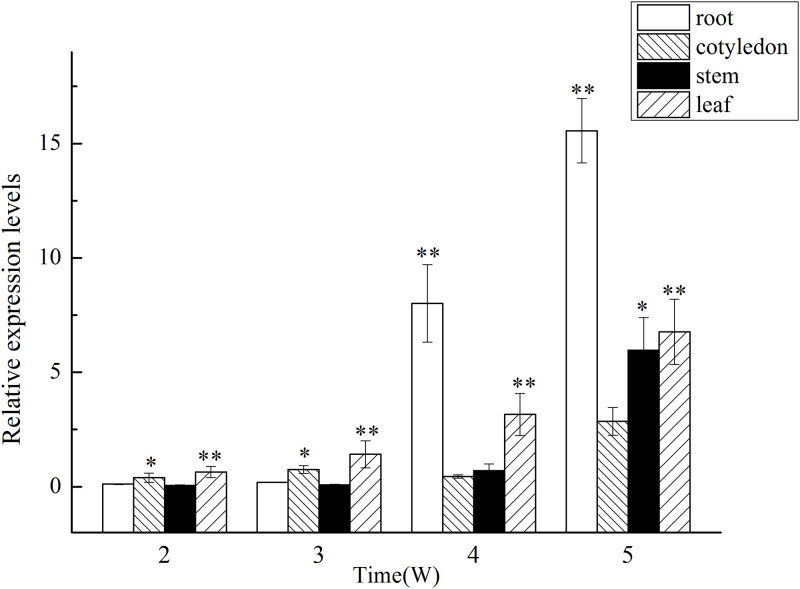
To determine the expression of GlMYB4 and GlMYB88 in the different structures and growth periods of licorice plants, tube seedlings at 2, 3, 4, and 5 weeks of age were assessed via qPCR (Figs 5 and 6). The results showed that the expression of GlMYB4 and GlMYB88 changed substantially over time. As shown in Fig 5, at 2 weeks, the seedlings had just grown up, and there was no significant difference in the expression levels of GlMYB4 in roots, cotyledons, stems, and leaves. From 3 weeks, GlMYB4 gene expression level began to differ in different organs, but the difference was not significant. However, the expression level in the roots gradually increased and exceeded the expression level in the leaves at 4 weeks. At this time, the cotyledons began to turn yellow from the edge, and the leaves grew more vigorously, and the roots grew continuously in the medium. At 5 weeks, the roots demonstrated more growth activity, while the cotyledons began to wither. Additionally, at this time point, the leaves also began to undergo yellowing and GlMYB4 expression was highest in the roots. The expression level of GlMYB88 is basically similar to that of GlMYB4 (Fig 6). In general, the relative expression levels of GlMYB4 and GlMYB88 increase with the growth period of the plant, and the expression level of GlMYB88 was higher than that of GlMYB4.
Fig 5. Expression analysis of GlMYB4 in different structures and growth periods of licorice.
Data presented here are the mean of three replicates with error bars indicating ± SD. Asterisks indicate significant differences with values for aseptic licorice seedling at different structures and growth periods: *P < 0.05; **P < 0.01. (A) Expression analysis of GlMYB4 in different growth periods of licorice. (B) Expression analysis of GlMYB4 in different structures of licorice.
Overexpression of GlMYB4 and GlMYB88
As the recombinant vector contained kanamycin resistance gene, so kanamycin-resistant concentration were screened before transformation experiments. In the experiment, licorice cells was inoculated with different kanamycin concentration medium (10–150 mg•L-1) for 30 days. When the kanamycin concentration was 50 mg•L-1, the cells were able to grow normally within 30 days (S6 Fig). Combined with the growth conditions of the transformed Agrobacterium, 50 mg•L-1 was selected as the concentration used in subsequent experiments. When the exogenous gene p054-GlMYBs was inserted and integrated into the genome of licorice cells, the gene sequence on the recombinant vector could be amplified by PCR. Genomic DNA was extracted from the transgenic cells and using the untransgenic cell as the control, and specific primers were designed for the amplification of a gene segment with the YFP gene sequence on the plasmid. The results showed that the recombinant plasmid was successfully integrated into the genome of licorice cell (S7 Fig).
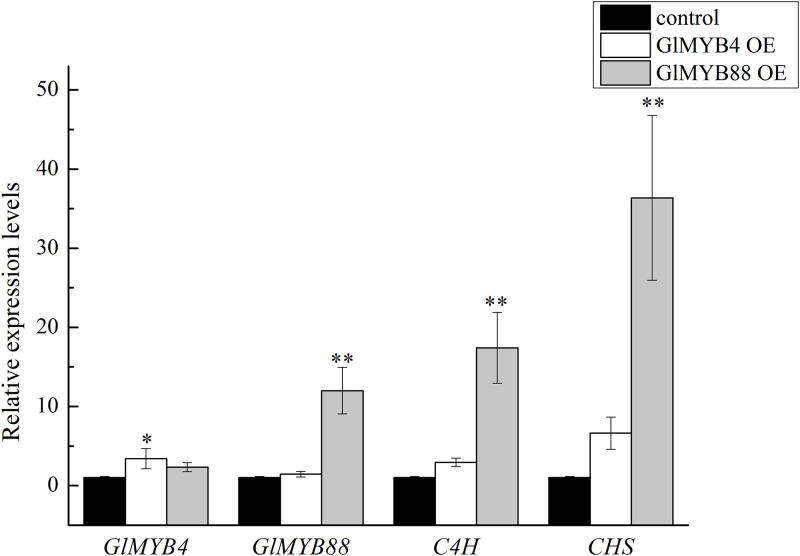
The expression level of the GlMYB4 gene in the suspended licorice cells harboring the overexpression GlMYB4 plasmid was significantly higher than that in the control group, as based on qPCR analysis, and the expression levels of the CHS and C4H genes were also shown to be significantly higher than the control group (Fig 7) in the. The results of GlMYB88 were similar to that of GlMYB4, and the effect of GlMYB88 was more significant.
Fig 7. The expression level of the GlMYB4, GlMYB88, C4S, and CHS genes in the control and overexpression (OE) cells.
Data presented here are the mean of three replicates with error bars indicating ± SD. Asterisks indicate significant differences with values for the empty vector control: *P < 0.05; **P < 0.01. Control: untransformed cell; GlMYB4 OE: overexpression GlMYB4 group; GlMYB88 OE: overexpression GlMYB88 group; C4H: cinnamic acid-4-hydroxylase; CHS: chalcone synthase.
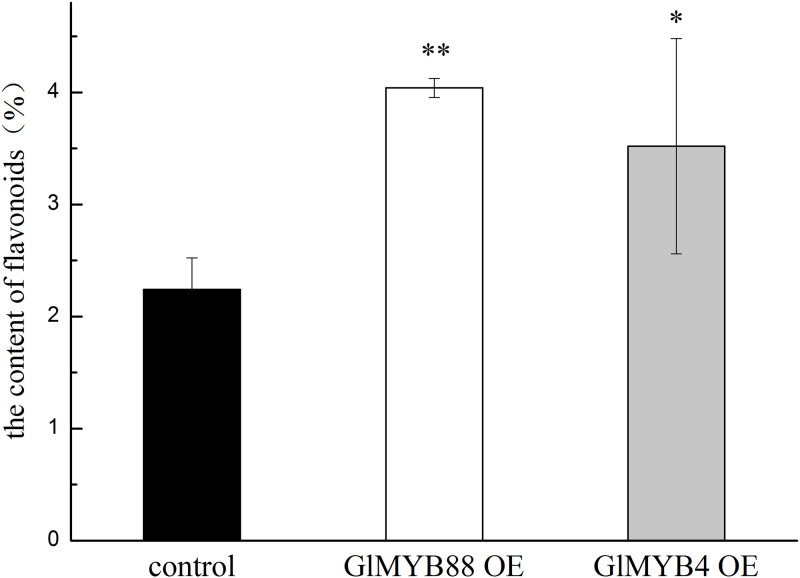
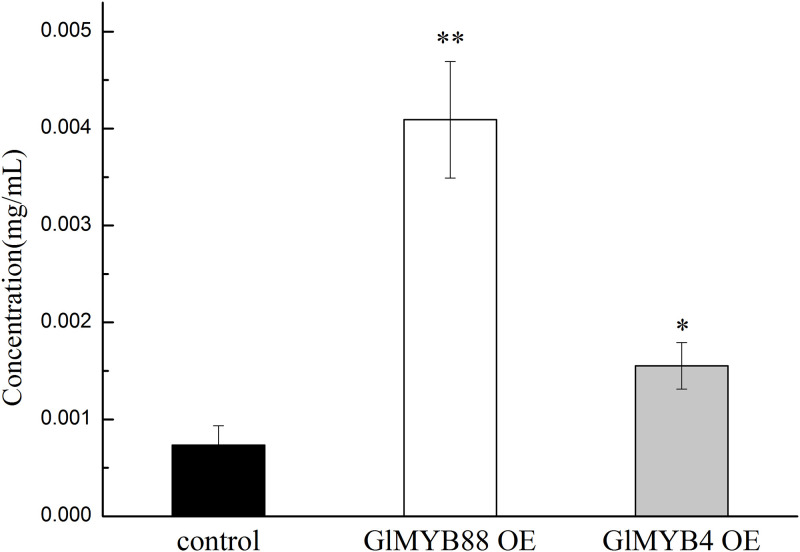
In these cells, the total amount of flavonoids was measured via UV-Vis analysis after culturing over 40 days, and it was found that the content of flavonoids in the overexpression GlMYB4 group was 1.57 times that of the control. The content of flavonoids in the overexpression GlMYB88 group was 1.80 times that of the control (Fig 8 and S8 Fig). Isoliquiritigenin is a typical monomer of licorice flavonoids. The content of isoliquiritigenin in each group of cells was detected by HPLC (Fig 9 and S9 Fig). The results showed that the content of isoliquiritigenin increased in the transgenic cells. Among them, the content of isoliquiritigenin in the transgenic GlMYB88 cell line was the highest, about 5.57 times that of the control group; the content of isoliquiritigenin in the transgenic GlMYB4 cell line was about 2.11 times the control group.
Fig 8. Determination of the total flavonoids in the control and experimental groups.
Data presented here are the mean of three replicates with error bars indicating ± SD. Asterisks indicate significant differences with values for the empty vector control: *P < 0.05; **P < 0.01. Control: untransformed cell; GlMYB4 OE: overexpression GlMYB4 group; GlMYB88 OE: overexpression GlMYB88 group.
Fig 9. Determination of the isoliquiritigenin in the control and experimental groups.
Data presented here are the mean of three replicates with error bars indicating ± SD. Asterisks indicate significant differences with values for the empty vector control: *P < 0.05; **P < 0.01. Control: untransformed cell; GlMYB4 OE: overexpression GlMYB4 group; GlMYB88 OE: overexpression GlMYB88 group.
Discussion
When licorice cells are induced by MeJA, the overall yield of flavonoids can be increased [34]. In addition to licorice, there are many studies showing that the exogenous MeJA can induce the JA signal pathway in plants, including Arabidopsis, Taxus cells, and Centella asiatica [12, 27, 29, 30, 35–37]. When the exogenous hormone MeJA enters the plant, MeJA is converted to JA via the action of jasmonic acid carboxyl methyl transferase (JMT), thus increasing the JA content, which can complex with Ile to form JA-Ile. Active JA-Ile can induce SCFCOI1-mediated degradation of Jasmonate ZIM-domain proteins (JAZ) and the JA-responsive TF is freed to play a regulatory role in downstream gene expression, thus initiating the plant's response to external environmental stressors [26, 37, 38]. At present, the TFs involved in the synthesis of plant secondary metabolites and the response to JA signaling primarily include ERF, bHLH, MYB, WRKY, HD-ZIP, DOF, NAC, and TFIIIA zinc fingers.
Studies have shown that the biosynthesis of flavonoids is regulated by MYB transcription factors [20, 39–43]. The MYB gene sequence was first identified by Graf in 1941 from AMV and E26, which caused avian acute myeloblastic leukemia viruses. In 1982, Klempnauer and other researchers identified a common transforming gene, called v-myb oncogene, from the avian myeloma virus. Clorless1 (C1) of maize was the first MYB transcription factor isolated and identified in plants [44–46]. Based on the number of MYB domain repeats (R), plant MYB proteins are divided into four sub-categories: 1R-MYB (containing only one R), R2R3-MYB, R1R2R3-MYB, and 4R-MYB (each containing four similar R1/R2 repeats). Among these, R2R3-MYB represents the largest class of MYB TFs in plants. MeJA can regulate the binding of MYB TFs to specific upstream DNA sequences and induce the efficient synthesis of plant secondary metabolites [47]. A study of 125 R2R3-MYB members demonstrated that about 32% of the members could be induced by JA, with about 4% down-regulated under these conditions [48]. MYB proteins with different functions were isolated and identified from plants such as arabidopsis thaliana and soybean and studied [17, 18]: AtMYB24 played an important role in the development of arabidopsis thaliana;GmMYBJ3 could increase the biosynthesis of isoflavones in soybean. These studies indicate that the MYB TFs are extensively involved in hormonal response processes, which play important roles in regulating the plant stress response. For legumes, studies on MYB TFs are more common in some common species such as soybean, and there are also studies on astragalus and pueraria, but there are few studies on MYB transcription factors in licorice. RNA-Seq is a rapid and efficient method for analyzing gene expression in tissues and cells and, as such, can make an important contribution to the understanding of the molecular mechanisms in plants [49–52]. Moreover, this method can detect low-abundant transcripts [53–55] and provides important information related to gene expression and transcriptional profiles [54–56]. In this study, transcriptome sequencing of licorice cells after MeJA treatment was performed, and a total of 11 MYB genes were identified that responded significantly to MeJA induction. Subsequently, GlMYB4 and GlMYB88 were cloned and analyzed.
Licorice has a variety of pharmacological activities, including antiviral, anticarcinogen and other effects [57–60], and this plant is widely used as one type of tonic class of medicinal materials. In practical application, the parts of the licorice plant that are typically used medicinally are mainly the roots and rhizomes [60]. A large number of studies have also shown that the main active ingredients in licorice accumulate in the roots more than other parts. TFs act on the upstream of specific target genes to regulate gene expression, and their expression level in the body should also vary with the level of target gene expression. In this study, the quantitative expression of GlMYB4 and GlMYB88 in the different structures and growth periods of licorice was analyzed. It was shown that, although the expression level of GlMYB4 and GlMYB88 were not high in the roots at the early stage of tube seedlings, their expression were gradually increased as the plants grew, indicating that expression level of GlMYB4 and GlMYB88 can respond to different accumulation of flavonoids.
Proteins are the main carriers of life activities, and genetic material needs to be translated into proteins to function. There are various organelles (or substructures) in the cell, which together constitute the most basic structure of the cell and enable the cell to function normally. Subcellular localization technology can provide important reference information for determining the function of some unknown proteins. A large number of studies have shown that most transcription factors are located in the nucleus, but a few transcription factors are found in cytoplasm, cell membrane and so on. We subcellularly localized the proteins encoded by GlMYB4 and GlMYB88, the experimental results showed that GlMYB4 and GlMY88 proteins were shown to localize to the nucleus via laser scanning confocal microscopy.
Flavonoids are secondary metabolites of licorice and are important medicinal ingredients. Most flavonoids are derived from the phenylpropane metabolic pathway, in which phenylaline is converted to cinnamic acid by phenylalanine aminolase (PAL) catalysis, and cinnamic acid is catalyzed by C4H to produce 4-hydroxycinnamic acid. Subsequently, 4-hydroxycinnamic acid is transformed into coumaryl-coenzyme A by 4-coumaryl-CoA synthase (4CL). One molecule of 4-coumaryl-CoA and three molecules of malonyl-CoA can be synthesized into charketone under the action of CHS, and a variety of flavonoids can be derived after charketone is catalyzed by chalcone isomerase (CHI) [11, 12]. In this study, expression level of two key enzyme genes, C4H and CHS, were analyzed to verify that GlMYB88 and GlMYB4 can regulate the flavonoid synthesis in licorice. When GlMYB4 and GlMYB88 were overexpressed, the expression levels of the key enzyme genes CHS and C4H were also significantly increased, and the total flavonoid and isoliquiritigenin content were also increased. These observations indicated that GlMYB4 and GlMYB88 likely functioned as a TF that positively regulates the synthesis of flavonoids in licorice cells.
With the increasing market demand and overexploitation, the availability of wild licorice has been greatly reduced and cannot meet the current demand. As an alternative, cell suspension systems are generally considered a suitable method for large-scale production [5], and this research shows that exogenous MeJA can be used to activate TF-related genes and increase gene expression related flavonoid biosynthesis. The transcriptome data is also an important public resource that could be used to accelerate the research of the MeJA response network and the regulatory mechanism involved in plant flavonoid biosynthesis. With the increasing knowledge of MYB TFs and their regulation of flavonoid biosynthesis, there exists a real possibility for mass production of flavonoids via direct genetic manipulation to increase the productive capacity of cell cultures.
Supporting information
(TIF)
(TIF)
(TIF)
(TIF)
(JPG)
(TIF)
(TIF)
(TIF)
(TIF)
MeJA is the experimental group, and anhydrous ethanol represents the control group.
(DOCX)
(DOCX)
(DOCX)
Data Availability
All transcriptome datasets files are available from the NCBI Gene Expression Omnibus (accession number GSE128503).
Funding Statement
the National Natural Science Foundation of China (81960688). the Inner Mongolia Autonomous Region (IMAR) Natural Science Foundation [2017MS (LH) 0304]
References
- 1.Coskun O, Kanter M, Korkmaz A, Oter S. Quercetin, a flavonoid antioxidant, prevents and protects streptozotocin-induced oxidative stress and beta-cell damage in rat pancreas. Pharmacological Research, 2005; 51(2): 117–123. 10.1016/j.phrs.2004.06.002 [DOI] [PubMed] [Google Scholar]
- 2.Li YL, Gan GP, Zhang HZ, Wu HZ, Li CL, Huang YP, et al. A flavonoid glycoside isolated from Smilax china L. rhizome in vitro anticancer effects on human cancer cell lines. Journal of ethnopharmacology. 2007; 113(1): 115–24. 10.1016/j.jep.2007.05.016 [DOI] [PubMed] [Google Scholar]
- 3.Chen HJ, Chung CP, Chiang W, Lin YL. Anti-inflammatory effects and chemical study of a flavonoid-enriched fraction from adlay bran. Food Chemistry. 2011; 126(4): 1741–1748. 10.1016/j.foodchem.2010.12.074 [DOI] [PubMed] [Google Scholar]
- 4.Zhang QY, Ye M. Chemical analysis of the Chinese herbal medicine Gan-Cao (licorice). Journal of Chromatography. A. 2009; 1216(11): 1954 10.1016/j.chroma.2008.07.072 [DOI] [PubMed] [Google Scholar]
- 5.Li YL, Yang Y, Fu CH, Yu LJ. Production of Glycyrrhizin in cell suspension of Glycyrrhiza inflata batalin cultured in bioreactor. Biotechnol Biotechnol Equip. 2012; 26(5): 3231–3235. 10.5504/BBEQ.2012.0083 [DOI] [Google Scholar]
- 6.Chin YW, Jung HA, Liu Y, Su BN, Kinghorn AD. Anti-oxidant constituents of the roots and stolons of licorice (glycyrrhiza glabra). Journal of Agricultural and Food Chemistry. 2007; 55(12): 4691–4697. 10.1021/jf0703553 [DOI] [PubMed] [Google Scholar]
- 7.Ohno H. Miyoshi S, Araho D, Kanamoato T, Terakubo S, Nakashima H, et al. Efficient utilization of licorice root by alkaline extraction. In Vivo. 2014; 28(5): 785–794. http://iv.iiarjournals.org/content/28/5/785 [PubMed] [Google Scholar]
- 8.Farag MA, Porzel A, Wessjohann LA. Unequivocal glycyrrhizin isomer determination and comparative in vitro bioactivities of root extracts in four Glycyrrhiza species. Journal of advanced Research. 2015; 6(1): 99–104. 10.1016/j.jare.2014.05.001 [DOI] [PMC free article] [PubMed] [Google Scholar]
- 9.Fukuchi K, Okudaira N, Adachi K, Odai-Ide R, Sakagami H. Antiviral and antitumor activity of licorice root extracts. In Vivo. (Athens, Greece). 2016; 30(6): 777–786. http://iv.iiarjournals.org/content/30/6/777 [DOI] [PubMed] [Google Scholar]
- 10.Tong T, Hu H, Zhou J, Deng S, Zhang X, Tang W, et al. Glycyrrhizic‐Acid‐Based Carbon Dots with High Antiviral Activity by Multisite Inhibition Mechanisms. Small. 2020; 16(13): 1906206 10.1002/smll.201906206. [DOI] [PMC free article] [PubMed] [Google Scholar]
- 11.Weisshaar B, Jenkins GI. Phenylpropanoid biosynthesis and its regulation. Current Opinion in Plant Biology. 1998; 1(3): 251–257. 10.1016/s1369-5266(98)80113-1 [DOI] [PubMed] [Google Scholar]
- 12.Dixon RA, Achnine L, Kota P, Liu CJ, Reddy MSS, Wang L. The phenylpropanoid pathway and plant defence-a genomics perspective. Mol. Plant. Pathol. 2002; 3(5): 371–390. 10.1046/j.1364-3703.2002.00131.x [DOI] [PubMed] [Google Scholar]
- 13.Zhang J, Xu HF, Wang N, Jiang SH, Fang HC, Zhang ZY, et al. The ethylene response factor MdERF1B regulates anthocyanin and proanthocyanidin biosynthesis in apple. Plant Molecular Biology. 2018; 10.1007/s11103-018-0770-5 [DOI] [PubMed] [Google Scholar]
- 14.Wang H, Wang X, Song W, Bao Y, Zhang H. PdMYB118, isolated from a red leaf mutant of Populus deltoids, is a new transcription factor regulating anthocyanin biosynthesis in poplar. Plant Cell Reports. 2019; 38: 927–936. 10.1007/s00299-019-02413-1 [DOI] [PubMed] [Google Scholar]
- 15.Wang YC, Liu WJ, Jiang HY, Mao ZL, Wang N, Jiang SH, et al. The R2R3-MYB transcription factor MdMYB24-like is involved in methyl jasmonate-induced anthocyanin biosynthesis in apple. Physiology and Biochemistry. 2019; 139: 273–282. 10.1016/j.plaphy.2019.03.031 [DOI] [PubMed] [Google Scholar]
- 16.Wang FB, Ren XQ, Zhang F, Qi MY, Zhao HY, Chen XH, et al. A R2R3-type MYB transcription factor gene from soybean, GmMYB12, is involved in flavonoids accumulation and abiotic stress tolerance in transgenic Arabidopsis. Plant Biotechnology Reports. 2019; 13: 219–233. 10.1007/s11816-019-00530-7 [DOI] [Google Scholar]
- 17.Yang XY, Li JG, Pei M, Gu H, Chen ZL, Qu LJ. Over-expression of a flower-specific transcription factor gene AtMYB24 causes aberrant anther development. Plant Cell Rep. 2007; 26(2): 219–228. 10.1007/s00299-006-0229-z [DOI] [PubMed] [Google Scholar]
- 18.Zhao MZ, Wang TL, Wu P, Guo WY, Su LT, Wang Y, et al. Isolation and characterization of GmMYBJ3, an R2R3-MYB transcription factor that affects isoflavonoids biosynthesis in soybean. Plos One. 2017; 12(6): e0179990 10.1371/journal.pone.0179990 [DOI] [PMC free article] [PubMed] [Google Scholar]
- 19.Charles AD, Amali HT, Supinya D, David L, Richard VE, Andrew CA. A kiwifruit (Actinidia deliciosa) R2R3-MYB transcription factor modulates chlorophyll and carotenoid accumulation. New Phytol. 2019; 221(1): 309–325. 10.1111/nph.15362 [DOI] [PMC free article] [PubMed] [Google Scholar]
- 20.Ma DW, Reichelt M, Yoshida K, Gershenzon J, Constabel CP. Two R2R3-MYB Proteins are Broad Repressors of Flavonoid and Phenylpropanoid Metabolism in Poplar. Plant J. 2018; 96(5): 949–965. 10.1111/tpj.14081 [DOI] [PubMed] [Google Scholar]
- 21.Kang SM, Jung HY, Kang YM, Yun DJ, Bahk JD, Yang JK, et al. Effects of methyl jasmonate and salicylic acid on the production of tropane alkaloids and the expression of PMT and H6H in adventitious root cultures of Scopoliaparviflora. Plant Sci. 2004; 166(3): 745–751. 10.1016/j.plantsci.2003.11.022 [DOI] [Google Scholar]
- 22.Wang YD, Yuan YJ, Wu JC. Induction studies of methyl jas-monate and salicylic acid on taxane production in suspension culture of Taxus chinenisis var Mairei. Biochem. Eng. J. 2004; 19(3): 259–265. 10.1016/j.bej.2004.02.006 [DOI] [Google Scholar]
- 23.Huang H, Hua G, Bei L, Tiancong Q, Jianhua T, Langtao X, et al. Arabidopsis myb24 regulates jasmonate-mediated stamen development. Frontiers in Plant Science. 2017; 8: 1525 10.3389/fpls.2017.01525 [DOI] [PMC free article] [PubMed] [Google Scholar]
- 24.Li G, Zhao J, Qin B, Yin Y, An W, Mu Z, et al. ABA mediates development-dependent anthocyanin biosynthesis and fruit coloration in Lycium plants. BMC. Plant Biology. 2019; 19: 317 10.1186/s12870-019-1931-7 [DOI] [PMC free article] [PubMed] [Google Scholar]
- 25.Pauwels L, Morreel K, Witte ED, Lammertyn F, Montagu MV, Boerjan W, et al. Mapping methyl jasmonate-mediated transcriptional reprogramming of metabolism and cell cycle progression in cultured Arabidopsis cells. Proceedings of the National Academy of Sciences of the United States of America. 2008; 105(4): 1380–1385. 10.1073/pnas.0711203105 [DOI] [PMC free article] [PubMed] [Google Scholar]
- 26.Geyter ND, Gholami A, Goormachtig S, Goossens A. Transcriptional machineries in jasmonate-elicited plant secondary metabolism. Trends in Plant Science. 2012; 17(6): 349–359. 10.1016/j.tplants.2012.03.001 [DOI] [PubMed] [Google Scholar]
- 27.Mirjalili N, Linden JC. Gas phase composition effects on suspension cultures of taxus cuspidata. Biotechnology and Bioengineering. 1995; 48(2): 123–132. 10.1002/bit.260480206 [DOI] [PubMed] [Google Scholar]
- 28.Shutao L, Peng Z, Meng Z, Chunhua F, Chunfang Z, Yanshan D, et al. Transcriptional profile of Taxus chinensis cells in response to methyl jasmonate. Bmc Genomics. 2012; 13(1): 295 10.1186/1471-2164-13-295 [DOI] [PMC free article] [PubMed] [Google Scholar]
- 29.Tugizimana F, Ncube EN, Steenkamp PA, Dubery IA. Metabolomics-derived insights into the manipulation of terpenoid synthesis incentella asiaticacells by methyl jasmonate. Plant Biotechnology Reports. 2015; 9(3): 125–136. 10.1007/s11816-015-0350-y [DOI] [Google Scholar]
- 30.Lu M, Wong H, Teng W. Effects of elicitation on the production of saponin in cell culture of Panax ginseng. Plant Cell Report. 2001; 20(7): 674–677. 10.1007/s002990100378 [DOI] [Google Scholar]
- 31.Livak KJ, Schmittgen TD. Analysis of Relative Gene Expression Data Using Real-Time Quantitative PCR and the 2(-ΔΔCt) Method. Method. 2001; 25(4): 402–408. 10.1006/meth.2001.1262 [DOI] [PubMed] [Google Scholar]
- 32.Allen GC, Flores-Vergara M.A., Krasynanski S., et al. A modified protocol for rapid DNA isolation from plant tissues using cetyltrimethylammonium bromide. Nature Protocols. 2006; 1(5): 2320–2325. 10.1038/nprot.2006.384 [DOI] [PubMed] [Google Scholar]
- 33.Yang Y, He F, Yu L, Chen X, Lei J, Ji J. Influence of Drought on Oxidative Stress and Flavonoid Production in Cell Suspension Culture of Glycyrrhiza inflata Batal. Zeitschrift. Für. Naturforschung. C. 2007; 62(5–6): 410–416. 10.1515/znc-2007-5-615 [DOI] [PubMed] [Google Scholar]
- 34.Shabani L, Ehsanpour AA, Asghari G, Emami J. Glycyrrhizin production by in vitro culturedGlycyrrhiza glabraelicited by methyl Jasmonate and salicylic acid. Russian Journal of Plant Physiology. 2009; 56(5): 621–626. 10.1134/S1021443709050069 [DOI] [Google Scholar]
- 35.Turner JG, Ellis C, Devoto A. The jasmonate signal pathway. Plant Cell. 2002; 14: S153–S164. 10.1105/tpc.000679 [DOI] [PMC free article] [PubMed] [Google Scholar]
- 36.Xie DX, Feys BF, James S, Nieto-Rostro M, Turner JG. COI1: An Arabidopsis gene required for jasmonate-regulated defense and fertility. Science. 1998; 280(5366): 1091–1094. 10.1126/science.280.5366.1091 [DOI] [PubMed] [Google Scholar]
- 37.Thines B, Katsir L, Melotto M, Niu Y, Mandaokar A, Liu G, et al. JAZ repressor proteins are targets of the SCFCOI1 complex during jasmonate signalling. Nature. 2007; 448(7154): 661–665. 10.1038/nature05960 [DOI] [PubMed] [Google Scholar]
- 38.Deshaies RJ. SCF and Cullin/Ring H2-based ubiquitin ligases. Annu. Rev. Cell. Dev. Biol. 1999; 15(1): 435–467. 10.1146/annurev.cellbio.15.1.435 [DOI] [PubMed] [Google Scholar]
- 39.Bovy A. High-flavonol tomatoes through heterologous expression of the maize transcription factor genes LC and C1. Plant Cell. 2002; 14(10): 2509–2526. 10.1105/tpc.004218 [DOI] [PMC free article] [PubMed] [Google Scholar]
- 40.Moyano E, Maainez-Garcia JF, Martin C. Apparent redundancy in myb gene function provides gearing for the control of flavonoid biosynthesis in antirrhinum flowers. Plant Cell. 1996; 8(9): 1519–1532. 10.1105/tpc.8.9.1519 [DOI] [PMC free article] [PubMed] [Google Scholar]
- 41.Nesi N, Clarisse J, Debeaujon I, Caboche M, Lepinec L. The Arabidopsis TT2 gene encodes an R2R3 MYB domain protein that acts as a key determinant for proanthocyanidin accumulation in developing seed. Plant Cell. 2001; 13(9): 2099–2114. 10.1105/TPC.010098 [DOI] [PMC free article] [PubMed] [Google Scholar]
- 42.Mehrtens F, Kranz H, Bednarek P, Weisshaar B. The Arabidopsis transcription factor MYB12 is a flavonolspecific regulator of phenylpropanoid biosynthesis. Plant Physiol. 2005; 138(2): 1083–1096. 10.1104/pp.104.058032 [DOI] [PMC free article] [PubMed] [Google Scholar]
- 43.Shelton D, Stranne M, Mikklesen L, Pakseresht N, Welham T, Hiraka H, et al. Regulation of Isoflavonoid Biosynthesis Requires Coordinated Changes in Transcription Factor Activity. Plant Physiol., 2012, 159(2):531–547. 10.1104/pp.112.194753 [DOI] [PMC free article] [PubMed] [Google Scholar]
- 44.Graf T. Myb:a transcriptional activator linking proliferation and differentiation in hematopoietic cells. Curr. Opin. Genet. Dev. 1992; 2(2): 249–255. 10.1016/0960-9822(92)90383-L [DOI] [PubMed] [Google Scholar]
- 45.Klempnauer KH, Gonda TJ, Bishop JM. Nucleotide sequence of the retroviral leukemia gene v-myb and its cellular progenitor c-myb: the architecture of a transduced oncogene. Cell. 1982; 31(1): 453–463. 10.1016/0092-8674(82)90138-6 [DOI] [PubMed] [Google Scholar]
- 46.Paz-Ares J, Ghosal D, Wienand U, Peterson PA, Saedler H. The regulatory c1 locus of Zea mays encodes a protein with homology to myb proto-oncogene products and with structural similarities to transcriptional activators. EMBO J. 1987; 6(12): 3553–3558. 10.1002/j.1460-2075.1987.tb02684.x [DOI] [PMC free article] [PubMed] [Google Scholar]
- 47.Delgado LD, Zuniga PE, Figueroa NE, Pastene E, Escobar-Sepulveda HF, Figueroa PM, et al. Application of a JA-Ile Biosynthesis Inhibitor to Methyl Jasmonate-Treated Strawberry Fruit Induces Upregulation of Specific MBW Complex-Related Genes and Accumulation of Proanthocyanidins. Molecule. 2018; 23(6): 1433 10.3390/molecules23061433 [DOI] [PMC free article] [PubMed] [Google Scholar]
- 48.Yanhui C, Xiaoyuan Y, Kun H, Meihua L, Jigang L, Zhaofeng G, et al. The myb transcription factor superfamily of arabidopsis: expression analysis and phylogenetic comparison with the rice myb family. Plant Molecular Biology. 2006; 60(1): 107–124. 10.1007/s11103-005-2910-y [DOI] [PubMed] [Google Scholar]
- 49.Duhoux A, Carrère S, Gouzy J, Bonin L, Délye C. Rna-seq analysis of rye-grass transcriptomic response to an herbicide inhibiting acetolactate-synthase identifies transcripts linked to non-target-site-based resistance. Plant Molecular Biology. 2015; 87(4–5): 473–487. 10.1007/s11103-015-0292-3 [DOI] [PubMed] [Google Scholar]
- 50.Xu J, Li Y, Ma X, Ding J, Wang K, Wang S, et al. Whole transcriptome analysis using next-generation sequencing of model species Setaria viridis to support C4 photosynthesis research. Plant Molecular Biology. 2013; 83(1–2): 77–78. 10.1007/s11103-013-0025-4 [DOI] [PubMed] [Google Scholar]
- 51.Yuan F, Lyu MJA, Leng BY, Zhu XG, Wang BS. The transcriptome of nacl-treatedlimonium bicolorleaves reveals the genes controlling salt secretion of salt gland. Plant Molecular Biology. 2016; 91(3): 241–256. 10.1007/s11103-016-0460-0 [DOI] [PubMed] [Google Scholar]
- 52.Long Y, Yongchao X, Rui Z, Xiaotong W, Chao Y. Comprehensive transcriptome profiling of soybean leaves in response to simulated acid rain. Ecotoxicology. and Environmental. Safety. 2018; 158: 18–27. 10.1016/j.ecoenv.2018.04.015 [DOI] [PubMed] [Google Scholar]
- 53.Ansorge WJ. Next-generation dna sequencing techniques. N. Biotechnol. 2009; 25(4): 195–203. 10.1016/j.nbt.2008.12.009 [DOI] [PubMed] [Google Scholar]
- 54.Blow N. Transcriptomics: the digital generation. Nature. 2009; 458(7235): 239–242. 10.1038/458239a [DOI] [PubMed] [Google Scholar]
- 55.Metzker ML. Sequencing technologies-the next generation. Nature Reviews Genetics. 2009; 11(1): 31–46. 10.1038/nrg2626 [DOI] [PubMed] [Google Scholar]
- 56.Collins LJ, Biggs PJ, Voelckel C, Joly S. An approach to transcriptome analysis of non-model organisms using short-read sequences. Genome Informatics. 2008; 21: 3–14. 10.1142/9781848163324_0001 [DOI] [PubMed] [Google Scholar]
- 57.Ito M, Nakashima H, Baba M, Pauwels R, De Clercq E, Shigeta S, et al. Inhibitory effect of glycyrrhizin on the in vitro infectivity and cytopathic activity of the human immunodeficiency virus [HIV (HTLV-III/LAV)]. Antiviral Research. 1987; 7(3): 127–137. 10.1016/0166-3542(87)90001-5 [DOI] [PubMed] [Google Scholar]
- 58.Ito M, Sato A, Hirabayashi K, Tanabe F, Shigeta S, Baba M, et al. Mechanism of inhibitory effect of glycyrrhizin on replication of human immunodeficiency virus (HIV). Antiviral Research. 1988; 10(6): 289–298. 10.1016/0166-3542(88)90047-2 [DOI] [PubMed] [Google Scholar]
- 59.Traboulsi H, Cloutier A, Boyapelly K, Bonin MA, Marsault É, Cantin AM, et al. The flavonoid isoliquiritigenin reduces lung inflammation and mouse morbidity during influenza virus infection. Antimicrobial Agents & Chemotherapy. 2015; 59(10): 6317–6327. 10.1128/AAC.01098-15. [DOI] [PMC free article] [PubMed] [Google Scholar]
- 60.Pavlova SI, Uteshev BS, Sergeev AV. Licorice root: possible mechanisms of antitoxicant, anticarcinogen, and antitumor properties (a review). Pharmaceutical Chemistry Journal. 2003; 37(6): 314–317. 10.1023/A:1026005931751. [DOI] [Google Scholar]
Associated Data
This section collects any data citations, data availability statements, or supplementary materials included in this article.
Supplementary Materials
(TIF)
(TIF)
(TIF)
(TIF)
(JPG)
(TIF)
(TIF)
(TIF)
(TIF)
MeJA is the experimental group, and anhydrous ethanol represents the control group.
(DOCX)
(DOCX)
(DOCX)
Data Availability Statement
All transcriptome datasets files are available from the NCBI Gene Expression Omnibus (accession number GSE128503).


