Abstract
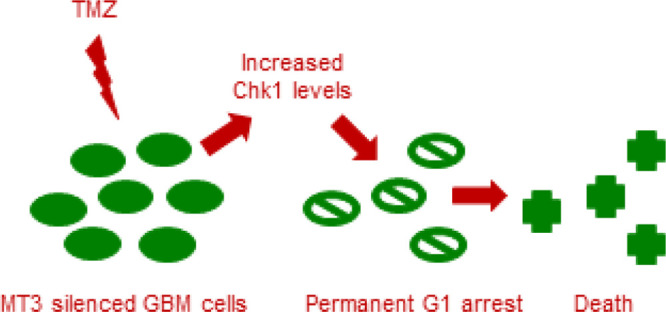
Metallothioneins (MTs) are metal-binding proteins that are overexpressed in various human cancers and are thought to be associated with resistance to cytotoxic drugs. The knowledge on MT expression, regulation, and function in human gliomas is limited. We found that MT3 mRNA was highly expressed in cell lines derived from grade IV gliomas (i.e., A172 and U87 cells), as compared to grade II astrocytoma cells (i.e., 1321N1). Different from 1321N1, U87 cells were partly resistant to the alkylating drug, temozolomide (TMZ) (100 μM for 96 h), which induced a massive accumulation of U87 into the S and G2 fractions of the cell cycle but not apoptotic death. Silencing of MT3 did not significantly affect U87 cell proliferation and survival, but it delayed G1/S transition and favored the occurrence of apoptosis in TMZ-treated cells. Accordingly, the combination of MT3 silencing and TMZ treatment increased the protein levels of checkpoint kinase-1, which was ultimately responsible for the lasting G1 arrest and death of double treated U87 cells.
Introduction
Gliomas are the most frequent primary brain tumors that are graded from I (least advanced–best prognosis) to IV (most advanced–worst prognosis), according to the World Health Organization (WHO). WHO grade IV refers to glioblastoma multiforme (GBM), which is the most common form of glioma, with a median survival time of about 15 months.1 The poor results of standard treatment, comprising surgery, radiotherapy, and chemotherapy with the alkylating drug, temozolomide (TMZ),2 point to the need for molecularly targeted therapies.
Interestingly, gliomas have an elevated cellular zinc turnover.3 Consistent with this evidence, gene profiling studies carried out on glioma samples have found a malignancy-related dysregulation of zinc transporters4 and a high expression of the zinc-binding proteins, metallothioneins (MTs), in GBM cases with a poor survival.5 Interestingly, protein and mRNA profiling of MTs in different grade gliomas have suggested that MT expression correlates with the tumor grade and progression.6,7
MTs are involved in the regulation of zinc trafficking, protection against reactive oxygen species, and adaptation to stress.8 Because of their broad range of properties, MTs have been suggested to promote angiogenesis, microenvironment remodeling, and immune escape in carcinogenesis (reviewed in ref (9)). In humans, 10 genes encode functional MT proteins, including the ubiquitous isoforms MT1A, MT1B, MT1E, MT1F, MT1G, MT1H, MT1X, and MT2A, and the MT3 and MT4 isoforms, which are expressed in tissue-specific patterns.8 Among these, MT1E has been shown to enhance glioma cell line invasion through the modulation of matrix metalloproteinases.10,11 More importantly, MT1A and MT2 gene expression have been found to be increased in glioblastoma specimens, as compared to grade I–III astrocytomas, and proposed as a marker for malignancy of astrocytic gliomas.7 In addition, the MT content seems to be associated with resistance of different cancer types, including gliomas, to cytotoxic drugs.12−15 Specifically, MT2A has been linked to chemoresistance in breast cancer16 and osteosarcoma17 cell lines, whereas MT3 has been associated with resistance to irradiation in both murine and human glioma cell lines.18
In the adult brain, MT1/MT2A are mainly localized in glia cells and induced by exposure to metals, whereas MT3 is mostly present in neurons with a growth inhibitory activity19 and is induced poorly by metals.20 However, MT3 is significantly expressed in astrocytes during brain development and, interestingly enough, in human GBM samples, where it correlates with poor patient survival.5,7 Masiulionytė and colleagues have suggested that MT3 gene could be used to prognosticate a patient’s survival.7 In this context, MT3 may potentially activate transcription factors21 or promote autophagy18,22 by acting as a zinc donor and protect against oxidative stress because of its high cysteine content.23 However, the data on the role of MT3 in carcinogenesis are not unequivocal. MT3 has been proposed to be a tumor suppressor gene, which is downregulated in a variety of human cancer specimens,24−26 to act as a growth inhibitory factor in rat glioma cells27 and to be involved in the autophagy-associated cell death induced by arsenic trioxide in glioma cells.28
Here, we show that MT3 mRNA is highly expressed in GBM cells, as compared to grade II astrocytoma cells. Moreover, MT3 appears to sustain the survival of low-grade astrocytoma cells in which it controls labile zinc levels, whereas it contributes to the intrinsic resistance of GBM cells to TMZ through the control of checkpoint kinase-1 (chk-1) activity.
Results
MT3 mRNA Expression and Regulation in Human Glioma Cells
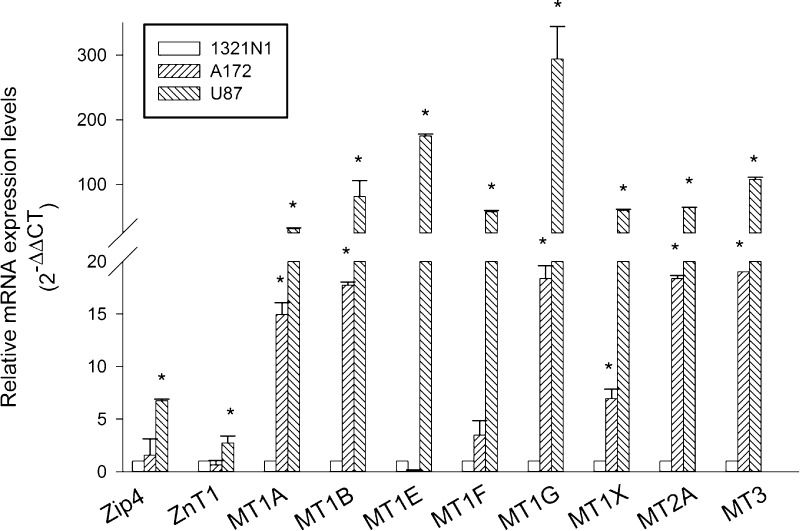
We used different human glioma cell lines, including grade II 1321N1 astrocytoma cells, and A172 and U87 GBM cells for a preliminary study of the repertoire of MTs and transporters for the zinc uptake (ZIP1 and ZIP4) or efflux (ZNT1). All cell lines were maintained under identical growth conditions to be able to compare gene expression profiles without confounding factors. By real-time polymerase chain reaction (qRT-PCR), we profiled the following gene products: ZIP1, ZIP4, Znt1, MT1A, MT1B, MT1E, MT1F, MT1G, MT1X, MT2A, and MT3, which were found to be expressed in each of the cell lines, although to a different extent (Figure 1). Virtually all MTs were more than 100-folds expressed in U87 cells, as compared to 1321N1 cells. A172 GBM cells, with few exceptions (i.e., MT1E and MT1F), also showed a great expression of MT mRNAs, corroborating the evidence that GBM cell lines reproduce most of the expression gene profiles observed in glioma tumor samples.4,5 Specifically, U87 GBM cells also exhibited a significant amount of Zip4 mRNA levels (Figure 1), which are known to correlate with the tumor grade and overall survival.4 Hence, U87 cells appeared as the most appropriate GBM cell line to be used in comparison with grade II 1321N1 cells. Among all expressed MTs, we decided to focus on MT3 because it is the one showing the most significant difference between long and short survival patients.5
Figure 1.
mRNA expression of zinc transporters (ZIP and ZNT) and zinc-binding proteins (MTs) in human glioma cell lines of different grades. Relative quantification of mRNAs (2–ΔΔCT method) was performed by using 18S rRNA as a reference gene. Bars represent the means ± SD from two distinct determinations, each performed in duplicate. *P < 0.05 vs the 1321N1 cell line.
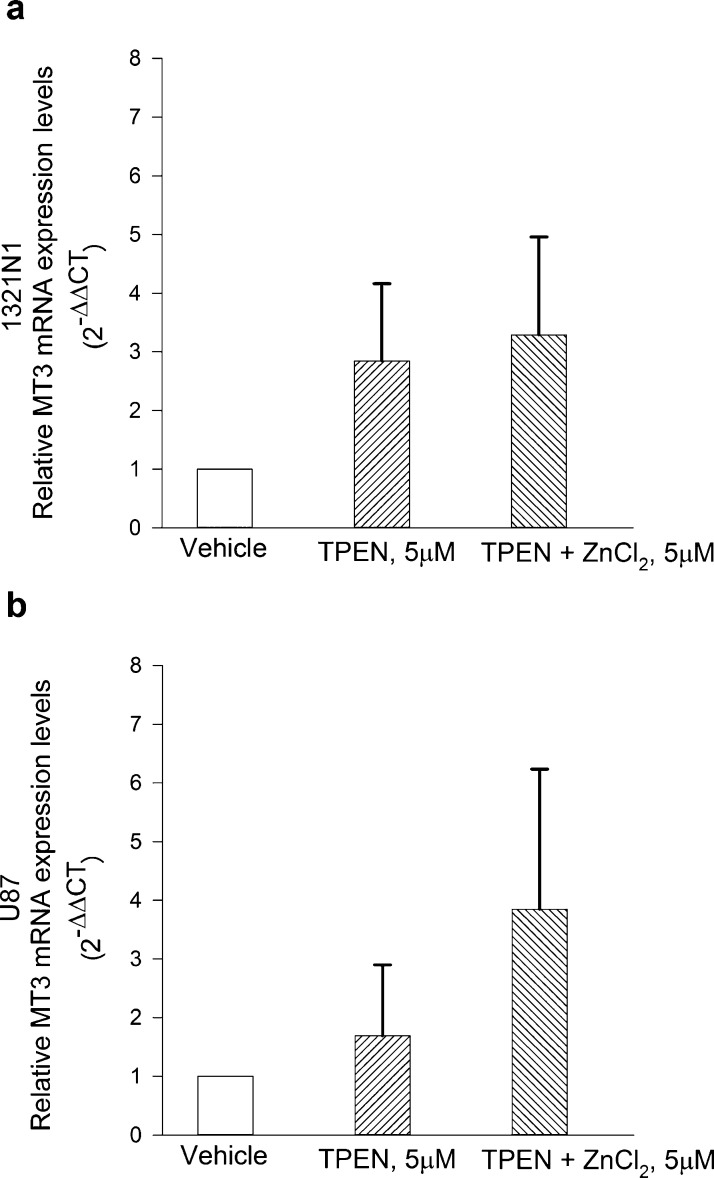
Metals poorly induce MT3 in neurons.20 To investigate whether zinc modulates the expression levels of MT3 in glioma cells, cultures were exposed to the membrane-permeable high-affinity zinc chelator, N,N,N′,N′-tetrakis(2-pyridinylmethyl)-1,2-ethanediamine (TPEN, 5 μM), in a serum-free medium either in the absence or in the presence of 5 μM ZnCl2 for 12 h. Compared to the total addition of zinc, the resulting free Zn2+ concentration in the medium was calculated to be in the 5–50 nM range because of the presence of ligands for zinc ions with varying affinities.29 Hence, the obtained free Zn2+ concentration would be consistent with the tonic level of free Zn2+ found in the human brain extracellular fluid, which falls between 5 and 50 nM in the 95% of cases.30 Under our experimental conditions, MT3 mRNA levels largely varied within the experimental groups and across the different experiments and, overall, were not statistically significantly modified by treatments either in 1321N1 or in U87 (Figure 2a,b). Differently, TPEN consistently reduced MT1E mRNA expression in U87 cells at least, and the reduction was partly prevented by the addition of ZnCl2 (Figure S2).
Figure 2.
MT3 mRNA levels in 1321N1 (a) and in U87 (b) glioma cells, following exposure to the membrane-permeable zinc chelator, TPEN (5 μM), in a serum-free medium either in the absence or in the presence of 5 μM ZnCl2 for 12 h. MT3 mRNA levels were not modified by treatments in neither of the two cell types. Bars represent the means ± SEM of 6–9 determinations.
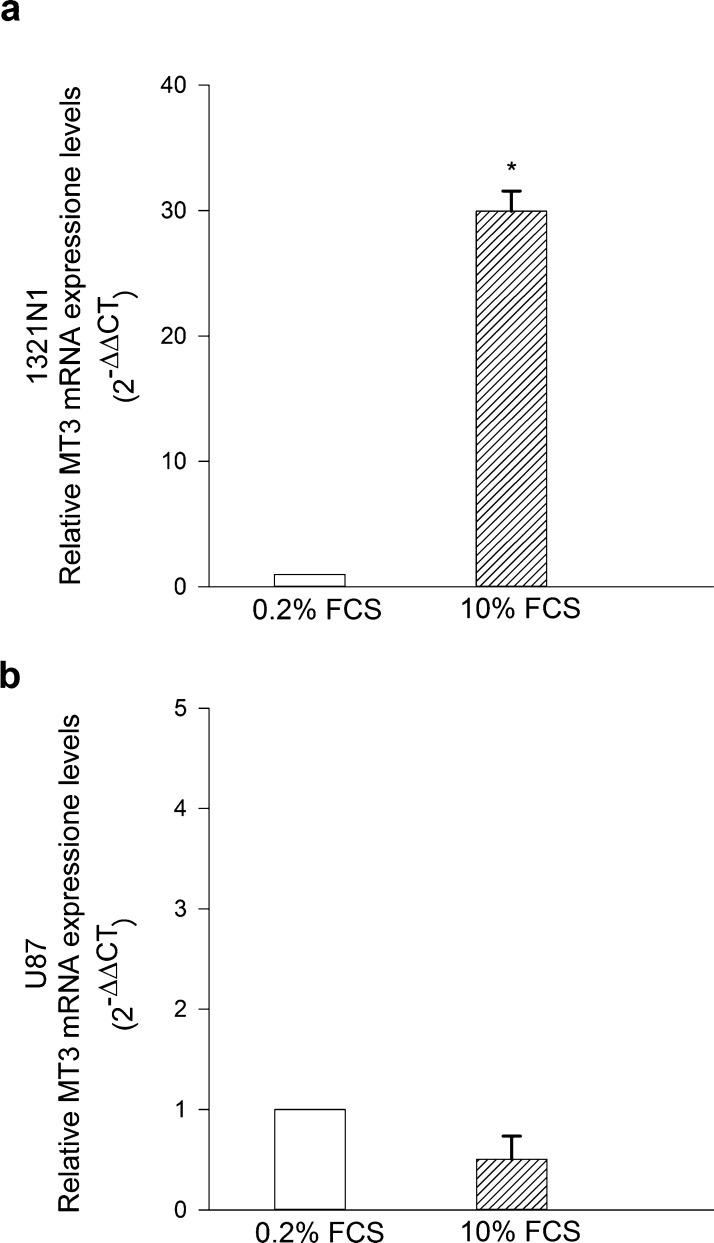
MTs are nominally required for cell proliferation to supply essential metals.31 We investigated whether a proliferative stimulus could modulate the expression levels of MT3 in glioma cells. Cultures were maintained in 0.2% fetal calf serum (FCS) for 24 h, then exposed to 10% FCS for 16 h before analysis. Interestingly, the 10% FCS pulse increased MT3 mRNA levels in 1321N1 cells but not in U87 cells (Figure 3a,b). Overall, these data indicated that U87 GBM cells express high levels of MT3 mRNA, which do not vary by altering zinc homeostasis or proliferative inputs.
Figure 3.
MT3 mRNA levels in 1321N1 (a) and in U87 glioma cells (b) starved in 0.2% FCS for 24 h and then exposed to 10% FCS for the following 16 h. MT3 mRNA levels were found to be highly increased in 1321N1 cells (a) but not in U87 cells (b). Bars represent the means ± SEM of 3–4 determinations. *P < 0.05 vs 0.2% FCS.
Effects of MT3 Silencing on Human Glioma Cell Survival and Susceptibility to the Alkylating Drug, TMZ
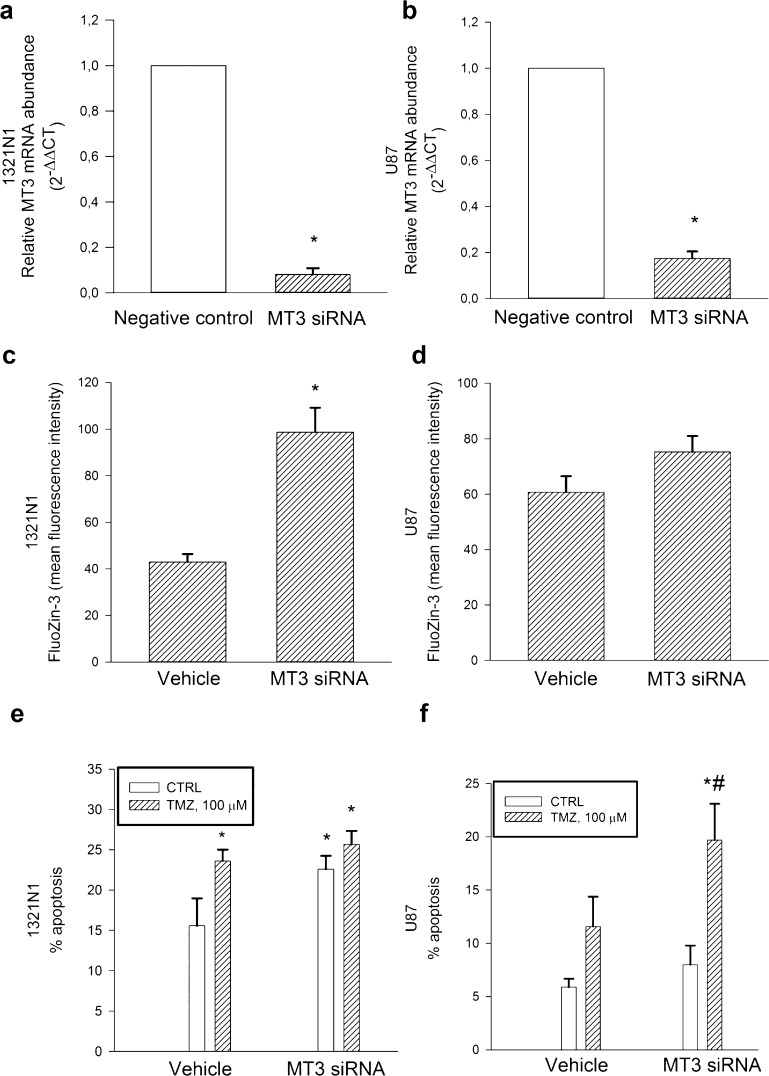
To address the potential function of MT3 in glioma cells, we silenced MT3 mRNA expression both in 1321N1 and U87 cultures. The efficiency of MT3 mRNA knockdown was evaluated by qRT-PCR after 72 h (Figure 4a,b). MT3 silencing increased significantly the intracellular levels of labile Zn2+ (i.e., the pool sensitive to chelation) in 1321N1 cells, as measured by flow cytometry using the cell-permeable zinc-selective dye, FluoZin-3-AM (Figure 4c), but not in U87 cells (Figure 4d). Moreover, MT3 silencing per se increased the basal apoptotic rate of 1321N1 cells (Figure 4e) but not of U87 cells (Figure 4f). We investigated the susceptibility of 1321N1 cells to different concentrations of TMZ, ranging from 10 to 200 μM. Significant toxicity developed within 96 h at the concentration of 100 μM [i.e., a concentration from 2.9 to 6.7 times higher than predicted TMZ peak concentrations in human glioma, but within the range of tissue distribution calculated in 24 h (i.e., from 18.91 to 40.37 mg/L h32)]. Higher concentrations resulted in cell detachment, which precluded the experiments. The 100 μM TMZ concentration was therefore selected to carry out parallel experiments in 1321N1 and U87 cells. Different from 1321N1 cells, U87 cells resisted to the toxic effect of the alkylating agent, TMZ (100 μM for 96 h) (Figure 4e,f); however, MT3 silencing increased U87 susceptibility to TMZ-induced toxicity (Figure 4f).
Figure 4.
MT3 mRNA levels in 1321N1 (a) and U87 glioma cells (b), which were silenced for 72 h before qRT-PCR analysis. Relative quantification of mRNAs (2–ΔΔCT method) was performed by using 18S rRNA as a reference gene. Bars represent the means ± SEM of 3–8 determinations. *P < 0.05 vs the silencer negative control. Mean fluorescence intensity of the zinc dye, FluoZin-3, in 1321N1 (c) and in U87 glioma cells (d) that were silenced for 72 h. Bars represent the means ± SEM of 6–8 determinations. *P < 0.05 vs vehicle. Percentage of apoptosis in MT3-silenced 1321N1 (e) and U87 glioma cells (f) either in the absence or in the presence of TMZ (100 μM) for 96 h. Bars represent the means ± SEM of 4 determinations. P < 0.05 vs *CTRL or #TMZ alone.
Effects of MT3 Silencing on TMZ-Induced Cell Cycle Perturbation
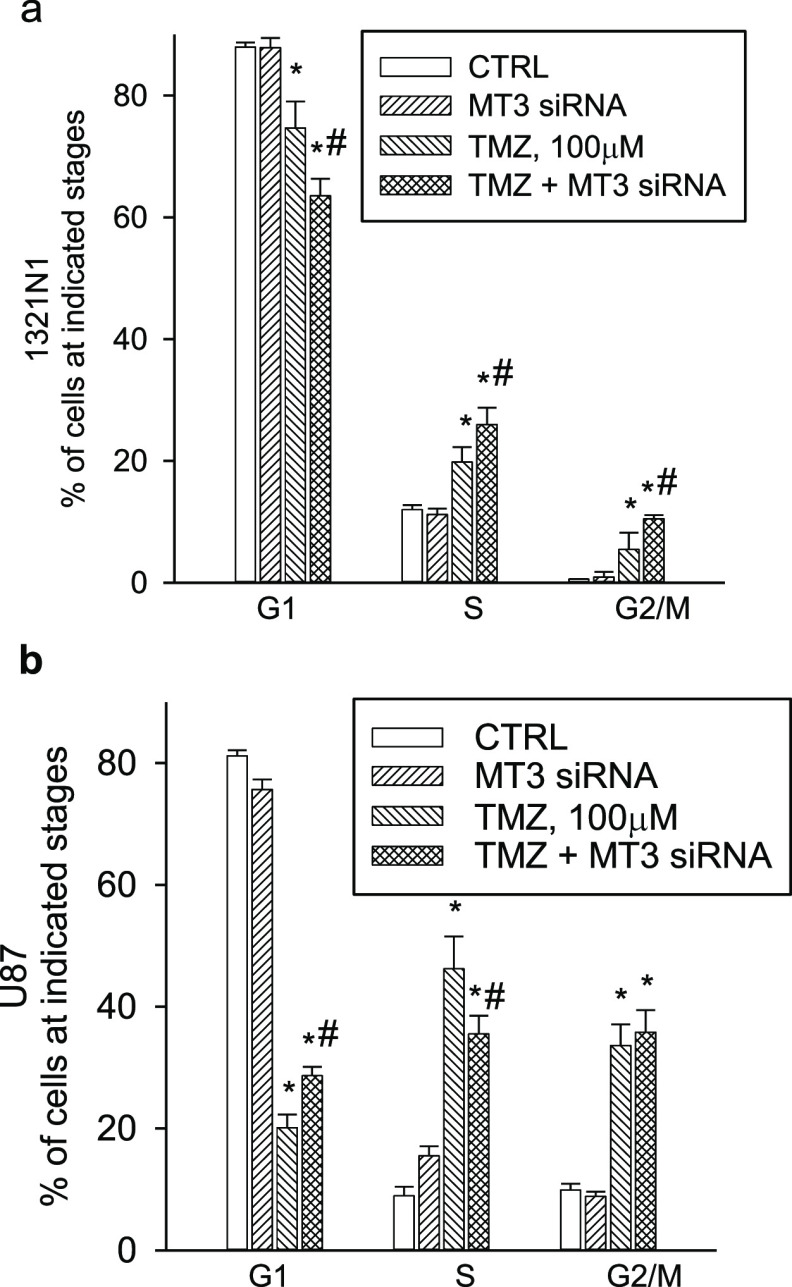
TMZ is known to induce cell cycle arrest.33 By means of flow cytometry (Figure S3A,B), we found that TMZ (100 μM for 96 h) produced a significant accumulation of 1321N1 cells into the S and G2 fractions of the cell cycle (a cycle delay index of cells that eventually die), and it had an even greater effect in U87 cells (Figure 5a,b), likely as a result of the intrinsic resistance of these cells to death. MT3 silencing per se did not modify cell cycle distribution profiles in 1321N1 or U87 cultures (Figure 5a,b) but affected TMZ-induced cell cycle alterations. MT3 silencing slightly potentiated the overall effect of TMZ in 1321N1 cells (Figure 5a), whereas it specifically delayed the G1/S transition of TMZ-treated U87 cells (see the increase in the proportion of G1 cells in the TMZ + MT3 siRNA vs TMZ alone) (Figure 5b).
Figure 5.
Cell cycle analysis of 1321N1 (a) and U87 (b) glioma cells, which were exposed to TMZ (100 μM), MT3 siRNA (5 nM), or to a combination of both for 96 h. TMZ induced a significant accumulation of cells in the S and G2 fractions of the cell cycle, both in 1321N1 and U87 cultures, whereas MT3 silencing per se was devoid of effects (a,b). MT3 silencing potentiated the overall effect of TMZ on 1321N1 cells (a), whereas it specifically delayed the G1/S transition of TMZ-treated U87 cells (b). Bars represent the means ± SEM of 4 determinations. P < 0.05 vs *CTRL or #TMZ alone.
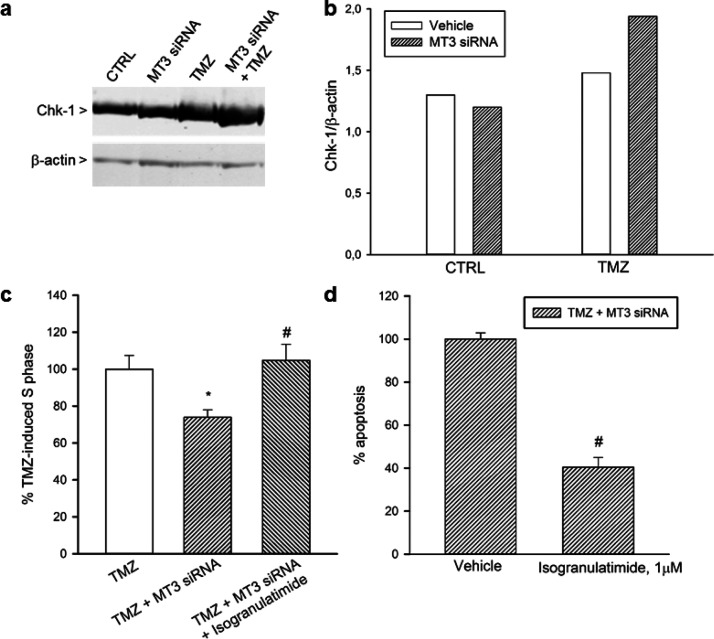
Next, we investigated whether the chk-1, which may control S phase entrance,34 could be responsible for the observed G1/S delay in silenced/TMZ-treated U87 cells. Western blot analysis of chk-1 in U87 glioma cells showed that TMZ and MT3 silencing synergized in increasing chk-1 protein levels (Figure 6a,b). The increment of chk-1 did not associate to modified levels of the microtubule-associated membrane protein-II (LC-II), a marker of autophagosome formation35 (Figure S4). Surprisingly, the increment of chk-1 was not paralleled by an increase in phosphorylated chk-1 at serine 317, a marker of DNA damage response that was barely visible and unaffected by treatments (Figure S5). We investigated the possibility that MT3 silencing could potentiate the DNA damage induced by TMZ, despite the lack of a canonical marker of DNA damage response (i.e., the phosphorylated chk-1 at serine 317). In agreement with the alkylating properties of TMZ, a significant percentage of U87 glioma cell nuclei were stained for O6-methyl-2-deoxyguanosine after 96 h of drug exposure; however, MT3 silencing did not enhance TMZ effect (Figure S6). Interestingly, chk-1 blockade by the inhibitor, isogranulatimide (1 μM), prevented G1/S phase delay and apoptosis of silenced/TMZ-treated cells (Figure 6c,d), suggesting that increased levels of chk-1 could induce persistent G1 arrest and death in a fraction of silenced/TMZ-treated U87 cells.
Figure 6.
Western blot analysis of chk-1 in U87 glioma cells (a). TMZ (100 μM for 96 h) increased the expression of chk-1 in MT3-silenced cells. The densitometric analysis of bands from a representative western blot is presented in (b). Signals were normalized against β-actin, as a control for loading. Blot was repeated three times with similar results. Chk-1 blockade by isogranulatimide (1 μM) prevented the delayed G1/S transition (c) and apoptosis (d) observed in silenced/TMZ-treated cells. In (c,d), bars represent the means ± SEM of 4 determinations. Data are shown as percentage of the values of TMZ (c) or TMZ + MT3siRNA (d), each normalized to 100%. P < 0.05 vs *TMZ alone or #TMZ + MT3 siRNA.
Discussion and Conclusions
MT gene expression has been associated with glioma malignancy grade,7 and MT3 associates with a poor patient survival.5,7 We have found that the GBM U87 cell line expresses high levels of MT3 mRNA, as compared to grade II 1321N1 astrocytoma cells. These differences are unlikely to depend on a different modulation of MT3 expression by intracellular labile zinc36 because MT3 mRNA levels were not affected by zinc depletion and restoration.
Following 24 h serum starvation, MT3 mRNA was highly induced by proliferative stimuli in grade II astrocytoma 1321N1 cells but not in GBM U87 cells. This divergence could depend on the different MT3 mRNA content in the two cell lines, which is very high in GBM cells and may not increase further. Alternatively, such a divergence might suggest that MT3 mRNA levels reflect a different basal proliferation rate of the two cell lines. Accordingly, it has been proposed that MT expression depends on the proliferative index of tumors.31
MTs operate by binding zinc when it is in excess and by releasing it upon demand. The metal-binding proteins of purified MT3 are similar to those of other MTs;37 however, in vivo, MT3 has the unique property to compete for zinc with other zinc-requiring proteins and not a mere homeostatic function.38 Therefore, the high association rate for zinc of MT3 could explain why MT3 silencing alone was sufficient to rise significantly the levels of labile zinc at least in grade II 1321N1 astrocytoma cells. Labile zinc in glia cells can be highly cytotoxic by a variety of mechanisms, including intracellular acidity,39 caspase-3-dependent apoptosis,40 and lysosomal membrane permeabilization.22 In our hands, MT3 silencing, with the ensuing rise in labile zinc, increased the basal apoptotic rate of grade II 1321N1 astrocytoma cells.
A four-day treatment with the DNA alkylating drug, TMZ, prompted grade II 1321N1 astrocytoma cells to undergo apoptosis following a lasting cell cycle arrest (specifically into the S phase and at the G2/M boundary). These data are in agreement with the demonstration that TMZ induces the senescence and the mitotic catastrophe of glioma cells.33 Interestingly, MT3 silencing amplified TMZ-induced cell cycle arrest of grade II 1321N1 astrocytoma cells (i.e., putative senescence) without enhancing the drug-induced apoptosis (i.e., putative mitotic catastrophe). The evidence that the pro-apoptotic effects of MT3 silencing and TMZ treatment were not additive, although cell cycle arrest was potentiated, suggests that MT3 could normally sustain the survival of 1321N1 astrocytoma cells by counteracting the cellular senescence program that TMZ is able to activate.33 At present, it is unknown whether the regulation of intracellular labile zinc by MT3 is required for the maintenance of 1321N1 cell survival.
As different from grade II 1321N1 astrocytoma cells, GBM U87 cells were partly resistant to TMZ, which induced an even more pronounced cell cycle arrest than in 1321N1 cells in the absence of significant apoptosis. MT3 silencing did not increase intracellular labile zinc in GBM U87 cells, did not enhance their basal apoptotic rate, but it increased the susceptibility of these cells to the pro-apoptotic effects of TMZ. Given the anti-oxidant effects of MTs,23 we cannot exclude the possibility that MT3 silencing resulted into an altered oxidative stress level such as to increase U87 cell susceptibility to TMZ. However, TMZ alone induced the predictable S and G2/M phase arrest of GBM U87 cells, and MT3 silencing in TMZ-treated cells induced an unexpected and additional delay of G1/S transition. We reasoned that the effects of MT3 silencing and TMZ could converge on the activation of a checkpoint controlling the cell entrance into the S phase, namely the chk-1.34
Generally, chk-1 is activated by phosphorylation of specific serine residues (including ser-137, which is required for ser-345 phosphorylation41) in response to genotoxic or replicative stressors and, in turn, it phosphorylates a number of downstream effectors to trigger cell cycle arrest, DNA repair, or cell death.42 However, we found that the combination of MT3 silencing and TMZ treatment raised the total levels of chk-1 rather than increasing its phosphorylation. Nevertheless, the raised chk-1 was instrumental for death because its inhibition by isogranulatimide protected GBM U87 cells against the combined effects of MT3 silencing and TMZ treatment. Our data are in line with the recent suggestion that a constitutive activity of chk-1, in the absence of a frank genotoxicity, may be sufficient to induce permanent cell cycle arrest and death.43 A number of mechanisms can regulate chk-1 expression, including E2F-mediated transcription,44 proteasome-dependent degradation,45 and both macro- and chaperon-mediated autophagy.46 Because the proteasome-dependent pathway intervenes mainly in the degradation of phosphorylated chk-1,47 we decided to investigate the relationship between the observed increment of chk-1 and a possible alteration of autophagy. Although we did not carry out a detailed analysis of autophagic flux, and LC-II levels may indicate either the upregulation of autophagosome formation or blockage of autophagic degradation,35 the evidence that LC-II levels did not vary across the treatment suggests that MT3 silencing, alone or in combination with TMZ, did not influence autophagy in GBM U87 cells. MT3 has been shown to play a role in the maintenance of autophagy flux both in cultured astrocytes22 and in irradiated mouse and human-derived glioma cells.18 Hence, MT3 could contribute to the survival of glioma cells through different routes and according to the cell type and/or the challenging insult. In the case of 1321N1 astrocytoma, MT3 silencing per se resulted into an increase in labile zinc and an increase in the basal apoptotic rate of the cells. Instead, in the case of U87 GBM, MT3 silencing did not appear to affect cell viability unless TMZ was added.
While the molecular mechanisms controlling chk-1 expression in MT3-silenced/TMZ-treated U87 cells remain uncertain, the general suggestion is that MT3 contributes to the intrinsic resistance of GBM cells to the alkylating drug, TMZ. TMZ is the first-line treatment for GBM patients, and TMZ resistance remains one of the main reason why treatment of GBM fails.48 This chemoresistance is largely attributed to the overexpression of DNA repair gene, O6-methylguanine DNA-methyltransferase (MGMT).49 However, MGMT-deficient GBM cells, including U87 GBM cells,50,51 remain partly resistant to TMZ, and the underlying molecular mechanisms are not all known. Although we observed that U87 GMB cells accumulated O6-methylguanine over the course of exposure to TMZ, MT3 silencing did not enhance O6-methylguanine load as one could expect from the property of MTs to scavenge methyl carbonium ion intermediates of TMZ.52 This evidence adds to the literature data that support distinct biological functions for MT3 with respect to other MTs.53,54 In GBM U87 cells, MT3 silencing did not appear to produce a significant increase in intracellular labile zinc, nor to enhance DNA alkylation; nevertheless, it improved GBM sensitivity to TMZ.
Overall, we found that the silencing of MT3 induced a long lasting G1 arrest, with ensuing apoptosis, of U87 GBM cells that were treated with TMZ, and the underlying molecular mechanism involved content and activity of the chk-1 protein.
Methods
Cell Lines and Treatments
All cell lines were obtained from the European Collection of Authenticated Cell Cultures and grown in Gibco Minimum Essential Medium, supplemented with 100 units penicillin and 100 μg/mL streptomycin (Sigma-Aldrich), 10% heat-inactivated FBS (Gibco), and 4 mM glutamine (Sigma-Aldrich), into T75 Falcon flasks until confluency. The passage number for all cell lines was kept below 30. For the experiments, cells were splitted into 24 well plates (Nunclon Delta) and allowed to grow until reaching at least 70% confluency. The medium was renewed two times/week. When required, glioma cells were exposed to the membrane-permeable zinc chelator, TPEN (5 μM), in a serum-free medium either in the absence or in the presence of 5 μM ZnCl2 for 12 h.
RT-PCR Analysis
Total RNAs were extracted by TRIzol Reagent, according to the manufacturer’s protocol (Ambion). RNA yield and purity were evaluated by measuring RNA absorbance at 260 and 280 nm, respectively. Typically, we obtained 8–10 μg of RNA from 0.8 × 10⁶ cells, with an A260/A280 ratio of 1.8–2.0. The Qiagen’s Quantitect reverse transcription kit was used to generate the cDNA for RT-PCR analysis. RT-PCR was carried out by using the QuantiNova SYBR Green PCR kit on Rotor Gene Q. All primers were used at a concentration of 0.5 μM. RPS18 was selected as housekeeping gene (Qiagen QT00248682) because the cycle threshold (Ct), which is inversely correlated with the amount of the template present in the reaction, did not differ (n = 3) between 1321N1 (Ct = 20.5 ± 0.08) and U87 cells (Ct = 19.8 ± 0.26). Alternative reference genes, including RPLPO (QT00075012) and GAPDH (Life Technologies), were preliminary tested and excluded. In fact, a direct comparison of the respective Ct values in the two cell lines indicated a higher level of RNA transcription in the U87 than in the 1321N1 cells. Ct values (n = 3) were as follows: U87: RPLPO = 23.2 ± 0.45, GAPDH = 22.1 ± 0.24; 1321N1: RPLPO = 33.1 ± 2.85, GAPDH = 24.6 ± 0.18. Cycling conditions were the following: 1 cycle at 95 °C for 2 min, followed by 45 cycles at 95 °C for 5 s, and 60 °C for 20 s. The sequences of all primers (Life Technologies) are available in Table S1. Levels of mRNA expression were calculated based on the method of 2–ΔΔCT.55
MT3 Silencing
Silencing was carried out on cell cultures at 70% confluency in the normal growing medium. Predesigned MT3 siRNA (Qiagen SI03193995, 5 nM) or the silencer negative control (Ambion 4611) was transfected by the HiPerfect Transfection Reagent medium (Qiagen), and silencing was verified by RT-PCR analysis of mRNAs after 72–96 h. The medium was not replaced throughout the course of silencing, also taking into consideration that, usually, medium renewal was necessary two times/week. Unless otherwise stated in the figure legends, the HiPerFect Transfection Reagent (vehicle) was used as a control for MT3 siRNA because it did not differ from the silencer negative control. Representative histograms for apoptosis and cell cycle distribution profiles of 1321N cells are provided to show the different effects of MT3 siRNA with respect to both vehicle and silencer negative control (Figure S1).
Cytofluorimetric Analysis
Cell pellets were fixed in 70% ethanol and treated for 1 h at 37 °C with RNase (100 μg/mL) before propidium iodide staining (50 μg/mL for 30 min).56 DNA content and ploidy were assessed with a Cytomics FC550 Flow Cytomer. Cell cycle profiles were evaluated by ModFit software. After discriminating the cell debries for the accurate quantification of apoptosis,57 apoptotic cells were scored in the area of hypodiploid DNA preceding the G1 peak (see legend of Figure S1).
Intracellular labile Zn2+ was assessed in fresh dispersed cells that were suspended in phosphate buffer saline containing 0.2% bovine serum albumin, 1 mM EDTA, and 1 μM cell permeant FluoZin-3, AM (ThermoFisher). Following 30 min incubation in the dark, samples were washed and analyzed by flow cytometry (modified from ref (58)). Data were expressed as the mean of fluorescence intensity of gated positive cells.
Nuclear staining for O6-methyl-2-deoxyguanosine was assessed, according to the protocol described in ref (59), with minor modifications. Cell nuclei were isolated with the Nuclei EZ Lysis Buffer (Sigma, NUC-101), according to the procedure for attached cell lines. The isolated nuclei were fixed with 50% methanol for 10 min at room temperature. The DNA of fixed nuclei was denatured with 2 N HCl for 15 min at 37 °C, then neutralized with 0.1 M sodium tetraborate, pH 8.5. Nuclei were stained with the monoclonal antibody to O6-methyl-2-deoxyguanosine (0.2 μg/mL, Squarix Biotechnology) for 2 h at room temperature, followed by the Alexa Fluor 488 goat anti-mouse Ig (1:300, Invitrogen) for 45 min. Nuclei were counterstained with 3 μM propidium iodide for 30 min before analysis. O6-methyl-2-deoxyguanosine fluorescence was calculated on propidium-stained diploid nuclei after subtracting the nonspecific fluorescence of the secondary antibody.
Western Blot Analysis
Western blot analysis was performed on total protein extracts (100 μg/lane) using the following primary antibodies: a mouse anti-Chk1 (Abcam 1:500), a rabbit anti-Chk1 (phospho Ser317) (Abcam 1:100), a rabbit anti-LC3B antibody (Sigma-Aldrich 1:1000), and a mouse anti-β-actin (Sigma, 1:100). We used IRDye secondary antibodies (LI-COR, 1:30,000) for band imaging with the Odyssey Imager.
Statistical Analysis
Quantitative data were expressed as the mean ± standard error (SEM) unless otherwise stated in the figure legends. P values were calculated with Student’s t-test or, for experiments with more than two groups, with analysis of variance, followed by Fisher’s least significant difference (LSD) test. P < 0.05 was considered to be statistically significant. Analysis was carried out using SigmaPlot 12.5.
Acknowledgments
This study was supported by Italian Ministry of University and Research (grant PON02_00607_3621894).
Supporting Information Available
The Supporting Information is available free of charge at https://pubs.acs.org/doi/10.1021/acsomega.9b04483.
Western blot analysis of LC3 in U87 cells, western blot image of phosphorylated chk-1, and flow cytometric analysis of immunostained nuclei for O6-methyl-2-deoxyguanosine (PDF)
Author Contributions
E.R. and A.C conceived the experiments, R.S. conducted the experiments, and R.S. and A.C. analyzed the results.
The authors declare no competing financial interest.
Supplementary Material
References
- Stark A. M.; Nabavi A.; Mehdorn H. M.; Blömer U. Glioblastoma multiforme-report of 267 cases treated at a single institution. Surg. Neurol. 2005, 63, 162–169. 10.1016/j.surneu.2004.01.028. [DOI] [PubMed] [Google Scholar]
- Stupp R.; Weber D. C. The role of radio- and chemotherapy in glioblastoma. Onkologie 2005, 28, 315–317. 10.1159/000085575. [DOI] [PubMed] [Google Scholar]
- Takeda A.; Tamano H.; Enomoto S.; Oku N. Zinc-65 imaging of rat brain tumors. Cancer Res. 2001, 61, 5065–5069. [PubMed] [Google Scholar]
- Lin Y.; Chen Y.; Wang Y.; Yang J.; Zhu V. F.; Liu Y.; et al. ZIP4 is a novel molecular marker for glioma. Neuro Oncol. 2013, 15, 1008–1016. 10.1093/neuonc/not042. [DOI] [PMC free article] [PubMed] [Google Scholar]
- Mehrian-Shai R.; Yalon M.; Simon A. J.; Eyal E.; Pismenyuk T.; Moshe I.; et al. High metallothionein predicts poor survival in glioblastoma multiforme. BMC Med. Genom. 2015, 8, 68. 10.1186/s12920-015-0137-6. [DOI] [PMC free article] [PubMed] [Google Scholar]
- Hiura T.; Khalid H.; Yamashita H.; Tokunaga Y.; Yasunaga A.; Shibata S. Immunohistochemical analysis of metallothionein in astrocytic tumors in relation to tumor grade, proliferative potential, and survival. Cancer 1998, 83, 2361–2369. . [DOI] [PubMed] [Google Scholar]
- Masiulionytė B.; Valiulytė I.; Tamašauskas A.; Skiriutė D. Metallothionein Genes are Highly Expressed in Malignant Astrocytomas and Associated with Patient Survival. Sci. Rep. 2019, 9, 5406. 10.1038/s41598-019-41974-9. [DOI] [PMC free article] [PubMed] [Google Scholar]
- Vasák M. Advances in metallothionein structure and functions. J. Trace Elem. Med. Biol. 2005, 19, 13–17. 10.1016/j.jtemb.2005.03.003. [DOI] [PubMed] [Google Scholar]
- Si M.; Lang J. The roles of metallothioneins in carcinogenesis. J. Hematol. Oncol. 2018, 11, 107. 10.1186/s13045-018-0645-x. [DOI] [PMC free article] [PubMed] [Google Scholar]
- Ryu H.-H.; Jung S.; Jung T.-Y.; et al. Role of metallothionein 1E in the migration and invasion of human glioma cell lines. Int. J. Oncol. 2012, 41, 1305–1313. 10.3892/ijo.2012.1570. [DOI] [PubMed] [Google Scholar]
- Hur H.; Ryu H.-H.; Li C.-H.; Kim I. Y.; Jang W.-Y.; Jung S. Metallothinein 1E Enhances Glioma Invasion through Modulation Matrix Metalloproteinases-2 and 9 in U87MG Mouse Brain Tumor Model. J. Korean Neurosurg. Soc. 2016, 59, 551–558. 10.3340/jkns.2016.59.6.551. [DOI] [PMC free article] [PubMed] [Google Scholar]
- Nagane M.; Shibui S.; Oyama H.; Asai A.; Kuchino Y.; Nomura K. Investigation of chemoresistance-related genes mRNA expression for selecting anticancer agents in successful adjuvant chemotherapy for a case of recurrent glioblastoma. Surg. Neurol. 1995, 44, 462–470. 10.1016/0090-3019(95)00299-5. [DOI] [PubMed] [Google Scholar]
- Maier H.; Jones C.; Jasani B.; Öfner D.; Zelger B.; Schmid K. W.; et al. Metallothionein overexpression in human brain tumours. Acta Neuropathol. 1997, 94, 599–604. 10.1007/s004010050755. [DOI] [PubMed] [Google Scholar]
- Nagane M.; Huang H.-J. S.; Cavenee W. K. Causes of drug resistance and novel therapeutic opportunities for the treatment of glioblastoma. Drug Resist. Updates 1999, 2, 30–37. 10.1054/drup.1998.0062. [DOI] [PubMed] [Google Scholar]
- Tews D. S.; Nissen A.; Külgen C.; Gaumann A. K. A. Drug resistance-associated factors in primary and secondary glioblastomas and their precursor tumors. J. Neuro Oncol. 2000, 50, 227–237. 10.1023/a:1006491405010. [DOI] [PubMed] [Google Scholar]
- Puca R.; Nardinocchi L.; Bossi G.; Sacchi A.; Rechavi G.; Givol D.; et al. Restoring wtp53 activity in HIPK2 depleted MCF7 cells by modulating metallothionein and zinc. Exp. Cell Res. 2009, 315, 67–75. 10.1016/j.yexcr.2008.10.018. [DOI] [PubMed] [Google Scholar]
- Habel N.; Hamidouche Z.; Girault I.; Patiño-García A.; Lecanda F.; Marie P. J.; et al. Zinc chelation: a metallothionein 2A’s mechanism of action involved in osteosarcoma cell death and chemotherapy resistance. Cell Death Dis. 2013, 4, e874 10.1038/cddis.2013.405. [DOI] [PMC free article] [PubMed] [Google Scholar]
- Cho Y. H.; Lee S.-H.; Lee S.-J.; Kim H. N.; Koh J.-Y. A role of metallothionein-3 in radiation-induced autophagy in glioma cells. Sci. Rep. 2020, 10, 2015. 10.1038/s41598-020-58237-7. [DOI] [PMC free article] [PubMed] [Google Scholar]
- Uchida Y. Growth-inhibitory factor, metallothionein-like protein, and neurodegenerative diseases. Biol. Signals 1994, 3, 211–215. 10.1159/000109547. [DOI] [PubMed] [Google Scholar]
- Thirumoorthy N.; Shyam Sunder A.; Manisenthil Kumar K.; Senthil Kumar M.; Ganesh G.; Chatterjee M. A review of metallothionein isoforms and their role in pathophysiology. World J. Surg. Oncol. 2011, 9, 54. 10.1186/1477-7819-9-54. [DOI] [PMC free article] [PubMed] [Google Scholar]
- Cherian M. G.; Apostolova M. D. Nuclear localization of metallothionein during cell proliferation and differentiation. Cell. Mol. Biol. 2000, 46, 347–356. [PubMed] [Google Scholar]
- Lee S.-J.; Koh J.-Y. Roles of zinc and metallothionein-3 in oxidative stress-induced lysosomal dysfunction, cell death, and autophagy in neurons and astrocytes. Mol. Brain 2010, 3, 30. 10.1186/1756-6606-3-30. [DOI] [PMC free article] [PubMed] [Google Scholar]
- Sato M.; Bremner I. Oxygen free radicals and metallothionein. Free Radic. Biol. Med. 1993, 14, 325–337. 10.1016/0891-5849(93)90029-t. [DOI] [PubMed] [Google Scholar]
- Deng D.; El-Rifai W.; Ji J.; et al. Hypermethylation of metallothionein-3 CpG island in gastric carcinoma. Carcinogenesis 2003, 24, 25–29. 10.1093/carcin/24.1.25. [DOI] [PubMed] [Google Scholar]
- Smith E.; Drew P.; Tian Z.-Q.; et al. Metallothionien 3 expression is frequently down-regulated in oesophageal squamous cell carcinoma by DNA methylation. Mol. Canc. 2005, 4, 42. 10.1186/1476-4598-4-42. [DOI] [PMC free article] [PubMed] [Google Scholar]
- Tao Y.-F.; Xu L.-X.; Lu J.; et al. Metallothionein III (MT3) is a putative tumor suppressor gene that is frequently inactivated in pediatric acute myeloid leukemia by promoter hypermethylation. J. Transl. Med. 2014, 12, 182. 10.1186/1479-5876-12-182. [DOI] [PMC free article] [PubMed] [Google Scholar]
- Amoureux M. C.; Wurch T.; Pauwels P. J. Modulation of metallothionein-III mRNA content and growth rate of rat C6-glial cells by transfection with human 5-HT1D receptor genes. Biochem. Biophys. Res. Commun. 1995, 214, 639–645. 10.1006/bbrc.1995.2334. [DOI] [PubMed] [Google Scholar]
- Falnoga I.; Zelenik Pevec A.; Šlejkovec Z.; et al. Arsenic trioxide (ATO) influences the gene expression of metallothioneins in human glioblastoma cells. Biol. Trace Elem. Res. 2012, 149, 331–339. 10.1007/s12011-012-9431-8. [DOI] [PubMed] [Google Scholar]
- Bozym R. A.; Chimienti F.; Giblin L. J.; et al. Free zinc ions outside a narrow concentration range are toxic to a variety of cells in vitro. Exp. Biol. Med. 2010, 235, 741–750. 10.1258/ebm.2010.009258. [DOI] [PMC free article] [PubMed] [Google Scholar]
- Frederickson C. J.; Giblin L. J.; Krężel A.; et al. Concentrations of extracellular free zinc (pZn)e in the central nervous system during simple anesthetization, ischemia and reperfusion. Exp. Neurol. 2006, 198, 285–293. 10.1016/j.expneurol.2005.08.030. [DOI] [PubMed] [Google Scholar]
- Cherian M.; Jayasurya A.; Bay B. H. Metallothioneins in human tumors and potential roles in carcinogenesis. Mutat. Res. 2003, 533, 201–209. 10.1016/j.mrfmmm.2003.07.013. [DOI] [PubMed] [Google Scholar]
- Rosso L.; Brock C. S.; Gallo J. M.; et al. A new model for prediction of drug distribution in tumor and normal tissues: pharmacokinetics of temozolomide in glioma patients. Cancer Res. 2009, 69, 120–127. 10.1158/0008-5472.can-08-2356. [DOI] [PubMed] [Google Scholar]
- Hirose Y.; Berger M. S.; Pieper R. O. P53 effects both the duration of G2/M arrest and the fate of temozolomide-treated human glioblastoma cells. Cancer Res. 2001, 61, 1957–1963. [PubMed] [Google Scholar]
- Sørensen C. S.; Syljuåsen R. G.; Falck J.; Schroeder T.; Rönnstrand L.; Khanna K. K.; et al. Chk1 regulates the S phase checkpoint by coupling the physiological turnover and ionizing radiation-induced accelerated proteolysis of Cdc25A. Cancer Cell 2003, 3, 247–258. 10.1016/s1535-6108(03)00048-5. [DOI] [PubMed] [Google Scholar]
- Mizushima N.; Yoshimori T. How to interpret LC3 immunoblotting. Autophagy 2007, 3, 542–545. 10.4161/auto.4600. [DOI] [PubMed] [Google Scholar]
- Haq F.; Mahoney M.; Koropatnick J. Signaling events for metallothionein induction. Mutat. Res. 2003, 533, 211–226. 10.1016/j.mrfmmm.2003.07.014. [DOI] [PubMed] [Google Scholar]
- Sewell A. K.; Jensen L. T.; Erickson J. C.; Palmiter R. D.; Winge D. R. Bioactivity of metallothionein-3 correlates with its novel beta domain sequence rather than metal binding properties. Biochemistry 1995, 34, 4740–4747. 10.1021/bi00014a031. [DOI] [PubMed] [Google Scholar]
- Palmiter R. D. Constitutive expression of metallothionein-III (MT-III), but not MT-I, inhibits growth when cells become zinc deficient. Toxicol. Appl. Pharmacol. 1995, 135, 139–146. 10.1006/taap.1995.1216. [DOI] [PubMed] [Google Scholar]
- Wang Y.; Zhang S.; Li S. J. Zn(2+) induces apoptosis in human highly metastatic SHG-44 glioma cells, through inhibiting activity of the voltage-gated proton channel Hv1. Biochem. Biophys. Res. Commun. 2013, 438, 312–317. 10.1016/j.bbrc.2013.07.067. [DOI] [PubMed] [Google Scholar]
- Sheline C. T.; Takata T.; Ying H.; Canzoniero L. M.; Yang A.; Yu S. P.; et al. Potassium attenuates zinc-induced death of cultured cortical astrocytes. Glia 2004, 46, 18–27. 10.1002/glia.10313. [DOI] [PubMed] [Google Scholar]
- Wang J.; Han X.; Zhang Y. Autoregulatory mechanisms of phosphorylation of checkpoint kinase 1. Cancer Res. 2012, 72, 3786–3794. 10.1158/0008-5472.can-12-0523. [DOI] [PMC free article] [PubMed] [Google Scholar]
- Sanchez Y.; Wong C.; Thoma R. S.; Richman R.; Wu Z.; Piwnica-Worms H.; et al. Conservation of the Chk1 checkpoint pathway in mammals: linkage of DNA damage to Cdk regulation through Cdc25. Science 1997, 277, 1497–1501. 10.1126/science.277.5331.1497. [DOI] [PubMed] [Google Scholar]
- Zhang Y.; Hunter T. Roles of Chk1 in cell biology and cancer therapy. Int. J. Cancer 2014, 134, 1013–1023. 10.1002/ijc.28226. [DOI] [PMC free article] [PubMed] [Google Scholar]
- Verlinden L.; Vanden Bempt I.; Eelen G.; Drijkoningen M.; Verlinden I.; Marchal K.; et al. The E2F-regulated gene Chk1 is highly expressed in triple-negative estrogen receptor/progesterone receptor/HER-2 breast carcinomas. Cancer Res. 2007, 67, 6574–6581. 10.1158/0008-5472.can-06-3545. [DOI] [PubMed] [Google Scholar]
- Merry C.; Fu K.; Wang J.; Yeh I.-J.; Zhang Y. Targeting the checkpoint kinase Chk1 in cancer therapy. Cell Cycle 2010, 9, 279–283. 10.4161/cc.9.2.10445. [DOI] [PMC free article] [PubMed] [Google Scholar]
- Park C.; Suh Y.; Cuervo A. M. Regulated degradation of Chk1 by chaperone-mediated autophagy in response to DNA damage. Nat. Commun. 2015, 6, 6823. 10.1038/ncomms7823. [DOI] [PMC free article] [PubMed] [Google Scholar]
- Zhang Y.-W.; Otterness D. M.; Chiang G. G.; Xie W.; Liu Y.-C.; Mercurio F.; et al. Genotoxic stress targets human Chk1 for degradation by the ubiquitin-proteasome pathway. Mol. Cell 2005, 19, 607–618. 10.1016/j.molcel.2005.07.019. [DOI] [PubMed] [Google Scholar]
- Friedman H. S.; Kerby T.; Calvert H. Temozolomide and treatment of malignant glioma. Clin. Cancer Res. 2000, 6, 2585–2597. [PubMed] [Google Scholar]
- Weller M.; Stupp R.; Reifenberger G.; Brandes A. A.; van den Bent M. J.; Wick W.; et al. MGMT promoter methylation in malignant gliomas: ready for personalized medicine?. Nat. Rev. Neurol. 2010, 6, 39–51. 10.1038/nrneurol.2009.197. [DOI] [PubMed] [Google Scholar]
- Wang X.; Chen J.-x.; Liu Y.-h.; You C.; Mao Q. Mutant TP53 enhances the resistance of glioblastoma cells to temozolomide by up-regulating O(6)-methylguanine DNA-methyltransferase. Neurol. Sci. 2013, 34, 1421–1428. 10.1007/s10072-012-1257-9. [DOI] [PubMed] [Google Scholar]
- Yi G.-z.; Huang G.; Guo M.; et al. Acquired temozolomide resistance in MGMT-deficient glioblastoma cells is associated with regulation of DNA repair by DHC2. Brain 2019, 142, 2352–2366. 10.1093/brain/awz202. [DOI] [PMC free article] [PubMed] [Google Scholar]
- Hidalgo J.; Aschner M.; Zatta P.; Vašák M. Roles of the metallothionein family of proteins in the central nervous system. Brain Res. Bull. 2001, 55, 133–145. 10.1016/s0361-9230(01)00452-x. [DOI] [PubMed] [Google Scholar]
- Romero-Isart N.; Jensen L. T.; Zerbe O.; Winge D. R.; Vašák M. Engineering of metallothionein-3 neuroinhibitory activity into the inactive isoform metallothionein-1. J. Biol. Chem. 2002, 277, 37023–37028. 10.1074/jbc.m205730200. [DOI] [PubMed] [Google Scholar]
- Ebadi M.; Iversen P. L. Metallothionein in carcinogenesis and cancer chemotherapy. Gen. Pharmacol. 1994, 25, 1297–1310. 10.1016/0306-3623(94)90152-x. [DOI] [PubMed] [Google Scholar]
- Livak K. J.; Schmittgen T. D. Analysis of relative gene expression data using real-time quantitative PCR and the 2(-Delta Delta C(T)) Method. Methods 2001, 25, 402–408. 10.1006/meth.2001.1262. [DOI] [PubMed] [Google Scholar]
- Copani A.; Condorelli F.; Caruso A.; Vancheri C.; Sala A.; Giuffrida Stella A. M.; et al. Mitotic signaling by beta-amyloid causes neuronal death. FASEB J. 1993, 13, 2225–2234. 10.1096/fasebj.13.15.2225. [DOI] [PubMed] [Google Scholar]
- Zamai L.; Falcieri E.; Zauli G.; Cataldi A.; Vitale M. Optimal detection of apoptosis by flow cytometry depends on cell morphology. Cytometry 1993, 14, 891–897. 10.1002/cyto.990140807. [DOI] [PubMed] [Google Scholar]
- Jayaraman S. A novel method for the detection of viable human pancreatic beta cells by flow cytometry using fluorophores that selectively detect labile zinc, mitochondrial membrane potential and protein thiols. Cytometry, Part A 2008, 73, 615–625. 10.1002/cyto.a.20560. [DOI] [PubMed] [Google Scholar]
- Shinozaki R.; Inoue S.; Choi K.-S. Flow cytometric measurement of benzo[a]pyrene-diol-epoxide-DNA adducts in normal human peripheral lymphocytes and cultured human lung cancer cells. Cytometry 1998, 31, 300–306. . [DOI] [PubMed] [Google Scholar]
Associated Data
This section collects any data citations, data availability statements, or supplementary materials included in this article.


