

Abstract
Lesion size and location affect the magnitude of impairment and recovery following stroke, but the precise relationship between these variables and functional outcome is unknown. Herein, we systematically varied the size of strokes in motor cortex and surrounding regions to assess effects on impairment and recovery of function. Female Sprague Dawley rats (N = 64) were evaluated for skilled reaching, spontaneous limb use, and limb placement over a 7 week period after stroke. Exploration and reaching were also tested in a free ranging, more naturalistic, environment. MRI voxel-based analysis of injury volume and its likelihood of including the caudal forelimb area (CFA), rostral forelimb area (RFA), hindlimb (HL) cortex (based on intracranial microstimulation), or their bordering regions were related to both impairment and recovery. Severity of impairment on each task was best predicted by injury in unique regions: impaired reaching, by damage in voxels encompassing CFA/RFA; hindlimb placement, by damage in HL; and spontaneous forelimb use, by damage in CFA. An entirely different set of voxels predicted recovery of function: damage lateral to RFA reduced recovery of reaching, damage medial to HL reduced recovery of hindlimb placing, and damage lateral to CFA reduced recovery of spontaneous limb use. Precise lesion location is an important, but heretofore relatively neglected, prognostic factor in both preclinical and clinical stroke studies, especially those using region-specific therapies, such as transcranial magnetic stimulation.
SIGNIFICANCE STATEMENT By estimating lesion location relative to cortical motor representations, we established the relationship between individualized lesion location, and functional impairment and recovery in reaching/grasping, spontaneous limb use, and hindlimb placement during walking. We confirmed that stroke results in impairments to specific motor domains linked to the damaged cortical subregion and that damage encroaching on adjacent regions reduces the ability to recover from initial lesion-induced impairments. Each motor domain encompasses unique brain regions that are most associated with recovery and likely represent targets where beneficial reorganization is taking place. Future clinical trials should use individualized therapies (e.g., transcranial magnetic stimulation, intracerebral stem/progenitor cells) that consider precise lesion location and the specific functional impairments of each subject since these variables can markedly affect therapeutic efficacy.
Keywords: biomarkers, lesion location, lesion size, motor representations, recovery, stroke
Introduction
The ability to predict patients' potential for poststroke recovery is of utmost importance for developing more effective, individualized therapies (Boyd et al., 2017; Stinear et al., 2017). Research in this area suggests that poststroke “biomarkers” could reveal an individual patient's propensity for recovery. For example, early motor impairment (Prabhakaran et al., 2008; Krakauer and Marshall, 2015; Winters et al., 2015), structural and neurophysiological biomarkers, such as integrity of the corticospinal tract, and presence of motor evoked potentials, have been used successfully to predict outcome in subpopulations of stroke patients (Byblow et al., 2015; Feng et al., 2015). However, no single outcome measure reliably predicts recovery in all patients (B. Kim and Winstein, 2017). Instead, combining different biomarkers better predicts recovery across a larger spectrum of stroke patients. Accordingly, Stinear et al. (2012) first developed the Predict Recovery Potential algorithm based on clinical and neurologic outcomes. More recently, the Predict Recovery Potential 2 algorithm has shown improved accuracy, predicting 3 month recovery in ∼75% of patients (Stinear et al., 2017). However, clinical studies have several shortcomings, including an inability to directly gauge the influence of rehabilitation on recovery (Stinear et al., 2020). For example, while some meta-analyses have hinted at a dose-response effect of rehabilitation on recovery (Lohse et al., 2014; Lang et al., 2015), the evidence is not compelling (Winstein et al., 2016; Krakauer and Carmichael, 2017; Bernhardt et al., 2019; Dalton et al., 2019; Stinear et al., 2020). Furthermore, previous biomarker studies include relatively few severely impaired patients (Winters et al., 2015; Stinear et al., 2017), potentially limiting generalization of the findings to this important population.
We previously addressed these issues in a large cohort of rats with strokes in different brain regions that included many animals with severe impairments on a skilled reaching task (Jeffers et al., 2018a,b). As in human studies, the initial skilled reaching impairments predicted the final level of recovery, but only in a subpopulation of animals. We then developed an algorithm based on animals' initial impairment, infarct size, and whether they received an effective dose of rehabilitation. This combination of biomarkers more accurately predicted final outcome than initial impairment alone, including animals with profound impairments (Jeffers et al., 2018b). In a subsequent rodent study, the extent of poststroke impairment and recovery varied in relation to both cortical versus subcortical lesion location and the functional domain assessed (Karthikeyan et al., 2019), suggesting that lesion location may influence the level of recovery. In humans, both lesion location and volume have been shown to affect recovery (Chen et al., 2000), but volume, without consideration for location, is a relatively poor predictor of recovery (Chen et al., 2000; Page et al., 2013). In contrast, others have reported that location of stroke is not related to long-term outcome (Dromerick and Reding, 1995; Hayward et al., 2017). Such inconsistency is not surprising given that most clinical studies classify lesion location without regard to important functional subdivisions within brain regions (Dromerick and Reding, 1995; Edwardson et al., 2017; Hayward et al., 2017; Harvey et al., 2018). In a recent international consensus paper (Boyd et al., 2017), the authors recommended that investigating lesion location as a potential biomarker of stroke recovery should be a research priority. In the present study, we systematically varied lesion size, and then precisely mapped lesion location relative to the hindlimb (HL), caudal forelimb (CFA), and rostral forelimb (RFA) motor areas in a rat model of stroke. We examined relationships between lesion location, impairments, and subsequent recovery of different motor domains, including reaching/grasping, spontaneous forelimb use, limb placement and balance, and general activity in a seminaturalistic environment.
As expected, impairments in specific motor domains were linked to the cortical subregion damaged. However, depending on the specific task, damage to spatially unique regions of peri-infarct cortex reduced the ability to recover. Our results suggest that lesion location, a relatively neglected prognostic biomarker, is an important predictor of poststroke recovery that should be considered in the design of new therapeutic approaches that target brain plasticity, such as transcranial magnetic stimulation.
Materials and Methods
Experimental design
Female Sprague Dawley rats (N = 64, Charles River) weighing 200-225 g on arrival were trained and tested on a battery of motor tasks under 12/12 h reverse day/night conditions and randomly assigned to stroke (n = 44) or sham groups (n = 20). Females were used because, with the prolonged poststroke testing period, male rats tend to outgrow the size of several behavioral testing chambers. Photothrombosis was used to create lesions of varying size and location around the CFA, RFA, and HL motor areas. Lesion size and location were quantified from T2-weighted MRI stacks, and motor performance was assessed 1 week before stroke and 1, 3, 5, and 7 weeks after stroke (Fig. 1). These measures have previously been shown to strongly correlate with lesion volumes acquired using histologic reconstruction (Peeling et al., 2001). Multiple linear regressions were used to relate the size and location of brain injury to the corresponding behavioral impairments. All experimental procedures were approved by the institutional animal care committee of the University of Ottawa and comply with guidelines set by the Canadian Council of Animal Care.
Figure 1.
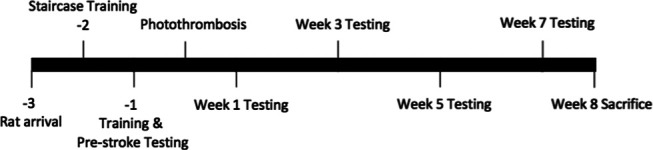
Experimental timeline. All time points are shown as weeks relative to photothrombosis surgery.
Stroke induction
Strokes of varying size were generated using cold-light photothrombosis and a range of aluminum foil illumination apertures with the following dimensions: 2.5 × 2.5 mm (n = 9), 3.0 × 5.0 mm (n = 11), 5.0 × 7.5 mm (n = 12), and a 10.0 mm circular diameter (n = 12; no aperture). Briefly, rats were anesthetized using isoflurane (4% induction, 2% maintenance, in 100% O2 given at 1.6 L/min) and received a midline scalp incision. Illumination apertures were aligned to bregma and the midline of the skull, with the light source placed over the skull at 2.3 mm anterior and ±2.5 mm lateral to bregma. Individual differences in the vascular topography led to natural variance in the exact area damaged by the procedure. The hemisphere contralateral to each rat's dominant paw in the staircase task (preferred paw) was selected for stroke induction. Rats were injected with 20 mg/kg Rose Bengal in a 0.9% NaCl solution via the tail vein. Two minutes after Rose Bengal injection, the light (Intralux 5100, Harvard Apparatus) was turned on for 10 min, illuminating the brain through the intact skull and generating a unilateral focal lesion. Following incision closure, 0.2 ml of bupivacaine was applied along the sutures as a topical analgesic. The sham group received a control injection of 0.9% NaCl and underwent the same lesion induction procedures as the stroke group.
Infarct quantification
Forty-eight hours following surgery, MRI scans were used to confirm presence of stroke and quantify infarct volume and location relative to the CFA, RFA, and HL motor representations. Infarct volume measured at this time is strongly correlated with final infarct volume from histologic assessment (Biernaskie et al., 2001; Karthikeyan et al., 2019). Rats were anesthetized using isoflurane (4% induction, 2% maintenance, 1.6 L/min O2) and moved into the MRI bore (7T General Electric/Agilent MR901 small-animal scanner). T2-weighted structural images were obtained using the following parameters: 21 coronal slices; slice thickness = 800 µm; in-plane resolution = 132.8 µm; echo train = 8; echo time = 27 ms; scan time = 5 min. MRI stacks were analyzed using ImageJ (National Institute of Health) to verify that infarcts were present following surgery. No lesion was observable in 3 rats using the 2.5 × 2.5 mm and 1 rat using the 3.0 × 5.0 mm aperture. Additionally, no significant decrease in performance on any behavioral task was observed from the prestroke to 1 week poststroke time points in these rats. Consequently, they were reassigned to the sham group, resulting in the final number of animals per group previously described.
An experimenter experienced in infarct volume segmentation and blind to illumination aperture size manually delineated the infarcted tissue in each section based on visual identification of the high-contrast area of the cortex. The workflow for this segmentation was assisted using a custom ImageJ script, but the segmentation itself was manually determined by the experimenter (see Extended Data Fig. 2-1). This script was used to determine the voxelwise location and volume of infarcted tissue within each animal (Fig. 2). Briefly, a stack of MRI images for each animal was imported into ImageJ and viewed in the coronal plane. The experimenter used the midline of the brain as a reference point to rotate each stack into the correct coronal orientation and identified the posterior-most section where the anterior commissure crossed the midline. The voxel in the center of the anterior commissure in this section was manually selected, and the stack was transposed so that this voxel was centered in the image space and designated as the origin voxel (0, 0, 0) for purposes of determining the relative location of all other voxels in right-anterior-superior orientation. This anterior commissure coordinate also corresponds to the commonly used bregma skull landmark in the rat (Papp et al., 2014). The experimenter was then sequentially presented with each image in the stack and instructed to delineate the infarct boundary using the polygon tool in ImageJ (Fig. 2A). Voxels in contact and within this boundary were designated as infarcted tissue, and those outside it as noninfarcted tissue. The volume of infarcted voxels and their position relative to the origin voxel provided a three-dimensional, whole-brain, representation of infarct size and location in each animal (Fig. 2B,C). For alignment of the lesion with the motor maps (see below; Fig. 2D), this three-dimensional representation was reduced to a two-dimensional lesion map in the horizontal plane by summing the infarcted voxels along the superior-inferior axis for each given anteroposterior/right-left coordinate.
Figure 2.

A, Example T2-weighted MRI coronal slice from the slice 2.4 mm anterior to bregma in animals with the maximum (155.5 mm3), closest to the mean (68.9 mm3), and minimum (5.7 mm3) infarct volumes, respectively. B, Total infarct volumes of all animals that received strokes. Mean infarct volume ± SD was 70.6 ± 46.6 mm3. C, Anteroposterior distribution of infarct volume relative to bregma. Black line indicates the mean infarct volume at a given coordinate. Gray dots represent the infarct volumes of individual animals at a given AP coordinate. D, Longitudinal-plane heat map showing mean distribution of infarct location within the stroke group. Black outlines in the left, middle, and right of the image indicate position of the coherence region of the HL, CFA, and RFA, respectively. These boundaries were determined by ICMS mapping in age-, sex-, and strain-matched rats. Infarct location in all animals was centered on these motor regions. The brightness of each square represents the mean infarct volume across all animals with stroke within the DV column of injury at a given AP and ML coordinate. A-D, N = 44. ImageJ script for assessing infarct volume and location can be found in Extended Data Figure 2-1.
Behavior testing
Staircase
The staircase reaching task was used as a test of fine motor dexterity (Montoya et al., 1991). Each side of the staircase contained 7 wells with three food reward pellets each (5TUL, TestDiet). Rats were food-restricted (14 g/rat/day) the day before testing to encourage reaching. Each training/testing day consisted of two, 15 min trials separated by 4 h. Rats were trained on the staircase for 10 consecutive days, with the last 2 d used as the prestroke data. Poststroke testing consisted of 3 d of consecutive testing with the final 2 d of data used to represent each time point.
Cylinder
An open transparent Plexiglas cylinder (diameter: 20 cm; height: 30 cm) was placed on a plastic support with a camera to record from below (Schallert et al., 2000). This test detects asymmetries in spontaneous limb use following stroke as the animals rear to explore the environment. As such, it provides a measure of whether the animals actually use the impaired limb in a seminaturalistic setting or instead compensate by relying on the unimpaired limb (Corbett et al., 2017; Balkaya et al., 2018). Rats were recorded until they had reared and touched the cylinder wall with a forelimb 20 times. The number of times the subject supported its body weight using the left paw, right paw, or bilaterally was quantified from slow-motion replay of each session. The results were used to calculate the relative impaired paw usage in the cylinder as a ratio using the following equation:
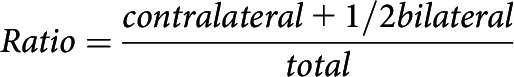 |
Where contralateral is the number of times the rat used the impaired paw to contact the cylinder wall, bilateral is the number of times the rat used both paws simultaneously for wall contact, and total is the total number of times the rat contacted the cylinder wall with a paw during rearing.
Beam
A tapered beam (90 cm length × (5.3 cm – 0.5 cm width)) with 1.0 cm ledge and a black goal box situated at the narrow end of the beam was used to quantify paw placement accuracy during walking (Schallert et al., 2002). This test is sensitive at detecting impairments in limb placement, especially of the hindlimb, and balance (Corbett et al., 2017; Balkaya et al., 2018). Each test period consisted of four trials per rat that were filmed using a wide-angle camera. Each trial was scored from slow-motion replay of recorded videos by counting the number of steps taken and number of foot faults where the rat stepped down to the lower ledge of the beam. The percentage of successful steps for each limb were individually calculated as follows:
 |
Where the total number of errors is the sum of errors across all four trials for the time point, and total number of steps is the sum of steps across all four trials for the time point.
Quantification of spontaneous activities, socialization, and limb use
General activity, socialization, and spontaneous limb use were measured in a free-ranging environment consisting of a custom-designed series of four connected PhenoTyper (Noldus Information Technology) cages (Fig. 3). These PhenoTypers were arranged so that pairs of rats were separately able to explore two cages (Cage 1 + 2, Cage 3 + 4), while still able to maintain social contact with their cage-mate in the “social zone.” Each rat had access to standard rodent chow, water, two infrared-transmitting shelters, and a pellet tray. The pellet tray was placed on the exterior of the cages in which the rat could gain access to pellets by reaching through one of two slits. Each slit only allowed the use of either the right or the left limb, allowing quantification of the spontaneous use of each limb throughout the task period. Each pellet tray had two wells that held 4.0 g of pellets each. Cages contained Regular Texture Pelleted PAPERCHIP (Sheppard Specialty Papers) as bedding that also helped to absorb the IR lighting and improve detection of each animal. Cage-mates were placed into their respective cages in the PhenoTyper where activities were tracked using EthovisionXT (Noldus Information Technology) for a 1 h period at each behavioral test point. Pellet consumption with each limb, the proportion of time spent in each zone of interest, and total distance traveled by each animal were quantified using this software. Only the subgroup of rats that received the 10.0 mm circular diameter lesion type were analyzed in this task (sham = 12, stroke = 12).
Figure 3.
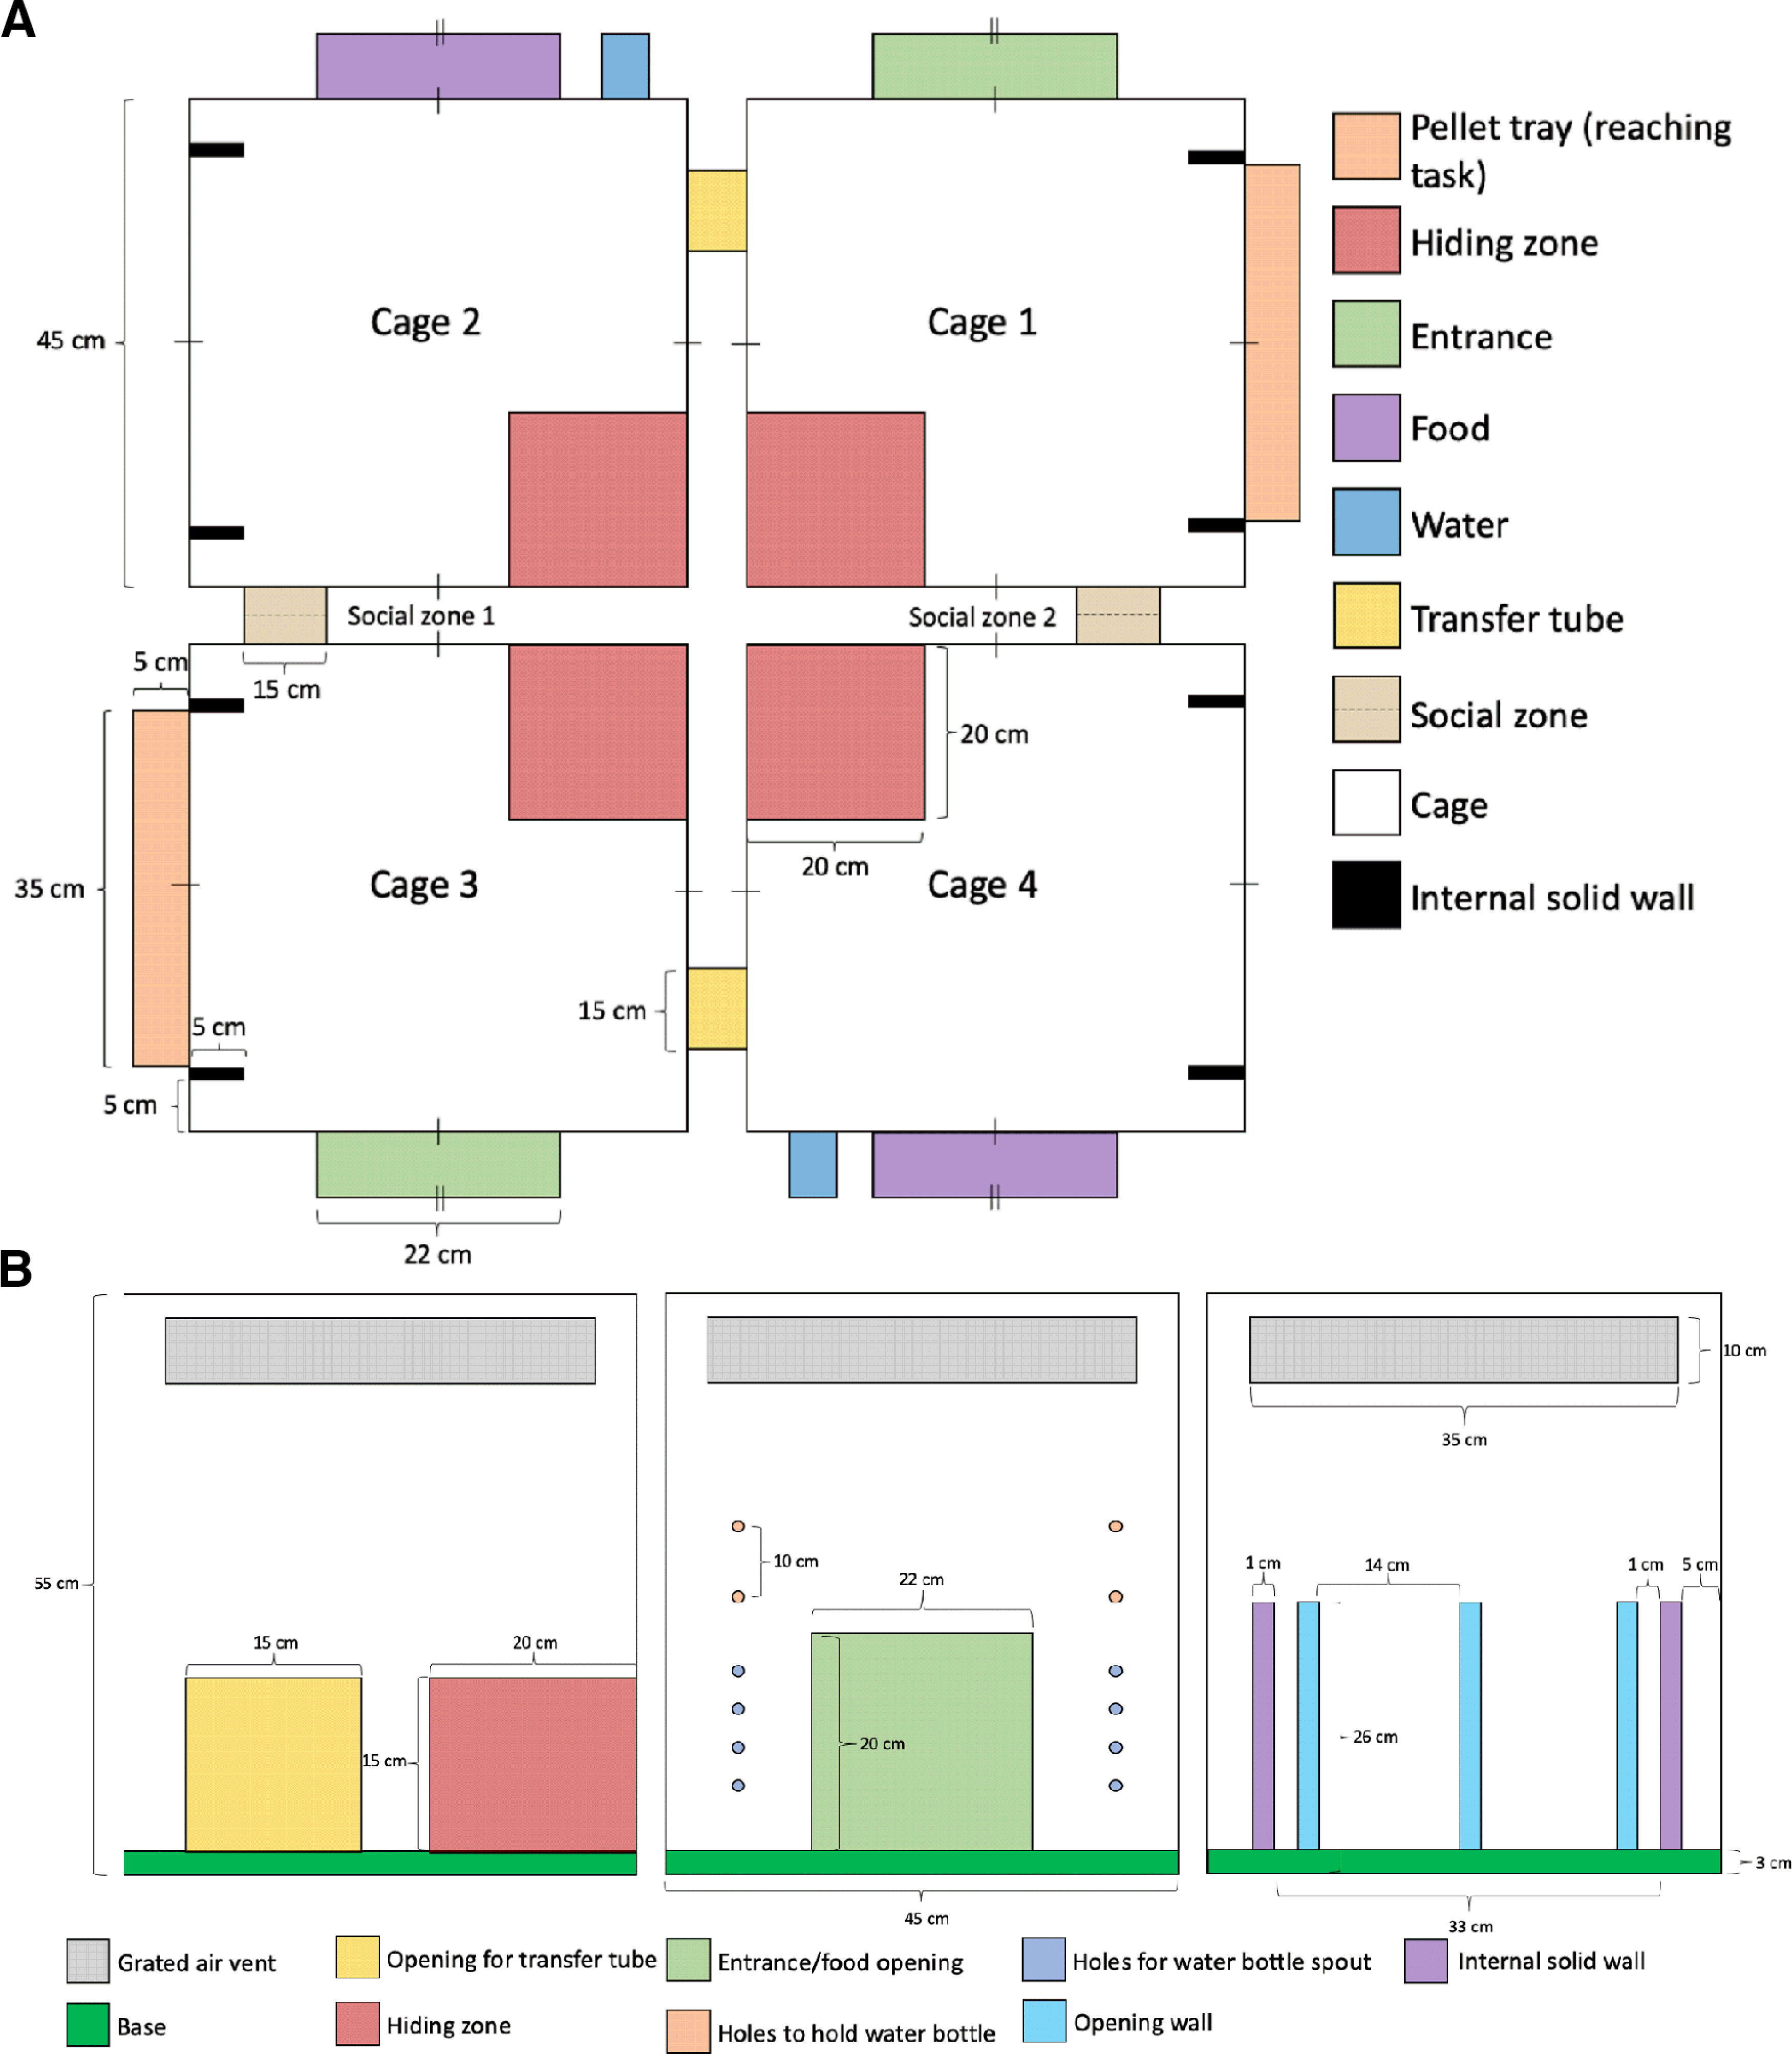
A, Top-down view of the full PhenoTyper arena. Roof-mounted infrared cameras allowed tracking of rat position across the ROIs shown in the legend. Rats were placed into the PhenoTyper in pairs, with 1 rat able to access Cage 1 and Cage 2 via the transfer tube, and its cage-mate able to access Cage 3 and Cage 4 via a similar tube. Cage-mates could interact with each other via the tube in Social Zones 1 and 2 but could not cross into each other's cage due to wire bars slotted through the social tube. B, Side view of each of the PhenoTyper walls. A recessed tray on the outside of the cage allowed spontaneous limb use to obtain food rewards. Interior walls limited rats to reaching for the right-hand tray with their right paw, and the left-hand tray with their left paw, so that use of the impaired and nonimpaired limbs could be determined.
Death and collection
Rats were killed at week 8 after surgery by intraperitoneal injection of Euthanyl (1.0 ml, 65 mg/ml). Death was confirmed by cardiac perfusion with heparinized saline (20 ml/minute) for 5 min followed by 4% PFA (20 ml/minute) for 5 min. Rats were decapitated using a rodent guillotine and their heads placed in 4% PFA. Twenty-four hours after death, brains were removed from skulls and placed 4% PFA.
Composite motor map of female Sprague Dawley rats
To evaluate the location of the lesions in relation to movement representations in the motor cortex, we coregistered the location of voxels affected by the lesion in the MRI data with a “composite motor map” based on intracortical microstimulation (ICMS) data collected in naive-, age-, and sex-matched, Sprague Dawley rats (N = 16). Mapping experiments were conducted as previously described (Dancause et al., 2008; Deffeyes et al., 2015; Dea et al., 2016) to cumulate 10 motor maps of RFA, CFA, and HL. For each animal, anesthesia was induced with an initial intraperitoneal injection of 80 mg/kg of ketamine hydrochloride (Ketaset; Pfizer) and maintained during the surgical procedures with 2% isoflurane (Furane; Baxter) in 100% oxygen. Animals received injections of dexamethasone (1 mg/kg, i.m.) to reduce inflammation and saline (5 ml/kg/h, s.c.) to maintain hydration over the experimental procedure. Animal body temperature was maintained near 36.5°C throughout the surgery with a homeothermic blanket (Harvard Apparatus). A craniotomy and durectomy were performed to expose the representations of the motor cortex. The opening was covered with mineral oil to protect the cortex. An incision of the cisterna magna was made to drain cerebrospinal fluid to lower intracranial pressure and reopened as needed when cerebral swelling was observed. After the surgical procedures, the anesthesia was turned off and the animals transitioned to ketamine sedation (3-5 mg/kg/10 min; intraperitoneal) for the collection of physiological data.
A high-resolution digital photograph of the cortex was used to record the locations of electrode penetrations with an image-processing software (Canvas, version 11; ACD Systems). The picture included bregma and a small ruler to allow the alignment of motor maps across animals and ensure consistent scaling. ICMS mapping was conducted using an interpenetration distance of ∼333 µm. At each cortical penetration site, a glass-insulated tungsten microelectrode (∼500 kΩ) was lowered into the cortex to a depth of 1500-1600 μm to target layer V neurons. A stimulation train consisted of 13 monophasic square pulses (0.2 ms duration; 3.3 ms interpulse interval), and trains were delivered at 1 Hz from an electrically isolated, constant current stimulator (BAK Electronics). Stimulation intensity was progressively increased, and the movement evoked at threshold current intensity (the current at which movements were evoked by 50% of the stimulation trains) was identified and used for subsequent analyses. Movements were categorized as forelimb, hindlimb, neck, vibrissae, or mouth (jaw or tongue movements). If no movement was evoked at a maximum current intensity of 100 μA, the site was defined as unresponsive.
Custom-made MATLAB codes (MathWorks) were used for ICMS map analyses. First, motor maps of individual control animals were reconstructed using an algorithm that expanded the specific color assigned to the response type (i.e., CFA, RFA, HL, trunk, vibrissae, or no response) from each electrode penetration site on the map to neighboring pixels using nearest-neighbor interpolation until all pixels were assigned a color (Touvykine et al., 2016). Pixelated reconstructions were then transformed into vector images and scaled to the calibration ruler placed on the top of brain during ICMS data collection. Using bregma as the origin (0, 0), each vector-based ICMS map was rotated so that the midline of the skull was aligned with the x axis (horizontal axis of the classical Cartesian plane) oriented in the same way as in Figure 2D. Vector-based images were converted back to pixel image (pixel size: 0.1328 mm AP × 0.1328 mm ML) to match the ML resolution of the MRI scan. Then, to match the AP resolution of MRI scans (pixel size: 0.8 mm AP × 0.1328 mm ML), the pixelated ICMS maps were downsampled in the AP axis using linear interpolation. Downsampled ICMS maps of all animals were combined and superimposed on top of each other to reveal the cortical regions from which movements were consistently evoked across multiple rats. The zone with maximal overlap included all 10 rats for the CFA, 8 of 10 rats for the HL, and 6 of the 10 rats for RFA. For subsequent analyses, cortical territory consistently evoking movements in ≥50% of the maximal overlap was defined as “region of coherence” for each motor representation. Accordingly, the region of coherence corresponds to cortical territory that consistently evoked movements in ≥5 animals for CFA (surface area, 4.99 mm2) and ≥4 animals for HL (3.51 mm2), and in ≥3 animals for RFA (1.49 mm2). The cortex was further arbitrarily subdivided into 6 ROIs around the regions of coherence: medial to RFA (surface area: 9.03 mm2), lateral to RFA (12.43 mm2), medial to CFA (8.60 mm2), lateral to CFA (8.82 mm2), medial to HL (9.88 mm2), and lateral to HL (15.93 mm2). The resulting composite ICMS map and infarct map from the MRI with matching pixel resolutions were aligned using the origin pixels of the MRI lesion in the horizontal plane (posterior point of anterior commissure = 0, 0) and the composite ICMS map in the horizontal plane (bregma = 0, 0). The infarct volume of each pixel within regions of coherence of CFA, RFA, HL, as well as each adjacent subregion of interest was calculated from the aligned horizontal plane infarct map (Fig. 2D). Infarct volumes of all pixels within a given subregion were summed to provide a total subregional infarct volume that was used for regression modeling to relate injury location to impairment and recovery on the motor tasks previously described.
Statistical analysis
All analyses were conducted for the limb contralateral to the injured hemisphere (i.e., the impaired limb). Analysis of behavioral data used repeated-measures ANOVA with time (across weeks for all analyses) and zone (for only the PhenoTyper analysis) as within-subject variables and group (stroke vs sham) as a between-subject variable. The Greenhouse-Geisser correction was applied when assumptions of sphericity were violated. Sidak-corrected t tests were used for post hoc analysis with α = 0.05 used to define all statistically significant differences. Multiple linear regressions were used to predict individual animal performance at week 1 (initial impairment) and week 7 (performance with spontaneous recovery) after stroke based on the size and location of each animal's brain lesion. As described in the previous section, infarct volumes within each subregion of the composite motor map were entered as predictor variables for linear regressions (total infarct volume and infarct volume in the following subregions: medial to HL, lateral to HL, HL, medial to CFA, lateral to CFA, CFA, medial to RFA, lateral to RFA, RFA; entry criterion: p ≤ 0.05; removal criterion: p ≥ 0.10). Performance in each of the motor behaviors (staircase, cylinder, beam forelimb, beam hindlimb, pellet retrieval in PhenoTyper) was used as the determinants in the regression model. All analyses were conducted using SPSS Statistics version 25 (IBM). All data are presented as group mean ± SE.
Results
Infarct volume and location
The cold light photothrombosis procedure created a lesion in ∼92% of subjects (n = 44 of 48). The use of multiple light apertures to restrict lesion size resulted in an even distribution of small to large infarcts (5.7-155.5 mm3) with a mean of 70.6 ± 7.03 mm3 (Fig. 2A,B). The maximum range of anteroposterior injury across all animals was from 7.2 to −3.2 mm relative to bregma (Fig. 2C). Injury volume was primarily centered around RFA, CFA, and HL (Fig. 2D). The range of lesion sizes and differential impact on forelimb, HL, and surrounding brain regions across animals provided an excellent sample for relating lesion characteristics to impairment and recovery on a battery of motor outcomes and to make predictions of the behavioral effects of stroke at the individual level (see Figs. 4–11).
Figure 4.

A, Staircase task. The rat must reach downward to grasp and retrieve pellets that are increasingly more distant from the animal as the step decreases. B, Mean performance (black lines) of rats with stroke was significantly worse than shams at all times after stroke. C, D, Initial poststroke impairment (pellet retrieval at week 1) was best predicted by the sum of damage to the CFA and RFA (highlighted red). E, F, In contrast, the adjacent region lateral to RFA was the best predictor of pellet retrieval at week 7. Full regression parameters are shown in Table 1. N = 64 (sham = 20, stroke = 44). *p < 0.05.
Figure 11.
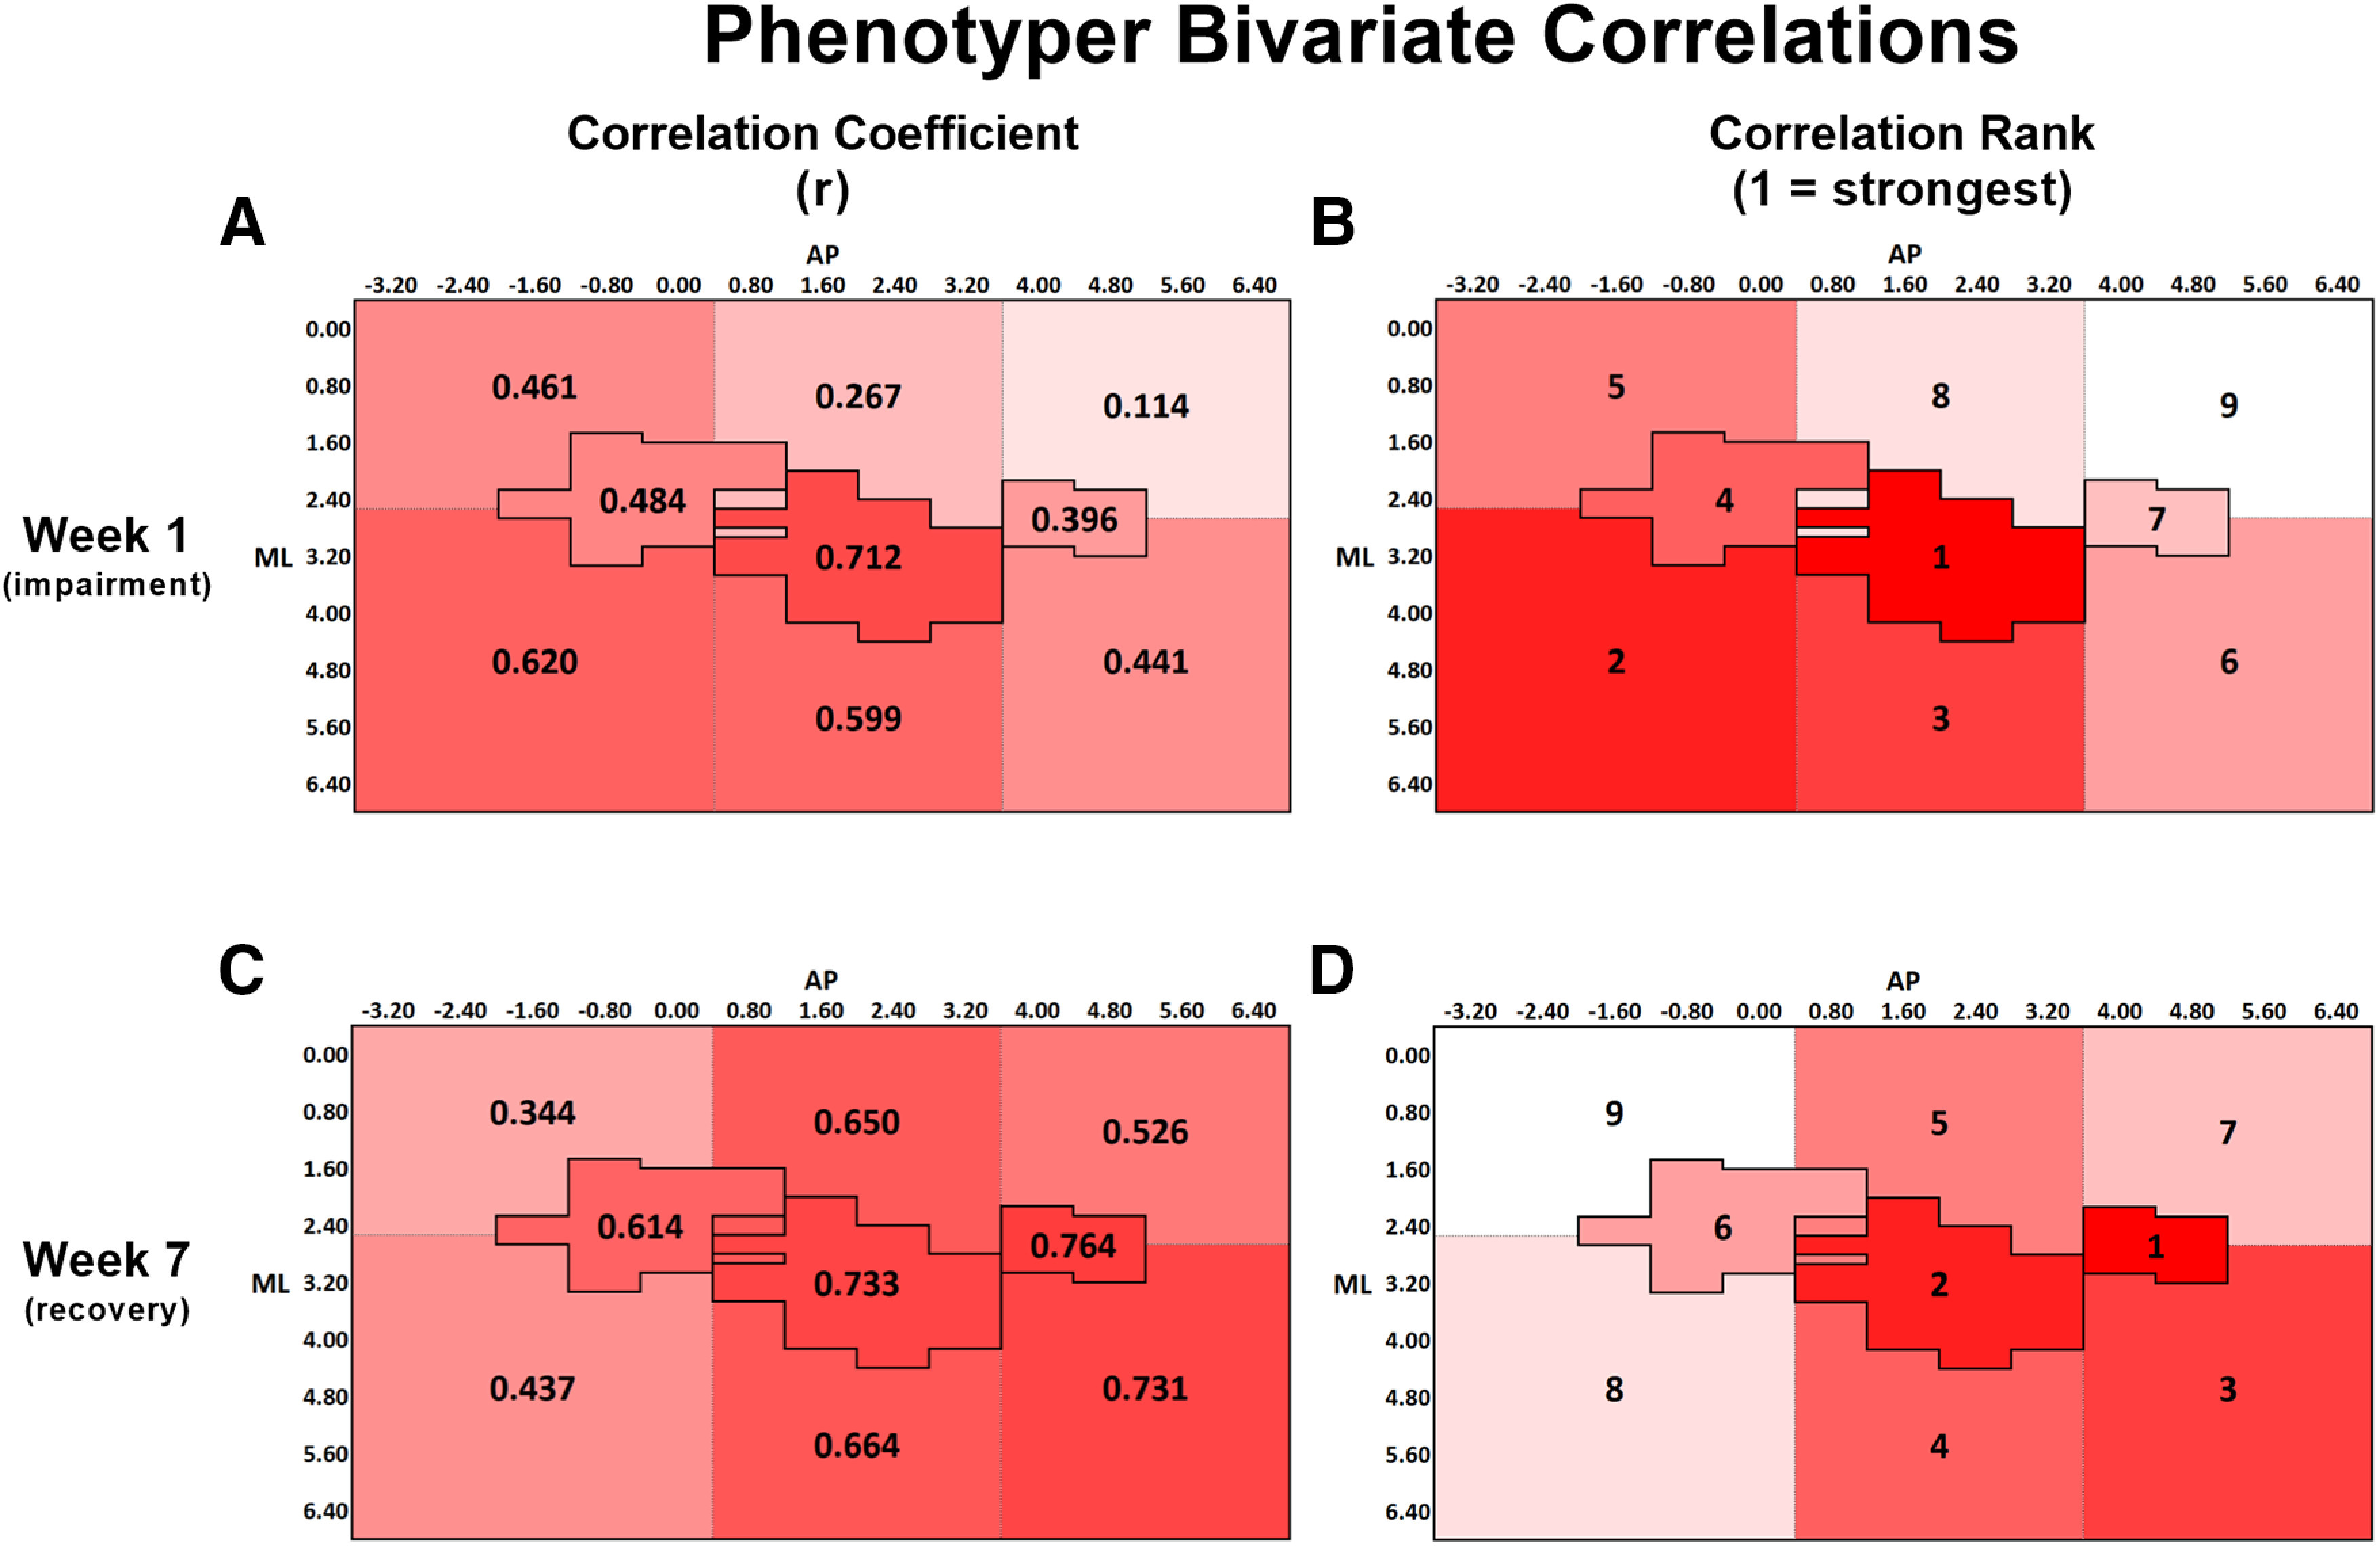
A, Bivariate Pearson correlation coefficients (r) between pellets remaining in the PhenoTyper at week 1 and lesion volume within each ROI. B, Rank order of correlation coefficients from A, with 1 indicating the strongest correlation and 9 indicating the weakest correlation. At week 1, the correlations for CFA and the regions lateral to both CFA and HL were significant at the p < 0.05 level (Table 2). C, Bivariate correlation coefficient between pellets remaining in the PhenoTyper at week 7 and lesion volume within each ROI. D, Rank order of correlation coefficients from C, with the same ranking structure as previously described. At week 7, all regions, except for the region medial to RFA and both the regions medial and lateral to HL, were significant at the p < 0.05 level (Table 2). A-D, The change in spatial relationship between infarct volume and pellets remaining in the PhenoTyper from week 1 to week 7, with infarct volume in the regions surrounding CFA both medially and laterally, as well as RFA and the region lateral to RFA more strongly predicting performance at week 7 than at week 1. A-D, Darker red represents stronger correlations between variables.
ImageJ macro script to assist manual infarct volume size/location quantification. Download Figure 2-1, ZIP file (4.6KB, zip)
Staircase
Photothrombotic stroke resulted in significant group impairments in pellet grasping and retrieval in the staircase task at all poststroke weeks (F(4,248) = 24.213, p < 0.001; Fig. 4A,B). The mean difference in pellet retrieval between sham and stroke rats at the poststroke time points was 5.68 ± 0.99 pellets. Multiple linear regression indicated that the sum of damage in both the CFA and RFA was most predictive of staircase performance at week 1 after stroke (R = 0.784; R2adj = 0.595; p < 0.001; Tables 1, 2; Figs. 4C,D, 5A,B). In contrast, at week 7 after stroke, the sum of damage to the CFA and the adjacent region lateral to RFA were the subregions most predictive of pellet retrieval (R = 0.849; R2adj = 0.707; p < 0.001; Figs. 4E,F, 5C,D). At both weeks 1 and 7, infarct volume in the predictive regions was negatively related to task performance, meaning that greater damage in these subregions was associated with reduced task performance.
Table 1.
Regions of brain injury that most significantly predict performance for all behavioral tasksa
| Determinant | Predictors | Unstandardizedcoefficients |
R | Adjusted R2 | p | |
|---|---|---|---|---|---|---|
| β | SE | |||||
| Staircase: impaired limb pellets retrieved (week 1) | (Constant) | 19.972 | 1.110 | 0.784 | 0.595 | <0.001 |
| CFA | −0.382 | 0.104 | ||||
| RFA | −0.755 | 0.285 | ||||
| Staircase: impaired limb pellets retrieved (week 7) | (Constant) | 20.773 | 1.003 | 0.849 | 0.707 | <0.001 |
| Lateral to RFA | −0.362 | 0.079 | ||||
| CFA | −0.305 | 0.091 | ||||
| Cylinder: impaired limb usage (week 1) | (Constant) | 0.516 | 0.038 | 0.591 | 0.334 | <0.001 |
| CFA | −0.012 | 0.003 | ||||
| Cylinder: impaired limb usage (week 7) | (Constant) | 0.542 | 0.031 | 0.562 | 0.299 | <0.001 |
| Lateral to CFA | −0.012 | 0.003 | ||||
| Beam forelimb: % of successful steps (week 1) | (Constant) | 0.983 | 0.024 | 0.393 | 0.134 | 0.008 |
| CFA | −0.005 | 0.002 | ||||
| Beam forelimb: % of successful steps (week 7) | (Constant) | 0.977 | 0.012 | 0.488 | 0.220 | 0.001 |
| Lateral to CFA | −0.004 | 0.001 | ||||
| Beam hindlimb: % of successful steps (week 1) | (Constant) | 0.928 | 0.023 | 0.550 | 0.286 | <0.001 |
| HL | −0.013 | 0.003 | ||||
| Beam hindlimb: % of successful steps (week 1) | (Constant) | 0.905 | 0.013 | 0.516 | 0.249 | <0.001 |
| Medial to HL | −0.011 | 0.003 | ||||
| % time in impaired pellet zone (week 1) | (Constant) | 16.517 | 2.268 | 0.696 | 0.433 | 0.012 |
| CFA | −0.703 | 0.229 | ||||
| % time in impaired pellet zone (week 7) | (Constant) | 20.774 | 4.397 | 0.677 | 0.404 | 0.016 |
| RFA | −2.593 | 0.892 | ||||
| Pellets remaining in impaired pellet zone (week 1) | (Constant) | 1.970 | 0.423 | 0.712 | 0.457 | 0.009 |
| CFA | 0.137 | 0.043 | ||||
| Pellets remaining in impaired pellet zone (week 7) | (Constant) | 0.873 | 0.667 | 0.764 | 0.542 | 0.004 |
| RFA | 0.507 | 0.135 | ||||
aAll predictors represent the sum of infarct volume within a specific subregion. The unit for each determinant is task-specific and shown in its corresponding figure. For bivariate correlations between each behavior and all ROIs, see Table 2.
Table 2.
Bivariate correlations between behavioral tasks and each ROIa
| Behavioral task | ROI |
||||||||
|---|---|---|---|---|---|---|---|---|---|
| Medial HL | Lateral HL | Medial CFA | Lateral CFA | Medial RFA | Lateral RFA | HL | CFA | RFA | |
| Staircase: impaired limb pellets retrieved (week 1) | –0.180* | –0.344** | –0.571† | –0.721† | –0.474† | –0.698† | –0.439*** | –0.741† | –0.698† |
| Staircase: impaired limb pellets retrieved (week 7) | –0.208* | –0.355** | –0.672† | –0.785† | –0.627† | –0.802† | –0.442*** | –0.760† | –0.773† |
| Cylinder: impaired limb usage (week 1) | –0.212* | –0.465† | –0.380** | –0.551† | –0.322** | –0.438*** | –0.411*** | –0.591† | –0.475† |
| Cylinder: impaired limb usage (week 7) | –0.246* | –0.414*** | –0.471† | –0.562† | –0.382** | –0.455*** | –0.427*** | –0.544† | –0.538† |
| Beam forelimb: % of successful steps (week 1) | –0.270* | –0.296* | –0.340** | –0.350** | –0.194* | –0.250* | –0.351** | –0.393*** | –0.379** |
| Beam forelimb: % of successful steps (week 7) | –0.080* | –0.335** | –0.132* | –0.488† | –0.084* | –0.389*** | –0.218* | –0.346** | –0.321** |
| Beam hindlimb: % of successful steps (week 1) | –0.370** | –0.482† | –0.357** | –0.426*** | –0.244* | –0.312** | –0.550† | –0.434*** | –0.260* |
| Beam hindlimb: % of successful steps (week 1) | –0.516† | –0.392*** | –0.241* | –0.138* | –0.072* | –0.083* | –0.454*** | –0.178* | –0.071* |
| Pellets remaining in impaired pellet zone (week 1) | 0.461* | 0.620** | 0.267* | 0.599** | 0.114* | 0.441* | 0.484* | 0.712*** | 0.396* |
| Pellets remaining in impaired pellet zone (week 7) | 0.344* | 0.437* | 0.650** | 0.664** | 0.526* | 0.731*** | 0.614** | 0.733*** | 0.764*** |
aCell values are the Pearson correlation coefficient (r) between the intersecting behavioral task and ROI.
*p > 0.05;
**p < 0.05;
***p < 0.01;
†p < 0.001.
Figure 5.
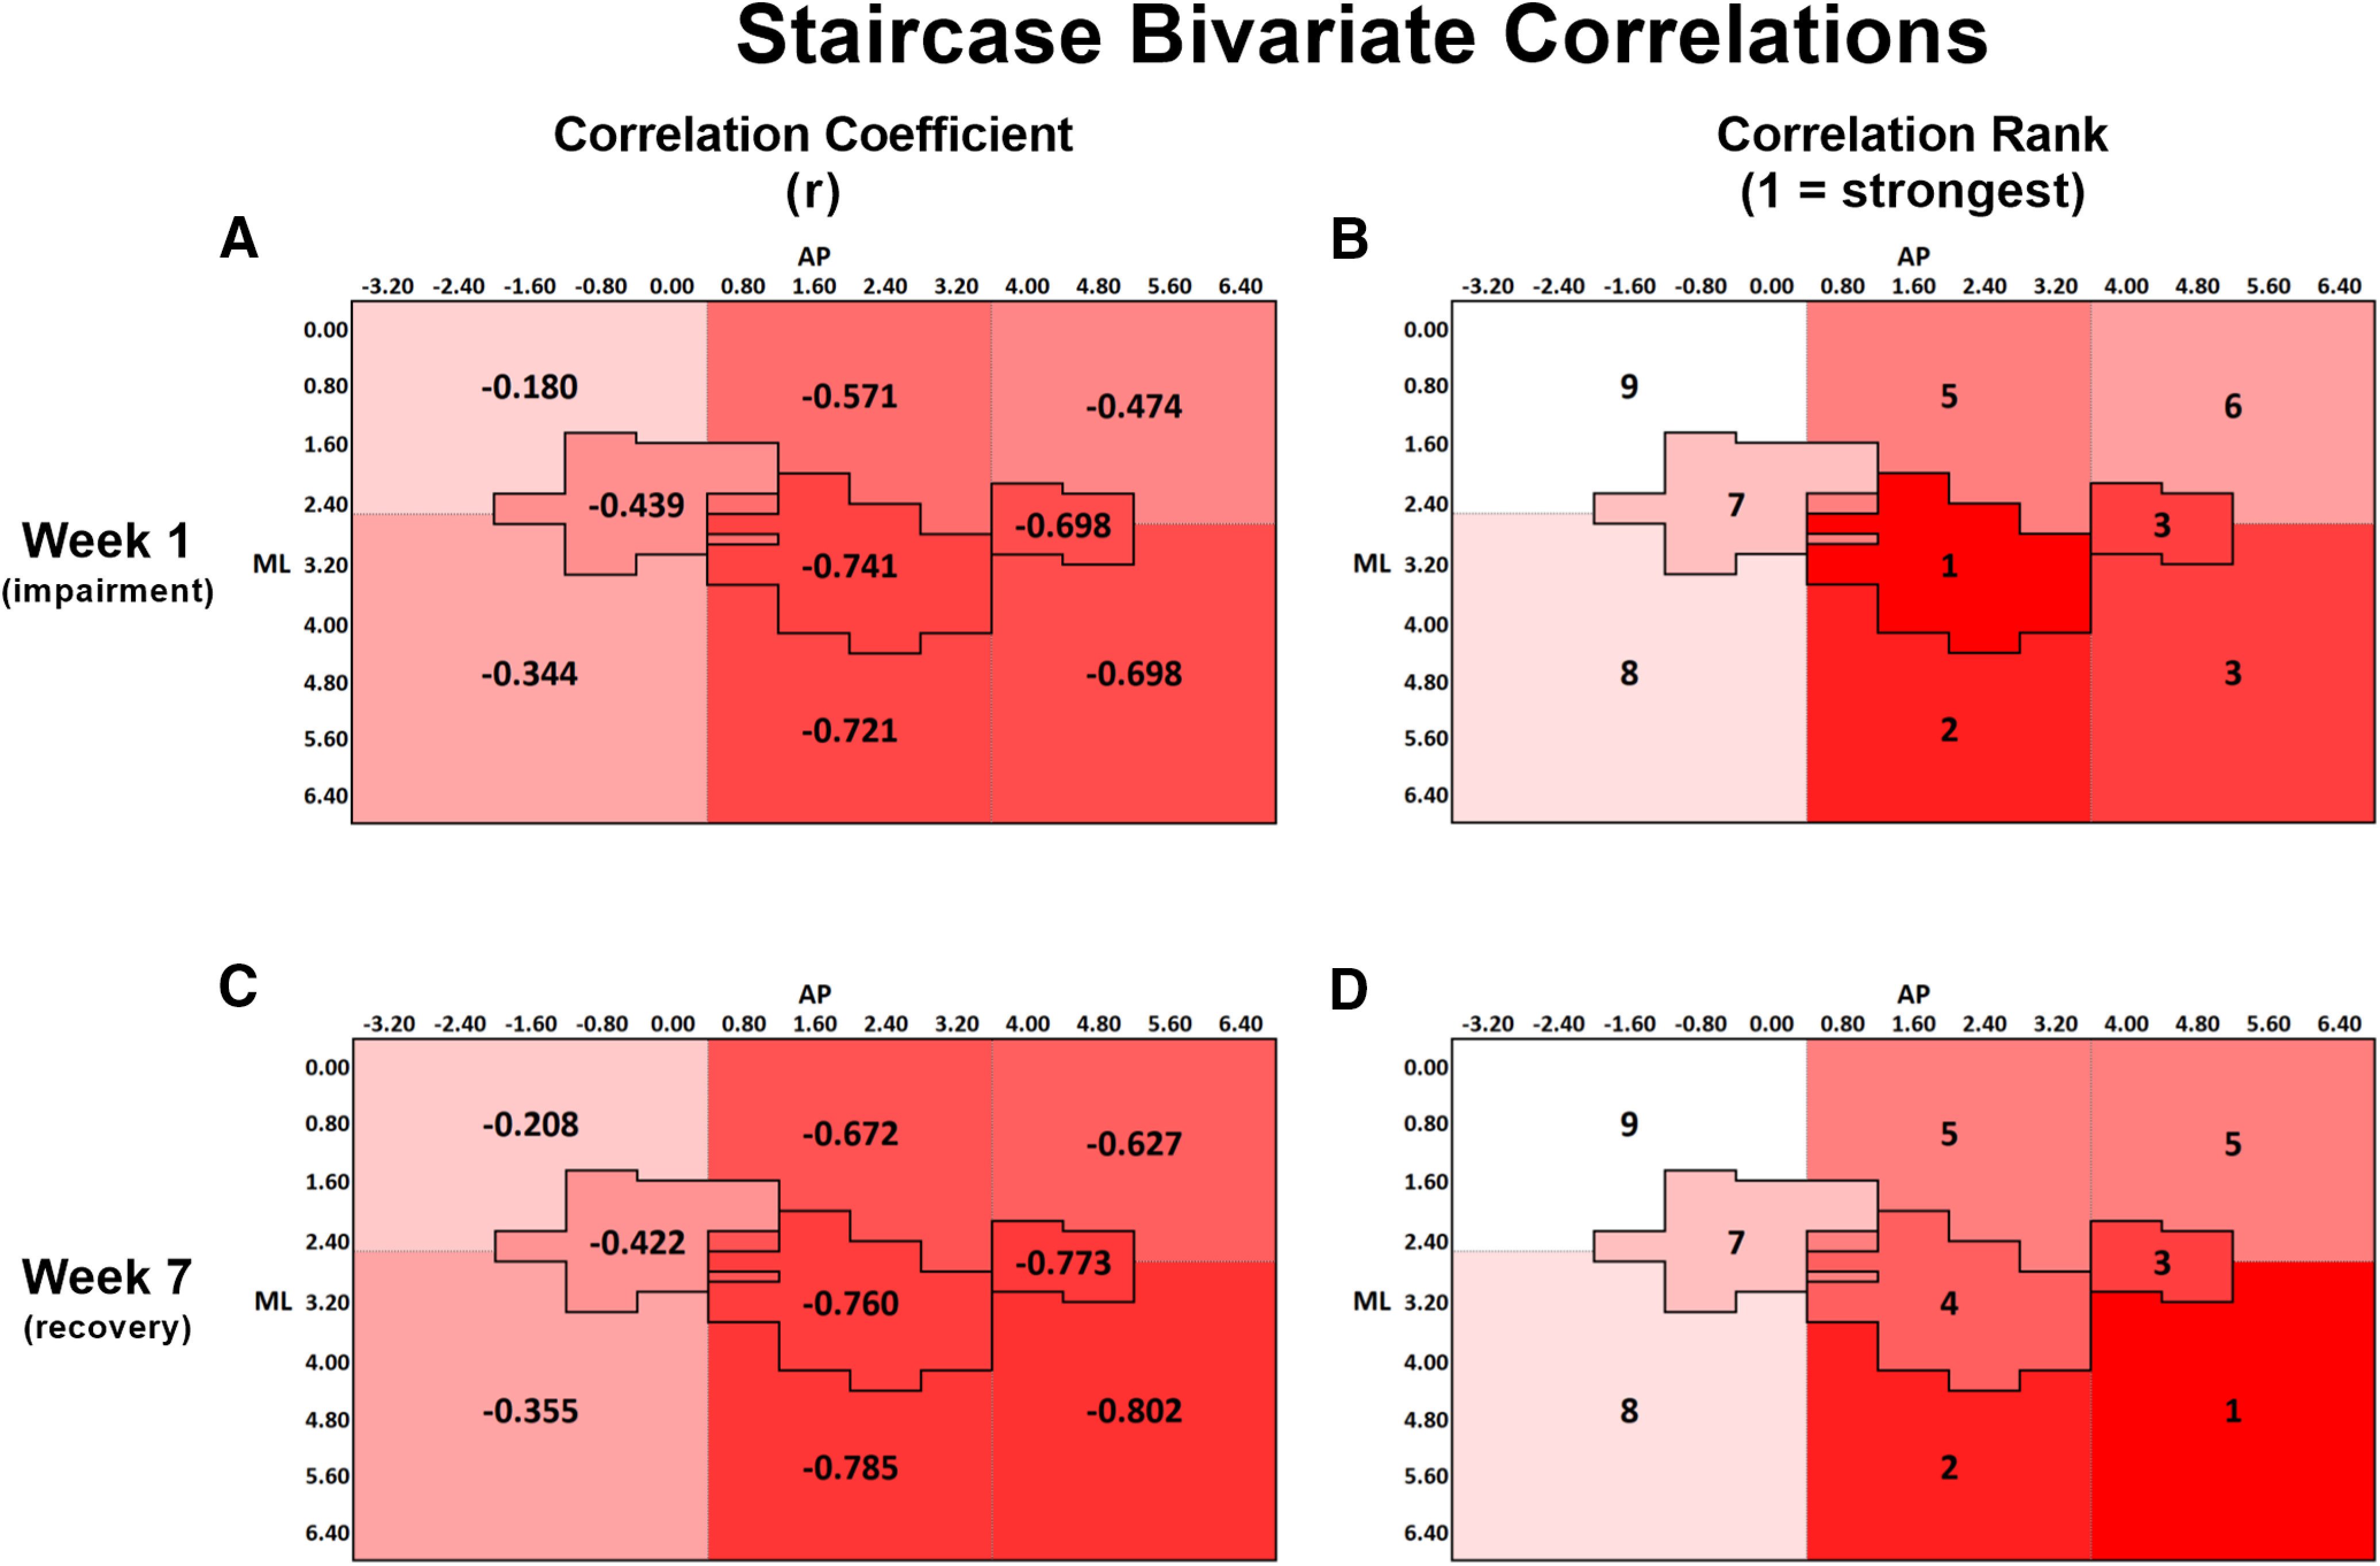
A, Bivariate Pearson correlation coefficients (r) between staircase performance at week 1 and lesion volume within each ROI. B, Rank order of correlation coefficients from A, with 1 indicating the strongest correlation and 9 indicating the weakest correlation. C, Bivariate correlation coefficient between staircase performance at week 7 and lesion volume within each ROI. D, Rank order of correlation coefficients from C, with the same ranking structure as previously described. A-D, The change in spatial relationship between infarct volume and staircase performance from week 1 to week 7, with infarct volume in anterior and lateral regions more strongly predicting performance at week 7 than at week 1. All correlations were significant at the p < 0.05 level, except for the region medial to HL, at both weeks 1 and 7 (Table 2). A-D, Darker red represents stronger correlations between variables.
Cylinder
Spontaneous use of the forelimb for exploration in the cylinder was also significantly reduced by stroke at weeks 1, 3, and 5 after stroke (F(4,248) = 10.819, p < 0.001; Fig. 6A,B). Mean use of the impaired limb was reduced by 14.1 ± 3.3% in rats with stroke compared with sham rats at these time points. Infarct volume within the CFA alone was the best predictor of impaired limb usage at week 1 after stroke (R = 0.591; R2adj = 0.334; p < 0.001; Figs. 6C,D, 7A,B), whereas the infarct volume of the region lateral to the CFA was the best predictor of impaired limb usage at week 7 (R = 0.562; R2adj = 0.299; p < 0.001; Figs. 6E,F, 7C,D).
Figure 6.

A, Cylinder task. Rats spontaneously rear and support their body weight using their forelimbs against the cylinder as they explore the environment. B, Mean use of the impaired limb in the cylinder task was significantly reduced compared with sham rats at weeks 1, 3, and 5 after stroke. C, D, Impaired limb use at week 1 was best predicted by infarct volume in the CFA subregion. E, F, However, limb use at week 7 was best predicted by infarct volume in the subregion lateral to CFA. Full regression parameters are shown in Table 1. N = 64 (sham = 20, stroke = 44). *p < 0.05.
Figure 7.
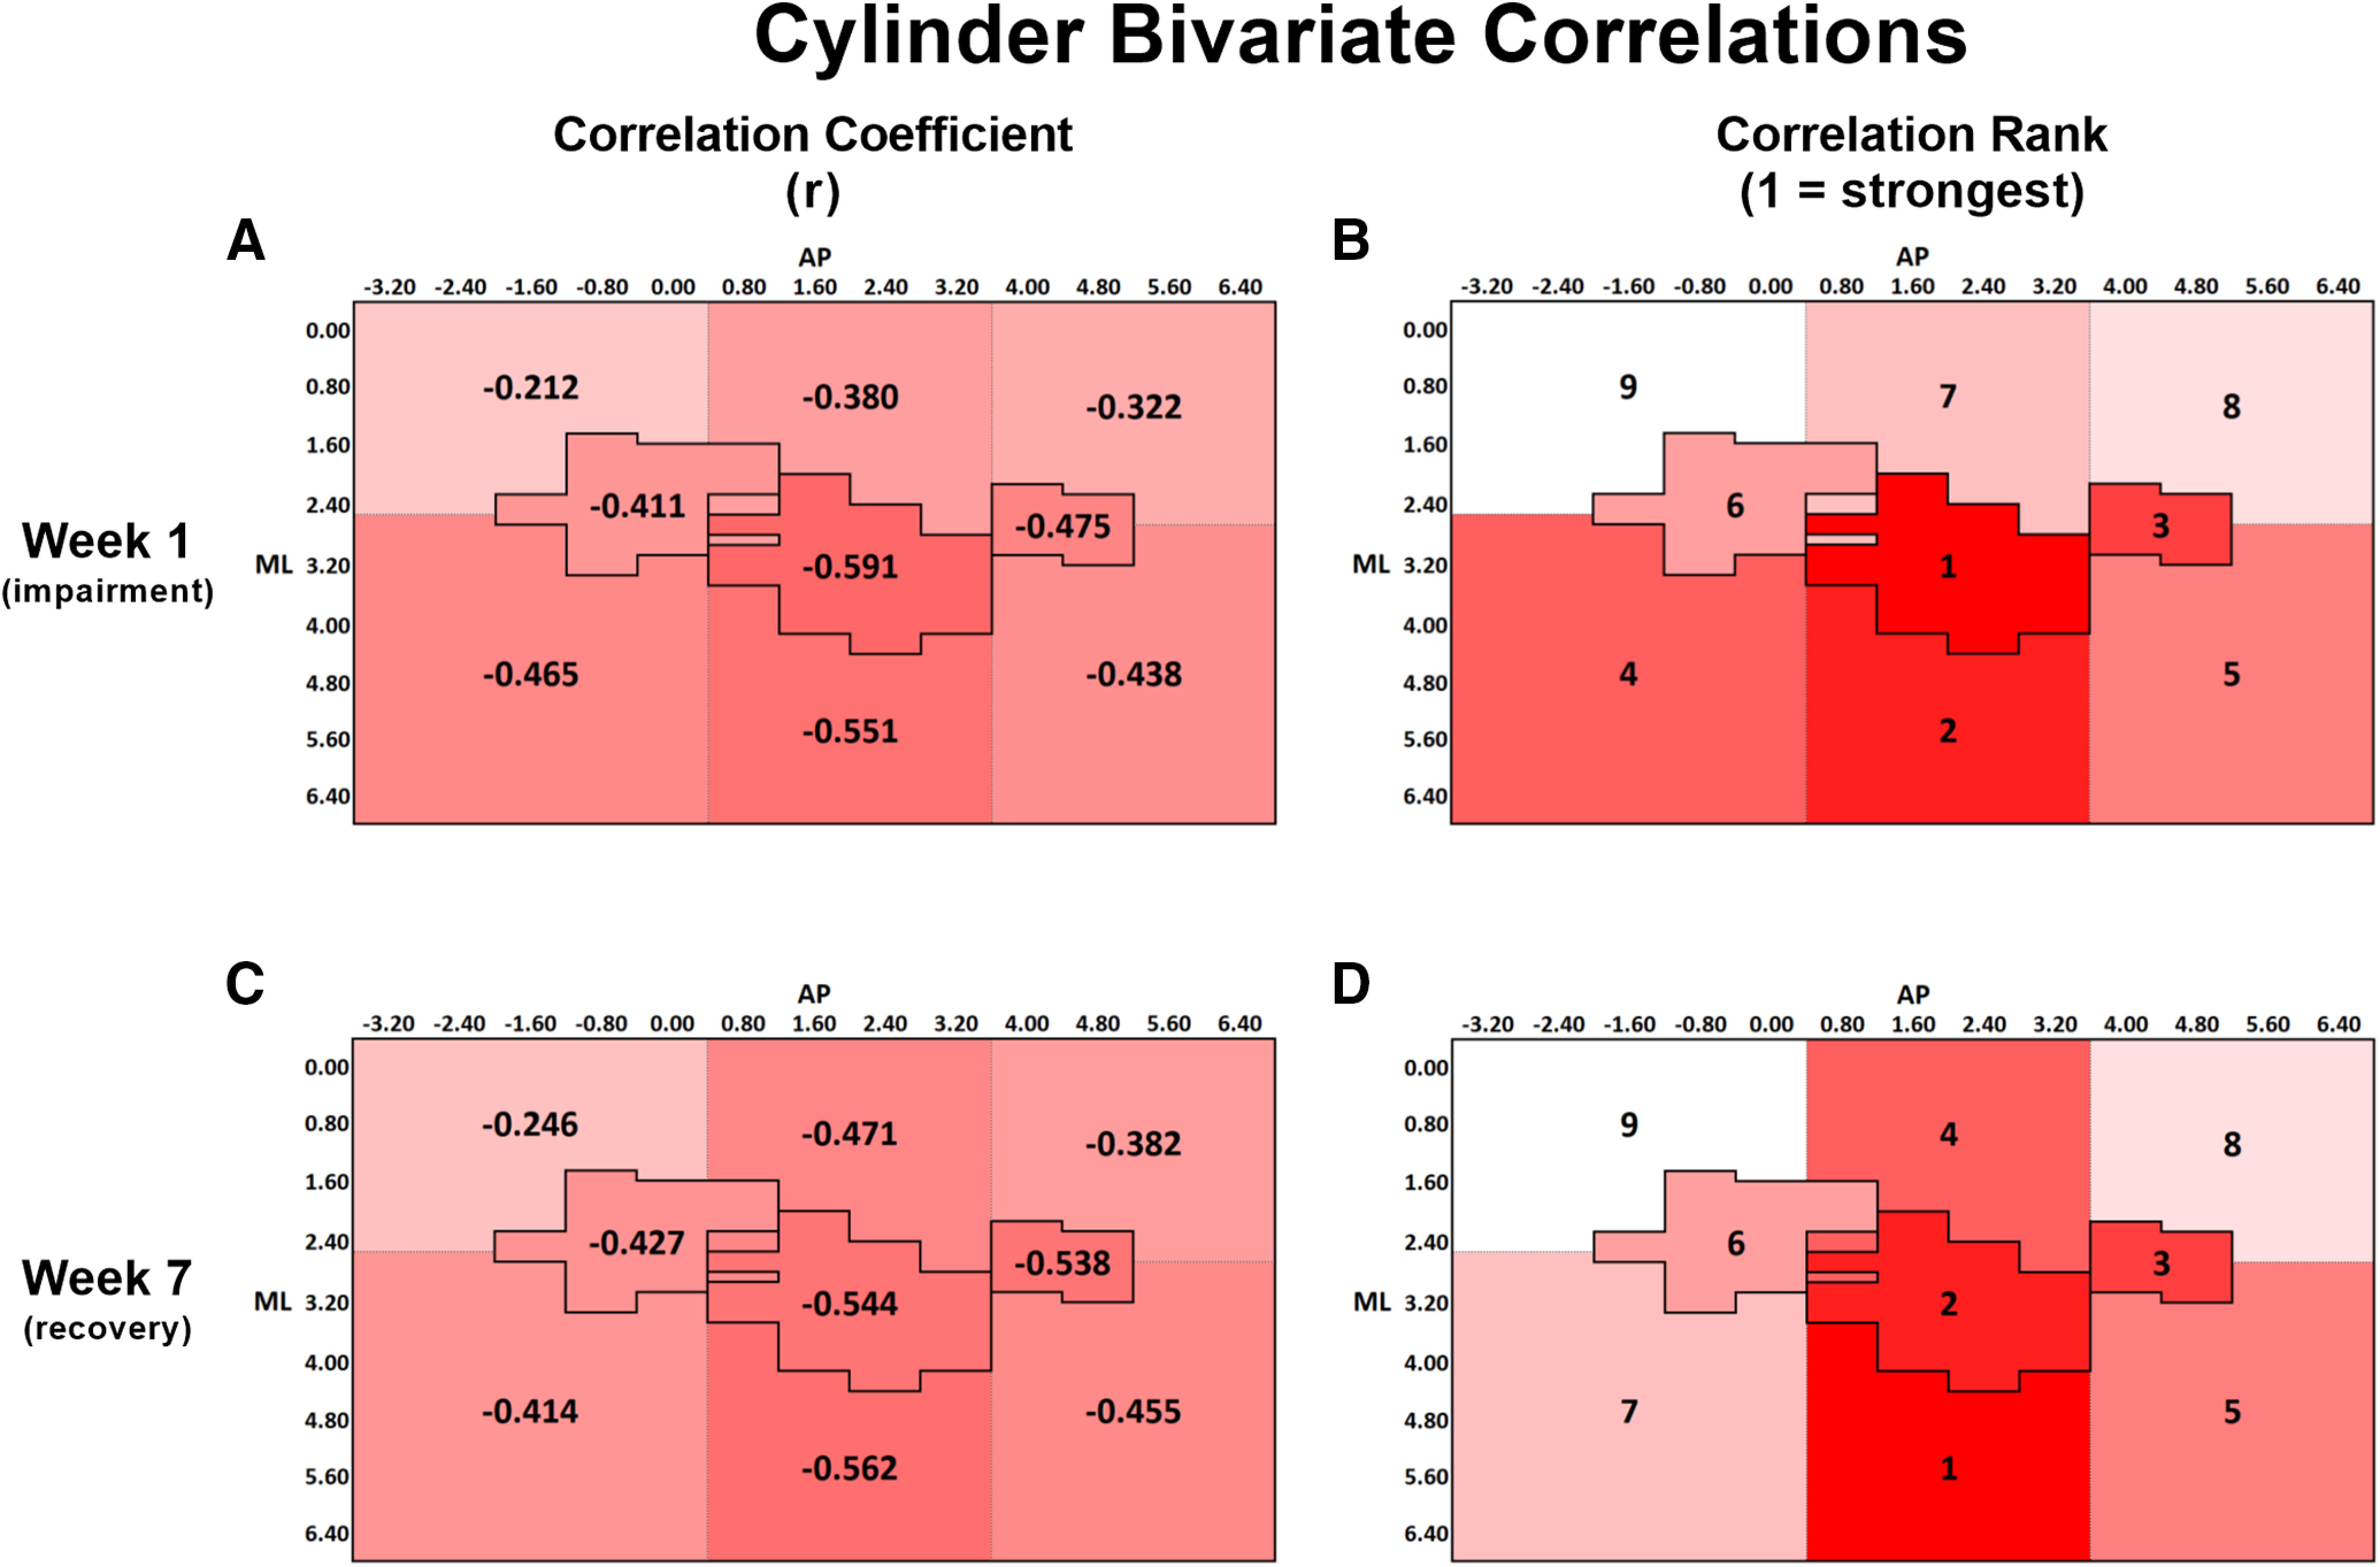
A, Bivariate Pearson correlation coefficients (r) between cylinder performance at week 1 and lesion volume within each ROI. B, Rank order of correlation coefficients from A, with 1 indicating the strongest correlation and 9 indicating the weakest correlation. C, Bivariate correlation coefficient between cylinder performance at week 7 and lesion volume within each ROI. D, Rank order of correlation coefficients from C, with the same ranking structure as previously described. A-D, The change in spatial relationship between infarct volume and cylinder performance from week 1 to week 7, with infarct volume in both medial and lateral regions surrounding CFA more strongly predicting performance at week 7 than at week 1. All correlations were significant at the p < 0.05 level, except for the region medial to HL, at both weeks 1 and 7 (Table 2). A-D, Darker red represents stronger correlations between variables.
Beam
Accuracy of paw placement during walking was assessed in both the impaired forelimb and hindlimb using the beam-walking task (Fig. 8A). Although impairments could be observed in some individual rats, the overall stroke group did not show a significant reduction in successful steps with the forelimb compared with the sham group at any poststroke time point (F(4,248) = 1.328, p = 0.264; Fig. 8B). However, mean reductions in successful hindlimb placements were observed at poststroke weeks 1, 3, and 7 (F(4,248) = 3.457, p = 0.009; Fig. 8C). Rats in the stroke group demonstrated a mean reduction of 7.2 ± 2.6% successful steps compared with shams at these time points. Individual performance in successful placement of the forelimb at week 1 was best predicted by the infarct volume in the CFA (R = 0.393; R2adj = 0.134; p = 0.008; Figs. 8D, 9A,B), whereas performance with the hindlimb was best predicted by infarct volume in HL (R = 0.550; R2adj = 0.286; p < 0.001; Figs. 8E, 9E,F). As similarly observed in the staircase and cylinder tasks, regions adjacent to those that predicted performance at week 1 were the best predictors of both forelimb and hindlimb performance in the beam at week 7. In the case of the forelimb, infarct volume in the region lateral to CFA was the best predictor of week 7 performance (R = 0.488; R2adj = 0.220; p = 0.001; Figs. 8F, 9C,D). For the hindlimb, infarct volume in the region medial to HL was the best predictor of successful steps on the beam at week 7 (R = 0.516; R2adj = 0.249; p < 0.001; Figs. 8G, 9G,H).
Figure 8.
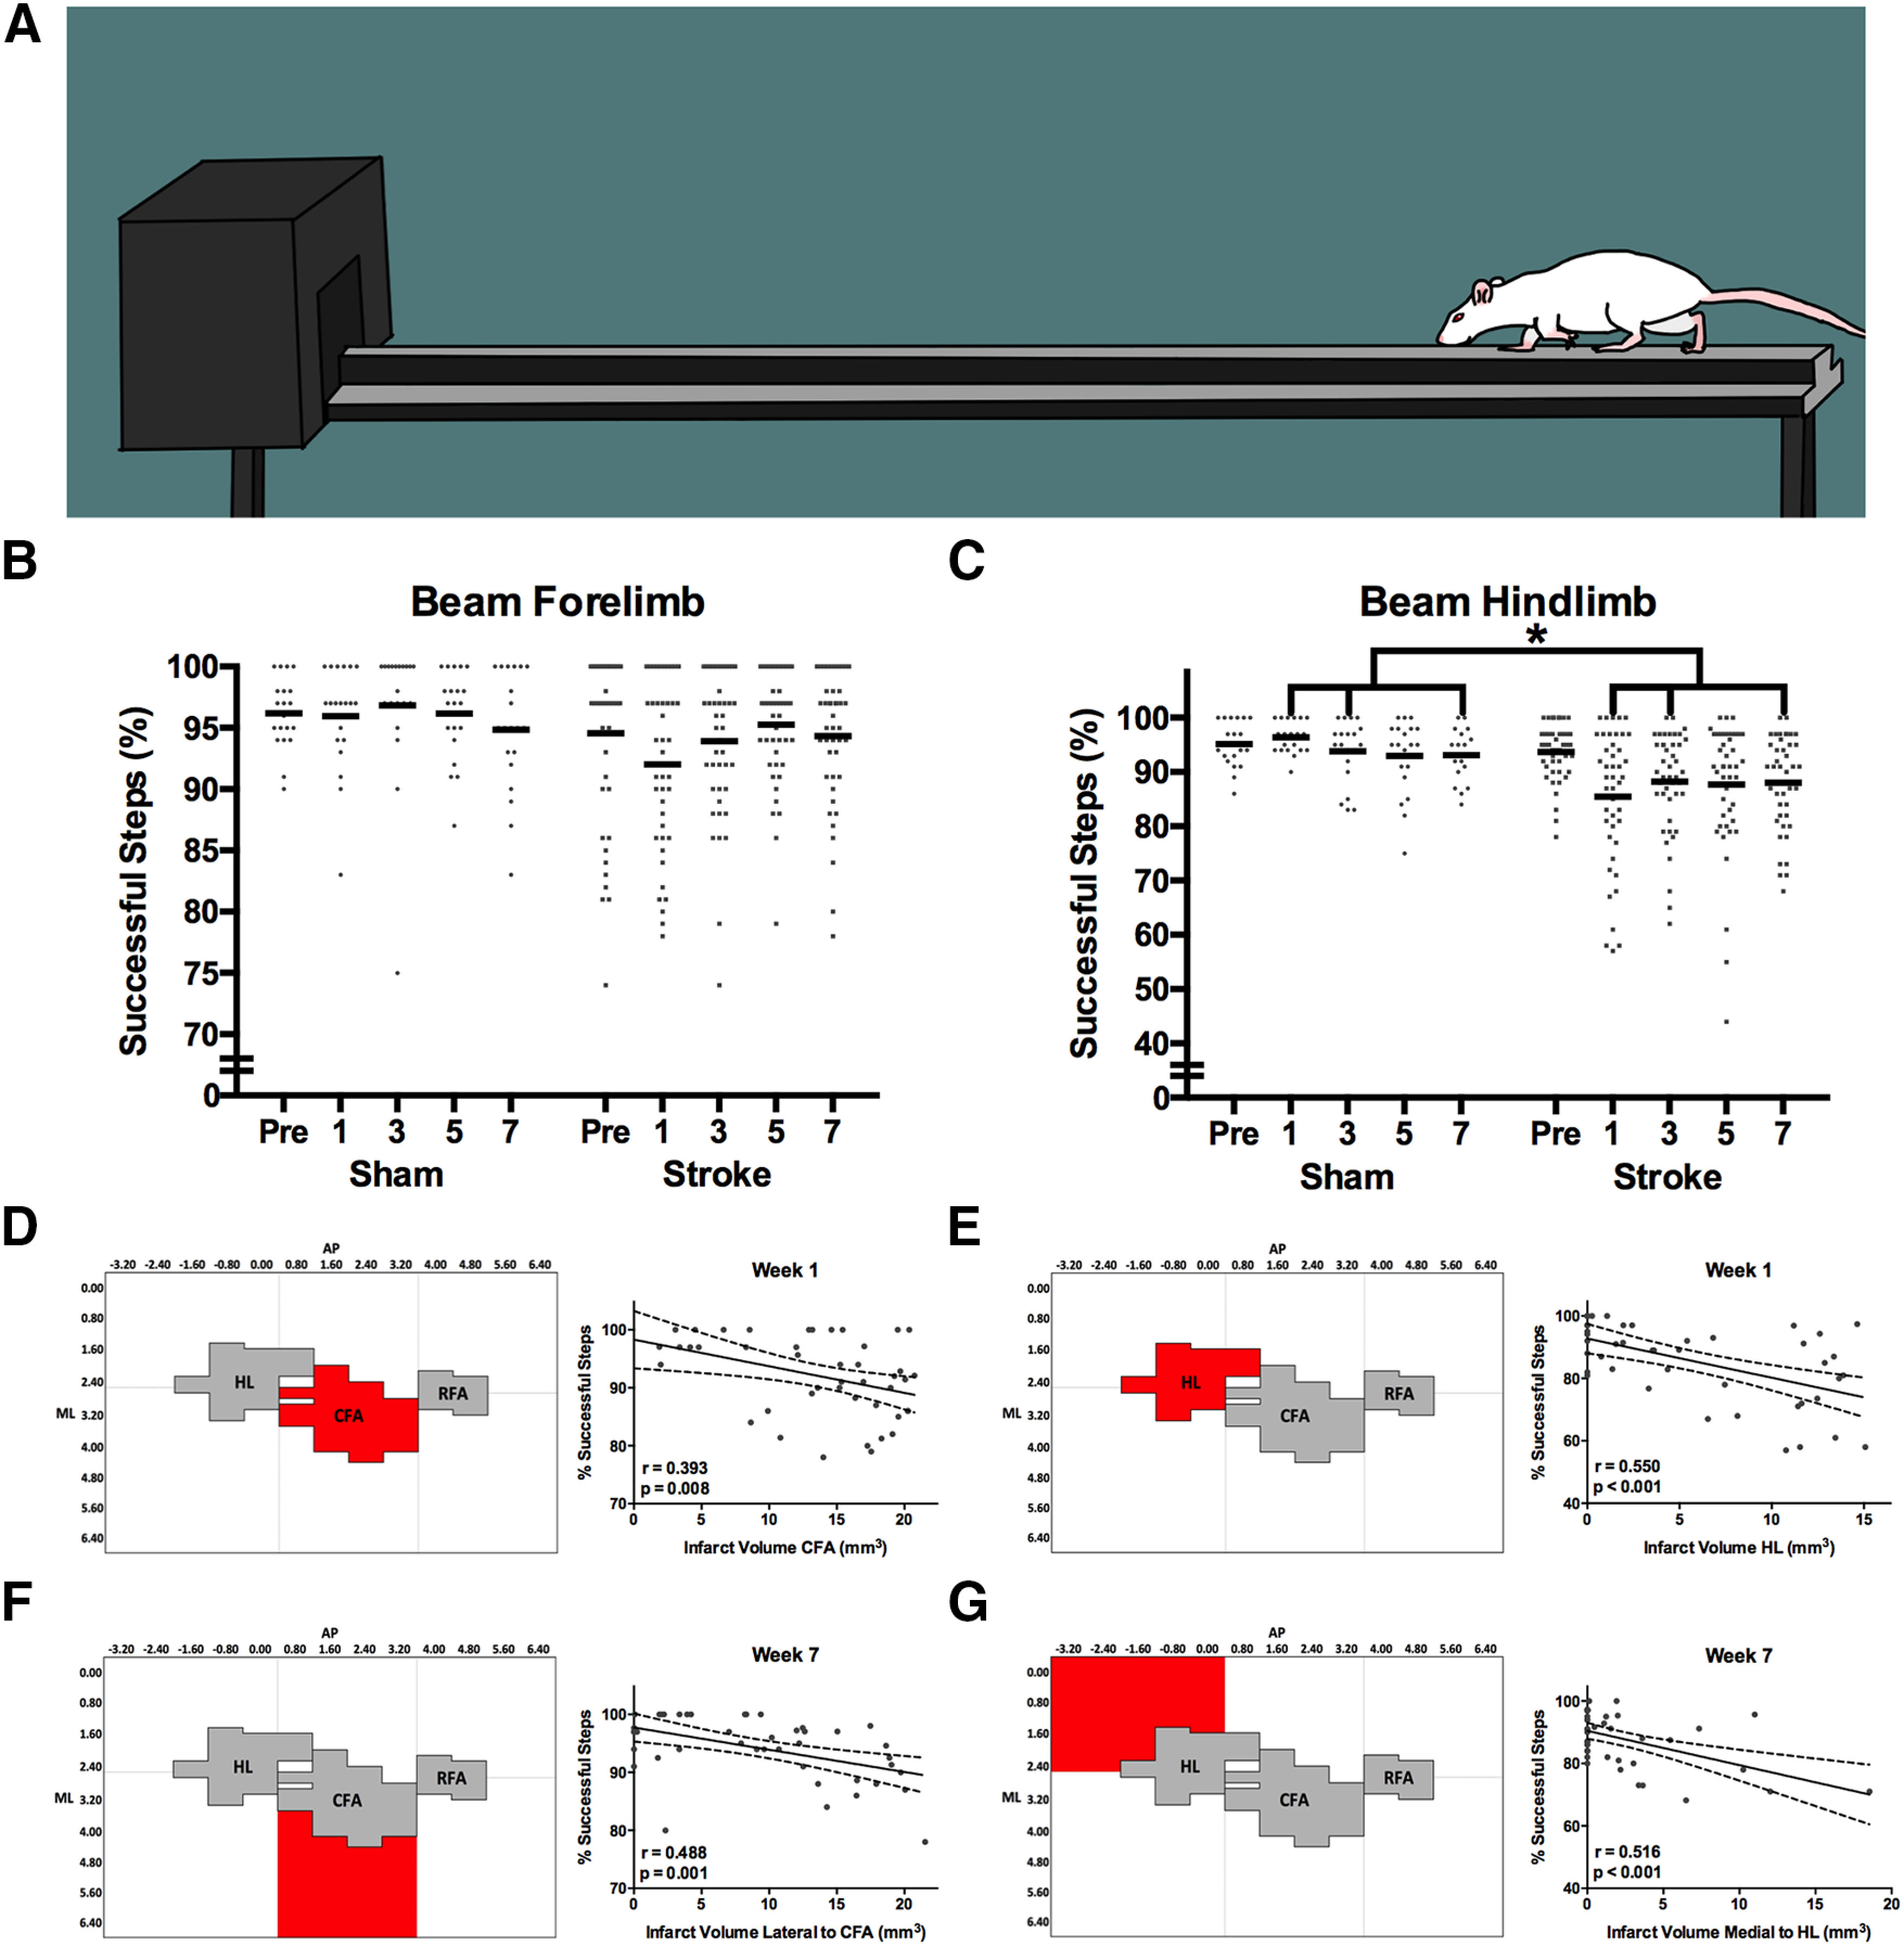
A, Beam task. Rats cross the beam toward the darkened goal box and avoid stepping on the lower ledge. Successful stepping becomes more difficult following stroke as the goal box is approached as width of the beam gradually tapers. B, Overall, the mean forelimb performance on the beam task was not significantly different between stroke and sham groups. However, impairments in this task can still be observed on an individual animal level (gray dots). C, In contrast, hindlimb performance on the beam task was significantly impaired in stroke rats relative to sham at weeks 1, 3, and 7 after stroke. D, Successful steps with the forelimb at week 1 after stroke were best predicted by infarct volume in the CFA, (E) whereas infarct volume in the HL was the best predictor of hindlimb performance. F, At week 7 after stroke, successful steps with the forelimb were best predicted by infarct volume in the region lateral to CFA, (G) while successful steps with the hindlimb were predicted by infarct volume medial to the HL. Full regression parameters are shown in Table 1. N = 64 (sham = 20, stroke = 44). *p < 0.05.
Figure 9.
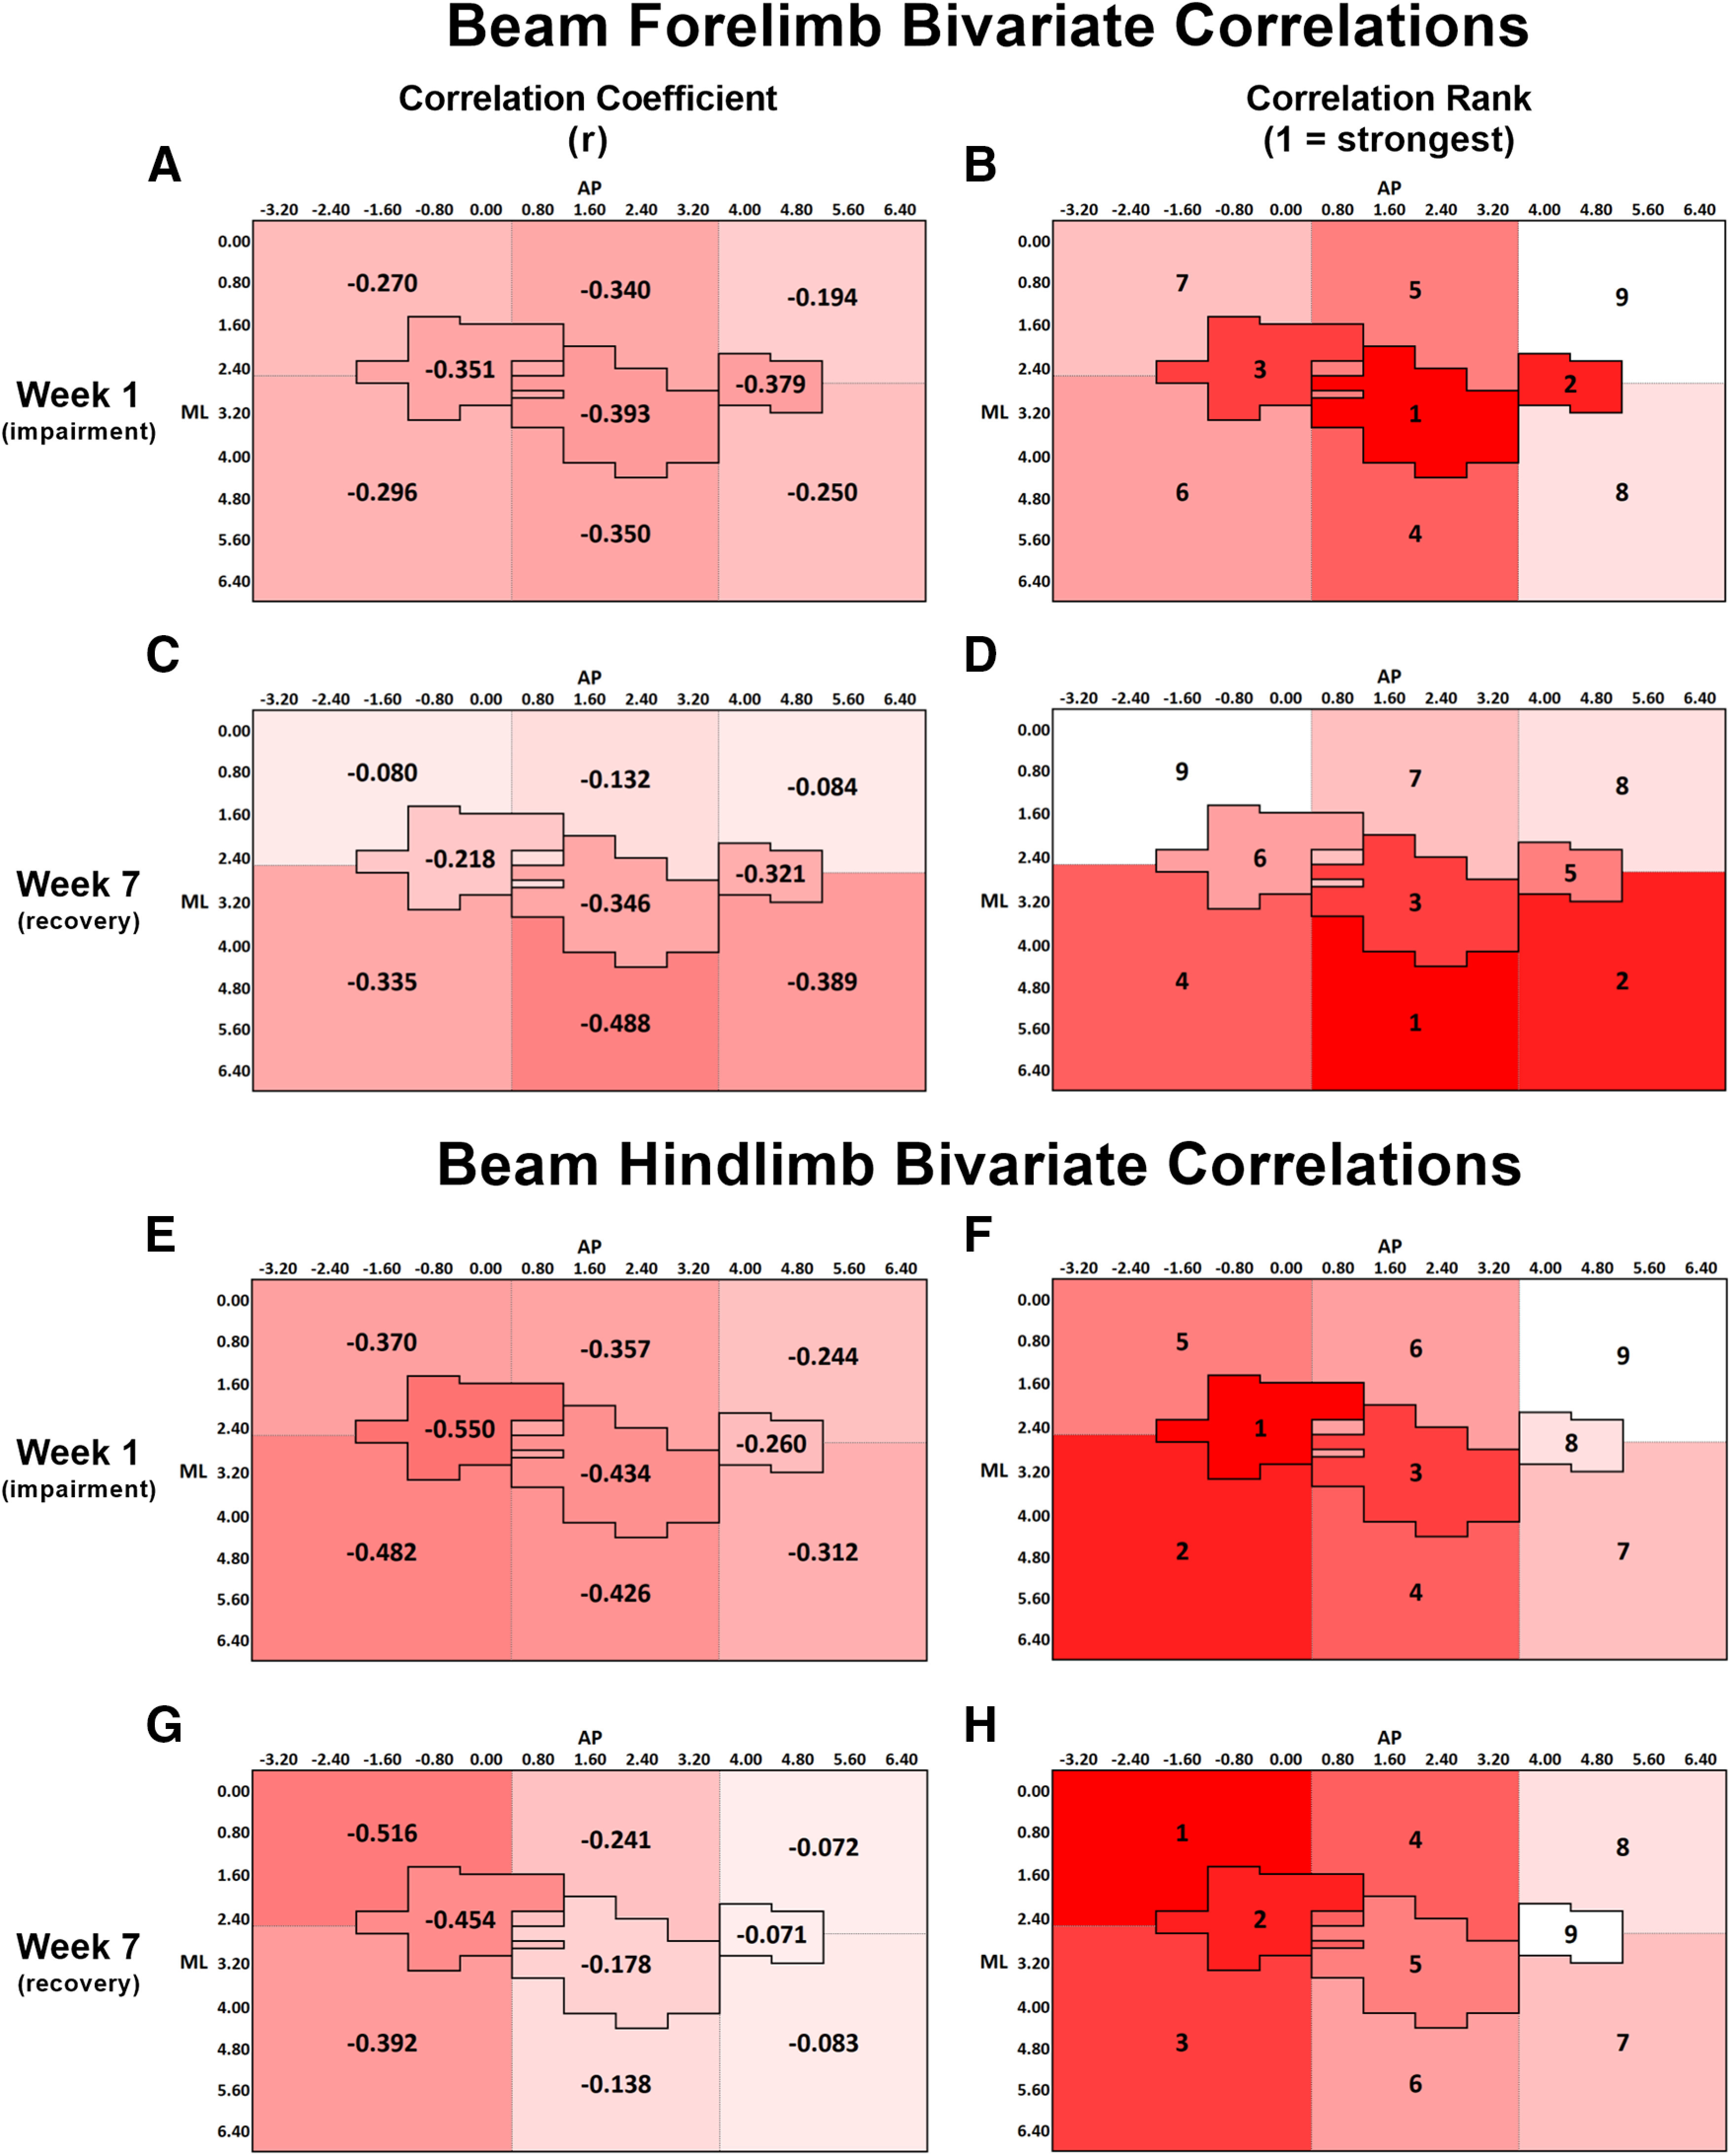
A, Bivariate Pearson correlation coefficients (r) between forelimb beam performance at week 1 and lesion volume within each ROI. B, Rank order of correlation coefficients from A, with 1 indicating the strongest correlation and 9 indicating the weakest correlation. At week 1, the correlations for HL, CFA, RFA, and the regions medial and lateral to CFA were significant at the p < 0.05 level (Table 2). C, Bivariate correlation coefficient between forelimb beam performance at week 7 and lesion volume within each ROI. D, Rank order of correlation coefficients from C, with the same ranking structure as previously described. At week 7, the correlations for CFA, RFA, and the regions lateral to HL, CFA, and RFA were significant at the p < 0.05 level (Table 2). A-D, The change in spatial relationship between infarct volume and forelimb beam performance from week 1 to week 7, with infarct volume in all the regions lateral to HL, CFA, and RFA more strongly predicting performance at week 7 than at week 1. E, Correlation between hindlimb beam performance at week 1 and lesion volume within each ROI. F, At week 1, the correlations for all regions, except RFA and the region medial to RFA, were significant at the p < 0.05 level (Table 2). G, Bivariate correlation coefficient between hindlimb beam performance at week 7 and lesion volume within each ROI. H, At week 7, only the correlations for HL and the regions both medial and lateral to HL were significant at the p < 0.05 level (Table 2). E-H, The change in spatial relationship between infarct volume and hindlimb beam performance from week 1 to week 7, with infarct volume in the region medial to HL more strongly predicting performance at week 7 than at week 1. A-H, Darker red represents stronger correlations between variables.
Spontaneous activity, socialization, and limb use
The PhenoTyper cage enabled analysis of locomotor activity (distance traveled), socialization, and spontaneous use of the forelimb for reaching and grasping in a seminaturalistic caging environment over an extended period of time (1 h/session). This afforded an opportunity to assess how rats engage with their environment and whether they use their impaired limbs spontaneously, rather than in a task where they were trained/forced to use it (i.e., staircase). This is an important complement to the task-based measures (i.e., staircase, cylinder, beam), as it has been previously shown that ability to perform a motor task does not necessarily translate into increased use of the paretic limb during activities of daily living (Rand and Eng, 2012). We observed no significant difference in total distance traveled within a session between the sham (261.9 ± 12.2 m) and stroke (257.4 ± 11.7 m) groups (F(4,84) = 0.718, p = 0.582). We observed a significant group × zone interaction in the proportion of time spent in the PhenoTyper (F(7,147) = 3.035, p = 0.005; Fig. 10A). Post hoc analysis of this effect indicated that rats in the stroke group spent a significantly greater proportion of time in the PhenoTyper in the pellet tray zone than rats in the sham group (t(22) = 4.475, p = 0.047; Fig. 10B). Based on this effect, the pellet zone accessible by using only the impaired limb was selected for further analysis.
Figure 10.
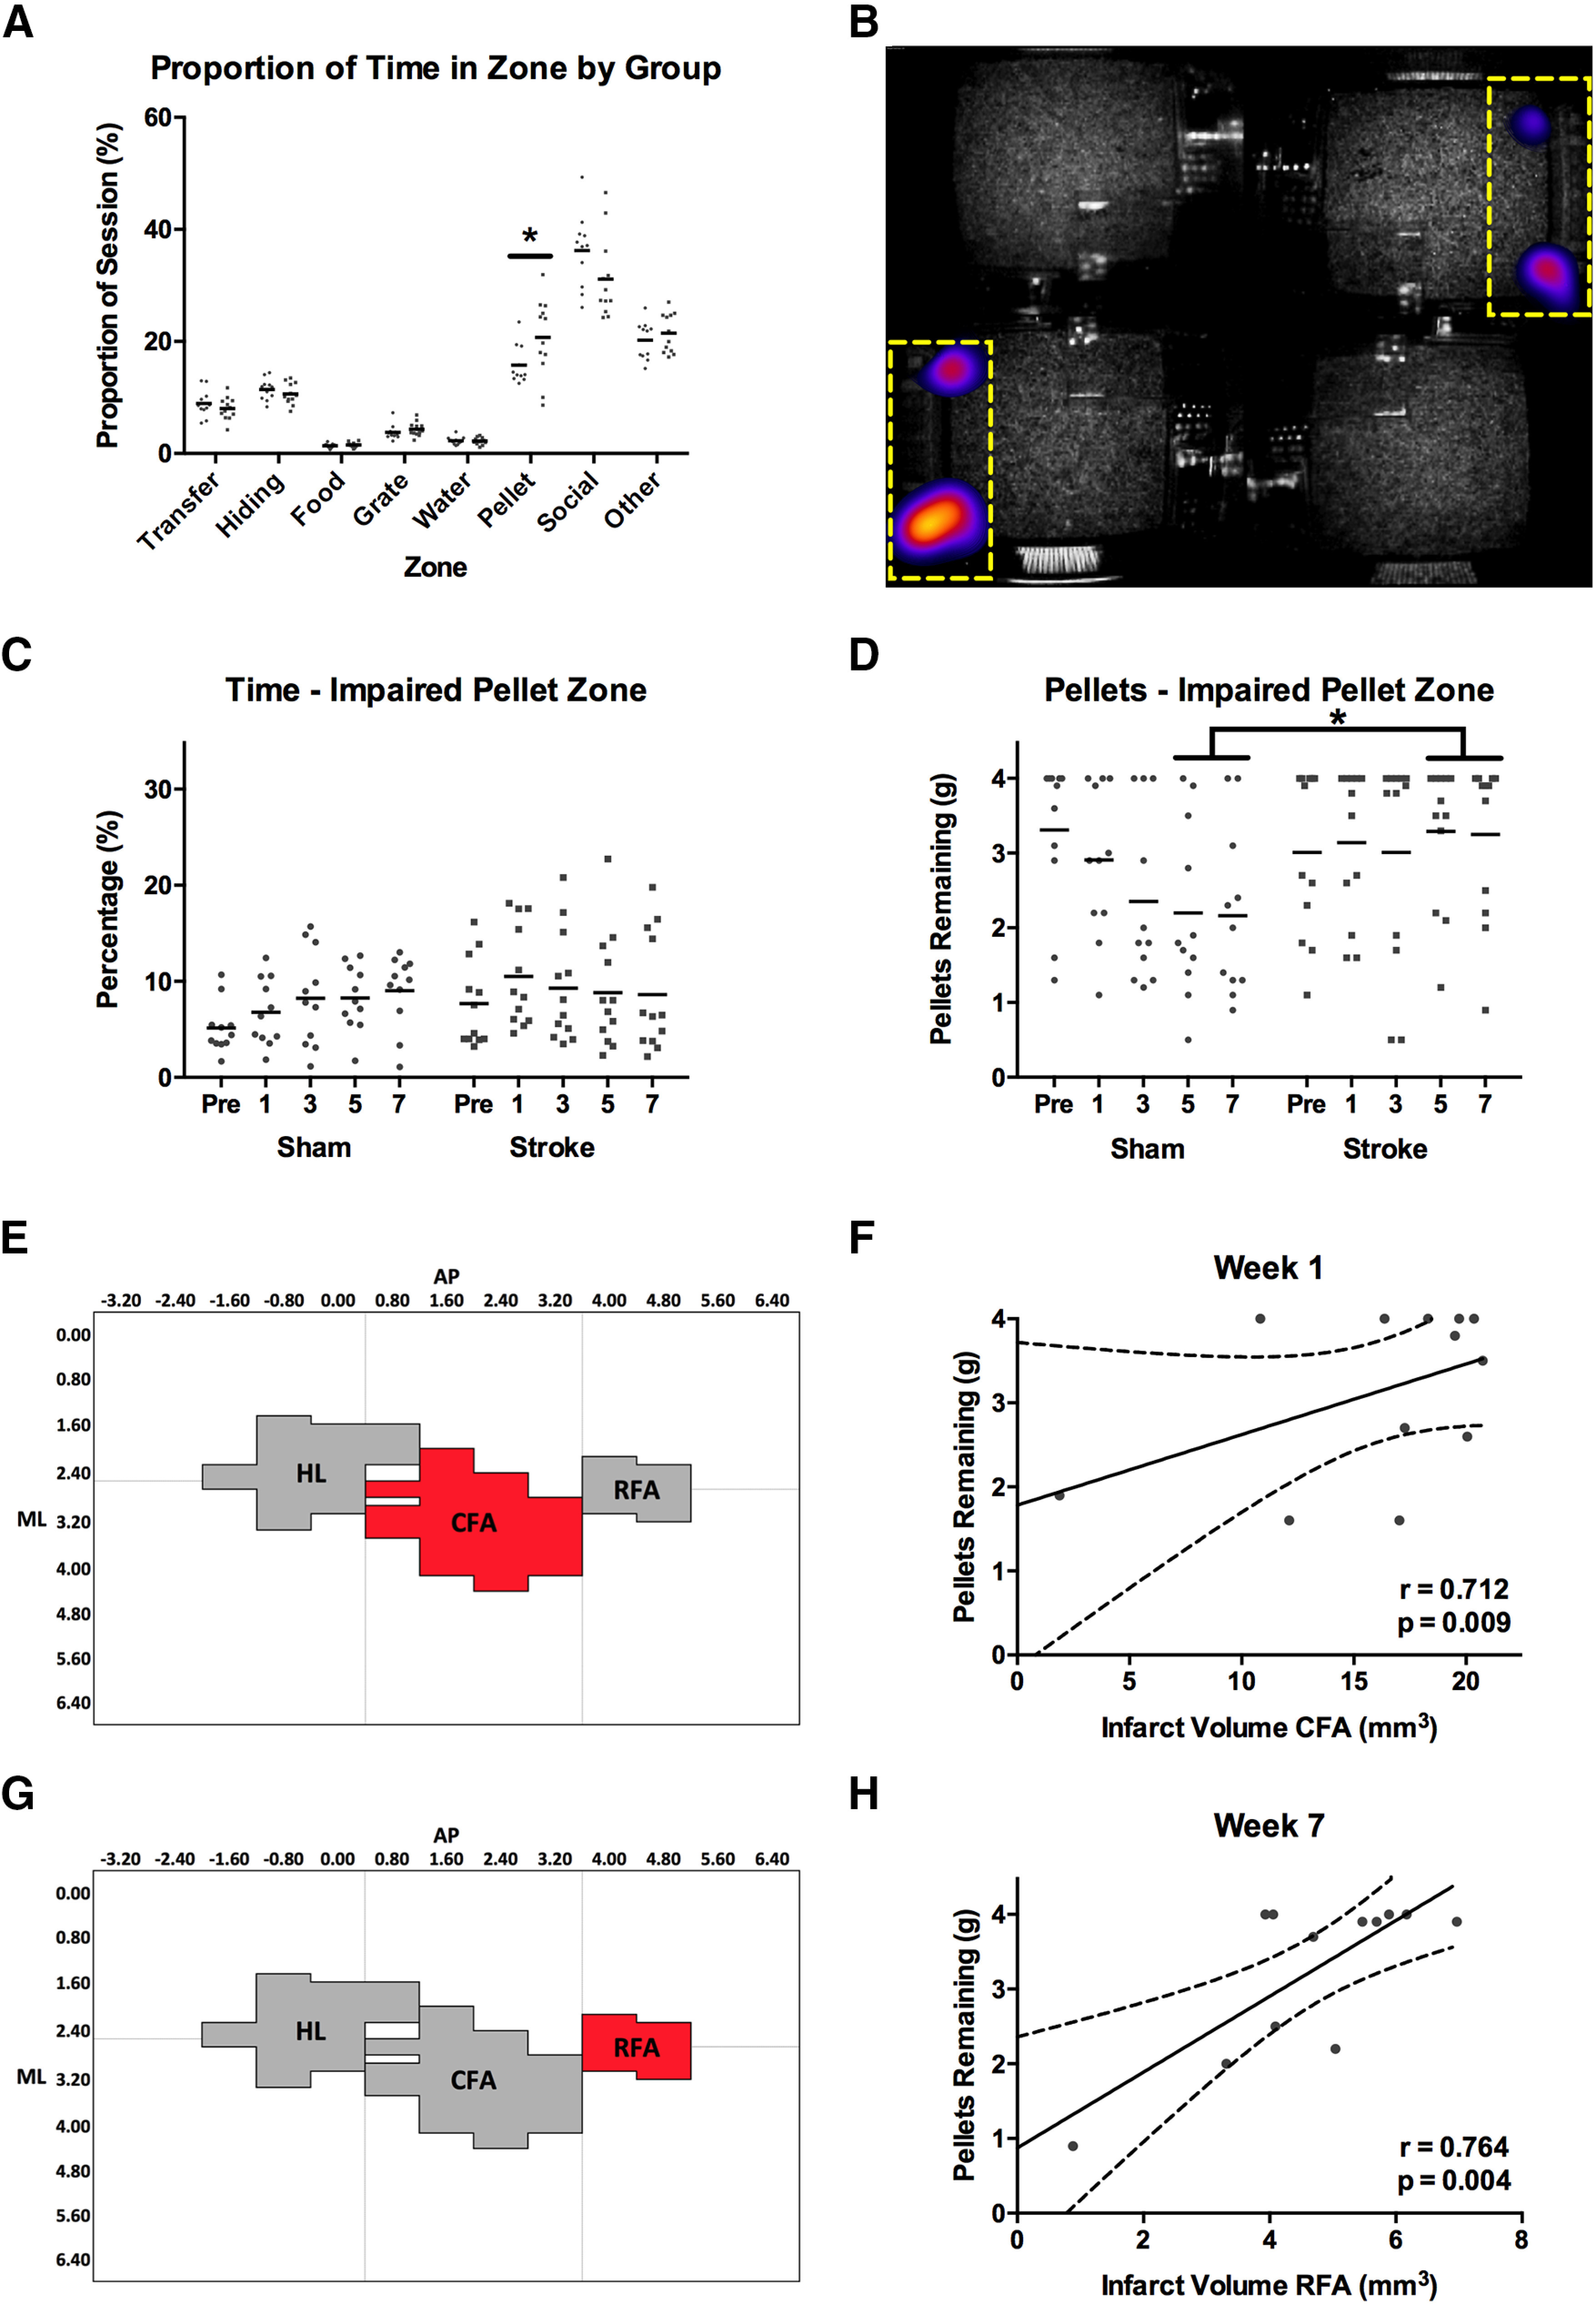
A, Following stroke, rats spent a larger proportion of their time in the pellet reaching zones (nonimpaired + impaired) of the PhenoTyper than sham rats. B, Mean group heat map showing the difference in time spent in the pellet zones (indicated by yellow dashed line) between the sham and stroke groups. Brighter color represents areas where stroke rats spent more time than sham. C, Rats with stroke did not spend significantly less time attempting to reach pellets with their impaired limb than sham rats. D, Despite this, on average, rats with stroke had significantly more pellets remaining at the end of a PhenoTyper session than shams at weeks 5 and 7 after stroke. This indicates that, on average, shams learned to successfully reach and grasp pellets in the PhenoTyper environment, whereas rats with stroke did not. E, F, Pellet retrieval in the PhenoTyper at week 1 was best predicted by infarct volume in CFA. G, H, Infarct volume in RFA best predicted pellet retrieval at week 7. Full regression parameters are shown in Table 1. N = 24 (sham = 12, stroke = 12). *p < 0.05.
There was no significant difference in the amount of time that stroke and sham groups spent in the pellet zone for the impaired limb (F(4,84) = 1.345, p = 0.260; Fig. 10C); however, sham rats retrieved significantly more pellets than stroke rats at weeks 5 and 7 after stroke in the PhenoTyper (F(4,84) = 3.662, p = 0.028; Fig. 10D). Pellet retrieval in the PhenoTyper at week 1 was best predicted by infarct volume in CFA (R = 0.712; R2adj = 0.457; p = 0.009; Figs. 10E,F, 11A,B), whereas pellet retrieval at week 7 was best predicted by infarct volume in the adjacent RFA region (R = 0.764; R2adj = 0.542; p = 0.004; Figs. 10G,H, 11C,D).
Discussion
Lesion volume in domain-specific motor subregions best predicts postinjury task impairment
Following photothrombotic stroke in the motor cortex, rats exhibited impairments in several motor domains, including skilled reaching, spontaneous forelimb use, and limb placement during walking, that were assessed using classic rodent tasks (Corbett et al., 2017; Balkaya et al., 2018). We also assessed unrestricted reaching and spontaneous activity in a free-ranging housing environment. We observed that the degree of impairment at week 1 after stroke was best predicted by the volume of damage within domain-specific regions of the motor cortex. In other words, each task had specific motor subregions that, when damaged, decreased the performance on that task in a volume-dependent manner. Damage to the CFA and RFA impaired forelimb function on the staircase task, whereas damage to the CFA and HL impaired forelimb and hindlimb placing responses, respectively, on the beam task. Furthermore, damage to the CFA impaired spontaneous use of the impaired forelimb in the cylinder task, as well as the spontaneous retrieval of pellets within the PhenoTyper. For each of these domains, impairment was positively correlated with the volume of damage to the corresponding motor subregion. The hierarchical, region-specific representation of motor functions within the motor cortex is an established principle (Leyton and Sherrington, 1917; Hall and Lindholm, 1974; Barth et al., 1990), and our results are consistent with other preclinical studies demonstrating the importance of specific motor subregions to single behavioral tasks (Schallert et al., 2002; S. Y. Kim and Jones, 2010; Touvykine et al., 2016). These findings emphasize the importance of mapping both the size and specific location of cortical damage when contextualizing behavioral impairments after stroke.
Perilesional regions that are unique to each motor domain influence degree of recovery from brain injury
Recovery from initial impairment at week 7 after stroke followed a similar pattern as impairment at week 1, wherein each motor domain corresponded to a unique topographical subregion of the motor cortex. However, the regions involved in recovery at week 7 were adjacent to those involved in initial impairment at week 1. Damage to the CFA and area lateral to the RFA, which corresponds to mouth (jaw and tongue) motor area (Neafsey et al., 1986), decreased functional recovery of performance in the staircase task at week 7 after stroke. Damage to the area lateral to the CFA, corresponding to somatosensory region of the forelimb (Palomero-Gallagher and Zilles, 2015), impaired recovery of forelimb placement during the beam task, whereas damage to the area medial to the HL, related to vibrissae and frontal eye fields regions (Neafsey et al., 1986), impaired the functional recovery of hindlimb placement. Increased volume of damage in the area lateral to the CFA resulted in a decrease in recovery of spontaneous usage of the impaired forelimb during the cylinder task, while the volume of damage within RFA impacted recovery of spontaneous retrieval of pellets within the PhenoTyper. In all cases, damage that encroached on areas adjacent to the initial domain-specific regions reduced the ability to recover from lesion-induced impairments. Reorganization of motor representations in adjacent brain regions is thought to contribute to functional recovery (Nudo and Milliken, 1996; Xerri et al., 1998; Jones and Adkins, 2015). However, the present study suggests that each motor domain has specific brain regions that are primarily associated with recovery, and that reorganization of poststroke motor functions in the undamaged cortex is highly localized. For example, tissue rostral to the stroke may not have the same potential for restoring function of a given motor domain as tissue located lateral or medial to the stroke. This conclusion is congruent with other studies in which two-stage lesions have been performed in attempts to reinstate poststroke deficits that have recovered over time. For example, simply enlarging the motor cortex lesion and/or lesioning the homologous motor area in the other hemisphere did not reinstate upper limb deficits in nonhuman primates (Leyton and Sherrington, 1917). In contrast, McNeal et al. (2010) showed that the recovered upper limb deficits in rhesus monkeys following M1 lesions could be reinstated by secondary injury to the supplementary motor area (or M2). Similar findings have been reported following photothrombotic stroke to the RFA portion of the mouse motor cortex. Single-pellet reaching was disrupted by the lesion, followed by behavioral recovery. A second stroke in the agranular medial cortex (M2 in rodents), a region thought to be analogous to the primate's premotor areas, reinstated the original deficits (Zeiler et al., 2013).
These findings have important implications as technologies for region-specific activation/suppression of brain activity become more readily available in clinical practice (Smith and Stinear, 2016). It may be that techniques, such as transcranial magnetic stimulation, will need to target domain-specific brain regions based on the lesion profile and impairments of each individual patient to obtain benefit. Indeed, a failure to individualize treatment based on lesion characteristics could contribute to failure of clinical trials (Stinear et al., 2020).
Spontaneous activity and limb use following stroke
During inpatient hospital stays, a decrease in physical activity is common following stroke (Bernhardt et al., 2004; West and Bernhardt, 2012). We did not observe such a decrease; our rats maintained activity levels similar to their sham counterparts. This disparity may be due to differences between typical clinical and preclinical environments. Rats in our study were exposed to an enriched environment in which they had full autonomy to explore and engage with the objects around them. In a hospital setting, although patients report boredom, they are encouraged to remain in bed and rest, discouraging physical activity (Kenah et al., 2018). Our findings in rats using the PhenoTyper task are similar to those of Rosbergen et al. (2017), in humans, who found that using an enriched environment promoted increased levels of physical activity, along with associated benefits, following stroke.
While in the PhenoTyper, the stroke rats spent more time on average than the sham rats within the pellet reaching zone, despite being relatively unsuccessful at retrieving pellets with their impaired limb. This contrasts with the clinical literature where the ability to use the impaired limb does not necessarily translate into increased use of that limb in daily life (Rand and Eng, 2012). This discrepancy highlights the fact that the rats remained highly motivated to use their impaired limb for food rewards, and that impairment does not necessarily lead to limb learned nonuse (Taub et al., 2006). The brain regions associated with impaired pellet retrieval in the PhenoTyper were consistent with those of the staircase at both weeks 1 and 7. This finding reinforces the conclusion that CFA and RFA are critical motor regions for skilled reaching tasks, and that the most important areas for recovery appear to be those that are adjacent, in a spatially selective manner (i.e., lateral vs medial), to the initial domain-specific site.
Lesion location and patient-specific interventions for stroke recovery
It is evident from our study that lesion location is a critical determinant of cortical reorganization and subsequent functional recovery following stroke. However, despite the ubiquity of reporting lesion volume within the preclinical literature, precise infarct location is rarely considered as influencing functional outcome (Karthikeyan et al., 2019). Clinical research has placed greater importance on location, but analyses of location tend to be descriptive in nature (e.g., cortical, subcortical), with relatively few studies adjusting treatment parameters based on individualized lesion characteristics (Kirton et al., 2008). Here, using imaging methods like those that can be used clinically, we demonstrate a clear relationship between lesion characteristics and poststroke impairment and recovery, indicating that detailed lesion assessment should be a routine element of all stroke research. Given that preclinical research often precedes clinical adoption, attempts should be made to standardize lesion mapping practices across species to maximize the likelihood of translational success (Corbett et al., 2017).
The term “perilesional” is commonly used to describe the region surrounding the infarct and represents a potential target of localized interventions to maximize recovery (Krakauer and Carmichael, 2017). In preclinical studies, interventions (e.g., application of drugs, optogenetic stimulation) related to perilesional areas are common, but without regard to specific functional subregions within this area or the individual functional impairments of each animal (Alia et al., 2017; Coleman et al., 2017). In light of the present study, we propose that this lack of precision may be an important contributing factor to the conflicting results observed in clinical trials where a treatment, such as transcranial magnetic stimulation, delivered to one specific brain region across patients can differentially interfere with or promote recovery (Nowak et al., 2009; McDonnell and Stinear, 2017). Instead, the targeted area in the perilesional region or contralesional hemisphere should be carefully selected based on the specific lesion profile and impairments, on a subject-by-subject basis. This approach is beginning to emerge in clinical noninvasive brain stimulation studies (Di Pino et al., 2014; Boddington and Reynolds, 2017). Similarly, delivery of other interventions, including stem cells and rehabilitation, could be adjusted based on knowledge of precise stroke location, level of impairment, and other predictive variables. This more personalized approach would not require that patients be enrolled in clinical trials based on lesion location. Instead, the knowledge of lesion location and the implications for recovery could help explain variability in differential responses to treatment between individuals. It is essential that preclinical research should also move in the same direction as clinical studies (Corbett et al., 2017), incorporating quantification of lesion volume and location when assessing therapies (e.g., optogenetic stimulation, stem cell transplants) to enhance stroke recovery (Tennant et al., 2017; Wahl et al., 2017; Jeffers et al., 2018b).
An important goal of preclinical and clinical research is the development of poststroke biomarkers that will lead to individualized stroke treatments to optimize poststroke recovery (Corbett et al., 2015, 2017; Boyd et al., 2017; Stinear et al., 2017). To accomplish this, individual biomarkers, be they functional, structural, or electrophysiological, need to be evaluated for their ability to predict long-term functional outcome. The results of the present study suggest that precise lesion location may be one such important prognostic factor for stroke recovery.
Footnotes
This work was supported by Heart and Stroke Foundation of Canada collaborative research grant to D.C. and N.D. We thank the University of Ottawa Preclinical Imaging Core and Dr. Greg Cron for conducting MRI.
The authors declare no competing financial interests.
References
- Alia C, Spalletti C, Lai S, Panarese A, Lamola G, Bertolucci F, Vallone F, Di Garbo A, Chisari C, Micera S, Caleo M (2017) Neuroplastic changes following brain ischemia and their contribution to stroke recovery: novel approaches in neurorehabilitation. Front Cell Neurosci 11:76. 10.3389/fncel.2017.00076 [DOI] [PMC free article] [PubMed] [Google Scholar]
- Balkaya MG, Trueman RC, Boltze J, Corbett D, Jolkkonen J (2018) Behavioral outcome measures to improve experimental stroke research. Behav Brain Res 352:161–171. 10.1016/j.bbr.2017.07.039 [DOI] [PubMed] [Google Scholar]
- Barth TM, Jones TA, Schallert T (1990) Functional subdivisions of the rat somatic sensorimotor cortex. Behav Brain Res 39:73–95. 10.1016/0166-4328(90)90122-u [DOI] [PubMed] [Google Scholar]
- Bernhardt J, Dewey H, Thrift A, Donnan G (2004) Inactive and alone: physical activity within the first 14 days of acute stroke unit care. Stroke 35:1005–1009. 10.1161/01.STR.0000120727.40792.40 [DOI] [PubMed] [Google Scholar]
- Bernhardt J, Hayward KS, Dancause N, Lannin NA, Ward NS, Nudo RJ, Farrin A, Churilov L, Boyd LA, Jones TA, Carmichael ST, Corbett D, Cramer SC (2019) A stroke recovery trial development framework: consensus-based core recommendations from the Second Stroke Recovery and Rehabilitation Roundtable. Int J Stroke 14:792–802. 10.1177/1747493019879657 [DOI] [PubMed] [Google Scholar]
- Biernaskie J, Corbett D, Peeling J, Wells J, Lei H (2001) A serial MR study of cerebral blood flow changes and lesion development following endothelin-1-induced ischemia in rats. Magn Reson Med 46:827–830. 10.1002/mrm.1263 [DOI] [PubMed] [Google Scholar]
- Boddington LJ, Reynolds JN (2017) Targeting interhemispheric inhibition with neuromodulation to enhance stroke rehabilitation. Brain Stimul 10:214–222. 10.1016/j.brs.2017.01.006 [DOI] [PubMed] [Google Scholar]
- Boyd LA, Hayward KS, Ward NS, Stinear CM, Rosso C, Fisher RJ, Carter AR, Leff AP, Copland DA, Carey LM, Cohen LG, Basso DM, Maguire JM, Cramer SC (2017) Biomarkers of stroke recovery: consensus-based core recommendations from the Stroke Recovery and Rehabilitation Roundtable. Int J Stroke 12:480–493. 10.1177/1747493017714176 [DOI] [PMC free article] [PubMed] [Google Scholar]
- Byblow WD, Stinear CM, Barber PA, Petoe MA, Ackerley SJ (2015) Proportional recovery after stroke depends on corticomotor integrity. Ann Neurol 78:848–859. 10.1002/ana.24472 [DOI] [PubMed] [Google Scholar]
- Chen CL, Tang FT, Chen HC, Chung CY, Wong MK (2000) Brain lesion size and location: effects on motor recovery and functional outcome in stroke patients. Arch Phys Med Rehabil 81:447–452. 10.1053/mr.2000.3837 [DOI] [PubMed] [Google Scholar]
- Coleman ER, Moudgal R, Lang K, Hyacinth HI, Awosika OO, Kissela BM, Feng W (2017) Early rehabilitation after stroke: a narrative review. Curr Atheroscler Rep 19:59. 10.1007/s11883-017-0686-6 [DOI] [PMC free article] [PubMed] [Google Scholar]
- Corbett D, Carmichael ST, Murphy TH, Jones TA, Schwab ME, Jolkkonen J, Clarkson AN, Dancause N, Wieloch T, Johansen-Berg H, Nilsson M, McCullough LD, Joy MT (2017) Enhancing the alignment of the preclinical and clinical stroke recovery research pipeline: consensus-based core recommendations from the Stroke Recovery and Rehabilitation Roundtable translational working group. Int J Stroke 12:462–471. 10.1177/1747493017711814 [DOI] [PubMed] [Google Scholar]
- Corbett D, Jeffers M, Nguemeni C, Gomez-Smith M, Livingston-Thomas J (2015) Lost in translation: rethinking approaches to stroke recovery. Prog Brain Res 218:413–434. [DOI] [PubMed] [Google Scholar]
- Dalton E, Churilov L, Lannin NA, Corbett D, Hayward KS (2019) Dose articulation in preclinical and clinical stroke recovery: refining a discovery research pipeline and presenting a scoping review protocol. Front Neurol 10:1148. 10.3389/fneur.2019.01148 [DOI] [PMC free article] [PubMed] [Google Scholar]
- Dancause N, Duric V, Barbay S, Frost SB, Stylianou A, Nudo RJ (2008) An additional motor-related field in the lateral frontal cortex of squirrel monkeys. Cereb Cortex 18:2719–2728. 10.1093/cercor/bhn050 [DOI] [PMC free article] [PubMed] [Google Scholar]
- Dea M, Hamadjida A, Elgbeili G, Quessy S, Dancause N (2016) Different patterns of cortical inputs to subregions of the primary motor cortex hand representation in Cebus apella. Cereb Cortex 26:1747–1761. 10.1093/cercor/bhv324 [DOI] [PMC free article] [PubMed] [Google Scholar]
- Deffeyes JE, Touvykine B, Quessy S, Dancause N (2015) Interactions between rostral and caudal cortical motor areas in the rat. J Neurophysiol 113:3893–3904. 10.1152/jn.00760.2014 [DOI] [PMC free article] [PubMed] [Google Scholar]
- Di Pino G, Pellegrino G, Assenza G, Capone F, Ferreri F, Formica D, Ranieri F, Tombini M, Ziemann U, Rothwell JC, Di Lazzaro V (2014) Modulation of brain plasticity in stroke: a novel model for neurorehabilitation. Nat Rev Neurol 10:597–608. 10.1038/nrneurol.2014.162 [DOI] [PubMed] [Google Scholar]
- Dromerick AW, Reding MJ (1995) Functional outcome for patients with hemiparesis, hemihypesthesia, and hemianopsia: does lesion location matter? Stroke 26:2023–2026. 10.1161/01.str.26.11.2023 [DOI] [PubMed] [Google Scholar]
- Edwardson MA, Wang X, Liu B, Ding L, Lane CJ, Park C, Nelsen MA, Jones TA, Wolf SL, Winstein CJ, Dromerick AW (2017) Stroke lesions in a large upper limb rehabilitation trial cohort rarely match lesions in common preclinical models. Neurorehabil Neural Repair 31:509–520. 10.1177/1545968316688799 [DOI] [PMC free article] [PubMed] [Google Scholar]
- Feng W, Wang J, Chhatbar PY, Doughty C, Landsittel D, Lioutas VA, Kautz SA, Schlaug G (2015) Corticospinal tract lesion load: an imaging biomarker for stroke motor outcomes. Ann Neurol 78:860–870. 10.1002/ana.24510 [DOI] [PMC free article] [PubMed] [Google Scholar]
- Hall RD, Lindholm EP (1974) Organization of motor and somatosensory neocortex in the albino rat. Brain Res 66:23–38. 10.1016/0006-8993(74)90076-6 [DOI] [Google Scholar]
- Harvey RL, Edwards D, Dunning K, Fregni F, Stein J, Laine J, Rogers LM, Vox F, Durand-Sanchez A, Bockbrader M, Goldstein LB, Francisco GE, Kinney CL, Liu CY, Ryan S, Morales-Quezada L, Worthen-Chaudhari L, Labar D, Schambra H, Kappy CR, et al. (2018) Randomized sham-controlled trial of navigated repetitive transcranial magnetic stimulation for motor recovery in stroke: the NICHE trial. Stroke 49:2138–2146. 10.1161/STROKEAHA.117.020607 [DOI] [PubMed] [Google Scholar]
- Hayward KS, Schmidt J, Lohse KR, Peters S, Bernhardt J, Lannin NA, Boyd LA (2017) Are we armed with the right data? Pooled individual data review of biomarkers in people with severe upper limb impairment after stroke. Neuroimage Clin 13:310–319. 10.1016/j.nicl.2016.09.015 [DOI] [PMC free article] [PubMed] [Google Scholar]
- Jeffers MS, Karthikeyan S, Corbett D (2018a) Does stroke rehabilitation really matter? A. Proportional stroke recovery in the rat. Neurorehabil Neural Repair 32:3–6. 10.1177/1545968317751210 [DOI] [PubMed] [Google Scholar]
- Jeffers MS, Karthikeyan S, Gomez-Smith M, Gasinzigwa S, Achenbach J, Feiten A, Corbett D (2018b) Does stroke rehabilitation really matter? B. An algorithm for prescribing an effective intensity of rehabilitation. Neurorehabil Neural Repair 32:73–83. 10.1177/1545968317753074 [DOI] [PubMed] [Google Scholar]
- Jones TA, Adkins DL (2015) Motor system reorganization after stroke: stimulating and training toward perfection. Physiology (Bethesda) 30:358–370. 10.1152/physiol.00014.2015 [DOI] [PMC free article] [PubMed] [Google Scholar]
- Karthikeyan S, Jeffers MS, Carter A, Corbett D (2019) Characterizing spontaneous motor recovery following cortical and subcortical stroke in the rat. Neurorehabil Neural Repair 33:27–37. 10.1177/1545968318817823 [DOI] [PubMed] [Google Scholar]
- Kenah K, Bernhardt J, Cumming T, Spratt N, Luker J, Janssen H (2018) Boredom in patients with acquired brain injuries during inpatient rehabilitation: a scoping review. Disabil Rehabil 40:2713–2722. 10.1080/09638288.2017.1354232 [DOI] [PubMed] [Google Scholar]
- Kim B, Winstein C (2017) Can neurological biomarkers of brain impairment be used to predict poststroke motor recovery? A systematic review. Neurorehabil Neural Repair 31:3–24. 10.1177/1545968316662708 [DOI] [PubMed] [Google Scholar]
- Kim SY, Jones TA (2010) Lesion size-dependent synaptic and astrocytic responses in cortex contralateral to infarcts in middle-aged rats. Synapse 64:659–671. 10.1002/syn.20777 [DOI] [PMC free article] [PubMed] [Google Scholar]
- Kirton A, Chen R, Friefeld S, Gunraj C, Pontigon AM, DeVeber G (2008) Contralesional repetitive transcranial magnetic stimulation for chronic hemiparesis in subcortical paediatric stroke: a randomised trial. Lancet Neurol 7:507–513. 10.1016/S1474-4422(08)70096-6 [DOI] [PubMed] [Google Scholar]
- Krakauer JW, Carmichael ST (2017) Broken movement: the neurobiology of motor recovery after stroke. Cambridge, MA: Massachusetts Institute of Technology. [Google Scholar]
- Krakauer JW, Marshall RS (2015) The proportional recovery rule for stroke revisited. Ann Neurol 78:845–847. 10.1002/ana.24537 [DOI] [PubMed] [Google Scholar]
- Lang CE, Lohse KR, Birkenmeier RL (2015) Dose and timing in neurorehabilitation: prescribing motor therapy after stroke. Curr Opin Neurol 28:549–555. 10.1097/WCO.0000000000000256 [DOI] [PMC free article] [PubMed] [Google Scholar]
- Leyton AS, Sherrington CS (1917) Observations of the excitable cortex of the chimpanzee, orangutan, and gorilla. Exp Physiol 11:135–222. 10.1113/expphysiol.1917.sp000240 [DOI] [Google Scholar]
- Lohse KR, Lang CE, Boyd LA (2014) Is more better? Using metadata to explore dose-response relationships in stroke rehabilitation. Stroke 45:2053–2058. 10.1161/STROKEAHA.114.004695 [DOI] [PMC free article] [PubMed] [Google Scholar]
- McDonnell MN, Stinear CM (2017) TMS measures of motor cortex function after stroke: a meta-analysis. Brain Stimul 10:721–734. 10.1016/j.brs.2017.03.008 [DOI] [PubMed] [Google Scholar]
- McNeal DW, Darling WG, Ge J, Stilwell-Morecraft KS, Solon KM, Hynes SM, Pizzimenti MA, Rotella DL, Vanadurongvan T, Morecraft RJ (2010) Selective long-term reorganization of the corticospinal projection from the supplementary motor cortex following recovery from lateral motor cortex injury. J Comp Neurol 518:586–621. 10.1002/cne.22218 [DOI] [PMC free article] [PubMed] [Google Scholar]
- Montoya CP, Campbell-Hope LJ, Pemberton KD, Dunnett SB (1991) The “staircase test”: a measure of independent forelimb reaching and grasping abilities in rats. J Neurosci Methods 36:219–228. 10.1016/0165-0270(91)90048-5 [DOI] [PubMed] [Google Scholar]
- Neafsey EJ, Bold EL, Haas G, Hurley-Gius KM, Quirk G, Sievert CF, Terreberry RR (1986) The organization of the rat motor cortex: a microstimulation mapping study. Brain Res Rev 11:77–96. 10.1016/0165-0173(86)90011-1 [DOI] [PubMed] [Google Scholar]
- Nowak DA, Grefkes C, Ameli M, Fink GR (2009) Interhemispheric competition after stroke: brain stimulation to enhance recovery of function of the affected hand. Neurorehabil Neural Repair 23:641–656. 10.1177/1545968309336661 [DOI] [PubMed] [Google Scholar]
- Nudo RJ, Milliken GW (1996) Reorganization of movement representations in primary motor cortex following focal ischemic infarcts in adult squirrel monkeys. J Neurophysiol 75:2144–2149. 10.1152/jn.1996.75.5.2144 [DOI] [PubMed] [Google Scholar]
- Page SJ, Gauthier LV, White S (2013) Size doesn't matter: cortical stroke lesion volume is not associated with upper extremity motor impairment and function in mild, chronic hemiparesis. Arch Phys Med Rehabil 94:817–821. 10.1016/j.apmr.2013.01.010 [DOI] [PMC free article] [PubMed] [Google Scholar]
- Palomero-Gallagher N, Zilles K (2015) Isocortex. In: The rat nervous system, Ed 4 (Paxinos G, ed), pp 601–625. San Diego: Elsevier. [Google Scholar]
- Papp EA, Leergaard TB, Calabrese E, Johnson GA, Bjaalie JG (2014) Waxholm space atlas of the Sprague Dawley rat brain. Neuroimage 97:374–386. 10.1016/j.neuroimage.2014.04.001 [DOI] [PMC free article] [PubMed] [Google Scholar]
- Peeling J, Corbett D, Del Bigio MR, Hudzik TJ, Campbell TM, Palmer GC (2001) Rat middle cerebral artery occlusion: correlations between histopathology, T2-weighted magnetic resonance imaging, and behavioral indices. J Stroke Cerebrovasc Dis 10:166–177. 10.1053/jscd.2001.26865 [DOI] [PubMed] [Google Scholar]
- Prabhakaran S, Zarahn E, Riley C, Speizer A, Chong JY, Lazar RM, Marshall RS, Krakauer JW (2008) Inter-individual variability in the capacity for motor recovery after ischemic stroke. Neurorehabil Neural Repair 22:64–71. 10.1177/1545968307305302 [DOI] [PubMed] [Google Scholar]
- Rand D, Eng JJ (2012) Disparity between functional recovery and daily use of the upper and lower extremities during subacute stroke rehabilitation. Neurorehabil Neural Repair 26:76–84. 10.1177/1545968311408918 [DOI] [PMC free article] [PubMed] [Google Scholar]
- Rosbergen IC, Grimley RS, Hayward KS, Walker KC, Rowley D, Campbell AM, McGufficke S, Robertson ST, Trinder J, Janssen H, Brauer SG (2017) Embedding an enriched environment in an acute stroke unit increases activity in people with stroke: a controlled before-after pilot study. Clin Rehabil 31:1516–1528. 10.1177/0269215517705181 [DOI] [PubMed] [Google Scholar]
- Schallert T, Fleming SM, Leasure JL, Tillerson JL, Bland ST (2000) CNS plasticity and assessment of forelimb sensorimotor outcome in unilateral rat models of stroke, cortical ablation, parkinsonism and spinal cord injury. Neuropharmacology 39:777–787. 10.1016/s0028-3908(00)00005-8 [DOI] [PubMed] [Google Scholar]
- Schallert T, Woodlee MT, Fleming SM (2002) Disentangling multiple types of recovery from brain injury recovery of function. In: Pharmacology of Cerebral Ischemia (Krieglstein J, Klump S, eds). Stuttgart, Germany: Medpharm Scientific. [Google Scholar]
- Smith MC, Stinear CM (2016) Transcranial magnetic stimulation (TMS) in stroke: ready for clinical practice? J Clin Neurosci 31:10–14. 10.1016/j.jocn.2016.01.034 [DOI] [PubMed] [Google Scholar]
- Stinear CM, Barber PA, Petoe M, Anwar S, Byblow WD (2012) The PREP algorithm predicts potential for upper limb recovery after stroke. Brain 135:2527–2535. 10.1093/brain/aws146 [DOI] [PubMed] [Google Scholar]
- Stinear CM, Byblow WD, Ackerley SJ, Smith MC, Borges VM, Barber PA (2017) PREP2: a biomarker-based algorithm for predicting upper limb function after stroke. Ann Clin Transl Neurol 4:811–820. 10.1002/acn3.488 [DOI] [PMC free article] [PubMed] [Google Scholar]
- Stinear CM, Lang CE, Zeiler S, Byblow WD (2020) Advances and challenges in stroke rehabilitation. Lancet Neurol 19:348–360. 10.1016/S1474-4422(19)30415-6 [DOI] [PubMed] [Google Scholar]
- Taub E, Uswatte G, Mark VW, Morris DM (2006) The learned nonuse phenomenon: implications for rehabilitation. Eura Medicophys 42:241–256. [PubMed] [Google Scholar]
- Tennant KA, Taylor SL, White ER, Brown CE (2017) Optogenetic rewiring of thalamocortical circuits to restore function in the stroke injured brain. Nat Commun 8:15879. 10.1038/ncomms15879 [DOI] [PMC free article] [PubMed] [Google Scholar]
- Touvykine B, Mansoori BK, Jean-Charles L, Deffeyes J, Quessy S, Dancause N (2016) The effect of lesion size on the organization of the ipsilesional and contralesional motor cortex. Neurorehabil Neural Repair 30:280–292. 10.1177/1545968315585356 [DOI] [PMC free article] [PubMed] [Google Scholar]
- Wahl AS, Büchler U, Brändli A, Brattoli B, Musall S, Kasper H, Ineichen BV, Helmchen F, Ommer B, Schwab ME (2017) Optogenetically stimulating intact rat corticospinal tract post-stroke restores motor control through regionalized functional circuit formation. Nat Commun 8:1187. 10.1038/s41467-017-01090-6 [DOI] [PMC free article] [PubMed] [Google Scholar]
- West T, Bernhardt J (2012) Physical activity in hospitalised stroke patients. Stroke Res Treat 2012:813765. 10.1155/2012/813765 [DOI] [PMC free article] [PubMed] [Google Scholar]
- Winstein CJ, Wolf SL, Dromerick AW, Lane CJ, Nelsen MA, Lewthwaite R, Cen SY, Azen SP, Interdisciplinary Comprehensive Arm Rehabilitation Evaluation (ICARE) Investigative Team. (2016) Effect of a task-oriented rehabilitation program on upper extremity recovery following motor stroke the ICARE randomized clinical trial. JAMA 315:571–581. 10.1001/jama.2016.0276 [DOI] [PMC free article] [PubMed] [Google Scholar]
- Winters C, Van Wegen EE, Daffertshofer A, Kwakkel G (2015) Generalizability of the proportional recovery model for the upper extremity after an ischemic stroke. Neurorehabil Neural Repair 29:614–622. 10.1177/1545968314562115 [DOI] [PubMed] [Google Scholar]
- Xerri C, Merzenich MM, Peterson BE, Jenkins W (1998) Plasticity of primary somatosensory cortex paralleling sensorimotor skill recovery from stroke in adult monkeys. J Neurophysiol 79:2119–2148. 10.1152/jn.1998.79.4.2119 [DOI] [PubMed] [Google Scholar]
- Zeiler SR, Gibson EM, Hoesch RE, Li MY, Worley PF, O'Brien RJ, Krakauer JW (2013) Medial premotor cortex shows a reduction in inhibitory markers and mediates recovery in a mouse model of focal stroke. Stroke 44:483–489. 10.1161/STROKEAHA.112.676940 [DOI] [PMC free article] [PubMed] [Google Scholar]
Associated Data
This section collects any data citations, data availability statements, or supplementary materials included in this article.
Supplementary Materials
ImageJ macro script to assist manual infarct volume size/location quantification. Download Figure 2-1, ZIP file (4.6KB, zip)