

Abstract

Having a clear understanding of the permeability variation mechanism is important for controlling the process of displacement of CH4 with CO2 in deep coal seams. Based on the stress–strain equation of porous elastic media and horizontal strain variations of coal, a mathematical model predicting permeability variation after CO2 injection into gas saturated coal seams was established. The model shows that, during the displacement of CH4 with CO2, the shrinkage strain of the coal matrix increases logarithmically with the decrease of pore pressure. With a decrease in the reservoir pressure, permeability rebound occurs with the influence of matrix shrinkage and gas slippage. Under low confining pressures, the rebounded permeability is high, and its associated rebound pore pressure is also high. For coals with a high cleat compression coefficient, the permeability decreases range is obvious. And permeability rebound only happens under low reservoir pressures. Coal properties, e.g., Poisson’s ratio and Langmuir volume, show obvious influences in permeability variation during gas production. The model was also extended to predict permeability variation for a well-control area. During gas drainage process, the permeability in the well-controlled area first increases, then decreases, and then slowly returns to the original state with the lengthening of well-controlled radius. Under high confining pressures, the permeability decline range is more obvious. Also, correspondingly, the attenuation range of permeability increases and the rebound range decreases. The proposed model is beneficial in predicting permeability variations during the displacement of CH4 with CO2, as well as guiding CO2 injection into coal seams.
1. Introduction
Coal reservoirs are three-dimensional units composed of coal matrices, liquids, and gases, and they typically comprise dual-porosity media, with matrix pores and cleats/fractures.1,2 Coalbed methane (CBM) is mainly adsorbed onto rock matrices, where cleats and fractures are the main channels for gas and water flow.3−6 In the replacement of CH4 by CO2 injection into a coal seam, competitive adsorptions between CH4 and CO2 occur in the matrix.5 With the decrease of coalbed pressure, gases in matrix pores will gradually desorb and diffuse into the fracture system, flowing through the fractures to the production well.7−9 During the displacement process, the decrease in reservoir pressure has both positive and negative effects on permeability.8 While decreased pore pressure leads to the increase of effective stress, compressing the coal fracture system and reducing permeability, the gas is also displaced and desorbed, resulting in the shrinkage of the coal matrix shrinkage, which can partially offset the negative impact of effective stress.10−13
Based on the different adsorption capacities of CO2 and CH4, and assuming that the adsorption capacity of coal is proportional to its expansion, Pekot and Reeves14 established a model for variations in permeability when CO2 replaces CH4. Chen et al.15 further established a mathematical model based on stress and the physical constraints on coal porosity and permeability. Based on the models proposed by Chen et al.15 and Wu et al.,16 Kumar et al.17 constructed a new model that accounted for variations in matrix permeability and the competitive adsorption of binary CO2 and CH4 gases. This model included a modified competitive adsorption permeability for binary gases following that of Wu et al.16
Many studies have been conducted to explore variations in the permeability of CO2- and CH4-flooded coal cores; however, few studies have focused on the variations in stress–strain and permeability during the process of displacement of CH4 with CO2. The objective of this study was to develop a permeability model, considering (1) the competitive adsorption mechanism of CO2 and CH4 during the CO2 injection process; (2) the variation in stress–strain during CO2 adsorption and CH4 desorption process; and (3) the distribution of permeability around the CO2 injection well-controlled area. Here, we detail the deduction of the permeability model, with a comparison to former experimental works. Further, the influencing factors associated with the permeability model were also analyzed to provide guidance for future CO2 sequestration and enhanced coalbed methane (ECBM) projects.
2. Results and Discussion
2.1. Deformation of Coal Matrices during Desorption after Co2 Injection
To calculate and analyze the deformation of coal matrices during pore pressure reduction after displacement with CO2, the adsorption constants of CH4 and CO2, and the mechanical properties of coal samples were measured. The mechanical parameters of the Tunliu coal samples are shown in Table 1 of Part 1 of this study, and the adsorption constants under different confining pressures are shown in Table 2(18) In the first part of this study, experiments were conducted in which CO2 displaced CH4, and the molar fractions of the free phase CO2 that displaced CH4 under different confining pressures were measured. The partial pressures during coal desorption under different confining pressures were determined, and the results are shown in Table 3.
Table 1. Coal Parameter of Samples.
| parameters | ρc (g/cm3) | E (GPa) | v | Cf (MPa–1) | T (K) |
|---|---|---|---|---|---|
| Tunliu sample | 1.36 | 3.50 | 0.30 | 0.062 | 298.15 |
Abbreviations: ρc is density of coal; E, elastic modulus; v, Poisson ratio; Cf, cleat compression coefficient; T, temperature.
Table 2. Adsorption Constants of Tunliu Samples under Different Confining Pressures.
|
a (cm3/g) |
b (MPa–1) |
|||
|---|---|---|---|---|
| confining pressure (MPa) | CH4 | CO2 | CH4 | CO2 |
| 8 | 8.13 | 19.42 | 0.48 | 0.92 |
| 12 | 8.40 | 19.77 | 0.40 | 0.80 |
| 16 | 8.54 | 19.79 | 0.34 | 0.71 |
| 20 | 8.59 | 19.84 | 0.33 | 0.69 |
Abbreviations: aCO2 and aCH4 are the maximum adsorption capacities of VCO2 and VCH4 (cm3/g), and bCO2 and bCH4 are the adsorption equilibrium constants of CO2 and CH4 (1/MPa).
Table 3. Partial Pressure of Displacement of CH4 with CO2 in the Desorption Process.
| confining
pressure 8 MPa |
confining
pressure 12 MPa |
confining
pressure 16 MPa |
confining
pressure 20 MPa |
|||||
|---|---|---|---|---|---|---|---|---|
| gas pressure (MPa) | PCH4 (MPa) | PCO2 (MPa) | PCH4 (MPa) | PCO2 (MPa) | PCH4 (MPa) | PCO2 (MPa) | PCH4 (MPa) | PCO2 (MPa) |
| 6.25 | 4.78 | 1.47 | 4.83 | 1.42 | 4.85 | 1.41 | 4.87 | 1.38 |
| 5.25 | 3.98 | 1.27 | 4.03 | 1.22 | 4.05 | 1.20 | 4.05 | 1.20 |
| 4.25 | 3.18 | 1.07 | 3.20 | 1.05 | 3.23 | 1.02 | 3.25 | 1.00 |
| 3.25 | 2.36 | 0.89 | 2.38 | 0.87 | 2.41 | 0.84 | 2.46 | 0.79 |
| 2.25 | 1.55 | 0.70 | 1.57 | 0.68 | 1.61 | 0.64 | 1.63 | 0.62 |
| 1.25 | 0.82 | 0.43 | 0.84 | 0.41 | 0.87 | 0.38 | 0.89 | 0.36 |
Abbreviations: PCO2 and PCH4 are the partial pressures of CO2 and CH4 at adsorption equilibrium (MPa).
In view of both parts of this study, it can be seen that during the desorption process after CO2 injection, the partial pressure of CH4 was higher than that of CO2. This is because the adsorption capacity of CO2 is stronger than that of CH4, so the desorption capacity of CH4 is high during desorption. This results in the concentration of free phase CH4 in coal is higher than that of CO2, and the partial pressure of CH4 is also higher. Additionally, with increased confining pressure, the partial pressure of CH4 increased, and the partial pressure of CO2 decreased. Thus, based on eq 4, and according to the partial pressure data of CH4 and CO2 in Table 3, the m and n values may be fitted (Table 4).
Table 4. Fitting Values of Desorption Process Parameters m and n.
| confining pressures (MPa) | 8 | 12 | 16 | 20 |
|---|---|---|---|---|
| m | 0.2787 | 0.2832 | 0.2528 | 0.2212 |
| n | 1.6428 | 1.7441 | 1.9837 | 2.2318 |
Abbreviations: m and n are constants.
So far, the parameters involved in the mathematical model of coal matrix deformation have been given. By substituting these parameters, the variation in the strain of the coal matrix caused by CH4 and CO2 during desorption and under various confining pressures can be obtained. Figure 1 shows the variation of coal matrix strain in the process of pore pressure reduction after CO2 replacement. The negative change in coal matrix strain represents shrinkage of the coal matrix, which was caused by gas desorption. It can be seen from this figure that with decreasing pore pressure, the shrinkage of the coal matrix caused by coal desorption increased gradually, and the shrinkage strain exhibited a logarithmic relationship with pore pressure. At the same pore pressure and with the increase of confining pressure, the shrinkage of the coal matrix caused by coal desorption decreased. This is due to the increase of confining pressure (i.e., the stress due to overburden increased and the amount of gas desorption decreased). This led to a lower amount of gas being desorbed by coal matrices under high confining pressures, so the shrinkage strain of the coal matrices decreased and the confining pressure had a negative effect on this shrinkage.
Figure 1.
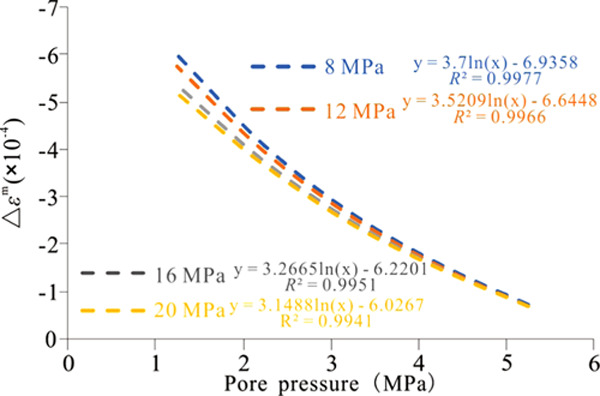
Variation in the strain of coal matrix during desorption.
2.2. Variation in Permeability during Drainage after CO2 Injection
The model of variation in permeability considers the influence of the gas slippage effect, so it is necessary to determine the critical pore pressure and coefficient of slippage. At present, the critical pore pressure when the gas slippage effect occurs has not been clearly defined. Zhu et al.19 proposed that the critical pore pressure of slippage is 1.5 MPa following percolation experiments in low-permeability gas reservoirs. Therefore, our model predicts that there will be slippage when the pore pressure decreases to 1.5 MPa.
Yuedong et al.20,21 found that the slippage coefficient was positively correlated with temperature, gas viscosity, and lithological parameters and negatively correlated with the molecular weight of the gas. Here, the slippage coefficient was determined by the expression
| 1 |
where c is a constant, taken as 0.9 MPa, μ is the viscosity of the gas at the experimental temperature (MPa·s), w is the channel width (μm), R is the general gas constant, 8.314 J/(K·mol), T is the absolute temperature (K), and M is the molecular weight of the gas (g/mol).
The permeability calculated by the mathematical model (eq 1) was compared with the measured results, and the fitted results are shown in Figure 2. The predictions of reservoir permeability during pressure reduction after CO2 injection in the Tunliu area under confining pressures of 8, 12, 16, and 20 MPa were also compared with the experimental displacement data. The results show that the mathematical model effectively captures the variation in permeability during the discharge process of CO2 injection in coal reservoirs of different depths.
Figure 2.

Permeability model predication curves under different confining pressures: (a) 8 MPa, (b) 12 MPa, (c) 16 MPa, and (d) 20 MPa.
To evaluate the accuracy of the model predictions, the relative error was used to evaluate the results. The expression of the relative error is as follows
| 2 |
where δ is the relative error (%). Subscripts 1 and 2 represent the predicted results of the mathematical model and laboratory test results, respectively. Equation 2 was used to analyze the relative error between the predicted results of the permeability model and the experimental results, as shown in Table 5. The results show that the relative errors ranged from 0.5 to 9.33%, and the errors were small, which further demonstrates that the mathematical model has a high degree of accuracy. Meanwhile, the mean relative error results show that the prediction error of the model was larger when the confining pressure was 20 MPa, which indicates that the model has better predictive power for coal reservoirs with lower confining pressures.
Table 5. Analysis of Relative Error between Predicted and Experimental Results of Permeability Model.
| confining pressure (MPa) | P (MPa) | (k/k0) predicted | (k/k0) tested | δ (%) | δ̅ (%) |
|---|---|---|---|---|---|
| 8 | 6.25 | 1 | 1 | 0 | 1.99 |
| 5.25 | 0.949 | 0.958 | 0.95 | ||
| 4.25 | 0.894 | 0.902 | 0.84 | ||
| 3.25 | 0.867 | 0.902 | 3.90 | ||
| 2.25 | 0.911 | 0.907 | 0.50 | ||
| 1.25 | 1.137 | 1.096 | 3.75 | ||
| 12 | 6.25 | 1 | 1 | 0 | 2.42 |
| 5.25 | 0.940 | 0.962 | 2.24 | ||
| 4.25 | 0.878 | 0.894 | 1.83 | ||
| 3.25 | 0.848 | 0.874 | 3.02 | ||
| 2.25 | 0.885 | 0.898 | 1.47 | ||
| 1.25 | 1.082 | 1.045 | 3.53 | ||
| 16 | 6.25 | 1 | 1 | 0 | 1.91 |
| 5.25 | 0.936 | 0.951 | 1.58 | ||
| 4.25 | 0.869 | 0.861 | 0.96 | ||
| 3.25 | 0.830 | 0.852 | 2.61 | ||
| 2.25 | 0.870 | 0.856 | 1.69 | ||
| 1.25 | 1.039 | 1.012 | 2.69 | ||
| 20 | 6.25 | 1 | 1 | 0 | 5.24 |
| 5.25 | 0.932 | 0.948 | 1.73 | ||
| 4.25 | 0.859 | 0.880 | 2.42 | ||
| 3.25 | 0.813 | 0.873 | 6.82 | ||
| 2.25 | 0.858 | 0.946 | 9.33 | ||
| 1.25 | 1.013 | 1.076 | 5.88 |
δ is relative error, %; δ̅, is the mean relative error, %.
2.3. Variation in Permeability within the Well-Controlled Area after CO2 Injection
Equation 17 is a mathematical model of the variation in reservoir permeability in planar space within a well-controlled area after CO2 injection into a coal seam. This model can be used to predict the dynamic change of reservoir permeability in radial and horizontal directions that are centered on CBM wells. Assuming that the radius of maximum influence is 100 m, the borehole radius is 0.25 m, the borehole pressure is 2 MPa, and the other parameters remain constant. The spatial variation in permeability under different confining pressures is then predicted according to eq 17.
The variation in permeability in the radial direction under different confining pressures is shown in Figure 3. The permeability first increases, then decreases, and then slowly returns to the original state with the increase in distance from the well-controlled area (i.e., permeability increases from 1 to 4 m away from the borehole; within this area, permeability increases, while beyond this 4 m radius permeability becomes attenuated). The permeability in this marginal area is lower than the original permeability, and the changes in permeability differ under different confining pressures. With the increase of confining pressure, permeability decreases; that is to say, the range increasing permeability in deep coal reservoirs increases and the area of attenuation decreases.
Figure 3.

Spatial variation in permeability by well-control radii under different confining pressures.
2.4. Analysis of the Factors Influencing the Coal Reservoir
Based on the established mathematical model, the parameters of coal permeability under the condition of the confining pressure with the minimum error (i.e., 16 MPa) were selected to analyze the factors influencing the coal reservoir parameters involved in this model. The influencing factors of the model include the confining pressure, cleat compression coefficient, Langmuir parameters, Poisson’s ratio, and the slippage coefficient. The purpose of the model was to analyze the stability of each parameter and the influence of each parameter on the permeability of coal and its importance. The value of each parameter is shown in Table 6.
Table 6. Analysis Parameters of Influencing Factors.
| parameter | confining pressure (MPa) | Cf (MPa–1) | v | aCH4 (m3/t) | b (MPa) |
|---|---|---|---|---|---|
| confining pressure | 8 | 0.052 | 0.3 | 8.54 | 0.62 |
| 12 | |||||
| 16 | |||||
| 20 | |||||
| cleat compression coefficient | 16 | 0.052 | 0.3 | 8.54 | 0.62 |
| 0.06 | |||||
| 0.07 | |||||
| 0.08 | |||||
| Poisson’s ratio | 16 | 0.052 | 0.25 | 8.54 | 0.62 |
| 0.3 | |||||
| 0.35 | |||||
| 0.4 | |||||
| Langmuir volume | 16 | 0.052 | 0.3 | 8.54 | 0.62 |
| 15 | |||||
| 25 | |||||
| 35 | |||||
| gas slippage coefficient | 16 | 0.052 | 0.3 | 8.54 | 0.58 |
| 0.62 | |||||
| 0.66 | |||||
| 0.69 |
Cf, cleat compression coefficient; v, Poisson’s ratio; aCH4, Langmuir volume; b (MPa), gas slippage coefficient.
2.4.1. Confining Pressure
Figure 2 shows the variation in coal reservoir permeability with the decrease of pore pressure under different confining pressures (8, 12, 16, and 20 MPa). In the process of pore pressure reduction, the permeability under various confining pressures first decreased and then rebounded. With increased confining pressure, the attenuation of reservoir permeability increased and the rebound decreased. The critical pore pressure for permeability rebound decreased with the increase of confining pressure (i.e., the inflection point moved to a lower pore pressure). When the confining pressure increased from 8 to 20 MPa, the critical pore pressure for permeability rebound decreases by 0.5 MPa, and confining pressure had little effect on the rebound pressure.
2.4.2. Cleat Compression Coefficient
The cleat compression coefficient represents the compressibility of effective stress to coal cleats/fractures. An increase in the cleat compression coefficient indicates that under the same effective stress, the cleat compression strain of coal increased and the sensitivity to changes in stress increased, which resulted in an increased reduction of permeability. Figure 4a shows the effects of different cleat compression coefficients on reservoir permeability. From this figure, it can be seen that with the increase of the cleat compression coefficient, the decline of reservoir permeability increases. As the gas slippage effect is considered in the permeability model, when pore pressure was low, the positive effect of matrix shrinkage on permeability and gas slippage were the dominant factors, which offset the effect of the partial effective stress. Therefore, even with the increase of the cleat compression coefficient, coal permeability still improved slightly at low pore pressures; the permeability rebounded, even though the rebound effect was not as strong as that of the low cleat compression coefficient.
Figure 4.

Model factor analysis: (a) cleat compression coefficient; (b) Poisson’s ratio; (c) Langmuir volume; and (d) gas slippage coefficient.
2.4.3. Poisson’s Ratio
Poisson’s ratio in this study refers to the ratio of transverse to longitudinal strain in coal. In the process of increasing Poisson’s ratio, the permeability of coal decreases and the improvement of permeability thus decreases (Figure 4b). When Poisson’s ratio increases to a certain extent, the permeability cannot recover to the original vale. Additionally, the critical pressure of permeability moves to low pore pressure with the increasing Poisson’s ratio.
2.4.4. Langmuir Volume
The maximum gas adsorption capacity parameter is the parameter in the Langmuir isothermal adsorption equation (i.e., the Langmuir volume). The permeability model established in this study is based on the matrix shrinkage caused by the desorption of binary CH4 and CO2 mixed gases. Changes in the maximum adsorption capacities of the two gases have the same effect on the permeability. Therefore, the maximum adsorption capacity of CH4 was taken as an example for analysis. Figure 4c shows the effect of the increase in the maximum adsorption capacity of CH4 on the variation in permeability. The higher the maximum adsorption capacity of CH4 was, the lesser was the attenuation and the greater was the improvement in permeability.
2.4.5. Gas Slippage Coefficient
The gas slippage coefficient is a parameter describing the influence of the slippage effect on coal permeability. In this study, 1.5 MPa was chosen as the critical pore pressure for slippage, so changes in the slippage coefficient only affected the reservoir permeability for pore pressures <1.5 MPa. Figure 4d shows the effect of increasing the slip coefficient on reservoir permeability. Before the pore pressure decreases to the critical value needed to induce slippage, the permeability decreases to the same extent. When the pressure decreases to the critical value, increases in the slip coefficient increase the permeability of the coal and coal-bearing rocks.
3. Conclusions
Based on the stress–strain constitutive equation of porous elastic media, and combining the horizontal strain model of coal, we established a mathematical model for predicting coal permeability variation during the displacement of CH4 with CO2. After CO2 injection, the shrinkage strain of coal matrices increases logarithmically with the decreases of pore pressure and decreases with the increase in confining pressure. In the process of displacement of CH4 with CO2, the predicted permeability first decreases and then increases.
During the drainage process, the permeability in the well-controlled area first increases, then decreases, and then slowly returns to the original state with the increase in well-controlled radius. Under high confining pressures, the decline range in permeability increases. Correspondingly, the attenuation ranges of permeability increase and the rebound range decreases.
Cleat compression coefficient, confining pressure, Poisson’s ratio, and Langmuir show different influences on permeability variation. As for permeability decrease caused by confining pressures, matrix shrinkage and gas slippage can recover the permeability loss to some extent. The permeability rebound point also varies with different coal property and reservoir environment conditions. The proposed model has guiding significance for predicting permeability variations and better understanding and application of CO2-ECBM.
4. Theory and Model Establishment
4.1. Theory
Barenblatt et al.22 put forth an introduction to dual-porosity media, which considered that rock masses are composed of matrix blocks containing pore spaces, with fracture systems separating matrix blocks. Subsequently, Close23 stated that coal is a typical dual-porosity medium composed of a high-storage-capacity and low-permeability pore system and a low-storage-capacity and high-permeability fracture system. Fractures in coal are also called cleats and are divided into face cleats and butt cleats, according to their directions.24 The two sides are orthogonal to each other, and coal is divided into independent coal matrix units (Figure 5a). The pore diameter of a coal matrix unit is generally less than 20 × 10–10 m, making its permeability close to zero. Therefore, the fractured permeability of coal is equal to that of the coal permeability.8,26,27
Figure 5.

(a) Schematic of coal-rock fracture system. (b) Conceptual matchstick model. Reprinted with permission from refs (24) and (25). Copyright 1998 and 2013 Elsevier.
Reiss28 proposed a conceptual matchstick model of coal structure in 1980 (Figure 5b) on the basis of the unique fracture systems observed. The matchstick model assumes that the coal fracture system contains two sets of plates with equal spacing, which are orthogonal to one another and perpendicular to the coal seam. At the same time, the coal matrix unit is assumed to be a cube, with matrix pores evenly distributed within. The essence of the matchstick model is to provide support for the coal structure under the hypothesis of isotropy.28 Many mathematical models of coal reservoir permeability are derived from this matchstick model.29−32 Thus, the matchstick model was used as the structural model of coal in the process of replacing CH4.
Coalbed methane extraction via CO2 injection involves many physical processes, such as multicomponent gas adsorption/desorption, seepage, and coal deformation. Therefore, seepage mechanics, the mechanics of porous media, surficial chemistry, and other disciplines must be integrated.33 Based on the matchstick model, the following hypotheses (H#) were introduced in this modeling study:
-
(1)
H1: coal is a dual-porosity medium;
-
(2)
H2: if the temperature of a coal reservoir is constant, the gas is ideal and saturated;
-
(3)
H3: coal matrices are incompressible;
-
(4)
H4: the mechanical properties of coal in the same coal seam are isotropic, and the entire coal matrix unit is thus isotropic;
-
(5)
H5: coal reservoirs are not affected by tectonic stress; stress is caused by overburden, and the horizontal principal stress is equal;
-
(6)
H6: the permeability of coal depends on the fracture system.
4.2. Coal Matrix Deformation after CO2 Injection
When CO2 is injected into a coal seam, competitive adsorption occurs between CO2 and CH4, as the coal has a stronger adsorption capacity to CO2.34,35 After replacement equilibrium is achieved, part of the CH4 changes from an adsorbed phase to a free phase.36,37 With the decrease of pressure and the gradual desorption of adsorbed gas, the coal matrix is deformed, and the total deformation of the matrix may be calculated as follows
| 3 |
where εm is the deformation of the coal matrix during displacement (dimension: 1), εCO2m is the deformation of the coal matrix caused by CO2 during pressure reduction (dimension: 1), and εCH4 is the deformation of the coal matrix caused by CH4 in the process of pressure reduction (dimension: 1).
The molar fractions of CO2 and CH4 in their free phases change during desorption; the molar fraction in the free phase are related as follows38
| 4 |
where CCO2and CCH4 are the molar fractions (%) of CO2 and CH4 in the free phase, respectively, and the sum of the two fractions is 1; m and n are constants and can be obtained by the experimental fitting.
The swelling/shrinkage strain model of coal matrices caused by single-gas adsorption/desorption was developed by Liu et al.39 The coal matrix deformation equation accounts for not only the swelling and shrinkage deformation caused by adsorption and desorption but also for the compression deformation caused by the compression of the coal skeleton. When the pressure changes from P1 to P2, the strain caused by the coal matrix is as follows
| 5 |
where ε is the linear strain of the coal matrix (dimension: 1), ρc is the density of the coal matrix (g/cm3), V is the adsorbed gas content (cm3/g), V0 is the standard molar volume, 22.4 L/mol; E is the elastic modulus of coal (MPa), R is the universal gas constant, 8.314 J/(K·mol), T is the absolute temperature (K), P is the gas pressure (MPa), and v is Poisson’s ratio (dimension: 1).
The matrix deformation models caused by CO2 and CH4 desorption can be obtained (the gas can be CO2 or CH4 in eq 6)
 |
6 |
By substituting eq 6 into eq 3, a mathematical model of the changes in total linear strain can be obtained.4,39−41
 |
7 |
The influences of gas desorption and gas pressure on the deformation of the coal matrix were considered in the model. The first term on the right side of eq 7 represents the effect of CH4 desorption on the matrix strain, the second represents the effect of CO2 desorption on the matrix strain, and the third term represents the effect of decreased mixed gas pressure on the matrix skeleton. The deformation of the coal matrix after the desorption of CH4 and CO2 is related not only to its physical properties but also to the changes in pore pressure and its adsorption and desorption characteristics.
4.3. Model of Variations in Permeability
Much work has been performed on the permeability models of coal reservoirs, which can be roughly divided into two categories: coupled models and analytical models.41−43 Both types of models are used to analyze the relationships among porosity, permeability, and stress–strain in coal reservoirs.25,42−45 Coupled models are generally based on finite-element theories, while analytical models are generally based on physical models. Compared to the complexity of coupled permeability models and the uncertainties in their parameters, analytical model parameters often have clear physical significance; representative analytical models include the Cui and Bustin (CB), Shi and Durucan (SD), and Palmer and Mansoori (PM) models.4,31,42,45−49 The first two of these models are used for predicting permeability and are based on stress; they establish the relationship between coal strain and permeability by studying variations in the horizontal effective stress.4,31,47 In contrast, the PM model is based on strain and correlates the coal strain and permeability by studying variations in porosity.48,49
In this study, a mathematical model of variation in permeability was constructed based on stress and from the perspective of strain, effective stress, and permeability. On the basis of a physical matchstick model, a predictive model of coal permeability related to the effective horizontal stress was given by Seidle.30 Here, a new model of variations in permeability is derived on the basis of the relationship between the horizontal effective stress and permeability
| 8 |
where k is permeability (mD), k0 is the initial reservoir permeability (mD), Cf is the cleat compression coefficient (1/MPa), and Δσh′ is the effective stress in the horizontal direction (MPa). The permeability model is based on the stress–strain equation of gas adsorption/desorption in isotropic porous media31
| 9 |
where σij includes the stresses in the i and j directions (MPa), E is Young’s modulus (MPa), v is Poisson’s ratio (equal to 1), εij includes the strain in the i and j directions (equal to 1), εkk is the strain volume (equal to 1), δij is the Kronecker constant, α is the Biot coefficient (equal to 1), K is the volume modulus of the coal (MPa), and εVm is the volume strain of the coal matrix caused by adsorption/decomposition (equal to 1). Among them, the Kronecker constant, Biot coefficient, and moduli of the coal mass exhibit the following relationships, respectively
| 10 |
| 11 |
| 12 |
where Ks is the bulk elasticity modulus of solid coal particles (MPa). As Ks is typically much higher than K, the Biot coefficient is considered to be 1 during the calculation.
Biot50 deduced the constitutive equation of saturated porous elastic media, expressed strain by stress, and introduced the notion of gas adsorption deformation, such that
| 13 |
where σkk is body stress (MPa), which is the sum of the three principal stresses, and G is the Lame constant (a.k.a., the shear modulus of elasticity). The Lame constant can be expressed as G = E/2(1 + v).
When the pore pressure falls below a critical value (Pc), the gas slippage effect may occur. For this reason, the effects of gas slippage on permeability under pore pressures of P < Pc can be considered. The mathematical expression of the slippage effect is
| 14 |
where Kg is the gas permeability under mean gas pressure conditions (mD), K1 is the Klingenberg permeability (mD), λ is the mean free path of gas molecules (μm), r is the mean radius of pores (μm), and C is the proportional factor.
Terzaghi51 put forth the principle of effective stress in saturated porous media. Assuming that the overlying pressure remains unchanged, the variation in the vertical strain of coal can be approximated by the variation in horizontal strain, and the horizontal principal stress of coal is equal, the effective stress in the x-direction is equal to the horizontal effective stress. Based on this, a mathematical model of variation in coal reservoir permeability was obtained
 |
15 |
where C is a proportional coefficient, which is related to the mechanical properties of the coal; its value can be obtained by fitting the experimental data; μ is defined as the ratio of the vertical strain to the horizontal strain.
The variation in coal permeability during desorption after CO2 injection is affected by three main factors. Before pore pressure declines to the critical value of slippage, the permeability is affected by both the effective stress and matrix shrinkage. When pore pressure reaches the critical pore pressure of slippage, the variation in permeability is affected by the effective stress, matrix shrinkage, and slippage.22 The model of changes in coal permeability during desorption after CO2 injection is
 |
16 |
4.4 Model of Spatial Variation in Permeability
The mathematical model of variation in the permeability of coal seams after CO2 injection describes the dynamic change in permeability at a certain point of reservoir production with the decrease of pore pressure. In the actual process of CBM drainage and production, determining the behavior of reservoir permeability in planar space is conducive to formulating reasonable drainage plans and improving the CBM recovery.1,2 During drainage and production, changes in reservoir pressure within CBM well-controlled areas are controlled by borehole pressure. After determining the relationship between reservoir pressure and borehole pressure in a well-controlled area, the distribution of permeability in planar space can be determined in combination with the model of variation in permeability established in Section 4.3.
It was assumed that the bottom-hole pressure remained unchanged during the process of CBM drainage and that the pore pressure at the boundary of the well-controlled area was the initial pore pressure. The reservoir and bottom-hole pressures within the range of the drainage and production wells can thus be expressed as
| 17 |
where P0 is the initial pore pressure (MPa), r (r ≤ rm) is the distance between a certain point and the drainage well (m), and rm is the farthest radius influenced by the CBM well (m), where Pw is bottom-hole pressure (MPa) and rw is the borehole radius (m).
Equation 16 also shows the relationship between pore pressure and bottom-hole pressure in the well-controlled area; it was thus substituted into the permeability model of displacement with CO2.
Acknowledgments
This work was supported by the National Natural Science Foundation of China (Grant No. 41702171), the National Major Science and Technology Projects of China (2016ZX05066001-002; No. 2017ZX05064005), the Beijing Municipal Excellent Talents Foundation (2017000020124G107), and the Joint Research Fund for Overseas Chinese Scholars and Scholars in Hong Kong and Macao (41728005).
The authors declare no competing financial interest.
References
- Rutqvist J.; Wu Y.-S.; Tsang C.-F.; Bodvarsson G. A modeling approach for analysis of coupled multiphase fluid flow, heat transfer, and deformation in fractured porous rock. Int. J. Rock Mech. Min. Min. Sci. 2002, 39, 429–442. 10.1016/S1365-1609(02)00022-9. [DOI] [Google Scholar]
- Li Y.; Zhang C.; Tang D.; Gan Q.; Niu X.; Wang K.; Shen R. Coal pore size distributions controlled by the coalification process: an experimental study of coals from the Junggar, Ordos, and Qinshui basins in China. Fuel 2017, 206, 352–363. 10.1016/j.fuel.2017.06.028. [DOI] [Google Scholar]
- Cui X.; Bustin R. M.; Chikatamarla L. Adsorption-induced coal swelling and stress: implications for methane production and acid gas sequestration into coal seams. J. Geophys. Res. 2007, 112, B10202 10.1029/2004JB003482. [DOI] [Google Scholar]
- Shi J.-Q.; Durucan S. A Model for Changes in coalbed permeability during primary and enhanced methane recovery. SPE Reservoir Eval. Eng. 2005, 8, 291–299. 10.2118/87230-PA. [DOI] [Google Scholar]
- Zhao S.; Li Y.; Wang Y.; Ma Z.; Huang X. Quantitative study on coal and shale pore structure and surface roughness based on atomic force microscopy and image processing. Fuel 2019, 244, 78–90. 10.1016/j.fuel.2019.02.001. [DOI] [Google Scholar]
- Clarkson C. R.; Bustin R. M. Binary gas adsorption/ desorption isotherms: Effect of moisture and coal composition upon carbon dioxide selectivity over methane. Int. J. Coal Geol. 2000, 42, 241–272. 10.1016/S0166-5162(99)00032-4. [DOI] [Google Scholar]
- Cui X.; Bustin R. M.; Dipple G. Selective transport of CO2, CH4, and N2 in coals: insights from modeling of experimental gas adsorption data. Fuel 2004, 83, 293–303. 10.1016/j.fuel.2003.09.001. [DOI] [Google Scholar]
- Harpalani S.; Schraufnagel R. A. Shrinkage of coal matrix with release of gas and its impact on permeability of coal. Fuel 1990, 69, 551–556. 10.1016/0016-2361(90)90137-F. [DOI] [Google Scholar]
- Li Y.; Wang Z.; Gan Q.; Niu X.; Xu W. Paleoenvironmental conditions and organic matter accumulation in Upper Paleozoic organic-rich rocks in the east margin of the Ordos Basin, China. Fuel 2019, 252, 172–187. 10.1016/j.fuel.2019.04.095. [DOI] [Google Scholar]
- Wang G. X.; Wei X. R.; Wang K.; Massarotto P.; Rudolph V. Sorption-induced swelling/shrinkage and permeability of coal under stressed adsorption/desorption conditions. Int. J. Coal Geol. 2010, 83, 46–54. 10.1016/j.coal.2010.03.001. [DOI] [Google Scholar]
- Mazumder S.; Wolf K. H. Differential swelling and permeability change of coal in response to CO2 injection for ECBM. Int. J. Coal Geol. 2008, 74, 123–138. 10.1016/j.coal.2007.11.001. [DOI] [Google Scholar]
- Li Y.; Wang Z.; Pan Z.; Niu X.; Yu Y.; Meng S. Pore structure and its fractal dimensions of transitional shale: A cross section from east margin of the Ordos Basin, China. Fuel 2019, 241, 417–431. 10.1016/j.fuel.2018.12.066. [DOI] [Google Scholar]
- Wang J.; Wang Z.; Wang Y.; Liu Z.; Li Y. CO2 Replacing CH4 Behaviors under Sub- and Supercritical Conditions. Energy Fuels 2020, 34, 4353–4365. 10.1021/acs.energyfuels.0c00169. [DOI] [Google Scholar]
- Pekot L. J.; Reeves S. R. In Modeling the Effects Of Matrix Shrinkage And Differential Swelling on Coalbed Methane Recovery and Carbon Sequestration, International Coalbed Methane Symposium; Tuscaloosa, Alabama, 2002; p 0328.
- Chen Z.; Liu J.; Elsworth D.; Connell L. D.; Pan Z. Impact of CO2 injection and differential deformation on CO2 injectivity under in-situstress conditions. Int. J. Coal Geol. 2010, 81, 97–108. 10.1016/j.coal.2009.11.009. [DOI] [Google Scholar]
- Wu Y.; Liu J.; Elsworth D.; Siriwardane H.; Miao X. Evolution of coal permeability: Contribution of heterogeneous swelling processes. Int. J. Coal Geol. 2011, 88, 152–162. 10.1016/j.coal.2011.09.002. [DOI] [Google Scholar]
- Kumar H.; Elsworth D.; Mathews J. P.; Liu J.; Pone D. Effect of CO2 injection on heterogeneously permeable coalbed reservoirs. Fuel 2014, 135, 509–521. 10.1016/j.fuel.2014.07.002. [DOI] [Google Scholar]
- Li Y.; Wang Y.; Wang J.; Pan Z. Variation in permeability during CO2–CH4 displacement in coal seams: Part 1 – Experimental insights. Fuel 2020, 263, 116666 10.1016/j.fuel.2019.116666. [DOI] [PMC free article] [PubMed] [Google Scholar]
- Zhu G.; Liu X.; Li S.; Huang Y.; Hao M. Institute of porous flow and fluid mechanics, chinese academy of sciences. Natur. Gas Ind. 2007, 27, 44–47. [Google Scholar]
- Thompson J. O. Hooke’s law. Science. 1926, 64, 298–299. 10.1126/science.64.1656.298. [DOI] [PubMed] [Google Scholar]
- Yuedong Y.; Xiangfang L.; Jiali G.; Zhengfu N. Experimental research for klinkenberg effect of gas percolation in low permeable gas reservoirs. Natur. Gas Ind. 2004, 24, 100–102. [Google Scholar]
- Barenblatt G. I.; Zheltov I. P.; Kochina I. N. Basic concepts in the theory of homogeneous liquids in fissured rocks. J. Appl. Math. Mech. 1960, 24, 1286–1303. 10.1016/0021-8928(60)90107-6. [DOI] [Google Scholar]
- Close J. C.Nature Fracture in Coal. In AAPG Studies in Geology, 1993; 38, pp 119–132. [Google Scholar]
- Laubach S. E.; Marrett R. A.; Olson J. E.; Scott A. R. Characteristics and origins of coal cleat: A review. Int. J. Coal Geol. 1998, 35, 175–207. 10.1016/S0166-5162(97)00012-8. [DOI] [Google Scholar]
- Chen D.; Pan Z.; Liu J.; Connell L. D. An improved relative permeability model for coal reservoirs. Int. J. Coal Geol. 2013, 109–110, 45–57. 10.1016/j.coal.2013.02.002. [DOI] [Google Scholar]
- Liu J.; Chen Z.; Elsworth D.; Miao X.; Mao X. Linking gas-sorption induced changes in coal permeability to directional strains through a modulus reduction ratio. Int. J. Coal Geol. 2010, 83, 21–30. 10.1016/j.coal.2010.04.006. [DOI] [Google Scholar]
- Robertson E. P.; Christiansen R. L. A Permeability model for coal and other fractured, sorptive-elastic media. SPE J. 2008, 13, 314–324. 10.2118/104380-PA. [DOI] [Google Scholar]
- Reiss L. H.The Reservoir Engineering Aspects of Fractured Formations; Editions Technip, 1980. [Google Scholar]
- Palmer I.; Mansoori J. How permeability depends on stress and pore pressure in coalbeds: a new model. SPE Reservoir Eval. Eng. 1998, 1, 539–544. 10.2118/52607-PA. [DOI] [Google Scholar]
- Seidle J. P. In Application of Matchstick Germetry to Stress Dependent Permeability in Coals, The SPE Rocky Mountain Regional Meeting, Casper, Wyoming, 1992.
- Shi J. Q.; Durucan S. Drawdown induced changes in permeability of coalbeds: a new interpretation of the reservoir response to primary recovery. Transp. Porous Media 2004, 56, 1–16. 10.1023/B:TIPM.0000018398.19928.5a. [DOI] [Google Scholar]
- Walder J.; Nur A. Porosity reduction and pore pressure development. J. Geophys. Res.: Solid Earth 1984, 89, 11539–11548. 10.1029/JB089iB13p11539. [DOI] [Google Scholar]
- Liu J.; Chen Z.; Elsworth D.; Qu H.; Chen D. Interactions of multiple processes during CBM extraction: A critical review. Int. J. Coal Geol. 2011, 87, 175–189. 10.1016/j.coal.2011.06.004. [DOI] [Google Scholar]
- Vandamme M.; Brochard L.; Lecampion B.; Coussy O. Adsorption and strain: The CO2-induced swelling of coal. J. Mech. Phys. Solids 2010, 58, 1489–1505. 10.1016/j.jmps.2010.07.014. [DOI] [Google Scholar]
- Day S.; Fry R.; Sakurovs R. Swelling of Moist Coal in Carbon Dioxide and Methane. Int. J. Coal Geol. 2011, 86, 197–203. 10.1016/j.coal.2011.01.008. [DOI] [Google Scholar]
- Ohgaki K.; Takano K.; Sangawa H.; Matsubara T.; Nakano S. Methane exploitation by carbon dioxide from gas hydrates – phase equilibria for CO2–CH4 mixed hydrate system. J. Chem. Eng. Jpn. 1996, 29, 478–83. 10.1252/jcej.29.478. [DOI] [Google Scholar]
- Ottiger S.; Pini R.; Storti G.; Mazzotti M. Competitive adsorption equilibria of CO2 and CH4 on a dry coal. Adsorption 2008, 14, 539–556. 10.1007/s10450-008-9114-0. [DOI] [PubMed] [Google Scholar]
- Liu S.; Harpalani S. A new theoretical approach to model sorption-induced coal shrinkage or swelling. AAPG Bull. 2013, 97, 1300–1049. 10.1306/12181212061. [DOI] [Google Scholar]
- Zhang J.; Liu K.; Clennell M. B.; Dewhurst D. N.; Pervukhina M. Molecular simulation of CO2–CH4 competitive adsorption and induced coal swelling. Fuel 2015, 160, 309–317. 10.1016/j.fuel.2015.07.092. [DOI] [Google Scholar]
- Yao C. Extended and improved Langmuir equation for correlating adsorption equilibrium data. Sep. Purif. Technol. 2000, 19, 237–242. 10.1016/S1383-5866(00)00060-5. [DOI] [Google Scholar]
- Lafortune S.; Adelise F.; Bentivegna G.; Didier C.; Farret R.; Gombert P.; Lagny C.; Pokryszka Z.; Toimil N. C. An experimental approach to adsorption of CO2 + CH4 gas mixtures onto coal (European RFCS CARBOLAB Research Project). Energy Procedia 2014, 63, 5870–5878. 10.1016/j.egypro.2014.11.620. [DOI] [Google Scholar]
- Palmer I. Permeability changes in coal: Analytical modeling. Int. J. Coal Geol. 2009, 77, 119–126. 10.1016/j.coal.2008.09.006. [DOI] [Google Scholar]
- Connell L. D.; Lu M.; Pan Z. An analytical coal permeability model for tri-axial strain and stress conditions. Int. J. Coal Geol. 2010, 84, 103–114. 10.1016/j.coal.2010.08.011. [DOI] [Google Scholar]
- Wei Z.; Zhang D. Coupled fluid-flow and geomechanics for triple-porosity/dual-permeability modeling of coalbed methane recovery. Int. J. Rock Mech. Min. Sci. 2010, 47, 1242–1253. 10.1016/j.ijrmms.2010.08.020. [DOI] [Google Scholar]
- Liu S.; Harpalani S.; Pillalamarry M. Laboratory measurement and modeling of coal permeability with continued methane production: Part 2 – Modeling results. Fuel 2012, 94, 117–124. 10.1016/j.fuel.2011.10.053. [DOI] [Google Scholar]
- Civan F. Scale effect on porosity and permeability: kinetics, model, and correlation. AICHE J. 2001, 47, 271–287. 10.1002/aic.690470206. [DOI] [Google Scholar]
- Cui X.; Bustin R. M. Volumetric strain associated with methane desorption and its impact on coalbed gas production from deep coal seams. AAPG Bull. 2005, 89, 1181–1202. 10.1306/05110504114. [DOI] [Google Scholar]
- Palmer I.; Mansoori J. In How Permeability Depends on Stress And Pore Pressure In Coalbeds, A New Model, SPE Annual Technical Conference and Exhibition; Denver, Colorado, 1996.
- Palmer I.; Mansoori J. How Permeability depends on stress and pore pressure in coalbeds, a new model. SPE Reservoir Eval. Eng. 1998, 1, 539–544. 10.2118/52607-PA. [DOI] [Google Scholar]
- Biot M. A. General theory of three-dimensional consolidation. J. Appl. Phys. 1941, 12, 155–164. 10.1063/1.1712886. [DOI] [Google Scholar]
- Terzaghi K.Theoretical Soil Mechanics; John Wiley & Sons: New York,1943. [Google Scholar]