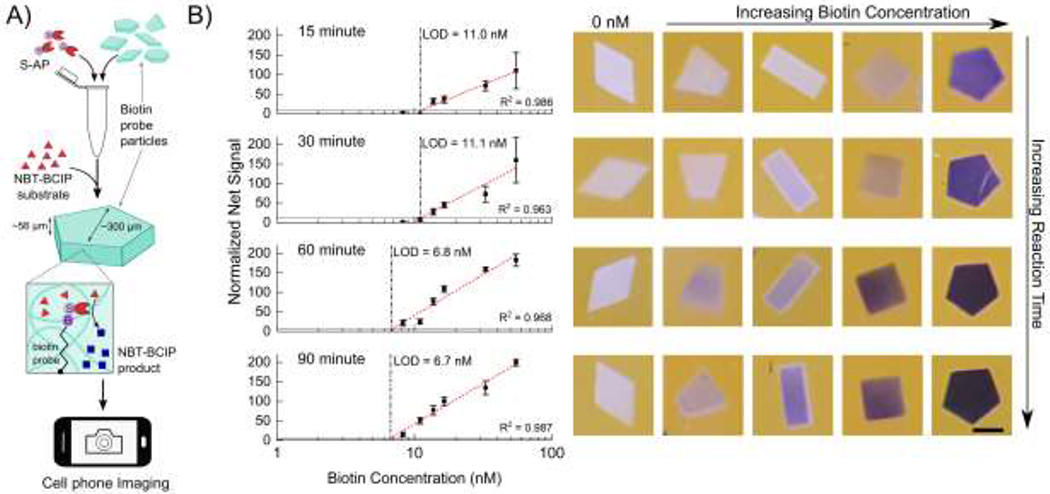
Figure 2.

A) Workflow of the reaction characterization experiments. Particles with different biotin concentrations are conjugated to S-AP in solution, to which NBT-BCIP substrate is added. The enzymatic reaction within the hydrogels produces the blue precipitate product. Particles are then imaged with a cell phone. B) Normalized net signal as a function of biotin probe concentration at after a reaction time of 15 minutes, 30 minutes, 60 minutes and 90 minutes. Vertical dashed lines show the limit of detection. Horizontal lines show the 3σ level. Error bars represent 1 standard deviation. R2 values represent Pearson correlation coefficients. Representative particle images are to the right of each graph. Scale bar is 200 µm.
