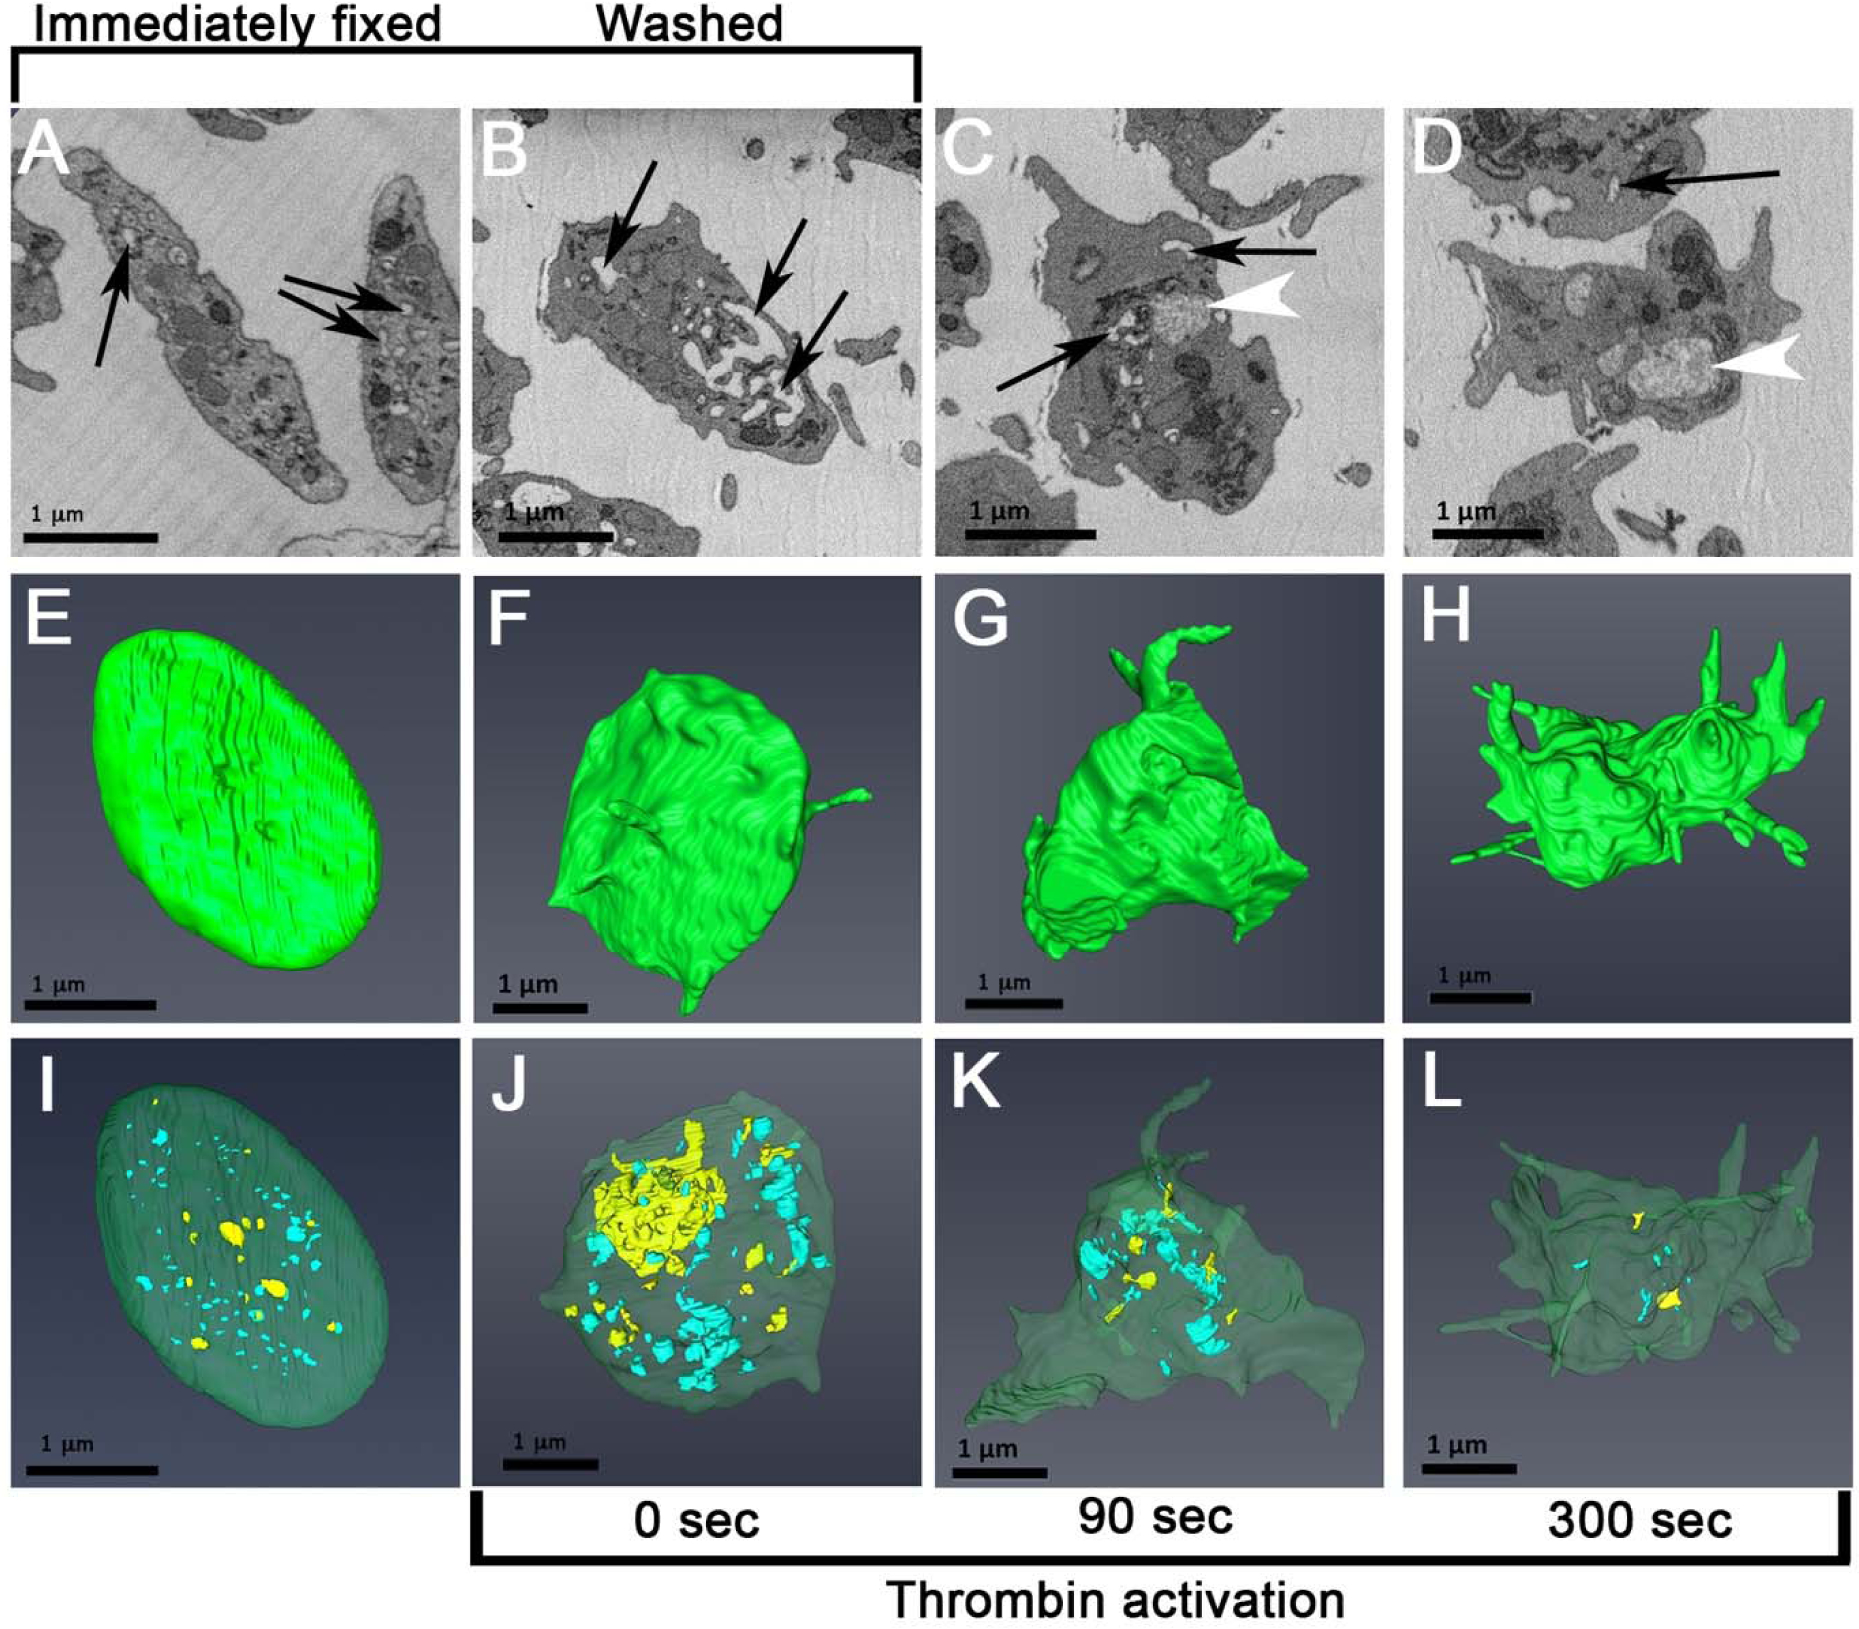
Figure 1. CS morphology in immediately fixed (resting) platelets versus washed platelets and agonist-stimulated (0.1 U/mL thrombin) mouse platelets.

A-D, platelet morphology in individual serial block face images (SBF-SEM) at various stages in platelet preparation or activation. Arrows point to various examples of putative CS elements. White arrowheads point to decondensed α-granules in activated platelets. E-H, Highlighted surface renderings of platelet at various stages in platelet preparation or activation. I-L, Morphology of rendered CCS (blue) and OCS (yellow) at various stages in platelet preparation or activation. Green, plasma membrane; scale bar = 1 μm.
