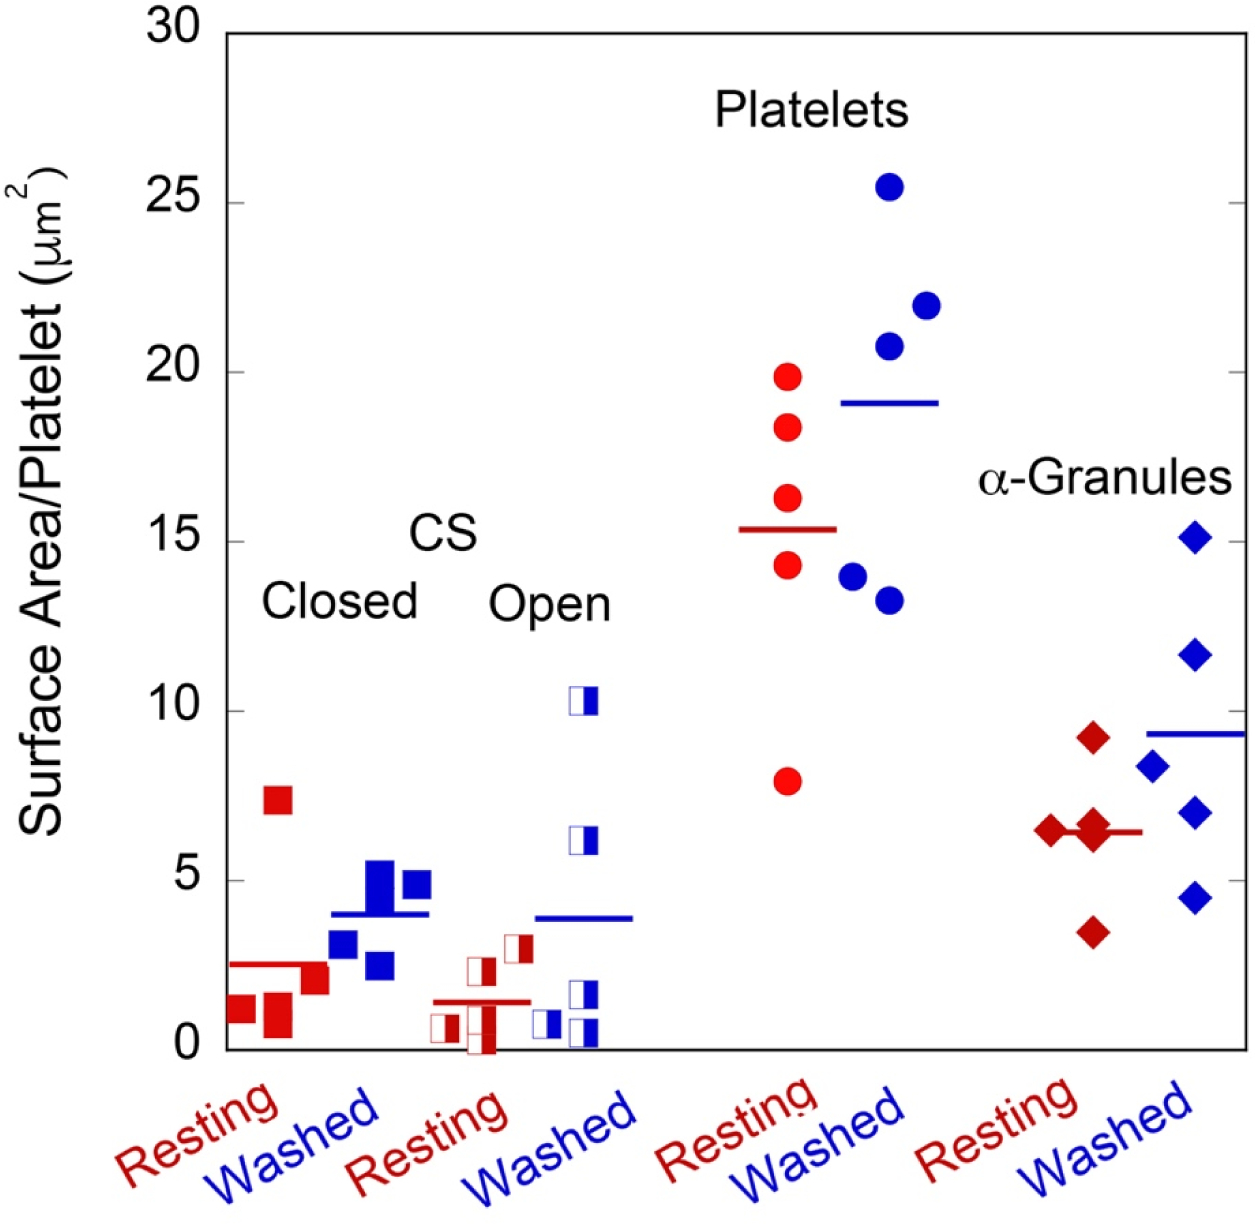
Figure 3. Dot plot of surface area per platelet of closed and open CS, platelet plasma membrane, and α-granules in resting (red symbols) and washed (blue symbols) mouse platelets.

Resting platelets were fixed immediately upon blood draw while Washed platelets were fixed after platelet isolation and repeated rounds of centrifugation. Paired P values: Resting versus Washed preparations, OCS = 0.23, CS = 0.21; Resting versus Washed Platelets = 0.12, Resting versus Washed preparations, α-granules = 0.20. The quantitative and qualitative trend is the same in all cases, i.e., expansion, Washed versus Resting platelet preparations. For each condition, the pooled blood from 6 mice, gender mixed, was used. N = 5 platelets quantified for each comparison.
