

Abstract
Persistent neuronal spiking has long been considered the mechanism underlying working memory, but recent proposals argue for alternative, “activity-silent” substrates. Using monkey and human electrophysiology, we show here that attractor dynamics that control neural spiking during mnemonic periods interact with activity-silent mechanisms in PFC. This interaction allows memory reactivations, which enhance serial biases in spatial working memory. Stimulus information was not decodable between trials, but remained present in activity-silent traces inferred from spiking synchrony in PFC. Just prior to the new stimulus, this latent trace was reignited into activity that recapitulated the previous stimulus representation. Importantly, the reactivation strength correlated with the strength of serial biases in both monkeys and humans, as predicted by a computational model integrating activity-based and activity-silent mechanisms. Finally, single-pulse TMS applied to the human prefrontal cortex between successive trials enhanced serial biases, demonstrating the causal role of prefrontal reactivations in determining working memory behavior.
Introduction
The mechanisms by which information is maintained in working memory are still not fully understood. Ample evidence supports a role of sustained neural activity in prefrontal1–3 and other cortices4,5, possibly supported by attractor dynamics in recurrently connected circuits6,7. However, recent studies have argued that memories may be maintained without persistent firing rate tuning during memory periods8. This “activity-silent” memory can be mediated by slowly decaying intrinsic or synaptic mechanisms, such as short-term synaptic plasticity9,10, or activity-dependent intrinsic mechanisms with a long time constant11–13 that could allow reactivation of memories from a latent storage. This computational proposal has received support in neuroimaging studies: in some working memory tasks, despite good memory performance, stimulus information cannot be retrieved from neural delay activity, but later robustly reappears14 during comparison or response periods (but see ref.15).
The apparent incompatibility between activity-based and activity-silent memory maintenance has led to viewing them as exclusive alternatives8. However, modeling implementations of activity-silent conditions invariably require the network to be configured close to the attractor regime9,16 that enables persistent activity. This attractor non-linearity is necessary to increase the signal-to-noise ratio of the fading subthreshold signal for successful memory reactivation9. At the same time, activity-silent memory mechanisms may stabilize persistent activity in attractor networks (e.g. refs.11,17–19). Interestingly, modeling studies have argued that the interaction of these mechanisms during the delay would be reflected behaviorally in serial biases11,17, but this theoretically appealing hypothesis still lacks experimental support.
Serial biases in spatial working memory denote small but systematic shifts of memory reports toward nearby locations memorized in the previous trial20–23, revealing a lingering representation of previous memories. Uncleared memory remnants have long been viewed as limiting working memory performance (proactive interference24), but recent proposals suggest that they may be useful to inform working memory about the expected statistics in naturalistic conditions25, similar to other history biases with longer time scales and possibly different neural mechanisms (contraction bias,26–28). The functional relevance of biases implicates specific roles of higher-order brain areas: On the one hand, these areas could suppress maladaptive biases to minimize performance degradation29,30, but in turn they might promote adaptive biases by maintaining a representation of stimulus history26. Whether association areas generate or suppress serial biases in primates is currently undefined, and a mechanistic understanding of the generation of any type of history biases is still lacking.
Both attractor dynamics21 and activity-silent11,17,31 mechanisms have been proposed to carry stimulus-selective information from one trial to the next to effect serial biases. However, dependencies of serial biases on inter-trial interval (ITI) durations21–23, are largely consistent with activity-silent, and not activity-based mechanisms11,17,31. Here, we sought to specify the interaction of activity-based and activity-silent prefrontal cortex (PFC) mechanisms in supporting serial biases while subjects performed a spatial working memory task that engages attractor dynamics in PFC6. Further, this approach may offer indirect evidence that activity-silent and activity-based mechanisms co-occur during the delay, as proposed by computational models (e.g.11,17–19). Telling apart these mechanisms in delay is problematic because of their co-activation. By extending the relevant task periods to the ITI, we propose a way to disentangle them, and to study the effect of their interaction on upcoming memories.
We compared the encoding properties of brain activity in delay and ITI to identify the mechanistic basis of the memory trace that spans consecutive trials. We used behavioral and electrophysiological data collected in monkeys and humans, with prefrontal multiple-unit recordings in monkeys, and scalp electroencephalography (EEG) in humans. Between successive persistent activity mnemonic codes, we found an activity-silent code in PFC that carried stimulus information through inter-trial periods. In addition, we found correlational and causal evidence that fixation-period PFC reactivation from this activity-silent trace enhances attractive serial biases. These findings underscore the behavioral relevance of the dynamic interplay between attractor and subthreshold network dynamics in PFC and reconcile these seemingly conflicting mechanisms: their interplay could be the basis of closely associated memory storage processes operating at different time scales, possibly serving different behavioral purposes14,32.
Results
We trained four rhesus monkeys to perform an oculomotor delayed response task (ODR). The task consisted of remembering spatial locations at fixed eccentricity while maintaining fixation during a delay period of 3 s (Fig. 1a, Methods). The extinction of the fixation cue triggered the monkey to execute a saccade towards the remembered location and marked the beginning of a fixed inter-trial interval (ITI) of 3.1 s, lasting until the appearance of the new trial’s stimulus cue (Fig. 1b). In addition, we tested 35 human participants in variations of the task performed by the monkeys (Methods). In all cases, we recorded the reported location and computed behavioral errors as angular distances to corresponding target locations. Following the methods described in previous studies20, we analyzed the dependence of the current-trial error on relative previous-trial location. Both monkeys and humans showed biased reports relative to previously remembered locations. These biases were attractive for short distances between previous-trial and current-trial locations, and repulsive for large previous-current distances (Fig. 1a, 2a). Our primary goal was to test the hypothesis that activity-silent and persistent activity working memory mechanisms interact to produce serial dependence effects. To this end, we investigated electrophysiological measurements in the ITI, including periods from the response to the subsequent fixation period.
Figure 1. Previous-trial stimulus code reactivates prior to the forthcoming stimulus.
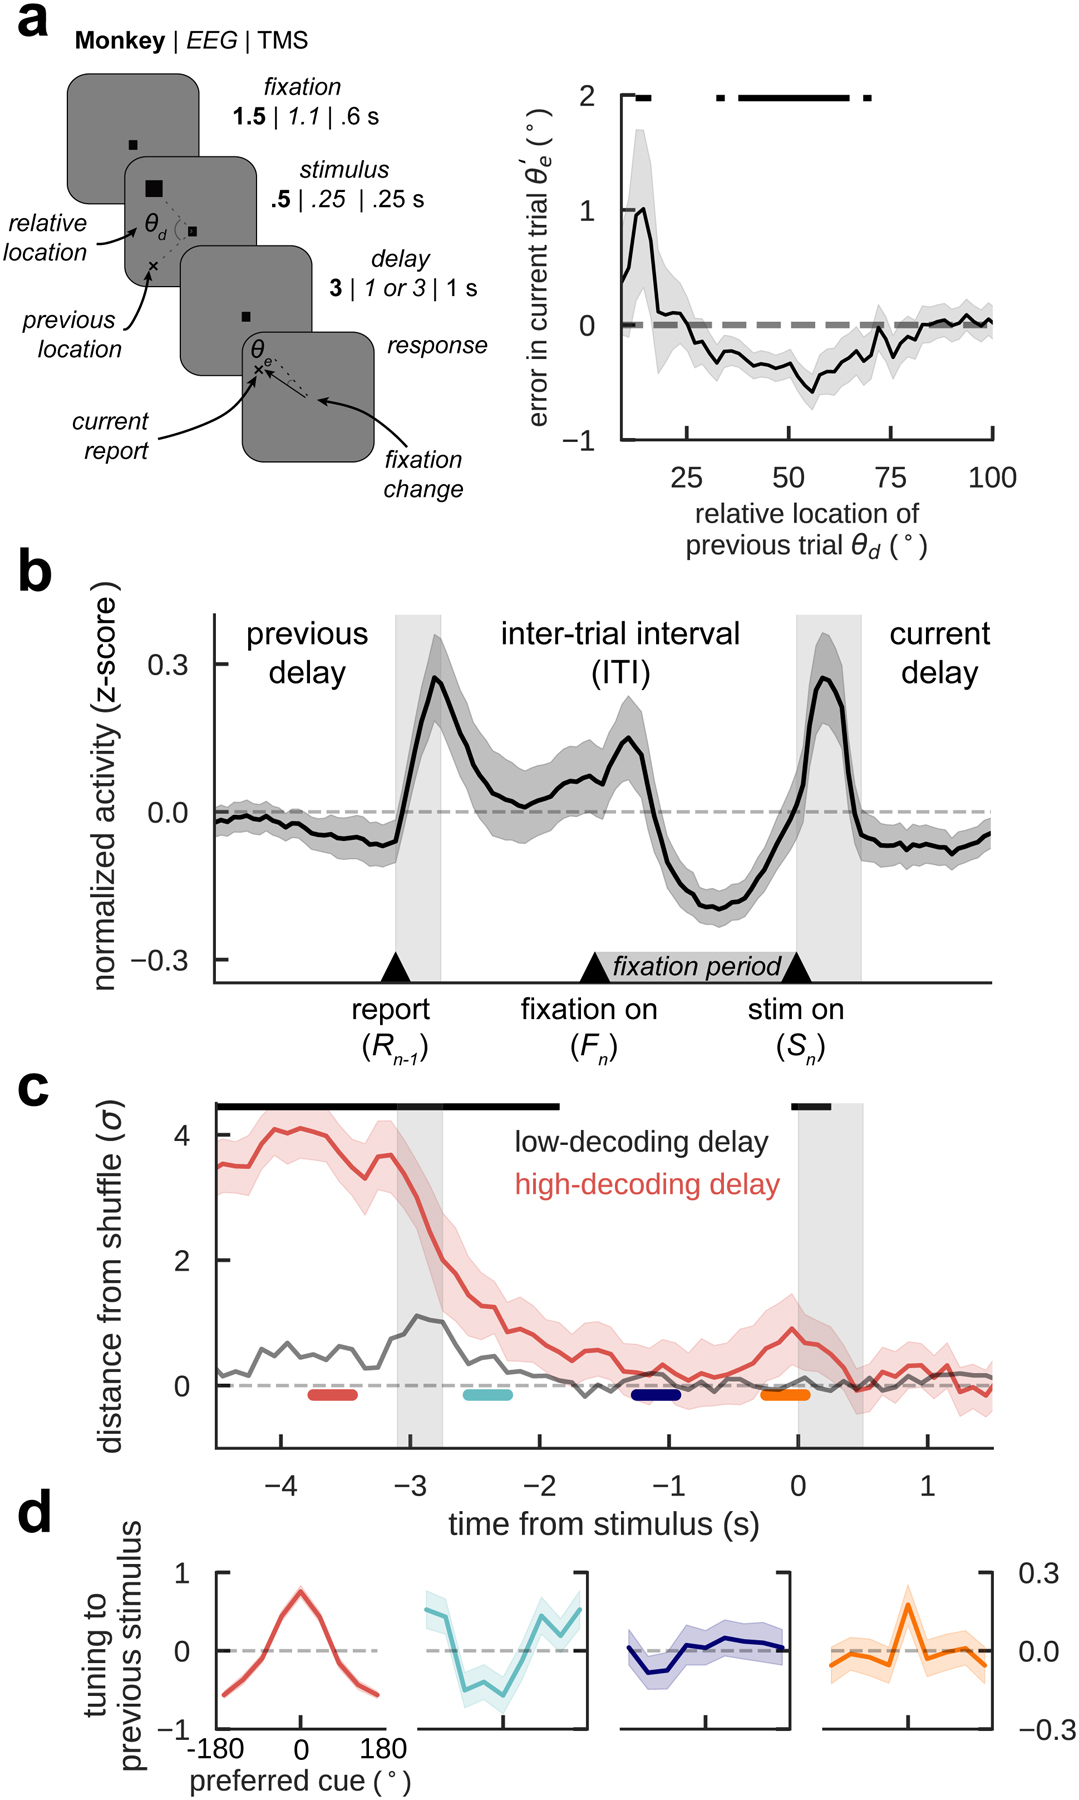
a) General task design (monkeys / EEG / TMS) and serial bias for 4 monkeys (n=11670 consecutive trial pairs). Trials with counter-clockwise previous reports relative to the current stimulus were collapsed into clockwise trials (folded errors, Methods). Positive (negative) values indicate response attraction (repulsion) toward previous locations presented at that relative distance from the current stimulus. Shading indicates bootstrapped ±s.e.m. Black solid bars represent p<0.05 (one-sided permutation test). b) Averaged, normalized firing rate of n=206 neurons during the ITI (spike counts of 300-ms causal square kernel, z-scored in interval [−4.5 s, 1.5 s]). Gray bars mark response and stimulus cue periods. c) Decoding accuracy of previous-trial stimulus from n=94 independent ensembles, computed as the distance from the mean of decoding accuracy in shuffled surrogates, in units of their standard deviation σ (Methods), averaged over ensembles with strong (red) and weak (gray) decoding in delay (Methods). Aligned with anticipatory ramping in late fixation (panel b), previous-trial stimulus code reappears, specifically in ensembles with better delay code (Extended Data Fig. 1). Black bars mark timepoints for which decoding accuracy 99.5% C.I. is above zero. d) Tuning to previous-trial stimulus, aligning responses to preferred cue as defined in delay, and computed in different trial epochs (color-coded in c, two-sided bootstrap-test at preferred location: p=0.015, C.I.=[−0.3,−0.03], Cohen’s d=−0.17 (cyan), p=0.865, C.I.=[−0.12, 0.14], Cohen’s d=0.012 (deep blue), p=0.025, C.I.=[0.024,0.33], Cohen’s d=0.15 (orange), n=206 neurons, shading depicts ±s.e.m.). Unless stated otherwise, in all panels error-shading marks bootstrapped 95% C.I.
Figure 2. In human EEG, the delay code also reactivates in fixation.
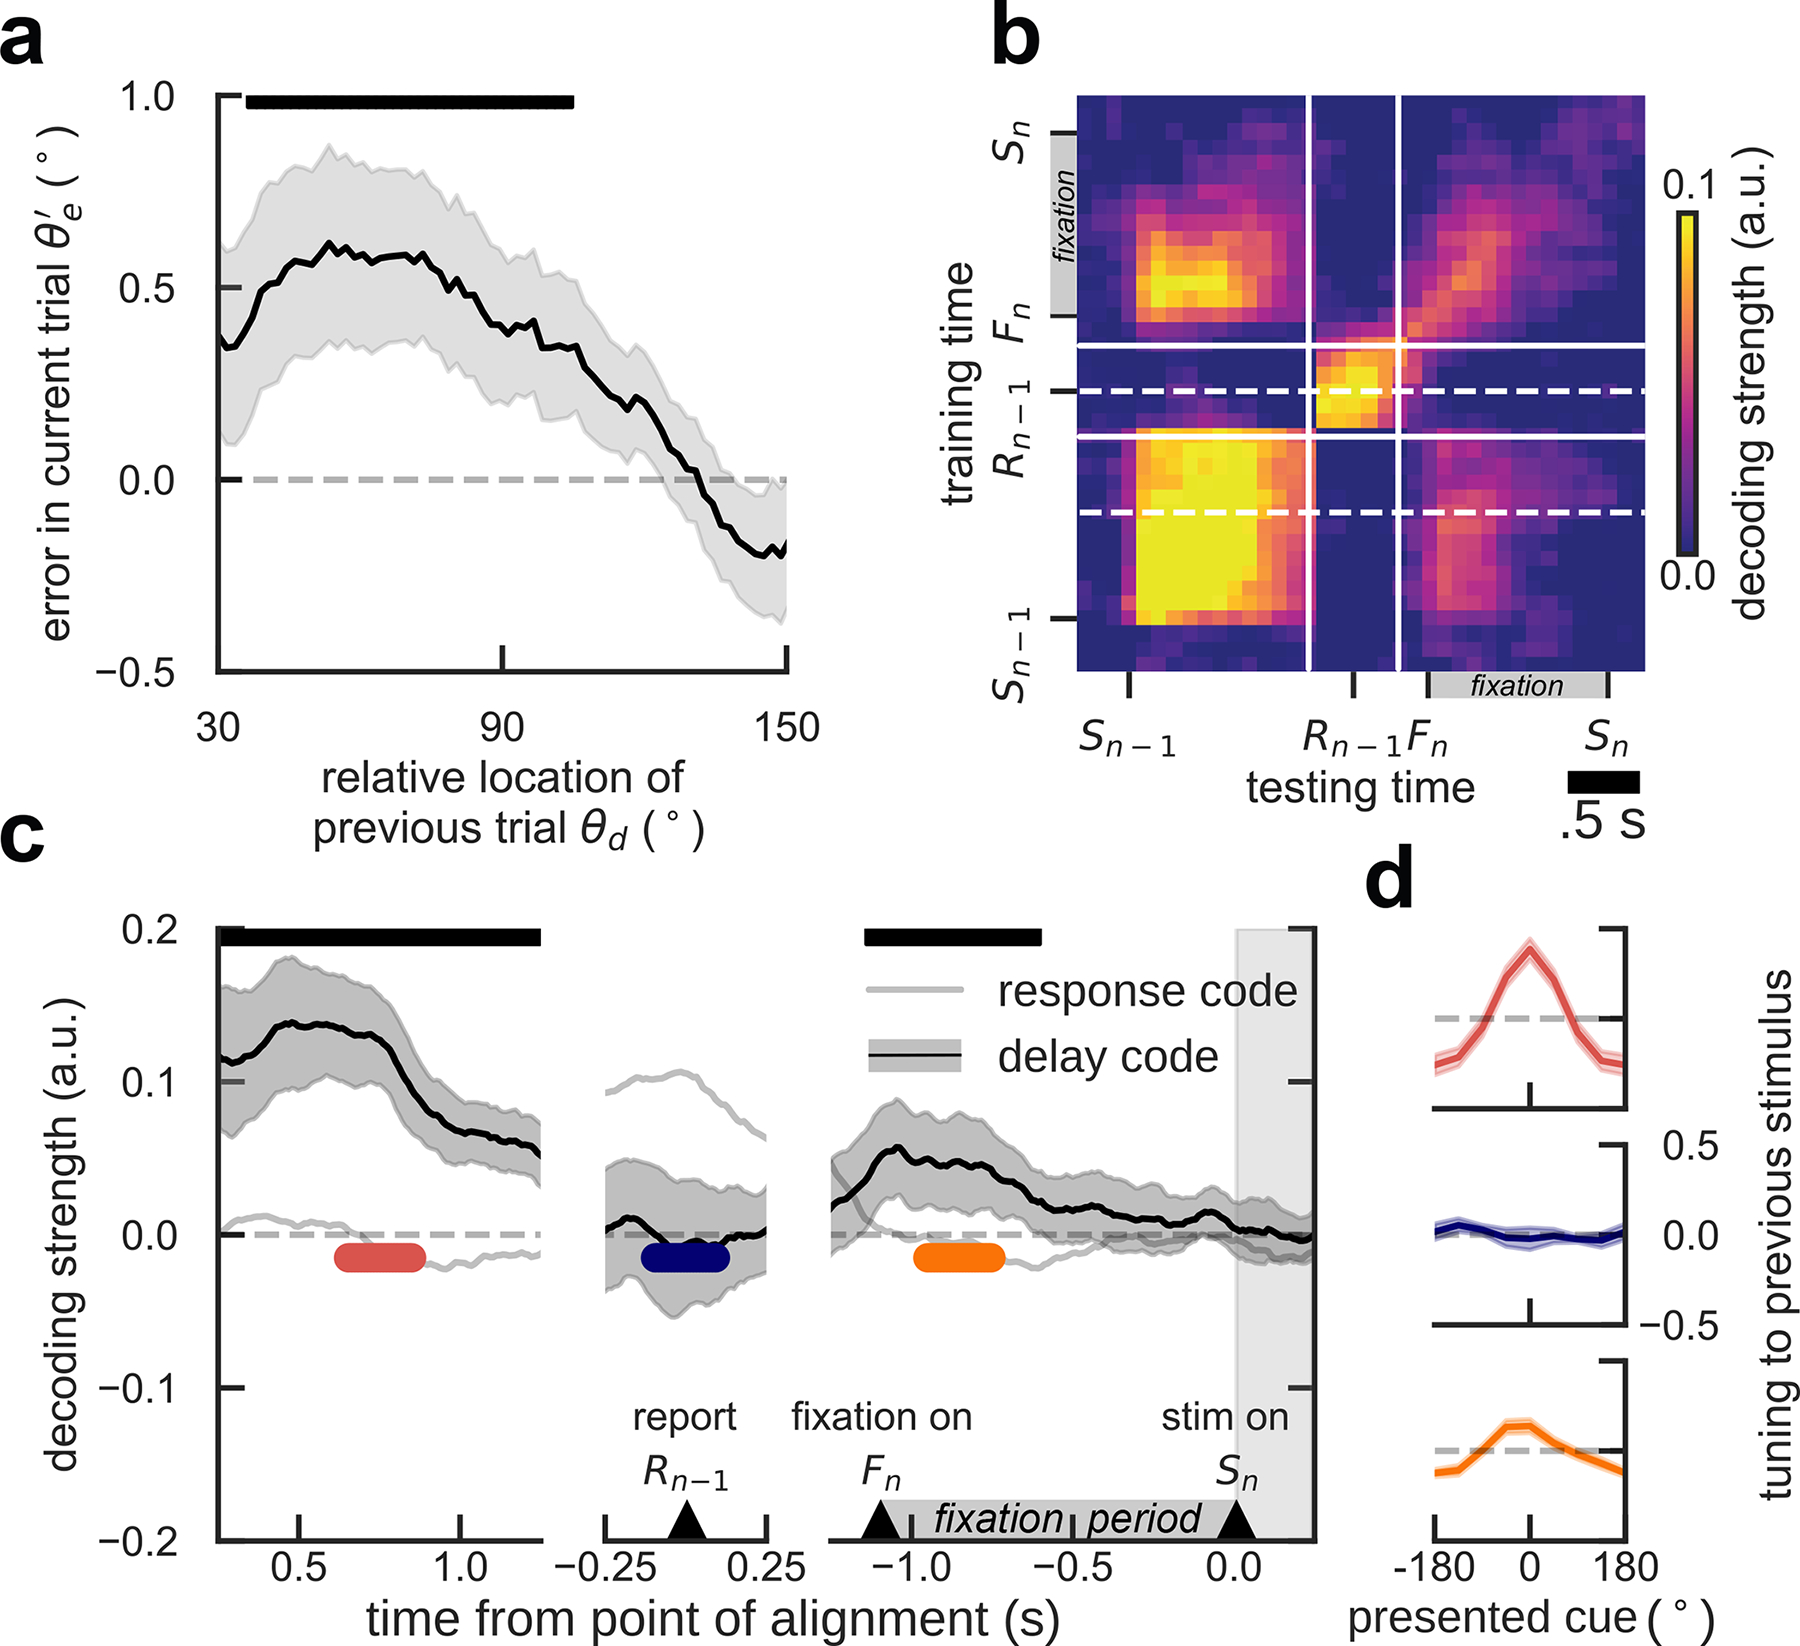
a) Serial bias for human subjects. Shading, ±s.e.m. b) Temporal generalization of previous-stimulus code for all combinations of training and testing times from previous-trial stimulus onset (Sn-1) and response (Rn-1), to current-trial fixation (Fn) and stimulus onset (Sn). Solid lines mark the discontinuity of EEG fragments aligned to Sn-1, Rn-1, and Sn. Dashed lines indicate the temporal center of transversal sections shown in c. c) Decoding of previous stimulus during previous-trial delay (left), response (middle), and current-trial fixation period (right), for decoders trained in previous-trial delay (mid-delay, 0.5s - 1.0s after Sn-1, lower dashed line in b, and during previous-trial response (in a 0.5s window centered on Rn-1, upper dashed line in b). The delay code is stable during delay, disappears during response, and reappears in current-trial fixation, see also panel d. In contrast, previous-trial response-related information is dynamic and not present in fixation. Error-shading, 95% C.I. d) Demeaned reconstruction of previous stimulus at different epochs for the delay decoder, marked in c (two-sided bootstrap-test preferred vs. anti-preferred location: p<1e-6, C.I.=[0.55, 0.73], Cohen’s d=3.619 (red), p=0.69, C.I.=[−0.22, 0.16], Cohen’s d=0.10 (blue), p=1e-6, C.I.=[0.17, 0.36], Cohen’s d=1.35 (orange), shading, ±s.e.m.). Upper bars, significant deviation from zero (bootstrap), p<0.05 in a, p<0.005 in c (both two-sided). All panels, n=15 independent subjects.
Reactivation of previous memory information in monkey dlPFC prior to new stimulus presentation
We collected single-unit responses from the dorsolateral PFC (dlPFC) of two monkeys while they performed the task. A substantial fraction of neurons in this area showed tuned persistent delay activity during the mnemonic delay period6 (n=206/822, Methods). These specific neurons are part of bump attractor dynamics characterizing the memory periods of this task6. Based on this evidence, we will assume an attractor dynamics mechanism for persistent activity, and use these terms interchangeably to refer to this network regime. Based on our hypothesis that an interplay of activity-silent and attractor mechanisms would support serial biases, we focused our analyses on these neurons, and we grouped them in simultaneously recorded ensembles for decoding analyses (n=94 ensembles, size range 1–6 neurons, Extended Data Fig 1a).
DlPFC neuron firing rates exhibited strong dynamics in the ITI, compared to the stability during mnemonic delay periods (Fig. 1b). Phasic rate increases at response execution (Rn-1, Fig. 1b) and fixation onset (Fn, Fig. 1b) were hallmarks in these dynamics, but we also noticed an increase of firing rate prior to stimulus presentation (Sn, Fig. 1b), which could reflect anticipation of the upcoming stimulus due to fixed length fixation periods. We wondered if these rate changes were also related to dynamical changes in stimulus selectivity. Under the attractor-based hypothesis for serial biases33, sustained stimulus selectivity would be expected to extend from the previous trial’s delay period into the next trial’s fixation period. We measured selectivity by training a linear decoder on spike counts of our neuronal ensembles, and referenced its accuracy to that obtained by chance using a resampling approach (Methods). During the delay period, neuronal ensembles carried stimulus information and single neurons showed stimulus tuning (Fig. 1c,d red). After report, the memorized location was still decodable from ensemble activity but single neurons’ tuning curves showed a selective suppression of responses in their mnemonic preferred locations (Fig. 1c, cyan). This could reflect neuronal adaptation mechanisms or else saccade preparation towards the opposite direction to regain fixation. In the middle of the ITI, decoding accuracy was not different from chance and neurons were no longer tuned to the previous stimulus (Fig. 1c,d deep blue), suggesting that the encoding of the previous stimulus had disappeared from neural activity. However, aligned with anticipatory ramping activity at the end of the fixation period (Fig. 1b), previous stimulus was again decoded just prior to the new stimulus presentation, and single-neuron tuning reappeared (Fig. 1c,d orange). Although the existence of spiking selectivity during the ITI has already been previously reported33, we show here that there is a period in which stimulus information cannot be decoded and then it reappears at the end of the fixation period (late fixation). Further, this code in late fixation is a reactivation of the representation active in the previous trial delay. This is supported by 2 pieces of evidence. On the one hand, information reappearance occurred more strongly in those neuronal ensembles that maintained more stimulus information during the delay period (Fig. 1c and Extended Data Fig. 1). Secondly, the converging pattern of noise correlations at the end of the delay6 and in late fixation suggested a similar attractor-like network activation in both periods. Indeed, when the preceding stimulus appeared between two neurons’ preferred locations, these PFC neuron pairs exhibited negative noise correlations in late fixation (Extended Data Fig. 2) – a signature of a fixed-shape bump that diffuses from the initial stimulus location, moving closer to one neuron’s preferred location and away from the other, thus increasing one and decreasing the other neuron’s firing rate6. Negative correlations appeared exclusively during late fixation, strongly suggesting a bump reactivation (Extended Data Fig. 2). Taken together, these results support a faithful reactivation of the memory-period representation in the fixation period (reactivation period), following a period of absent selective neuronal firing in dlPFC. This reactivation suggests a relationship between mechanisms of delay memory encoding, and mechanisms bridging the ITI to facilitate reactivation prior to the new stimulus.
Previous trial memory information is reactivated in the fixation period of human EEG
In line with monkey electrophysiology, we found similar previous-trial traces in human EEG (n=15). We extracted alpha power from all electrodes and used a linear decoder to reconstruct the target location from EEG in each trial34 (Methods). The target representation was significantly sustained during delay, response, and the next trial’s fixation period (Fig. 2b, diagonal axis). Importantly, this dynamic EEG decoder at each time point uses signals originating from different cortical regions and could therefore combine temporally overlapping, but spatially distinct representational components (e.g. mnemonic vs. response-related components). We thus trained different linear decoders during delay (500–1000 ms after stimulus onset, delay code) and around the response (250 ms before to 250 ms after response, response code), and used the respective weights to extract previous-stimulus information throughout different periods of the trial (Fig. 2c). The delay code was stable during stimulus presentation and delay, but disappeared during the ITI, around the time of response. In contrast, the response code did not generalize beyond the time at which the decoder was trained (Fig. 2c). We found that the previous trial’s delay code re-appeared during the fixation period (Fig. 2c, and Fig. 2d, orange), similar to monkey neurophysiology (Fig. 1c), but slightly earlier in the ITI, possibly triggered by the onset of the fixation dot (while reactivation in monkey PFC in the fixed-duration ITI could be triggered by a ramping anticipatory signal, Fig. 1b). These results provide a confirmatory correspondence with the time-course of mnemonic decoding in the monkey data, but they also show the temporal continuity between qualitatively distinct memory and response codes. The bidirectional transfer of information between memory and response representations in different brain areas could provide a bridge between the memory and ‘reactivation’ periods observed in PFC. Alternatively, response codes may just reflect the output motor commands and mnemonic codes may subsist subthreshold in PFC to allow reactivations. We tested this hypothesis with cross-correlation analysis of PFC units.
Increased cross-correlation suggests a latent trace during ITI
We sought experimental validation that activity-silent mechanisms in dlPFC still maintained stimulus information during the ITI between consecutive trials. We reasoned that if such latent activation (e.g. a synaptic trace9) affected a group of interconnected neurons, these would be more likely to exceed their spiking threshold in synchrony8,35. Specifically following a preferred cue, neurons would increase their activity in the delay and maintain a latent activity-silent trace in the subsequent ITI that would be reflected in enhanced synchrony35, but not enhanced rates. Moreover, we deduced that this reasoning was pertinent only to excitatory interactions: neurons interacting through effective inhibition should instead show reduced probability of co-activation following possible inhibitory efficacy enhancement by preferred stimuli in the previous trial35.
To test this hypothesis, we selected pairs of neurons with similar selectivity (n=67 pairs, Methods) so they had consistent activation (high/low firing rate) in the delay. Following previous studies36,37, we divided the selected pairs based on their whole-trial cross-correlation peak sign in excitatory (exc) and inhibitory (inh) interactions (Methods). We considered two conditions (Fig. 3a, Methods): trials in which the previous stimulus was shown close to either preferred location (pref, Methods) or far from preferred locations (anti-pref). Then, we computed a cross-correlation selectivity index (CCSI) by subtracting the amplitude of the central peak of the jitter-corrected cross-correlation function (coincident spikes within 20 ms, Methods, similar to ref.38) for pref and anti-pref trials for each neuron pair (Fig. 3b). Our hypothesis predicts positive (negative) CCSI for exc (inh) pairs in the ITI, i.e. higher (lower) spike synchrony following preferred stimuli.
Figure 3. Cross-correlation selectivity to previous-trial stimulus suggests an activity-silent trace in PFC.
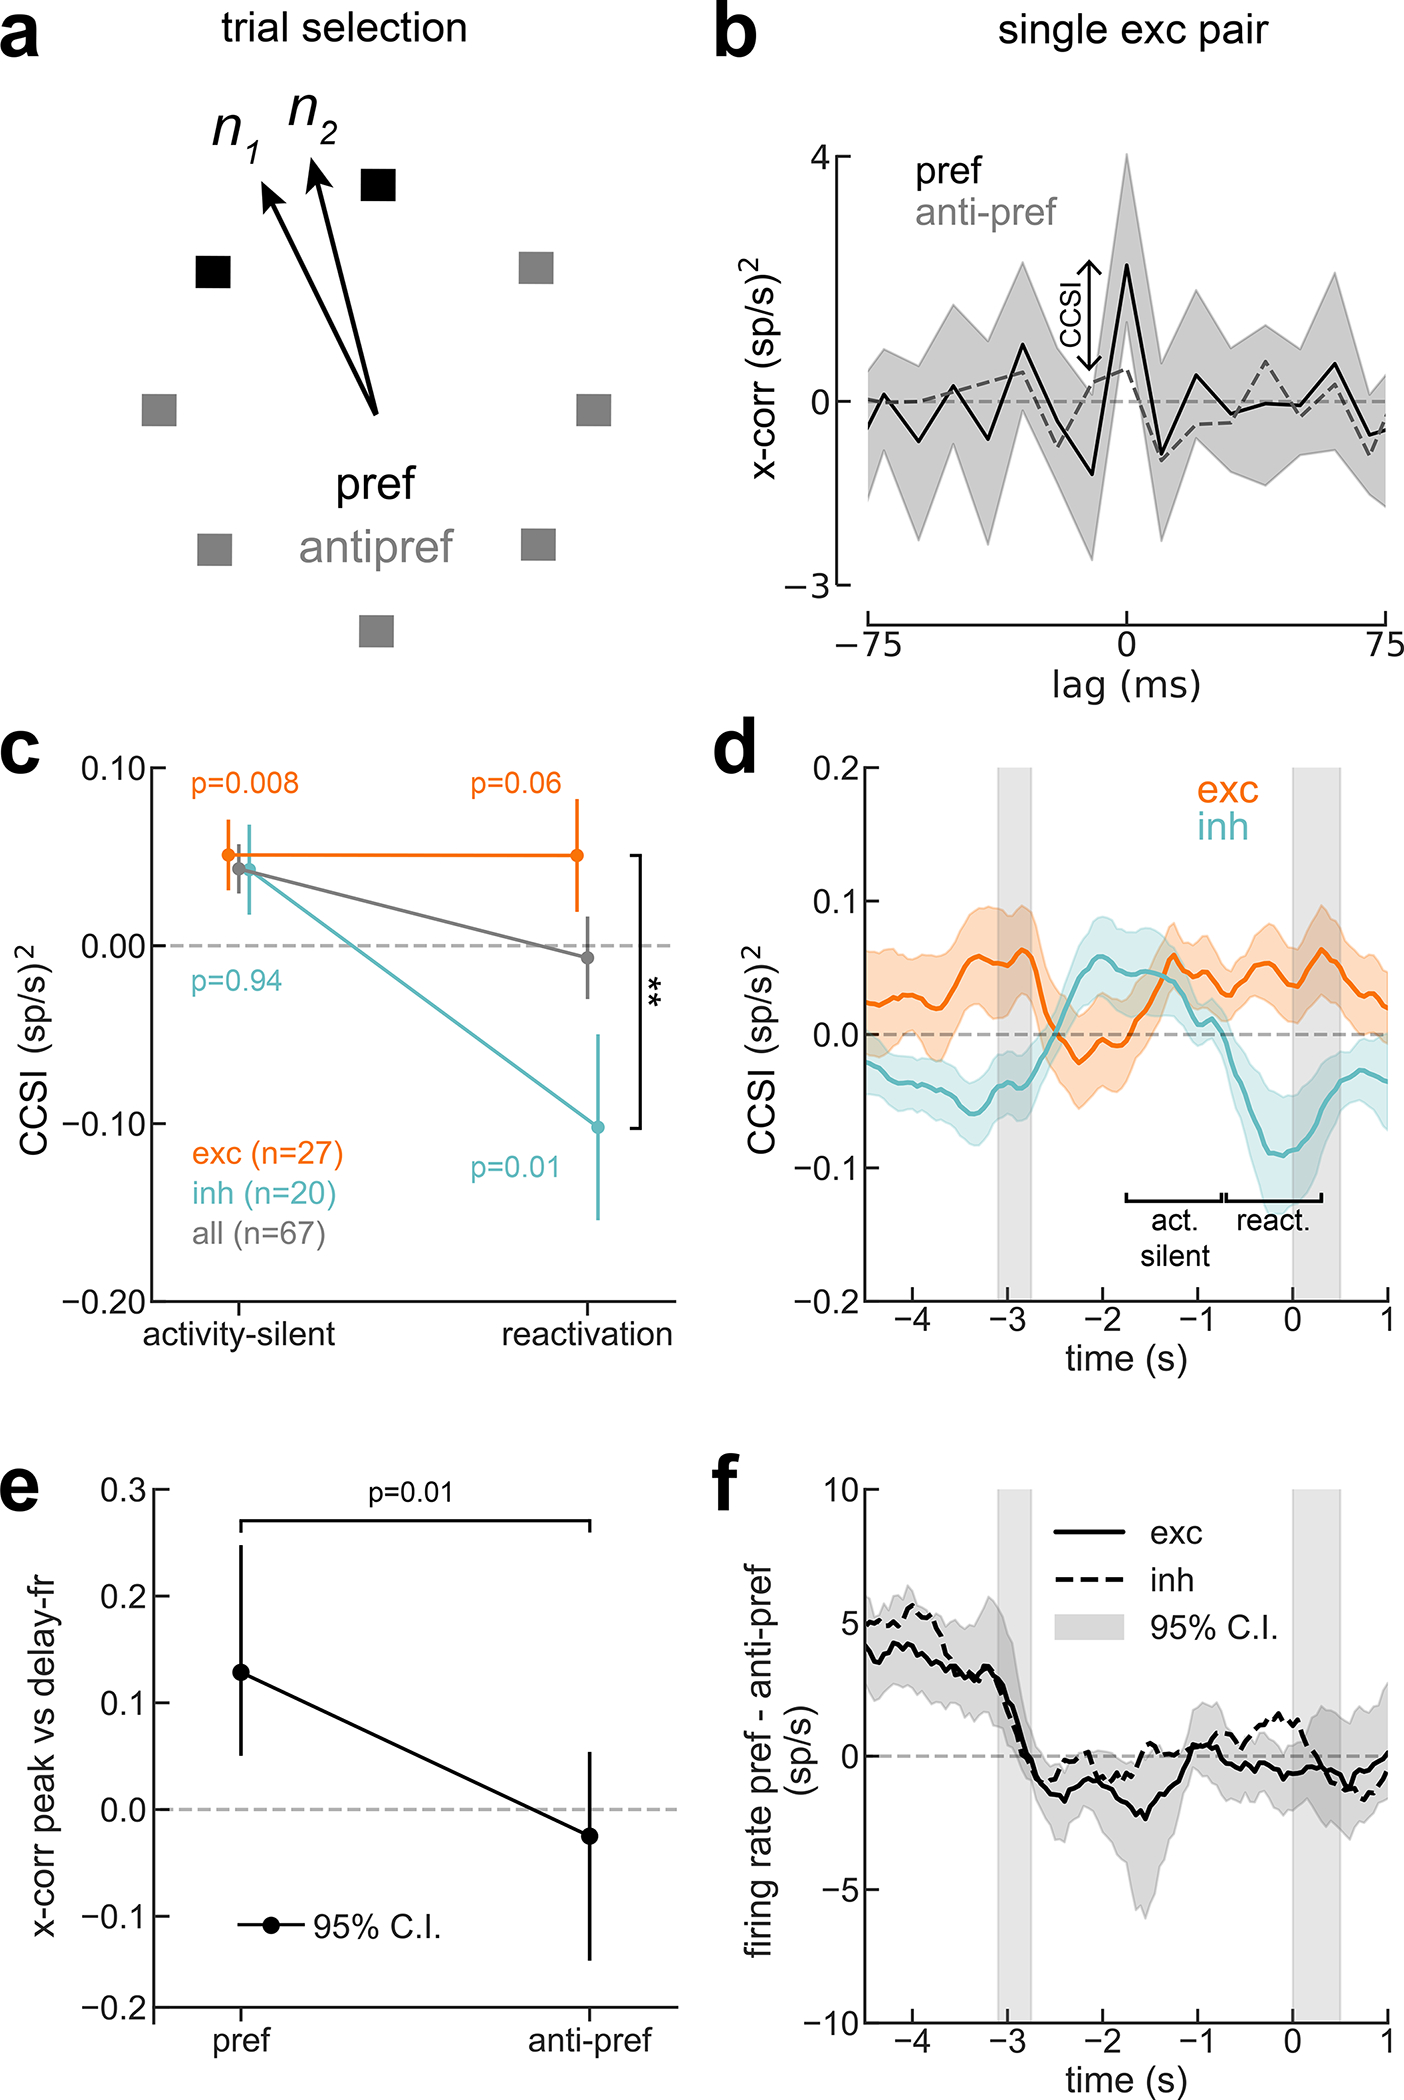
a) Trial selection scheme: For neuron pairs with similar preferred location (< 60°), we separated trials with stimulus near the pair’s preferred locations (pref) from trials with far locations (anti-pref). b) Cross-correlation of sample PFC pair shows zero-lag peak selectivity to previous-trial stimulus in activity-silent period (one-sided permutation test, p=0.025, Cohen’s d=0.10, n=44 independent trials). c) CCSI was consistently positive in activity-silent period, but became negative for inh interaction pairs during reactivation (two-sided permutation test, interaction period ✕ exc/inh, p=0.03, Cohen’s d=−0.6). At reactivation, CCSI for exc (n=27 pairs) and inh (n=20 pairs) differed significantly (**, two-sided permutation test, p=0.006, d=0.75). P-values in figure panel report results of one-tailed permutation tests according to our hypotheses (CCSI>0 for exc, CCSI<0 for inh). d) CCSI in the ITI (1-s windows, 50-ms steps) for exc (n=27 pairs) and inh pairs (n=20 pairs). Except immediately after the report, where neurons show anti-tuning (Fig. 1d), CCSI was positive for exc interactions. CCSI was negative for inh interactions during previous delay and reactivation. Smoothed with a 5-sample square filter. e) Trial-by-trial correlation between exc pairs’ previous-delay spike counts and ITI cross-correlation central peak (activity-silent period in d, Methods) is positive only for the pref condition (one-sided permutation test p=0.017, interaction p=0.01, n=320 and 769 trials, for pref and anti-pref, respectively). f) Absence of mean firing rate difference between pref and anti-pref conditions (same pairs as in d) discards confound between rate selectivity and CCSI. Error bars in b and e, bootstrapped 95% C.I; in c and d, s.e.m.
The CCSI computed in a period of the ITI where firing rate had ceased to represent the stimulus (activity-silent period, Fig. 1c,d, deep blue) was positive, reflecting selectivity in neuronal synchrony to the previous stimulus for all interactions (Fig. 3c). We then investigated changes in CCSI for exc/inh interactions across our two periods of interest: the activity-silent and reactivation periods (Fig 1c, deep blue and orange, respectively). We found that their reactivation-period CCSI differed significantly, being negative for inh interactions and positive for exc interactions (Fig. 3c). Finally, we explored the CCSI dynamics throughout the trial (Fig. 3d): with the exception of immediately after the previous response, where neurons showed anti-tuning to previous-trial stimulus (Fig. 1c), CCSI for exc pairs was always positive, indicating stronger central-peak cross-correlation when the previous stimulus was preferred (Fig. 3d, orange). On the other hand, for inh interactions CCSI was negative (stronger inhibitory interactions following a preferred stimulus) only during reactivation and the previous-trial delay period (Fig. 3d, cyan), the periods where PFC firing rates showed stimulus selectivity. This pattern is consistent with the latent memory mechanism residing in excitatory neurons and only being reflected in inhibitory interactions through the collective engagement in bump attractor dynamics, during the delay and at the time of reactivation. Importantly, this analysis was done during a period without firing rate selectivity (Fig. 3f), thus free of a potential confound from firing rates (see Extended Data Fig. 3 for the same analysis performed during the delay period, where that caveat cannot be ignored.)
This proves the existence of a latent trace of the stimulus in PFC during the ITI, but it could still be reflecting selective subthreshold inputs from a different area that maintains tuned persistent activity, instead of selective local modulations in PFC. To rule out this possibility and strengthen the idea that stimulus information is directly transferred from an activity-based to an activity-silent code in PFC, we tested if the selectivity of exc interactions during the activity-silent period depended on spiking activity of corresponding neurons in the previous delay period. Assuming a neuron-specific activity-dependent mechanism supporting the activity-silent code in the ITI, we predicted that the magnitude of the cross-correlation central peak in the activity-silent period would correlate on a trial-by-trial basis with the mean spike count recorded in the preceding delay period and specifically for pref (and not for anti-pref) trials (Methods). This prediction was confirmed in the experimental data (Fig. 3e). Thus, this cross-correlation analysis supports the hypothesis that previous, currently irrelevant stimulus information remains in prefrontal circuits in latent states, undetected by linear decoders that do not take spike timing into consideration (Figs. 1c, 3f).
Bump-reactivation as a mechanism for stimulus information reappearance
Based on our electrophysiology results and on prior modeling studies9, we formulated the bump-reactivation hypothesis to explain our data. We hypothesized that information held in memory as an activity bump during the previous trial’s delay period6 would be imprinted in neuronal synapses as a latent, activity-silent trace during the ITI. This latent bump could be reactivated by the unspecific anticipatory signal seen in mean firing activity in PFC (Fig. 1b), or anticipatory mechanisms following an external cue that predicts stimulus presentation, such as the onset of a fixation dot (Fig. 2c). In fact, in a separate EEG experiment where fixation lengths were jittered so as to make stimulus onsets unpredictable, we could not find any delay code reactivation (Extended Data Fig. 4).
To test the bump-reactivation hypothesis, we built a bump attractor network model of spiking excitatory and inhibitory neurons. Based on our electrophysiology findings, short-term plasticity (STP) dynamics were included only in excitatory synapses (Methods). In each trial, stimulus information was maintained in activity bumps during the delay, supported by recurrent connectivity between neurons selective to the corresponding stimulus. During the ITI period, model neurons had no detectable tuning to the previous-trial stimulus (Fig. 4a, black line and Fig. 4b, deep blue)17,31. However, the synapses of neurons that had participated in memory maintenance in the previous delay were facilitated due to STP (Fig. 4a, deep blue line). Parallel to our analysis in Fig. 3, this was reflected in the central peak of the ITI cross-correlation for pairs of excitatory model neurons, which maintained selectivity to the previous stimulus (Fig. 4a) even in the absence of single neuron firing rate selectivity (Fig. 4a, deep blue). We found that single neuron tuning could be recovered from the hidden synaptic trace using a nonspecific input (drive) to the whole population (Fig. 4a,c, Methods, see also ref.9,39). Our biologically constrained computational model was thus an explicit implementation of the bump-reactivation hypothesis that we had formulated.
Figure 4. Bump-attractor model with STP accounts for serial dependence and neurophysiology.
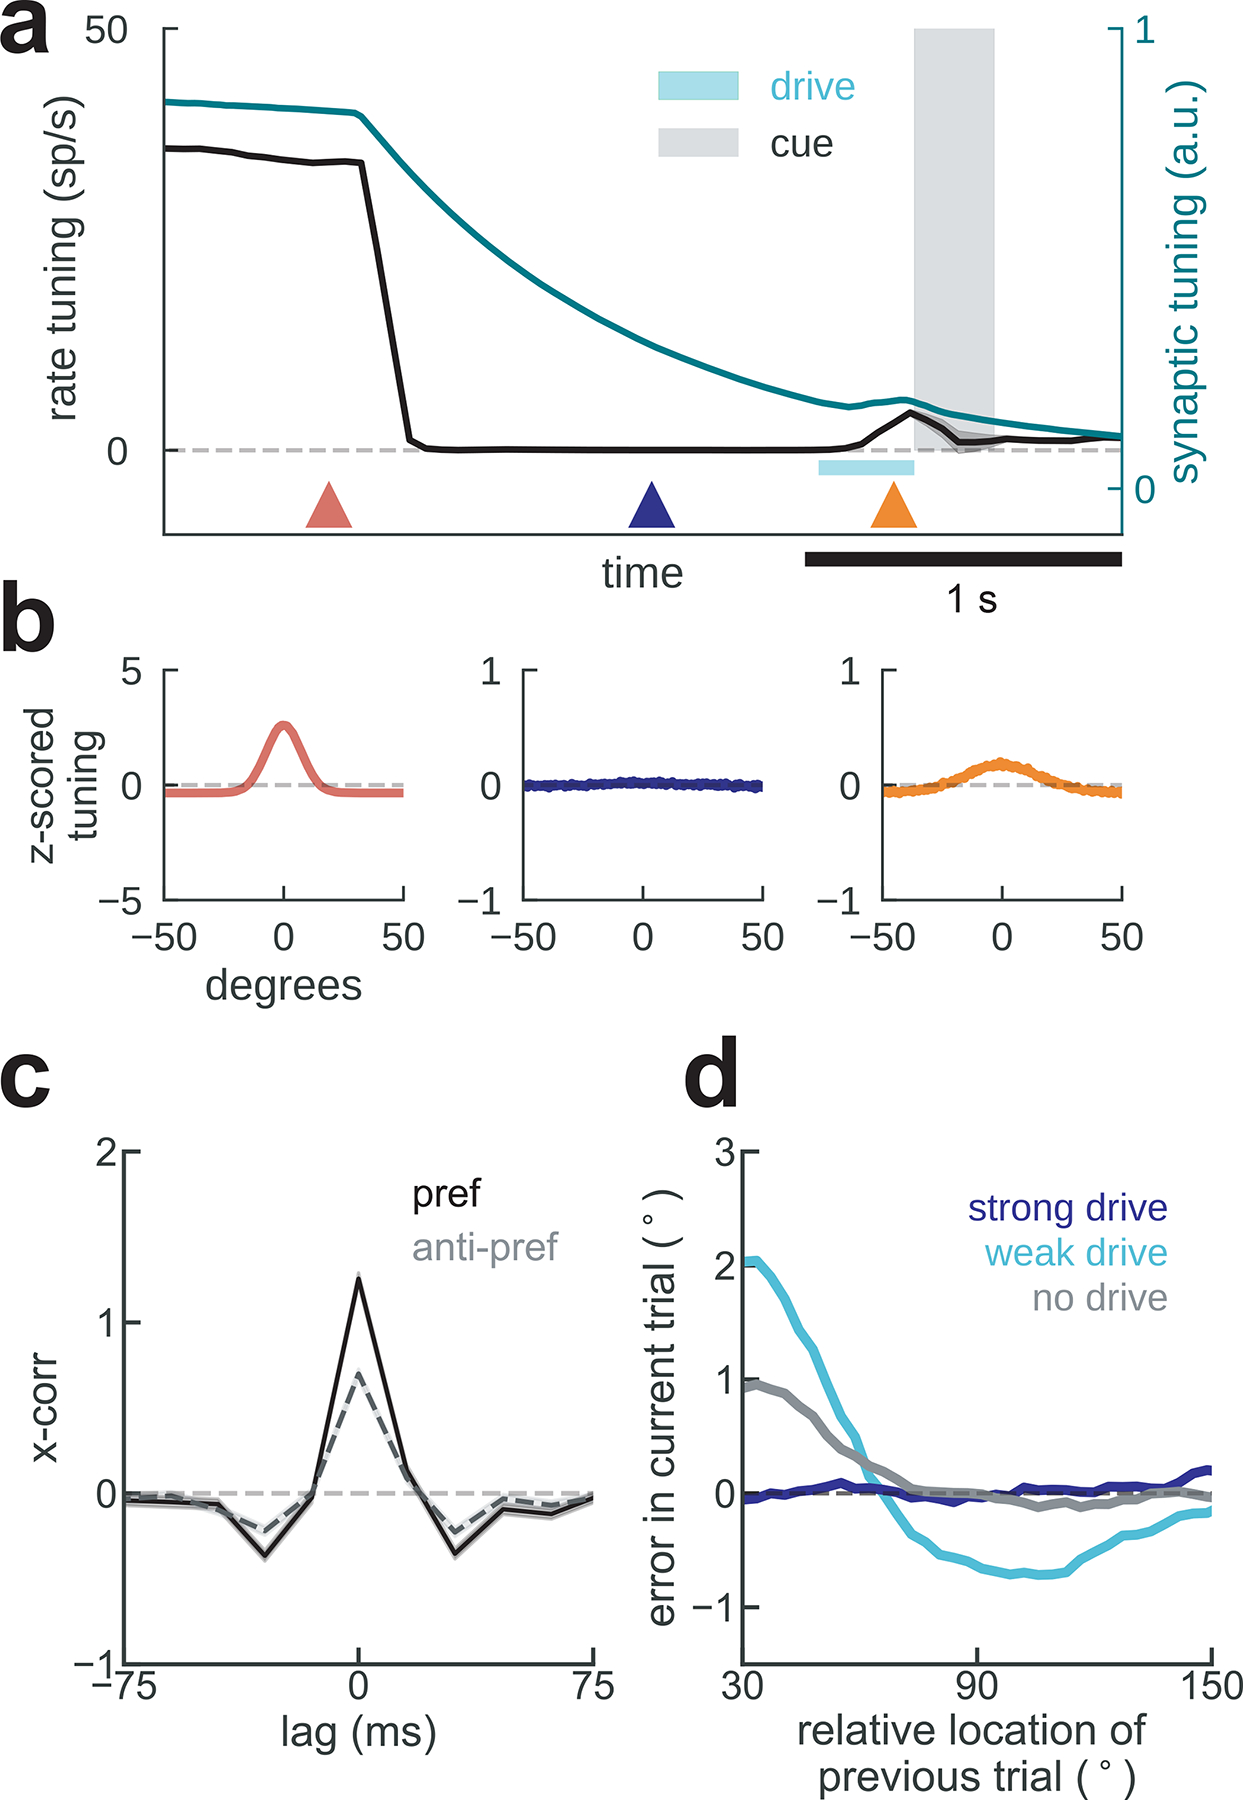
a) Average firing rate tuning (black) and synaptic tuning (green) for 5,000 simulations of two successive trials during delay (Methods). In the mnemonic period (red triangle), both rate and synaptic tuning are at their maximum, both driven by persistent bump-attractor activity (red plot in b). Following the memory period, a nonspecific inhibitory input resets the baseline network state for the duration of the ITI (deep blue triangle and plot in b). This is reflected in vanishing rate tuning, but long-lasting synaptic tuning that can regenerate firing rate tuning (orange plot in b) through reactivation by a non-specific input drive (cyan bar). b) Averaged single-neuron tuning to previous-trial stimulus at different epochs marked with colored triangles in a. c) Cross-correlation of model neurons in the ITI differed for previous-trial stimulus in the preferred location (pref, black) and for anti-pref trials (gray) despite no firing rate selectivity (a,b, deep blue). d) Serial bias plots computed from “behavioral responses” (Methods) in 3 different conditions of non-specific excitatory drive. A weak anticipatory drive increases attractive serial biases and produces repulsion from more distinct previous memories, while a strong drive removes serial biases.
The impact of bump reactivation on serial biases
We next used our computational model to derive behavioral and physiological predictions to test in our data, in particular in relation to serial biases. In order to simulate serial biases with our computational model, we ran pairs of consecutive trials with varying distance between the two stimuli presented in each simulation. We used the final location of the bump in the second trial (current-trial memory) as the “behavioral” output of the model in that trial. We were able to model the profile of serial biases observed experimentally (Fig. 4d; Extended Data Fig. 5), similar to previous models17,31. To test the impact of bump-reactivation in serial biases, we compared the behavioral output of simulations with and without drive before the second trial stimulus (Methods). Bump reactivation resulted in stronger attractive biases for similar successive stimuli, and in repulsive biases for more dissimilar successive stimuli (Fig. 4d, cyan). We found that tuned intracortical inhibition40,41 was necessary for this emergence of repulsive biases upon bump reactivation (Extended Data. Fig. 5; see31,42 for an alternative mechanism). We finally tested the dependence of this behavioral effect on the strength of the nonspecific drive. A very short but strong impulse to the whole network during the ITI quickly saturated all the synaptic facilitation variables, effectively removing all serial biases in the output of the network (Fig. 4d, deep blue). Thus, in this model bump reactivation affects serial biases non-linearly as reactivation strength is varied. In sum, our model can reproduce behavioral and neurophysiological findings described in Figs. 1–3 and derives predictions concerning memory reactivations from silent traces that we then tested in the data.
Previous stimulus reactivation increases serial biases
The model predicts that higher reactivation of previous memories in the fixation period should be associated with stronger serial biases (Fig. 4d). We tested this prediction in our neural recordings from monkey PFC and EEG recordings on the human scalp.
Monkey PFC.
We first classified each trial based on leave-one-out decoding of the previous stimulus trained and tested on activity from two different time windows during fixation: during a period with no stimulus information (activity-silent period, Fig. 1, deep blue), and at the time of reactivation (Fig. 1, orange). For each of these 2 windows we separated high-decoding trials (first quartile) from low-decoding trials (all other trials) and computed bias curves separately. We found that serial biases were indistinguishable in the activity-silent period (Fig. 5a) but they were stronger for high-decoding than for low-decoding trials at the time of bump reactivation (Fig. 5b). This follows the prediction of our computational model, assigning behavioral relevance to the bump reactivation prior to stimulus onset. This result was not dependent on a singular selection of trial separations: for different proportions of high- and low-decoding trials the serial bias strengths (Methods) changed smoothly and remained consistent with the reported result (Extended Data Fig. 6). We then repeated the same analysis at different time points of the ITI. A significant difference in serial bias strength (Methods) emerged only when trials were classified as low- vs. high-decoding in the reactivation period (Fig. 1c, 5c, orange), and serial biases remained virtually indistinguishable at all other time points (Fig. 5c).
Figure 5. Bump reactivation from a hidden trace increases serial biases. Serial bias for trials with high previous-trial stimulus information (upper quartile, red) and for all other trials (black), in monkeys (a-c, n = 1362 trials) and in humans (d-f, n = 15 subjects, with a range of [792, 908] trials in this analysis). See.
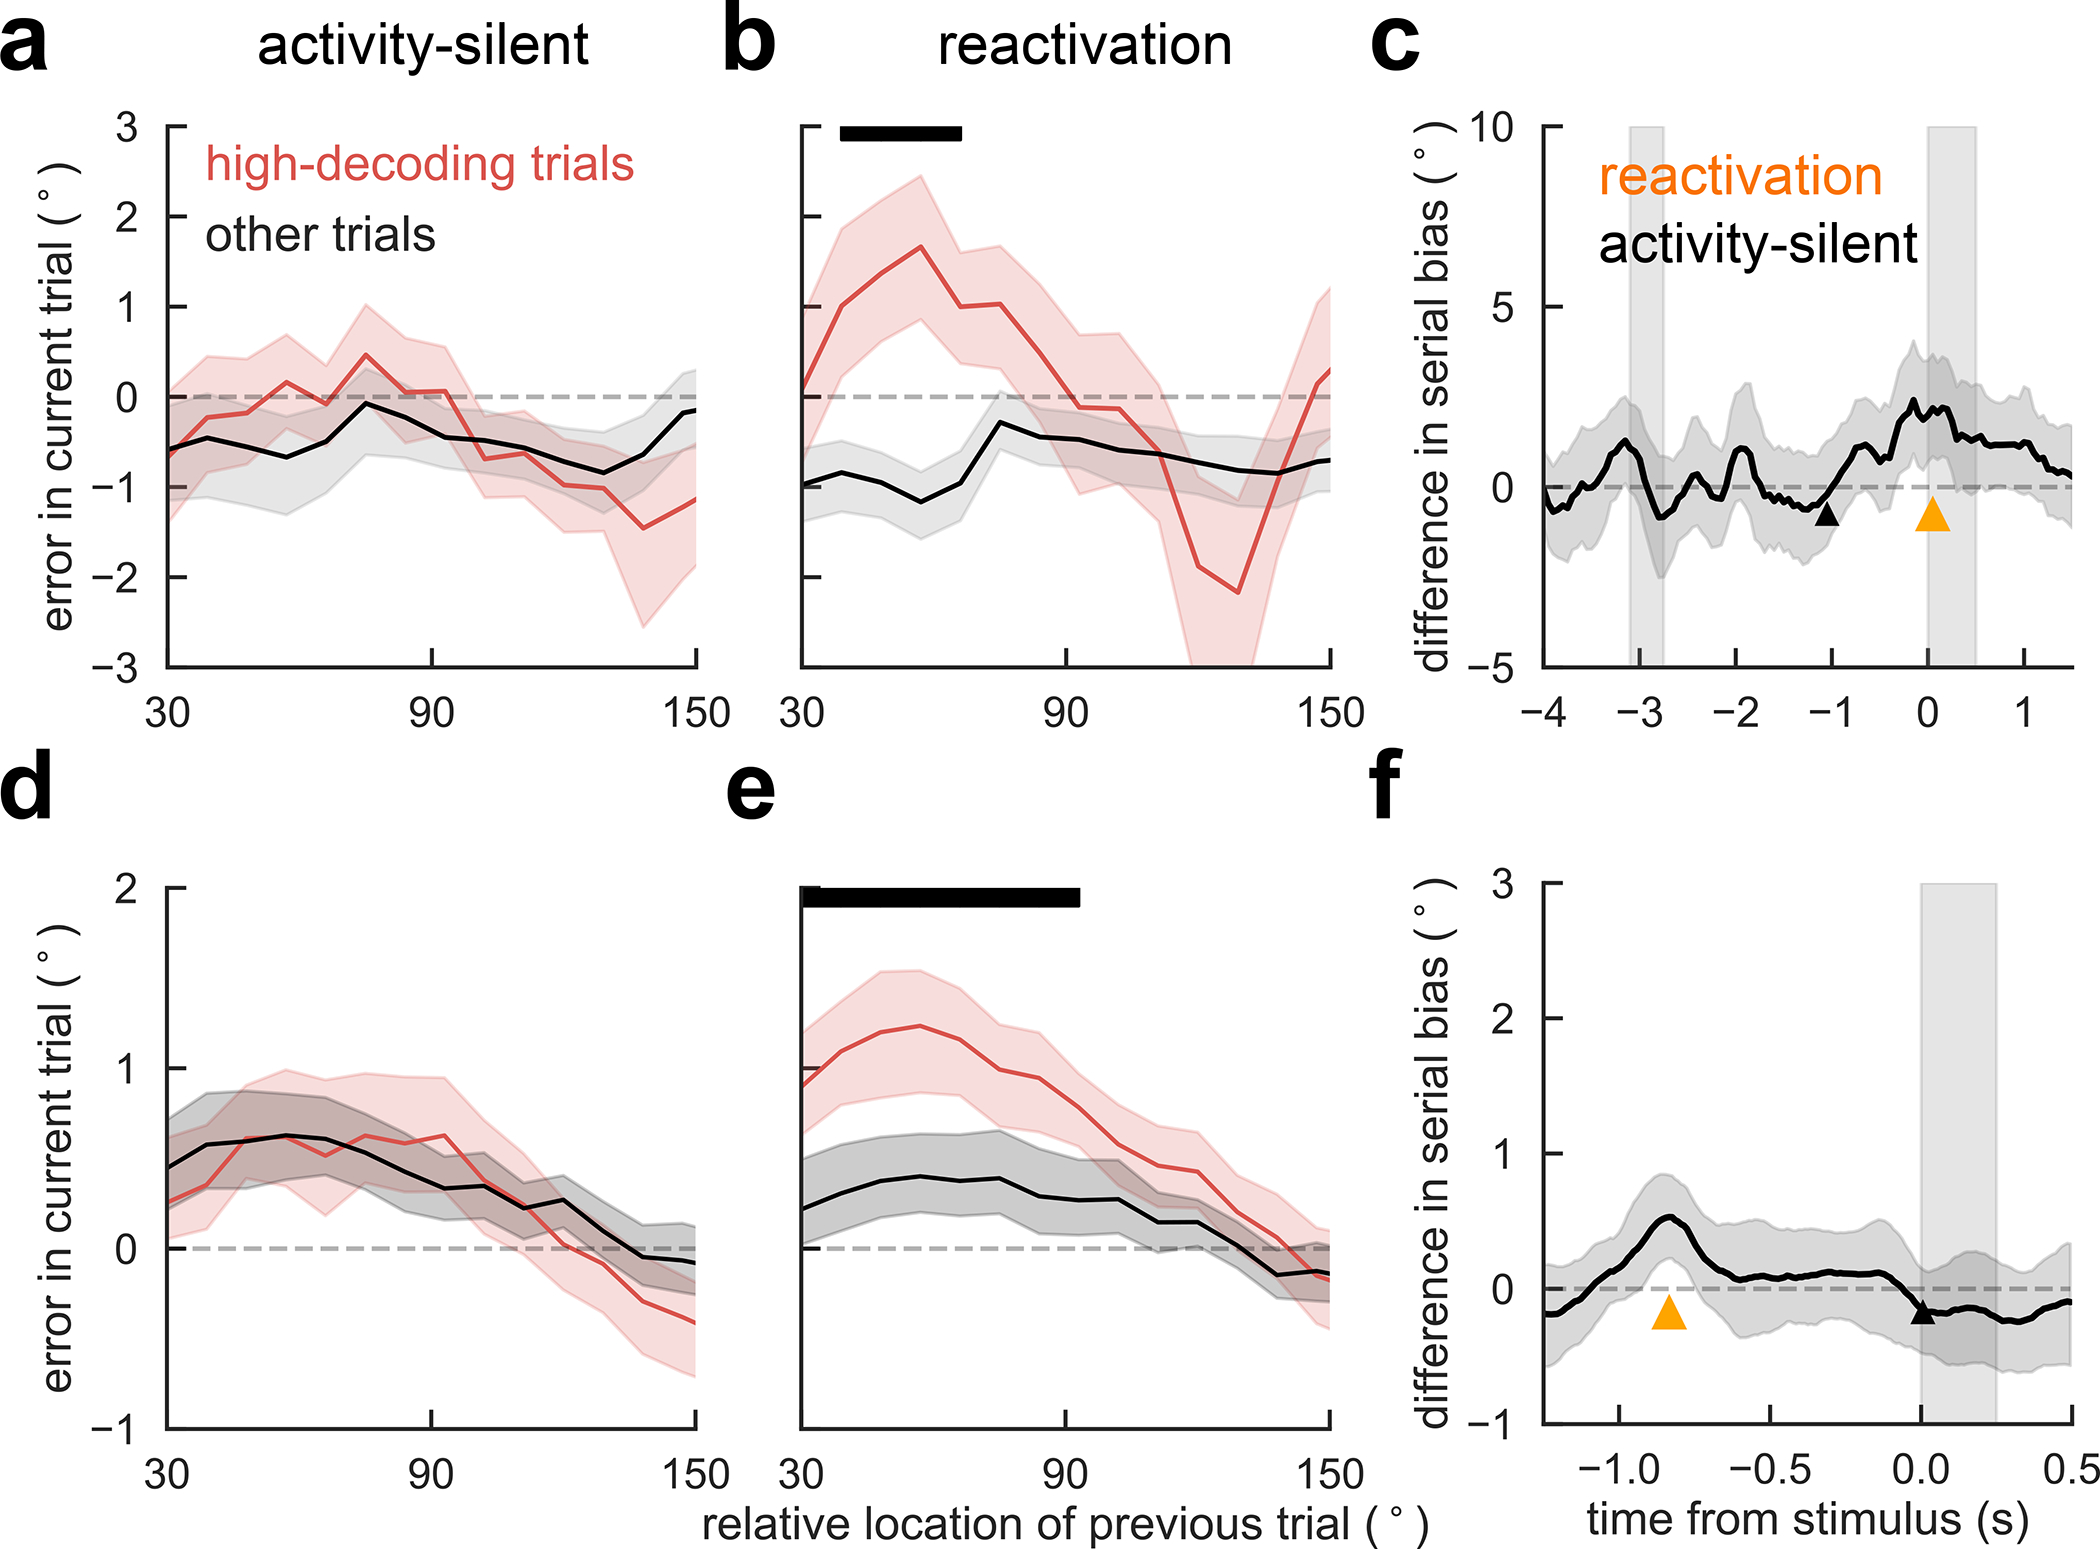
Extended Data Fig. 6 for different quantiles. a) Trials selected based on a decoder trained and tested early in the fixation period (black triangle in c), did not reveal differences in serial bias. b) Serial biases were markedly enhanced for high-decoding trials when training and testing the decoder at the time of reactivation (Fig. 1c, orange triangle in c). c) Difference in serial bias curves between high-decoding and other trials became significant only at pre-cue, concomitant with reactivation (Fig. 1c). Triangles mark center of decoding windows for the splits shown in a, b. d-f) same analyses for human EEG (n=15 independent subjects). Note that for humans, d corresponds to an activity-silent period in late fixation (black triangle in f), and e to the reactivation period in early fixation (Fig. 2c, orange triangle in f). f) As for monkeys, serial bias differences in humans were significant only during reactivation. In c and f, time courses of differences between high-decoding and other trials were smoothed in time using a 5-sample (monkey) and 16-sample (human) square filter. Black bars mark significant differences between high-decoding and other trials (p<0.05, one-sided permutation test). Error-shading in c and f, 95% C.I; in a,b,d,e, ±s.e.m.
Human EEG.
Analogous to the analysis performed in monkey data, we grouped trials by their leave-one-out decoding accuracy of the previous stimulus (Methods). We separated high- and low-decoding trials on two different time points: at the time of reactivation (Fig. 2, 5f, orange) and in an arbitrary time point without stimulus information (activity-silent, Fig. 5c, black). Consistent with monkey data and our model’s prediction, we found stronger serial bias for high-decoding than for low-decoding trials for the reactivation period (Fig. 5e), but not for the activity-silent period (Fig. 5d), where previous memory content was not decodable (Fig. 2c). The analysis was repeated for all other time points during the fixation period (Fig. 5f). Indeed, behavior exclusively depended on decoding accuracy at the time of delay code reactivation (Fig. 2, orange). Taken together, these results support the hypothesis that previous trial memory reactivation prior to stimulus onset controls serial biases.
TMS-induced reactivations modulate serial biases
As a causal validation of the influence of pre-stimulus PFC reactivation on serial biases, we designed a transcranial magnetic stimulation (TMS) study. This is a relevant experiment because memory-dependent changes in human EEG alpha-power cannot be unequivocally ascribed to a specific brain region, which limits the correspondence of our EEG and monkey dlPFC data. In particular, representations in larger and more organized occipital cortices might contribute strongly to visual EEG signals (e.g. ref.34), but could yet be driven by top-down projections from association cortices43. Inspired by a previous study that reported reactivation of latent memories using TMS14, we causally tested the implication of dlPFC in serial biases by applying single-pulse TMS during the fixation period. We had two control conditions to test our hypotheses: (1) we targeted the TMS coil at dlPFC and vertex in interleaved blocks; and (2) we randomly chose TMS intensity relative to the subject’s resting motor threshold (RMT) in each trial (sham: 0%, weak-tms: 70%, and strong-tms: 130% of RMT, Methods). We found that TMS modulated serial biases when targeted at dlPFC but not at vertex (Fig. 6). Moreover, our computational model predicted a non-linear dependence with stimulation strength (Fig. 4d), which was supported by the data (Fig. 6b). Interestingly, the behavioral impact of PFC TMS stimulation declined throughout the session, as if subjects desensitized to the TMS pulse (Extended Data Fig. 7). Importantly, we show combined results from two separate experiments of n=10 subjects each, one being a pre-registered replication (Methods, Extended Data Figs. 8, 9). These results provide causal evidence for the involvement of PFC in the serial bias machinery during the ITI. Further, we show that TMS impacts serial biases nonlinearly, as predicted by model simulations that implement the bump reactivation hypothesis via the interplay of bump attractor and activity-silent mechanisms.
Figure 6. Single-pulse TMS on dlPFC during fixation modulates serial biases non-linearly.
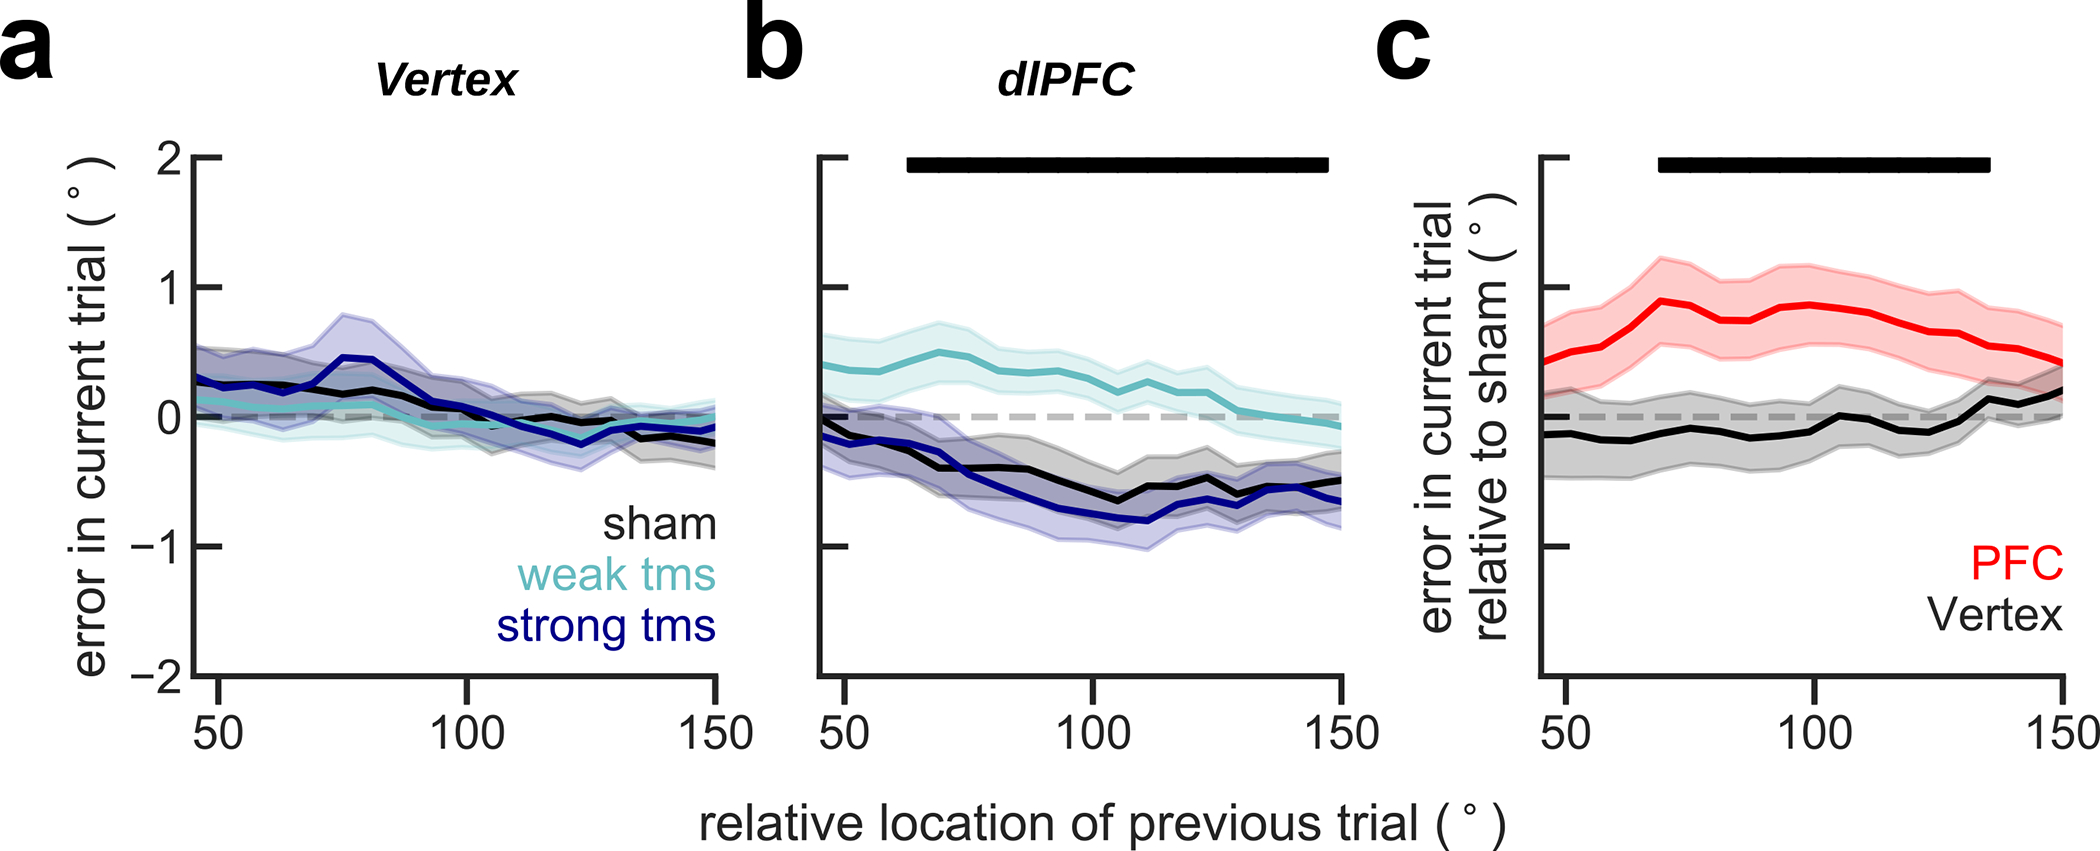
Serial bias plots computed in vertex (a) and PFC (b) blocks, separately for trials with strong fixation-applied TMS pulse (130% of resting motor threshold, RMT, deep blue), weak (70% RMT, cyan) and sham (0% RMT, black) for the first 225 trials in each session (n=20 participants, 2 sessions/participant, Extended Data Figs. 7–9). Serial biases were modulated by TMS in PFC, but not in Vertex (previous-current stimulus distance (prev-curr) ✕ TMS intensity ✕ coil location, t18272=2.21, p=0.027. For dlPFC: prev-curr ✕ TMS intensity, t11087=2.13, p=0.032. For Vertex: t7166=0.03, p=0.97. Methods, Linear mixed models; analysis performed on the whole session). In PFC, serial bias modulation depended nonlinearly with stimulation strength (ΔAIC=4.6, relative likelihood 0.9, for the comparison of regression models with non-linear vs. linear TMS intensity factor; Methods). c) Difference between serial biases computed for sham and weak-tms trials in vertex (black) and in PFC (red) blocks. Error bars are bootstrapped ±s.e.m.. Solid black bars mark significant differences (two-sided permutation test, p<0.05, n=20 independent subjects).
Discussion
By studying the neural basis of serial biases, we have shown how the interplay of bump-attractor dynamics and silent mechanisms in PFC maintains and eventually reactivates information about previous stimuli in spatial working memory. In delayed-response tasks, prefrontal tuned persistent activity consistent with bump-attractor dynamics characterizes the delay period and correlates with behavioral precision6,44. We have now seen that this sustained activation disappears from the prefrontal network between trials, but it is reactivated before the new trial (Figs. 1,2) and enhances behavioral serial biases (Figs. 5,6). This reactivation is directly linked to previous trial activity: it emerges specifically in those neural ensembles that showed strongest persistent tuning in the delay (Fig. 1c, Extended Data Fig. 1), it is decoded from the human EEG with decoders trained in the delay (Fig. 2), and it has the fingerprints of bump attractors as evaluated with pairwise correlations (Extended Data Fig. 2). Activity-silent mechanisms in prefrontal cortex bridge disconnected periods of persistent activity, carrying trial-specific information from one trial to the next (Fig. 3). Importantly, this latent tuning is directly associated with trial-by-trial firing rates in the preceding delay (Fig. 3e), thus establishing a coupling between activity-based and activity-silent mechanisms in PFC. Taken together, our results are consistent with the view that attractor-based and activity-silent mechanisms are jointly represented in the prefrontal circuit and that their tight interplay influences representations in spatial working memory. We specified this in a computational network model: delay-period attractor dynamics imprint activity-silent mechanisms, which then retain information between trials and allow reactivations to recapitulate attractor states (Fig. 4).
Our data provides experimental support that non-specific PFC stimulation can revive subthreshold information, supporting the ideas put forward in computational models9 and in previous neuroimaging and EEG studies14,32,45. Importantly, we obtained explicit causal evidence supporting the role of ITI reactivations in enhancing serial biases.
Similarly, recent causal evidence in rodents26 showed the role of parietal activations in generating history-dependent biases. However, the absence of selective mnemonic delay activity in rat parietal neurons26 suggests that parietal ITI representations do not emerge from trace reactivations. A directed mechanistic investigation of rat PPC in this task, similar to our efforts here, would be necessary to clarify the mechanisms and origin of history biases, and potential differences between the generation of contraction and serial biases in rodents and primates. On the other hand, human TMS studies found behavioral effects of memory reactivations, when applied in the delay period, but only when memories were still behaviorally relevant14. In contrast, we show here that fixation-period TMS can enhance the behavioral influence of previous, already irrelevant memories. Reactivations may thus not depend on behavioral relevance, but rather on the decaying dynamics of activity-silent mechanisms: a more advanced decay of irrelevant memory traces in ref.14 may limit memory reactivations. Reactivations also offer alternative explanations to TMS effects in working memory that have previously been interpreted on the basis of network disruptions46.
Our data supports the idea that activity-silent and attractor-based mechanisms are not orthogonal, alternative mechanisms, but they are interdependent mechanisms co-localized in PFC. In turn, their different timescales may associate them preferentially with different types of memory processes. During active maintenance of working memory rapid persistent attractor-based activity may encode memory, with slower activity-silent mechanisms having a supporting, stabilizing role11,17,18. Note that although direct evidence of this interplay in the delay period is problematic (Extended Data Fig. 3), our approach of separately assessing delay period and inter-trial interval, and their trial-by-trial correlation, supports this interplay indirectly and may be the most direct evidence that can be accessed extracellularly, without resorting to detailed intracellular measurements in awake monkeys. On the other hand, after the deactivation of attractor-based active maintenance in the inter-trial interval, slowly-decaying activity-silent maintenance may underlie secondary, possibly involuntary memory traces, leading to serial biases in upcoming trials. Note that previous studies have also proposed a central role for activity-silent maintenance for an additional, intermediate type of memory: unattended, behaviorally-relevant memories14,32. It was hypothesized that, by resorting to different mechanisms, unattended memories may be reserved and protected while processing attended memories. Although our data does not address the mechanism of unattended memories, in our proposed framework the close interplay between attractor-based and activity-silent mechanisms does not allow unattended memories (activity-silent memories) to be protected from intervening attended memories (attractor-based). This yields the prediction that serial-bias-like patterns of interference40,41 between unattended and attended memories should be observed in these experiments14,32.
Our results have implications for the functional interpretation of serial biases and their relation with the interplay of prefrontal mnemonic mechanisms. First, enhanced serial biases after reactivating latent traces from earlier memories are consistent with the view that biases are the by-product of memory-supporting processes. As previous computational studies have shown, long-lasting cellular or synaptic mechanisms can enhance the stability of working memory retention (e.g.11,17–19), with the cost of across-trial interference of memories11,17. Along these lines, a recently found reduction in serial biases in patients with schizophrenia42, anti-NMDAR encephalitis42 or autism28 may reflect a reduced interplay of memory supporting mechanisms. Second, we see an active role of PFC in generating serial biases, rather than suppressing them as proposed by the proactive interference literature29,30. This discrepancy could be resolved if the role of PFC was two-sided: 1) PFC could generate biases either as a by-product of stable memory retention11,17 or even actively, in circumstances in which past memory traces are adaptive for behavior25; alternatively, 2) strong PFC activation would suppress maladaptive memory remnants in situations where biases are particularly detrimental to behavioral performance. This dual PFC function is supported in our modeling and TMS data by the contrasting effect of weak and strong PFC activation on serial biases.
Our TMS experiment clarified our EEG results by demonstrating the role of PFC in serial biases. Because we did not concurrently acquire EEG during the TMS study, we could not directly measure the neural reactivation induced by the TMS pulse. However, prior work has shown the reactivation of EEG memory representations with TMS14, albeit in different conditions (pulses in the memory period targeted at parietal and occipital regions). Intriguingly, serial biases for trials without TMS stimulation in PFC-stimulation blocks were repulsive (Figure 6b). We speculate that this was due to suppressive long-lasting physiological effects in PFC that carried over from previous TMS-stimulated trials in the block47 (see Extended Data Fig. 10 for a phenomenological model of this hypothesis). Future work involving more fine-grained TMS intensities and carefully controlled block designs will be necessary to clarify these results further.
We proposed a computational model that can parsimoniously explain our data using short-term facilitation in the synapses of a recurrent network. Short-term plasticity has also been used in previous computational models of interacting activity-based and activity-silent dynamics9,10,13 and of serial biases17,31. Beyond previous modeling efforts, we explored the mechanistic requirements of code reactivations prior to a new trial, and we derived predictions whose validation conferred plausibility to the model. Our findings do not unequivocally identify this mechanism and we could have chosen another mechanism with a long time constant to implement our hypothesis computationally (e.g. calcium-activated depolarizing currents18, depolarization-induced suppression of inhibition11, short-term potentiation48, etc). Also, synaptic plasticity mechanisms linked to feedforward connections into PFC39 could conceivably play a role. Still, several lines of evidence support the involvement of short-term plasticity in prefrontal function. First, there is explicit evidence for enhanced short-term facilitation and augmentation among PFC neurons in in vitro studies49,50. Second, extracellular recordings in behaving animals cannot directly probe activity-silent mechanisms, but indirect evidence for synaptic plasticity has been gathered in prefrontal activity correlations of rodents engaged in working memory tasks36. Our study also follows this approach to seek evidence for activity-silent stimulus encoding, but we apply it specifically at time periods without firing rate codes for task stimuli, thus unambiguously decoupling activity-silent from activity-based selectivity (Fig. 3, Extended Data Fig. 3).
In sum, we provide experimental evidence that subthreshold traces of recent memories remain imprinted in PFC circuits, and bias behavioral output in working memory in particular through network reactivations of recent experiences. Our findings suggest that the dynamic interplay between attractor and subthreshold network dynamics in PFC supports closely associated memory storage processes: from effortful memory to occasional reactivation of fading experiences.
Materials and Methods
Behavioral task and recordings
Monkey behavioral task and recordings.
Four adult (>6 years old), male rhesus monkeys (Macaca mulatta) were trained in an oculomotor delayed response task requiring them to fixate, view a peripheral visual stimulus on a screen at a distance of 50 cm and make a saccadic eye movement to its location after a delay period. During execution of the task, neurophysiological recordings were obtained from the dorsolateral prefrontal cortex (dlPFC). Detailed methods of the behavioral task, training, surgeries and recordings, as well as descriptions of neuronal responses in the task have been published previously6,51–54 and are only summarized briefly here. Visual stimuli were 1° squares, flashed for 500 ms at an eccentricity of either 12° or 14°, indicated as degrees of visual angle. Stimuli were presented randomly at 1 out of 8 possible locations around the fixation point. A delay period lasting 3 s followed the presentation of the stimulus, at the end of which the fixation point turned off, and a saccade terminating within 5° from the location of the remembered stimulus was reinforced with liquid reward (5° correspond to about 20 degrees of arc on the circle of possible cues). Although fixation was maintained through cue and delay periods, we denote “fixation period” the interval between fixation onset and cue onset, when the only behavior expected was fixation (fixation period, Fig. 1b). A fixed inter-trial interval (ITI) of 3.1s elapsed between fixation cue extinction and the onset of the cue in the next trial (ITI, Fig. 1b). Eye position was monitored with a scleral eye coil system in two monkeys and an ISCAN camera in the other two. From 2 of those monkeys, we collected single-unit responses from dlPFC using tungsten electrodes of 1–4 MΩ impedance at 1 kHz, while they were performing the task51. Simultaneous recordings were obtained by arrays of 2–4 microelectrodes, spaced 0.2–1 mm. A substantial fraction of neurons in this area showed tuned persistent delay activity during the mnemonic delay period of the task (n=206/822 neurons,6,51–54). For decoding analyses, we grouped those neurons in simultaneously recorded ensembles (total of n=94 neural ensembles, 1–6 neurons per ensemble, Extended Data Fig. 1a). All experiments were conducted in accordance with the guidelines set forth by the US National Institutes of Health, as reviewed and approved by the Yale University Institutional Animal Care and Use Committee, and by the Wake Forest University Institutional Animal Care and Use Committee. Data collection and analysis were not performed blind to the conditions of the experiments. No statistical methods were used to pre-determine sample sizes, and we followed customary practice of testing n=2 monkeys for electrophysiology data and n=4 monkeys for behavioral data. We note that the electrophysiology data was acquired previously and has been used in other publications6,51–56.
Human participants and behavioral task.
Thirty-five (35) neurologically and psychologically healthy volunteers with normal or corrected vision (EEG experiment n=15 (4 male), 21.27 ± 4.86 years, (mean ± std); two additional subjects were tested but aborted the EEG experiment with insufficient trials); TMS experiments n=20 (6 male), 29.86 years ± 9.55 years (mean ± std); one additional participant was excluded before their MRI scan due to health concerns) from the Barcelona area provided written informed consent and were monetarily compensated for their participation, as reviewed and approved by the Research Ethics Committee of Hospital Clínic (Barcelona). During both EEG and TMS experiments, each participant performed two sessions of approximately 1.5 h. To perform behavioral and EEG analyses, we concatenated the two sessions for each subject. Stimuli were presented on a 17” HP ProBook viewed at a distance of 65 cm, and using Psychopy (version 1.82.01) running on Python 2.7. The TMS study consisted of a first experiment with 10 subjects, and a pre-registered replication experiment (https://osf.io/rguzn/) with 10 more subjects (Extended Data Figs. 7–9). For all 3 studies (one EEG and two TMS experiments), we recruited independent subject pools. For the fully randomized within-subjects design of our EEG task, condition-blind data collection and analysis was not a critical issue. In the TMS study, the experimenter could not be blind to the location of the coil. No statistical methods were used to pre-determine sample sizes but our sample sizes are similar to those reported in the relevant previous publications14,34,46
In each 1.5 h EEG session, participants completed 12 blocks of 48 trials (except for one participant, who completed 12 blocks in one, and 9 blocks in the second session). Each trial began with the presentation of a central black fixation dot (.5 × .5 cm) on a gray background. After 1.1 s of fixation, a single colored circle (stimulus, diameter 1.4 cm) appeared for .25 s at any of 360 circular locations at a fixed radius of 4.5 cm, randomly sampled from a uniform distribution. In 66.67% of trials (a total of 768 trials per subject), the stimulus was followed by a 1 s delay in which only the fixation dot remained visible. In the remaining trials, the delay duration was either 3 s (16.67% of trials, 192 trials per subject) or 0 s (16.67% of trials, 192 trials per subject). Trials with 0 s delay were excluded from the analyses in this study. The change of the fixation dot color (from black to the stimulus color) instructed participants to respond (response probe). Participants responded by making a mouse click at the remembered location. A transparent circle with a white border indicated the stimulus’ radial distance, so the participant was only asked to remember its angular location. After the response was given, the cursor had to be moved back to the fixation dot to self-initiate a new trial. The total length of the ITI, defined as the time between response probe and the next stimulus onset, was around 2.72 s (median, 95% CI = [2.11 s, 4.16 s]). Participants were instructed to maintain fixation during pre-stimulus fixation, stimulus presentation, and delay and were free to move their eyes during response and when returning the cursor to the fixation dot. Colors (1 out of 6 colors with equal luminance) were randomly chosen with equal probability for each trial.
Stimuli and trial structure in the TMS task were similar to the EEG task, except for the fixation period duration (0.6 s) screen background (white), stimulus color (black), and response probe color (red). At the end of the fixation period (16.7 ms prior to stimulus onset), a single TMS pulse was applied in half of vertex trials (tms or sham trials, randomly interleaved), and in two thirds of prefrontal trials (weak, strong or sham trials, randomly interleaved). See TMS details below. Only delays of 1 s were used in this experiment. Participants completed 4 blocks of 90 (vertex) and 4 blocks of 130 (PFC) trials within each session. In the first TMS study, these 8 blocks were randomly shuffled for each session. In the replication TMS study, we successively alternated vertex and PFC blocks within each session, and the 2 sessions of a given participant started alternatively with each area in a counterbalanced design.
EEG recordings and preprocessing.
We recorded EEG from 43 electrodes attached directly to the scalp. The electrodes were located at Modified Combinatorial Nomenclature sites Fp1, Fpz, Fp2, AF7, AFz, AF8, F7, F3, Fz, F4, F8, FT7, FC3, FCz, FC4, FT8, A1, T7, C5, C3, Cz, C4, C6, T8, A2, TP7, CP3, CPz, CP4, TP8, P7, P3, Pz, P4, P8, PO7, PO3, POz, PO4, PO8, O1, Oz and O2. Sites were referenced to an average of mastoids A1 and A2 and re-referenced offline to an average of all electrodes. We further recorded horizontal EOG from both eyes, vertical EOG from an electrode placed below the left eye and ECG to detect cardiac artifacts. We used a Brainbox® EEG-1166 EEG amplifier with a .017–100 Hz bandpass filter and digitized the signal at 512 Hz using Deltamed Coherence® software (version 5.1).
EEG data was pre-processed using Fieldtrip (version 20171231) in MATLAB R2017b and R2019a. We excluded outlier trials in which variance or kurtosis across samples exceeded 4 standard deviations from mean variance or kurtosis over trials, respectively. To reduce artifacts in the remaining data, we ran an independent component analysis (ICA) on the trial-segmented data and corrected the signal for blinks, eye movements, and ECG signals, as identified by visual inspection of all components. Data were Hilbert-transformed (using the FieldTrip function “ft_freqanalysis.m”) to extract frequencies in the alpha-band (8–12 Hz) and total power was calculated as the squared complex magnitude of the signal. Finally, we excluded trials in which lognormal alpha-power at any electrode exceeded the time-resolved trial average of lognormal alpha-power by more than 4 standard deviations, and trials in which the time-averaged variance across electrodes exceeded the mean variance over trials by more than 4 standard deviations (to increase the stability of trial-wise decoding predictions for different randomly chosen training sets). In total, we rejected an average of 3.95% ± 1.07% (mean ± std) of trials per participant. Excluding rejected trials and trials with 0 s delay, we used 914.33 ± 28.94 trials per participant. To concatenate data from the two sessions for the same subject, we normalized each session’s alpha-power for each electrode separately.
Transcranial Magnetic Stimulation.
Stimulation was performed in the TMS study using a Magstim Rapid 2 machine with a 70 mm figure-of-eight coil. TMS target points were located using a BrainSight navigated brain stimulation system that allowed coordination of the coil position based on the participant’s structural MRI (sMRI) scan. A region of interest in right dlPFC (MNI152 coordinates x = 40, y = 34, z = 16) was defined using NeuroSynth57 term-based meta-analysis of 53 fMRI studies associated with the key phrase ‘spatial working memory’ (Supplementary Fig. 1 and Supplementary Data). This mask was transformed into each subject’s sMRI space. Vertex target points were defined using the 10–20 measurement system. Stimulator intensity, coil position, and coil orientation were held constant for each participant for the duration of each session. In order to mask the sound of TMS coil discharge, we had participants listen to white noise through earphones for the duration of the session. White noise volume was selected based on participant threshold for detecting TMS click using the staircase method (2-up, 1-down). Stimulation intensity was determined by the individually-defined resting motor threshold (RMT). We applied 2 different TMS intensities at 70% RMT (weak-tms, 24.5%−41.5% (min-max) of stimulator output) and 130% RMT (strong-tms, 45.5%−76.5% of stimulator output), depending on the trial (see text). To reduce the number of trials per session, we applied strong-tms at Vertex in the original study, but weak-tms for the replication study (pre-registered at https://osf.io/rguzn/, Extended Data Figs. 9 and 10). The stimulation parameters were in accordance with published TMS guidelines58. In a post-experiment debriefing session, we collected information about the subjective experience of the participants. Many participants (13 out of 20) reported facial muscle twitching in dlPFC blocks. This is an unlikely explanation for the effects observed in Fig. 6 because (1) twitching is expected to increase with TMS intensity but we instead observed a non-linear dependency in our effect (Fig. 6b), and (2) behavioral performance in our task as measured by the precision of the responses was not modulated by TMS intensity in dlPFC blocks (linear mixed model as described below: , p>0.5), suggesting that our reported intensity-dependent effect (Fig. 6b) was not the result of a general behavioral impairment caused by facial twitching.
Serial bias analysis
Human.
For each trial, we measured the response error (θe) as the angular distance between the angle of the presented stimulus and the angle of the response. To exclude responses produced by guessing or motor imprecision, we only analyzed responses within an angular distance of 1 radian and a radial distance of 2.25 cm from the stimulus. Further, we excluded trials in which the time of response initiation exceeded 3 s, and trials for which the time between the previous trial’s response probe and the current trial’s stimulus presentation exceeded 5 s. On average, 2.99% ± 4.51% (mean ± std) of trials per participant were rejected.
We measured serial biases as the average error in the current trial as a function of the circular distance between the previous and the current trial’s target location (θd) in sliding windows with size π/3 and in steps of π/20 radians, and steps of π/100 radians for Fig. 2a (note that for easier interpretability, all figures depict values in angular degrees). To increase power and correct for global response biases, we calculated a ‘folded’ version of serial biases as follows59. We multiplied trial-wise errors by the sign , and used absolute values of θd Positive mean folded errors should be interpreted as attraction towards the previous stimulus and negative mean folded errors as repulsion away from the previous location. For difference in serial bias analyses (Fig 5f), we averaged folded errors for close prev-curr distances (between 0 and π/2radians).
Monkey.
In contrast with the human experiments, the stimulus distribution was discrete for all the monkey experiments. On each trial, the subject was cued to 1 of 8 possible cue locations equidistant on a circle. This restricted the minimal angular distance between cues in two consecutive trials to be π/4 radians. To have a finer resolution to calculate serial biases, we capitalized on the response variability on each trial: we computed θd as the distance between the current trial’s stimulus and the previous trial’s response (instead of the previous trial’s stimulus). Similar methods to humans were used, except for Fig. 1a, where we used smaller sliding window sizes (π/10 in steps of π/100 radians), essential to capture the thinner attractive serial bias profile in monkeys (Fig. 1a). Specific differences in our monkey and human serial bias curves (Fig. 1a, 2a) may be due to the discrete stimulus distribution (8 possible locations) that we used for monkeys, in contrast to the continuous distribution used in our human experiments. Indeed, studies with larger samples and continuous stimulus distributions have reported behavioral biases in monkeys more consistent with the human literature21,33. For all our serial bias curves, x-axis coordinates mark the central value of the corresponding sliding window.
Statistical methods
Data were analyzed using custom scripts in Python 2.7 (monkey and TMS data) and in Python 3.7.4 (human EEG data). Details of statistical methods are tabulated in the Life Sciences Reporting Summary available online. Unless stated otherwise, all hypothesis tests were two-tailed (permutation tests or bootstrap hypothesis test, n=106) and confidence intervals (C.I.) are at [2.5, 97.5] percentiles of a bootstrapped distribution. Using bootstrap distributions, we avoid assuming normality for our statistical tests. One exception was the linear model used for TMS data analyses, in which normality was assumed. Supplementary Fig. 2 shows the distribution of residuals of this model and corresponding qqplot. There was a significant deviation from normality in extreme values. This did not compromise our statistical inference, because of the large sample size (n= 18299)60 and because the interaction of interest was confirmed by model-free analyses (Fig. 6, Extended Data Figs. 7–9).
To test the effect of TMS on serial biases, we fit a linear mixed-effects model using the R function lme61. In particular, we modeled trial-wise behavioral errors θe as a linear model with interaction terms for coil location (PFC vs. vertex), TMS intensity (strong-tms, sham, and weak-tms) and the sine of θd (prev-curr), which approximates the expected dependency of θe on θd in the presence of serial biases (θe ∝ sin(θd)). We incorporated the non-linear dependency of serial bias on stimulation intensity that our model simulations predicted, by using −1, 0 and 1 for strong-tms, sham and weak-tms, respectively. In one model, we used instead the nominal percent of RMT TMS intensity used (70, 0, 130, respectively) for comparison (Fig. 6b). We accounted for subject-by-subject variability by including random-effect intercepts and random-effect coefficients of prev-curr. The full, three-way interaction model was:
Decoding stimulus information
Monkeys.
Population decoder.
For each recorded ensemble, we decoded stimulus θj in trial j by modelling it as a linear combination of the spike counts nij (i = 1…k) of k simultaneously recorded neurons, computed in sliding windows of 0.5 s and steps of 0.1 s during that trial (in all decoding time courses depicted in figures (monkeys and humans), time (x-axis) coordinates mark the central value of the corresponding sliding window):
For each set of neurons, we trained two sets of weights {βi} and {ωi} on 80% of randomly selected trials and tested in the remaining trials. We applied Monte-Carlo cross-validation with 50 random splits to obtain angle estimates . We obtained a measure of error (err) by averaging across splits the mean absolute error in each split.
Accuracy of ensembles: Distance from shuffle.
To establish the significance of decoding accuracy (z), we compared each ensemble’s decoding error (err), to the distribution of decoding errors in 1,000 shuffled stimulus sequences (errs). By shuffling the list of stimuli presented in the particular recording of each ensemble, we maintained the characteristics of the distribution (e.g. unbalanced distribution of stimuli), but effectively destroyed correlations between stimuli and neural activity.
In Fig. 1c and Extended Data Fig. 1b, we tested separately ensembles that had the strongest and weakest decoding accuracy in the delay by obtaining z from spike counts in the delay period, and classifying the ensembles based on z: ensembles within the top tertile (high-decoding delay ensembles), and those in the bottom tertile (low-decoding delay ensembles).
Accuracy of single trials: Leave-one-out decoder.
To measure stimulus information on a trial-by-trial basis, we used leave-one-out cross-validation (Fig. 5a–c). We regressed the βi and ωi weights in all trials, except the one left out for testing. For these analyses we computed spike counts in windows of 1 s in steps of 50 ms.
Humans.
Linear decoder.
EEG alpha power is known to decrease in occipital sites contralateral to attended locations and locations being actively maintained in working memory34,62–64. We used this feature to decode the stimulus’ angular position from the distribution of alpha power over all 43 electrodes. We trained the decoder on the previous trial’s stimulus label and decoded this information throughout the previous and current trial. Trialwise alpha power for each electrode was modeled as a linear combination of a set of regressors representing the stimulus location in the corresponding trial, U = WM, where U is a J × K matrix of alpha power measured at electrode j in trial k, M is the N × K design matrix of values for regressor n in trial k, and W is the J × N weight matrix, mapping the weight for regressor n to electrode j. U and M (determined by the stimulus, see below) were given by the experiment, while W was fitted using least squares (see below).
The design matrix M is a set of eight regressors Mn representing expected “feature activations”65 for feature n in trial k. The value of regressor Mn in trial k was determined as |sin(nπ/8 – skπ/8 + π/2)7|, where sk = [0…7] indicates which one of eight angular location bins (width π/8 rad) included the stimulus shown in trial k.
Similar to monkey analyses, we measured single-trial stimulus representations using leave-one-out cross-validation, ensuring equal number of trials from each location bin in the training set (Ut and Mt). We estimated the weight matrix and the left-out trial k’s design matrix by:
For each trial and time point, we repeated this analysis 100 times with randomly chosen training sets (except for the temporal generalization matrix, for which 10 repetitions were run, Fig 2b), and averaged over all repetitions. Finally, we estimated the predicted angle as the direction of the vector sum of feature vectors with length pointing at angular location bin centers bn = nπ/8 (n = 0…7). Trialwise decoding strength was then defined as . To correlate decoding strength with behavioral biases (Fig. 5d–f), we increased the stability of trialwise measures by temporal averaging over moving 200 ms windows (x-axis ticks in Fig. 5f are centered at window centers).
Cross-temporal decoding.
To explore the temporal generalization of the mnemonic and the response code over time, we trained decoders in independent time windows of the previous and current trial, and tested them in all time points of consecutive trials (from .25 s to 1.25 s after previous stimulus onset (Fig. 2c, left), −.25 s to .25 s after previous response (Fig. 2c, middle), and −1.25 s to .25 s after the current trial’s stimulus onset (Fig. 2c, right)). For the temporal generalization matrix (Fig. 2b), we averaged training and test data over independent windows of 50 samples (≈ 97.77 ms). High-resolution time courses of mnemonic and response code (Fig. 2c) were obtained by training the decoder on averaged data from 0.5 s to 1 s after previous stimulus onset and −.25 s to .25 s relative to the response time (dashed lines in Fig. 2b), respectively, and by testing on averaged data from five samples (≈ 9.77 ms) through consecutive trials.
Preferred location
We computed the preferred locations of each neuron. Similar to ref.6, preferred location was determined by computing the circular mean of the cue angles (0° to 315°, in steps of 45°) weighted by the neuron’s mean spike count over the delay period (3 s) following each cue presentation.
Cross-correlations
Dataset.
For the estimation of functional connectivity we estimated cross-correlations by computing the jittered cross-covariances66 of spike counts from simultaneously recorded neuron pairs, whose preferred locations were separated by a maximum of 60° (n=67). We included pairs of neurons recorded from the same electrode (n=21) and pairs recorded from different electrodes (n=46), and we confirmed that the results held when analyzing only pairs from different electrodes (Fig. 3c, exc p=0.01, n=20; inh p=0.04, n=13, one-sided permutation test). For each pair we selected those trials where the presented cue fell within the preferred range (pref, within 40° from either preferred locations) or outside the preferred range (anti-pref, all the other trials). We discarded those trials without at least 1 spike for each neuron in the pair.
Jittered cross-covariance.
We used the Python function scipy.signal.correlate to compute cross-covariances between spike trains of simultaneously recorded pairs. Spikes were counted in independent windows of 10 ms38,67. For each trial, 1000 jittered cross-covariances were computed as follows66. We shuffled the spike counts within non-overlapping windows of 50ms and computed cross-covariance for each of these jittered spike counts. This captured all the cross-covariance caused by slow dynamics (> 50ms) but destroyed any faster dynamics. Finally, we removed the mean of these jittered cross-covariances from each trial’s cross-covariance, ending up with correlations due to faster dynamics (≤ 50ms). We considered the magnitude of the central peak of the cross-covariance in our analyses by averaging 3 bins (±1 bin from the zero-lag bin). For the time resolved cross-correlation function (Fig. 3c,d), we repeated this process for sliding windows of 1 s and steps of 50ms, and averaged across trials and neuronal pairs.
Putative excitatory and inhibitory interaction.
Because changes in connectivity strength (our hypothesis for activity-silent mechanisms) affect inversely excitatory peaks and inhibitory troughs of cross-correlations35, we analyzed separately these two types of interactions. Similarly to ref.36,37, based on the average central peak of the cross-correlation function in the whole trial [−4.5 s, 2.5 s], we classified each pair into 3 subgroups: 1) those with positive peak for both preferred and anti-preferred trials were classified as putative excitatory interactions (exc), 2) those with negative peak for both preferred and anti-preferred trials were classified as putative inhibitory interactions (inh) and 3) we discarded those with inconsistent peak sign between pref and anti-pref trials. In total, we analysed the cross-correlation time course of n=47 pairs of neurons (n=27 exc and n=20 inh; from different electrodes n=20 exc and n=13 inh).
Delay rate vs ITI cross-correlation analyses.
In Fig. 3e we sought evidence for an interplay between attractor and subthreshold network dynamics in PFC. To this end, we computed the trial-by-trial correlation between the cross-covariance peak (see above) in the ITI —at a time point when there was no firing rate tuning (activity-silent period, Fig. 3d)— and the mean firing rate of the two neurons at the end of the preceding delay period (last 2s, delay-fr, Fig. 3e), for exc interaction pairs under the pref and anti-pref condition (see above). For each pair, we obtained demeaned values for each trial by subtracting the mean firing rate and mean cross-covariance peak across all trials, respectively. This allowed us to compute the correlation based on trial-by-trial measurements of all pairs together (n=27), in order to increase statistical power. Error bars were computed then based on a bootstrap approach on all trials for all pairs. A local activity-dependent subthreshold mechanism for ITI memory traces predicts that for pref trials, but not for anti-pref trials, firing rate variations in the delay period determines the degree of latent variable loading (cross-covariance peak) in the ITI (Fig. 3e).
Simulating bump reactivation
We used a previously proposed computational model40,68,69 to study serial dependence between two consecutive trials. The model consists of a network of interconnected 2048 excitatory and 512 inhibitory leaky integrate-and-fire neurons70. This network was organized according to a ring structure: excitatory and inhibitory neurons were spatially distributed on a ring so that nearby neurons encoded nearby spatial locations. All connections were all-to-all and spatially tuned, so that nearby neurons with similar preferred directions had stronger than average connections, while distant neurons had weaker connections. Inhibitory-to-inhibitory connections were untuned. Network parameters were taken from (Compte et al. 2000) except for:
Short-term plasticity.
Simulation of “activity-silent” mechanisms during the inter-trial period, was done by adding two more variables x and u, as described in refs.9,71, to excitatory presynaptic neurons:
With tsp marking all spike times and δ(t) being the Dirac delta function. We used parameters U = 0.2, τx = 200 ms, τu = 1500 ms. The effective conductance of each excitatory synapse was then g · u · x, with g being the corresponding maximum conductance parameter (see above). These short-term plasticity dynamics affected only AMPAR-mediated recurrent connections in the network. In a separate set of network simulations (not shown), we also included STP in inhibitory connections in the network (same parameters as indicated above) and we found that we could obtain a similar pattern of serial bias modulations as shown in Fig. 4d. This shows that our results are not specifically dependent on whether inhibitory connections present facilitation dynamics or not.
Stimulation and behavioral readout.
External stimuli were fed into the circuit as weak inputs (0.25 nA) to neurons selective to the stimulus as described in Compte et al. (2000). Each simulation of our computational model consisted in two trials run in sequence: a first stimulus of duration 250 ms, a first delay period of 1000 ms, a network resetting input (nonspecific current −0.261 nA, duration 300 ms), an intertrial interval of duration 1300 ms, a second stimulus (250ms) and a second delay period of 1000 ms. The first and second cue stimuli were independently drawn randomly from 360 uniformly distributed angular values, and only the network readout of the second trial was analyzed to obtain a “behavioral readout”. The readout was obtained with a “bump tracking” procedure: starting at cue presentation the instantaneous network readout was derived as the angular direction of the population vector of single-neuron firing rates (computed in windows of 250 ms, sliding by 100 ms) considering the ±100 neurons surrounding the readout estimated in the previous time step. The instantaneous readout was iteratively derived to track the center of the bump (and ignoring possible elevated activity extending from the fixation period) and the final behavioural output was defined as the readout in the last 250 ms of the trial. Serial bias was calculated by measuring single-trial errors (behavioral readout minus target location) in relation to previous-current distance of stimulus cue values, as described above for experimental data.
Consecutive trials and bump reactivation.
Reactivation of previous trial stimulus during the reactivation period (300 ms before the second stimulus onset) was accomplished stimulating all excitatory neurons with a non-specific external stimulus9,39. This stimulus increased exponentially with a rate α = 10 s−1 as , with β being the reactivation strength and t0 the time of onset of the stimulus. Reactivation strength was weak (β = 0.17 nA) or strong (β = 2.9 nA).
Rate and synaptic tuning.
For each simulation in Fig. 3a,b we computed the firing rate (r) and synaptic (s = u · x) tuning, by computing for both measures the difference between neurons within (± 50°) and outside (180° ± 50°) the previous bump location.
Extended Data
Extended Data Fig. 1. Consistent decoding accuracy in delay and reactivation links these two representations at the neural ensemble level.
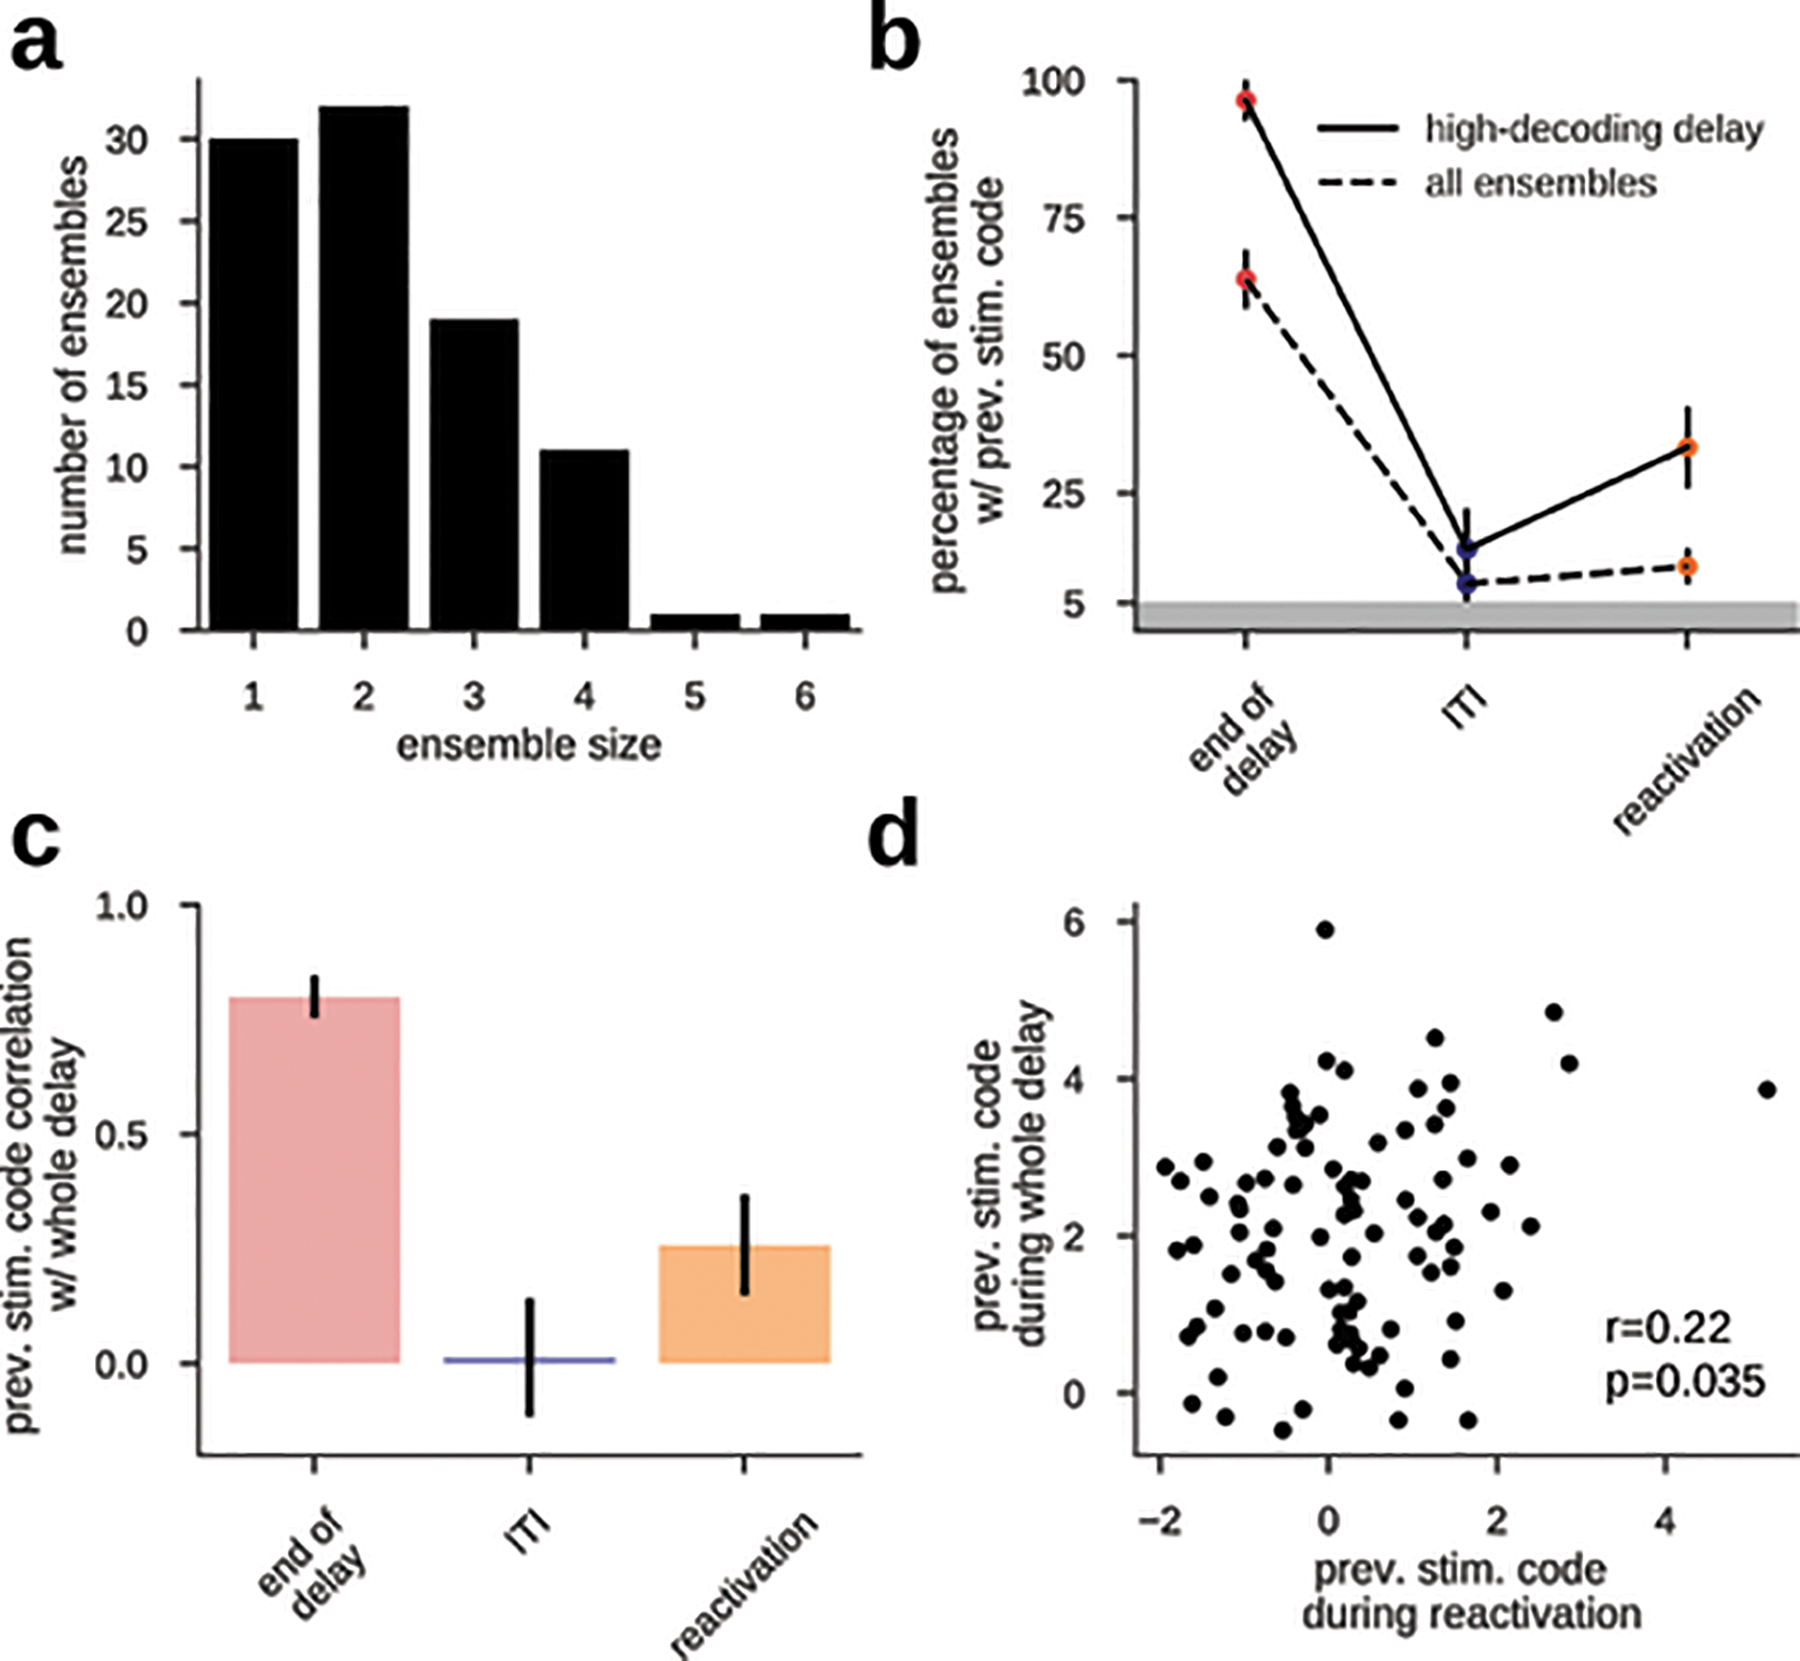
a) The size of n=94 independent ensembles of simultaneously recorded neurons varies between 1–6. b) Fraction of neural ensembles with significant previous stimulus decoding accuracy (z > 1.96, see Methods) computed for all ensembles (dashed line) and only for those ensembles with highest previous stimulus code averaged across the whole delay (see Methods). The incidence of stimulus decoding was significant in delay and reactivation, but not at ITI (two-sided binomial test at p=0.05, with n=94 and n=27 ensembles, for ‘all ensembles’ and ‘highest delay code’, respectively). Error bars are bootstrapped ±s.e.m. c) across-ensemble Pearson correlation between delay decoding accuracy (averaged in the whole delay) and decoding accuracy at different time points (two-sided p-values: 6.5e-30, 0.87, 0.035, n=94 ensembles). The ensembles with highest delay code also had higher decoding during reactivation, demonstrating the neural association between delay representations and reactivations despite absent code in the ITI. Error bars denote ±s.e.m. computed with a bootstrap procedure. d) Individual ensemble values from c, orange (pearson correlation, two-sided p=0.035, n=94 ensembles).
Extended Data Fig. 2. Noise correlation between pairs of neurons is negative at reactivation, as predicted by the attractor model.
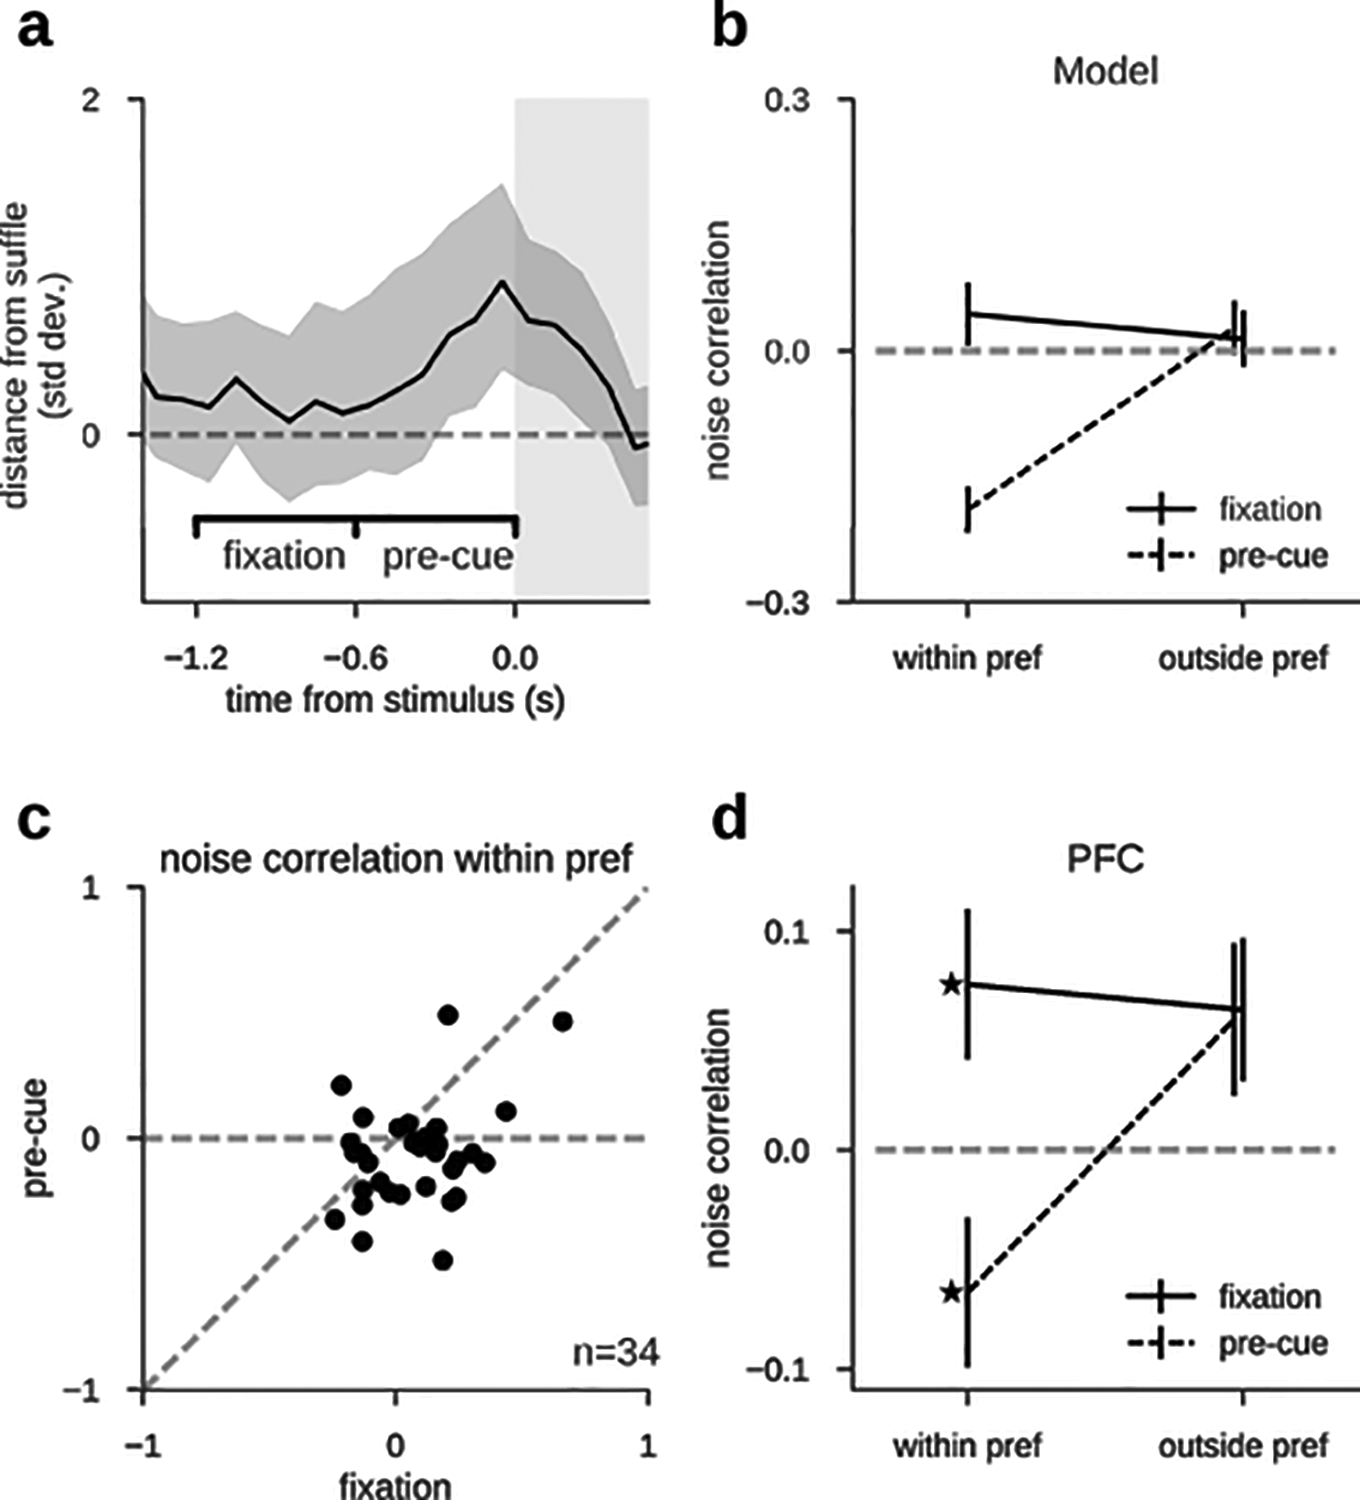
Bump-attractor dynamics are characterized by negative pairwise noise correlations for cues presented between two neurons’ preferred locations (within pref), but not for other cues (outside pref) 6. a) Periods used in noise correlation analyses: early (activity-silent), and late fixation (reactivation; n=94 ensembles, zoom-in of Fig. 1c). Error shading, bootstrapped 95% C.I. b) In the computational model (n=1000 independent simulations), bump reactivations from subthreshold traces are characterized by negative noise correlations only during reactivation for within-pref trials, following the nonspecific input drive (Fig. 4). c) Noise correlations of PFC pairs with dissimilar preferred angles (60° < Δθ < 120°, n=34 pairs) were lower in late than in early fixation for within-pref trials (bootstrap test, p=0.0001, n=34, Cohen’s d=0.61). d) On average, lower noise correlations occurred only during reactivation and in within-pref trials (ANOVA trial condition × time point, F(4)=2.5, p=0.06, n=34). For within-pref trials, noise correlations differed between early and late fixation (bootstrap test, p=0.0001, Cohen’s d=0.61, n=34), being negative in late (bootstrap test, p=0.035, Cohen’s d=−0.32, n=34), but positive in early fixation (bootstrap test, p=0.018, Cohen’s d=0.37, n=34). Correlations were positive in outside-pref trials both during late and early fixation (bootstrap test, p=0.024 and p=0.06, respectively), with no significant difference (two-sided bootstrap test, p=0.93, n=34). In addition, negative noise correlations diminished when using the previous saccade location rather than the previous stimulus as reference (paired bootstrap test, p=0.005, Cohen’s d=−0.47, n=34), suggesting that the bump diffused only during the delay period, but not after the saccade 6. Unless stated otherwise, all bootstrap tests were one-tailed in the direction of the model predictions in b. All error bars indicate ±s.e.m.
Extended Data Fig. 3. Stimulus selectivity in both cross-correlation peaks and firing rates during the delay period prevents the isolation of activity-based and activity-silent processes.
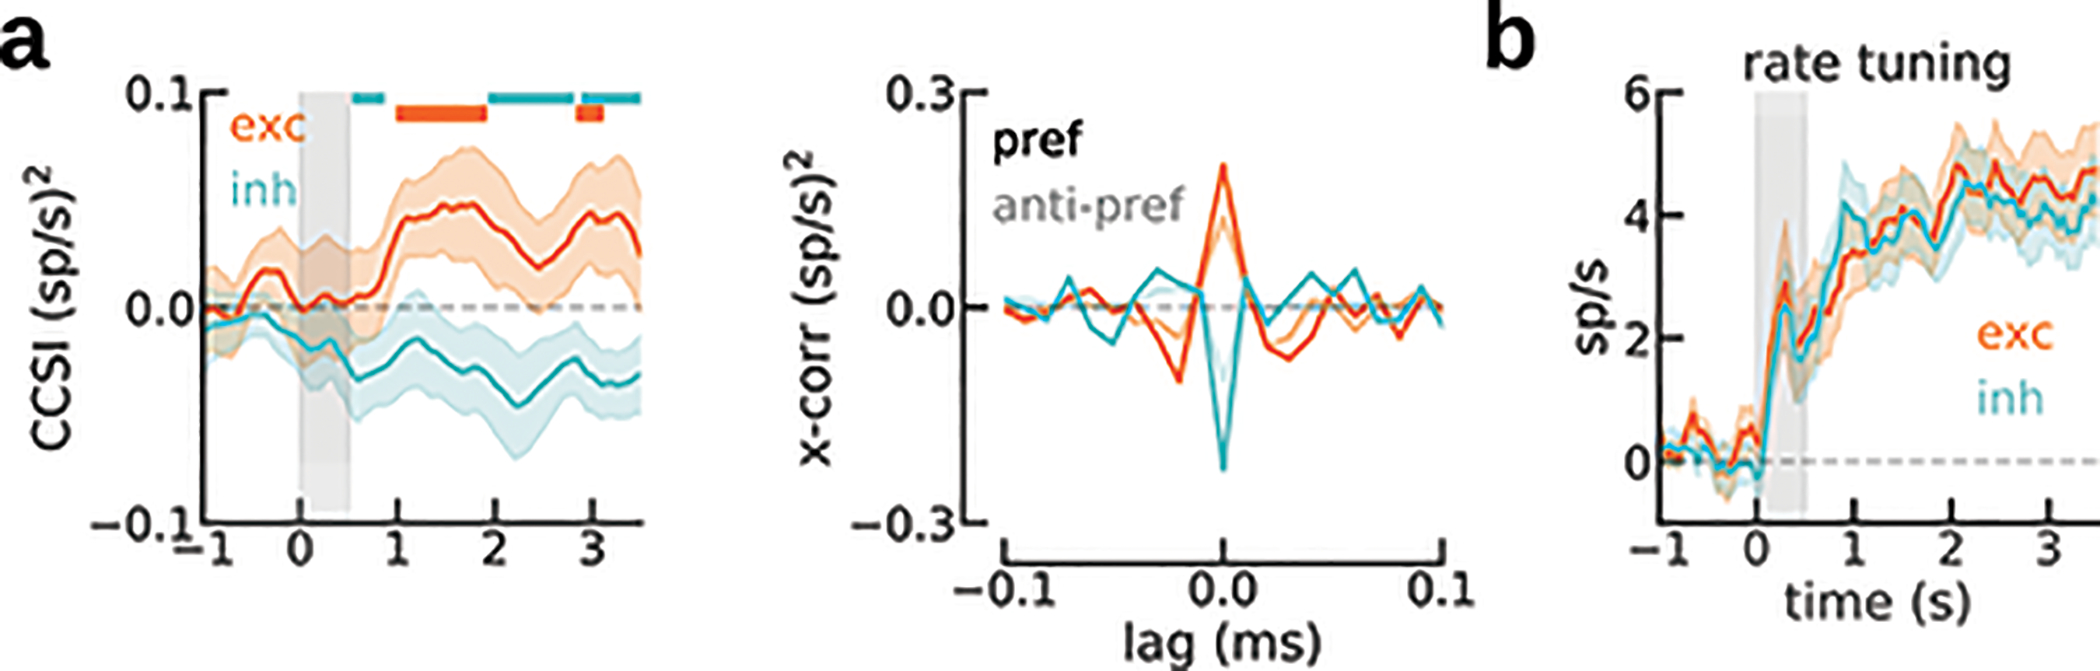
Same analysis as in Fig. 3, but performed during the current delay period (instead of ITI, Fig. 3) and selecting pref and anti-pref trials based on current stimulus (instead of previous, Fig. 3). Note that these are different trials (no need to be consecutive), so exc (n=33 pairs) and inh (n=21 pairs) might differ from Fig. 3. a) Left, cross-correlation peak selectivity emerged and was sustained in the delay period (left, CCSI as in Fig. 3, computed in centered 500-ms windows sliding in steps of 50 ms) and consisted in enhanced central peaks (troughs) for exc (inh) following a preferred stimulus. Color bars mark the periods where the average CCSI is different from 0 (bootstraped 95% C.I.) Right, cross-correlation averaged over 0.5–3.5 s. Zero-lag correlation for pref and anti-pref are different in exc (p=0.03, n=33, two-sided paired bootstrap test) and inh (p=0.01, n=21, two-sided bootstrap test) conditions. b) Firing rate selectivity (pref - anti-pref) also emerges robustly in the delay period for neurons in exc and inh pairs. The selectivity in cross-correlation peaks (CCSI) can therefore be confounded with firing rate selectivity72 when analyzing data in the delay period. This prevents the unambiguous identification of activity-silent mechanisms in this task period. Our approach of analyzing data in the inter-trial interval, when there is no firing rate selectivity (Fig. 3f), gets around this problem. Gray shading marks the stimulus presentation. In all panels, error-bar shadings indicate ±s.e.m.
Extended Data Fig. 4. In a dataset with unpredictable stimulus-onset time, previous item representations were not reactivated in the pre-stimulus period.
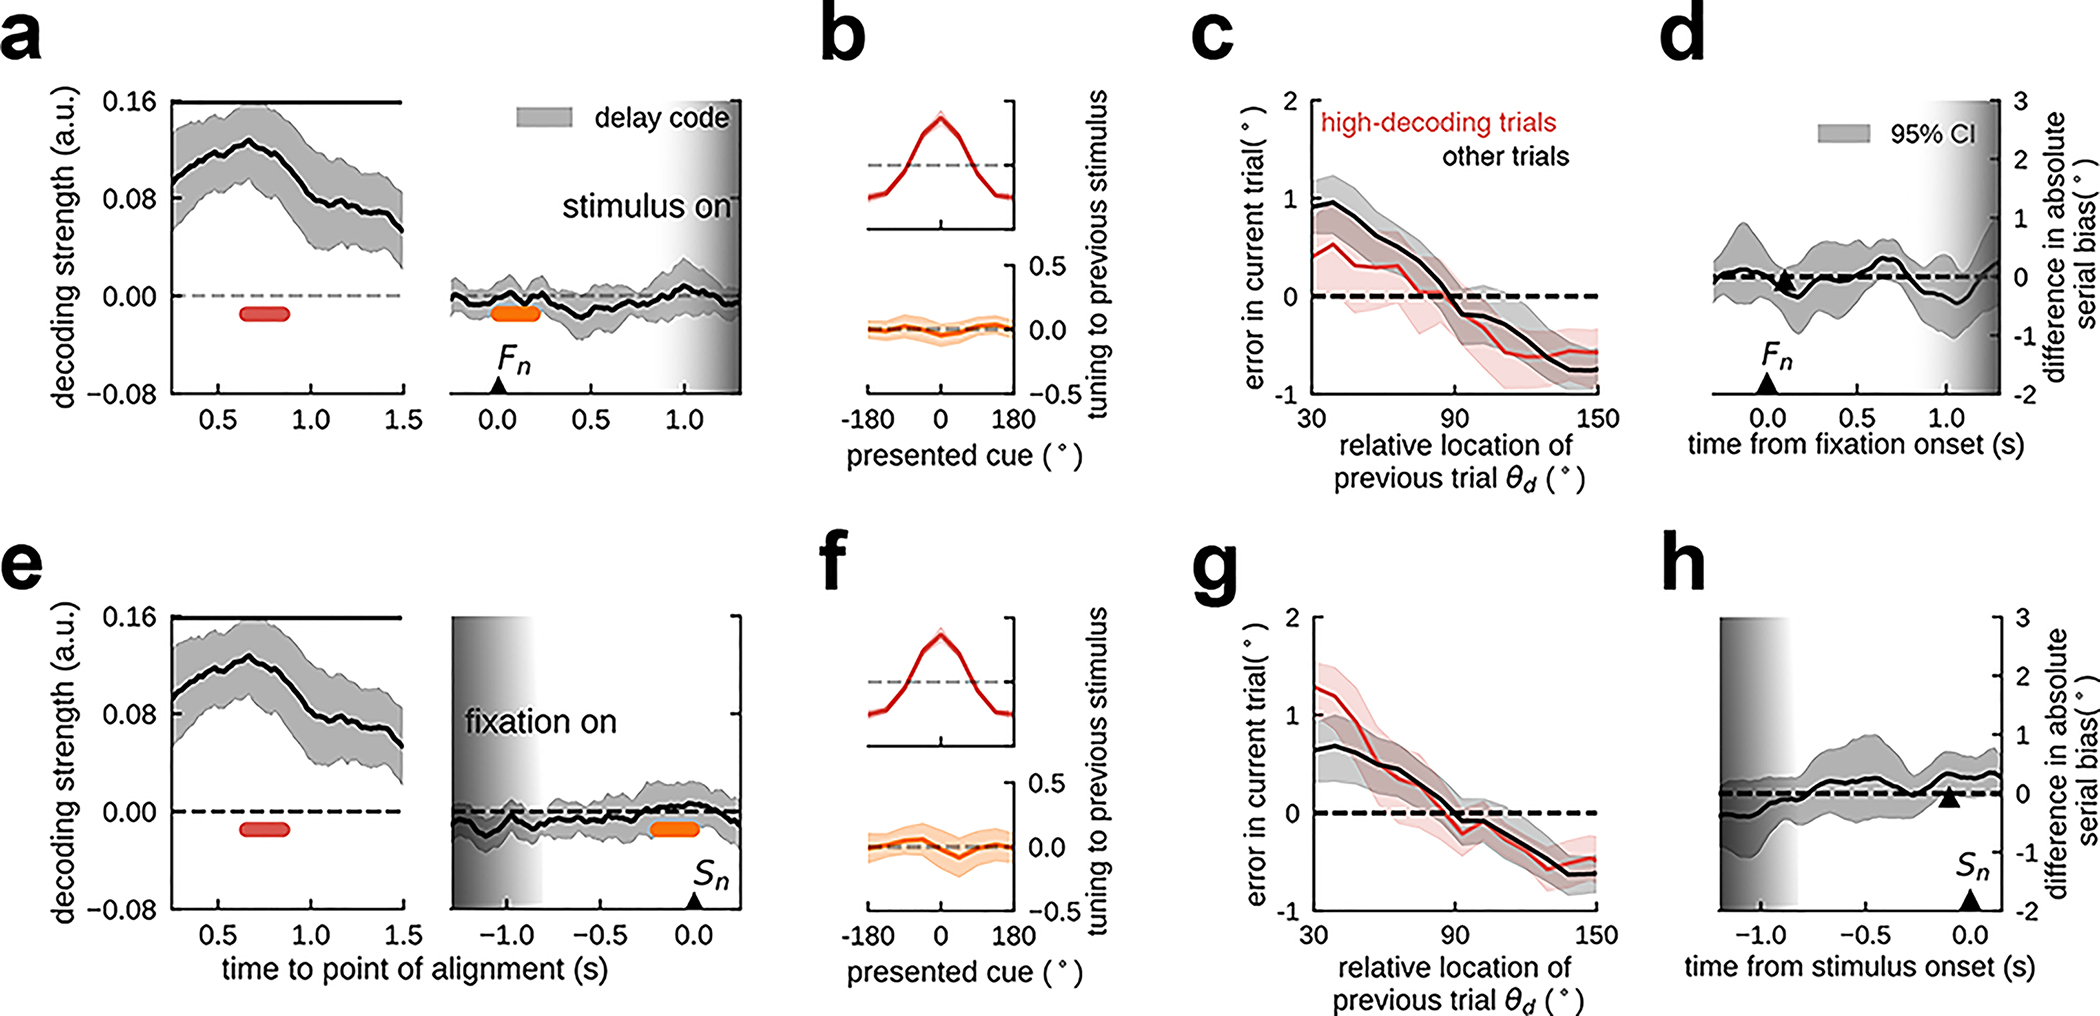
We conducted the same analysis as in human EEG (Fig. 2) in a previously published dataset (n=15 independent subjects for all panels; for experimental details, please refer to the original publication, ref. 34) with unpredictable fixation period durations (range 0.7 s-1.3 s). Decoding analyses were applied separately for data aligned to the onset of fixation (Fn, graded shading indicates range of possible stimulus onset times, upper panels) and aligned to the onset of the stimulus (Sn, graded shading indicates possible fixation onset times, lower panels). a) Tuning to previous-trial location (decoder trained in delay, 0.5s - 1.0s after stimulus onset) during previous-trial delay (left, stimulus aligned) vanishes in current-trial fixation (right, fixation onset aligned). No reactivation occurs. b) Average tuning reconstruction at different epochs for the delay decoder, indicated in a). c) Serial dependence separating trials with high (red curve, top quartile) from all other trials’ (black curve) decoding accuracy in early fixation (orange in a). Unlike in an experiment with predictable stimulus onset (Fig. 5), serial bias did not differ as a function of decoding strength. d) Difference in serial biases (Methods) between high-decoding and other trials were not significant at any time point in fixation. The black triangle marks the center of 0.2 s decoding window for the split in c. e-h) Parallel results were obtained when the analyses of panels a-d were run on data aligned to the time of stimulus onset instead of fixation onset. In d and h, time courses were smoothed using a squared filter of 5 samples. Periods with significant decoding in a,e are marked with black horizontal bars, indicating p<.001 in a two-sided bootstrap test. Shading indicates 95% C.I. in a,d,e,h, and ±s.e.m. in b,c,f,g.
Extended Data Fig. 5. Structured inhibition is necessary for repulsive serial biases at far distances.
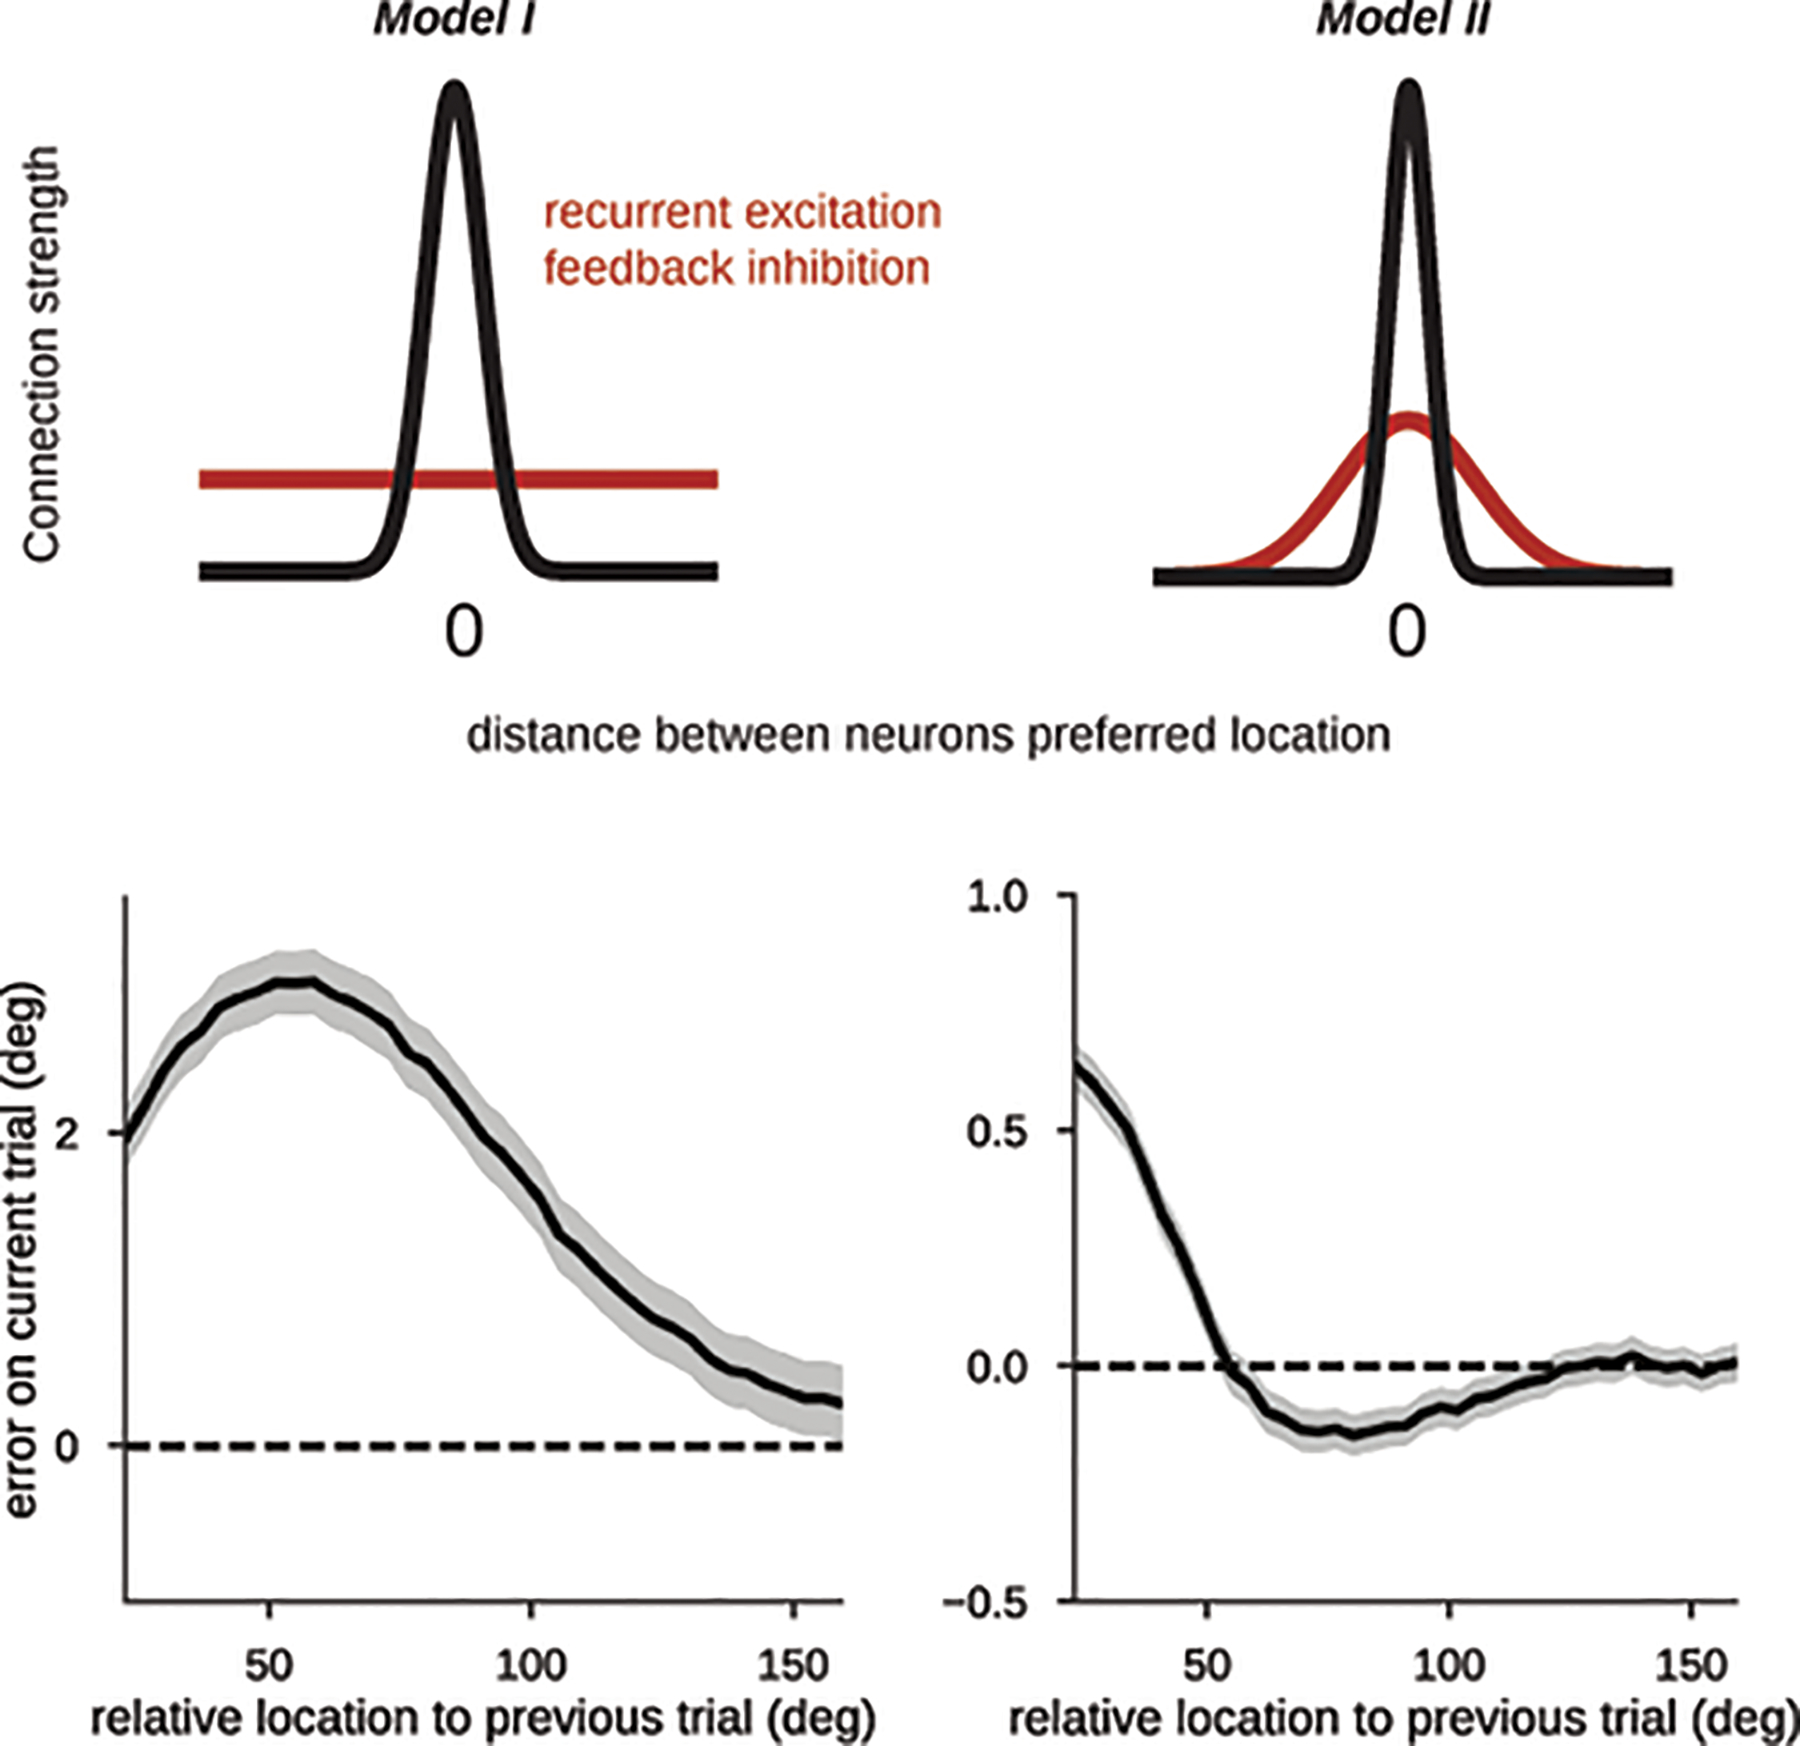
Top panel, illustration of two different models that have different inhibitory connectivity profiles. On the left, inhibitory connectivity strength from inhibitory to excitatory neurons is similar for all distances between their preferred locations. On the right, inhibition is structured such that similarly tuned neurons have stronger feedback inhibition. This shows that repulsive biases are caused by repulsive interactions between simultaneously active bumps in the network40,41, and are absent when there is no reignited bump that recruits localized inhibition at the flanks of the pre-cue bump of activity.
Extended Data Fig. 6. Serial bias split between high-decoding and other trials (Fig. 5) is robust to the choice of different percentiles.
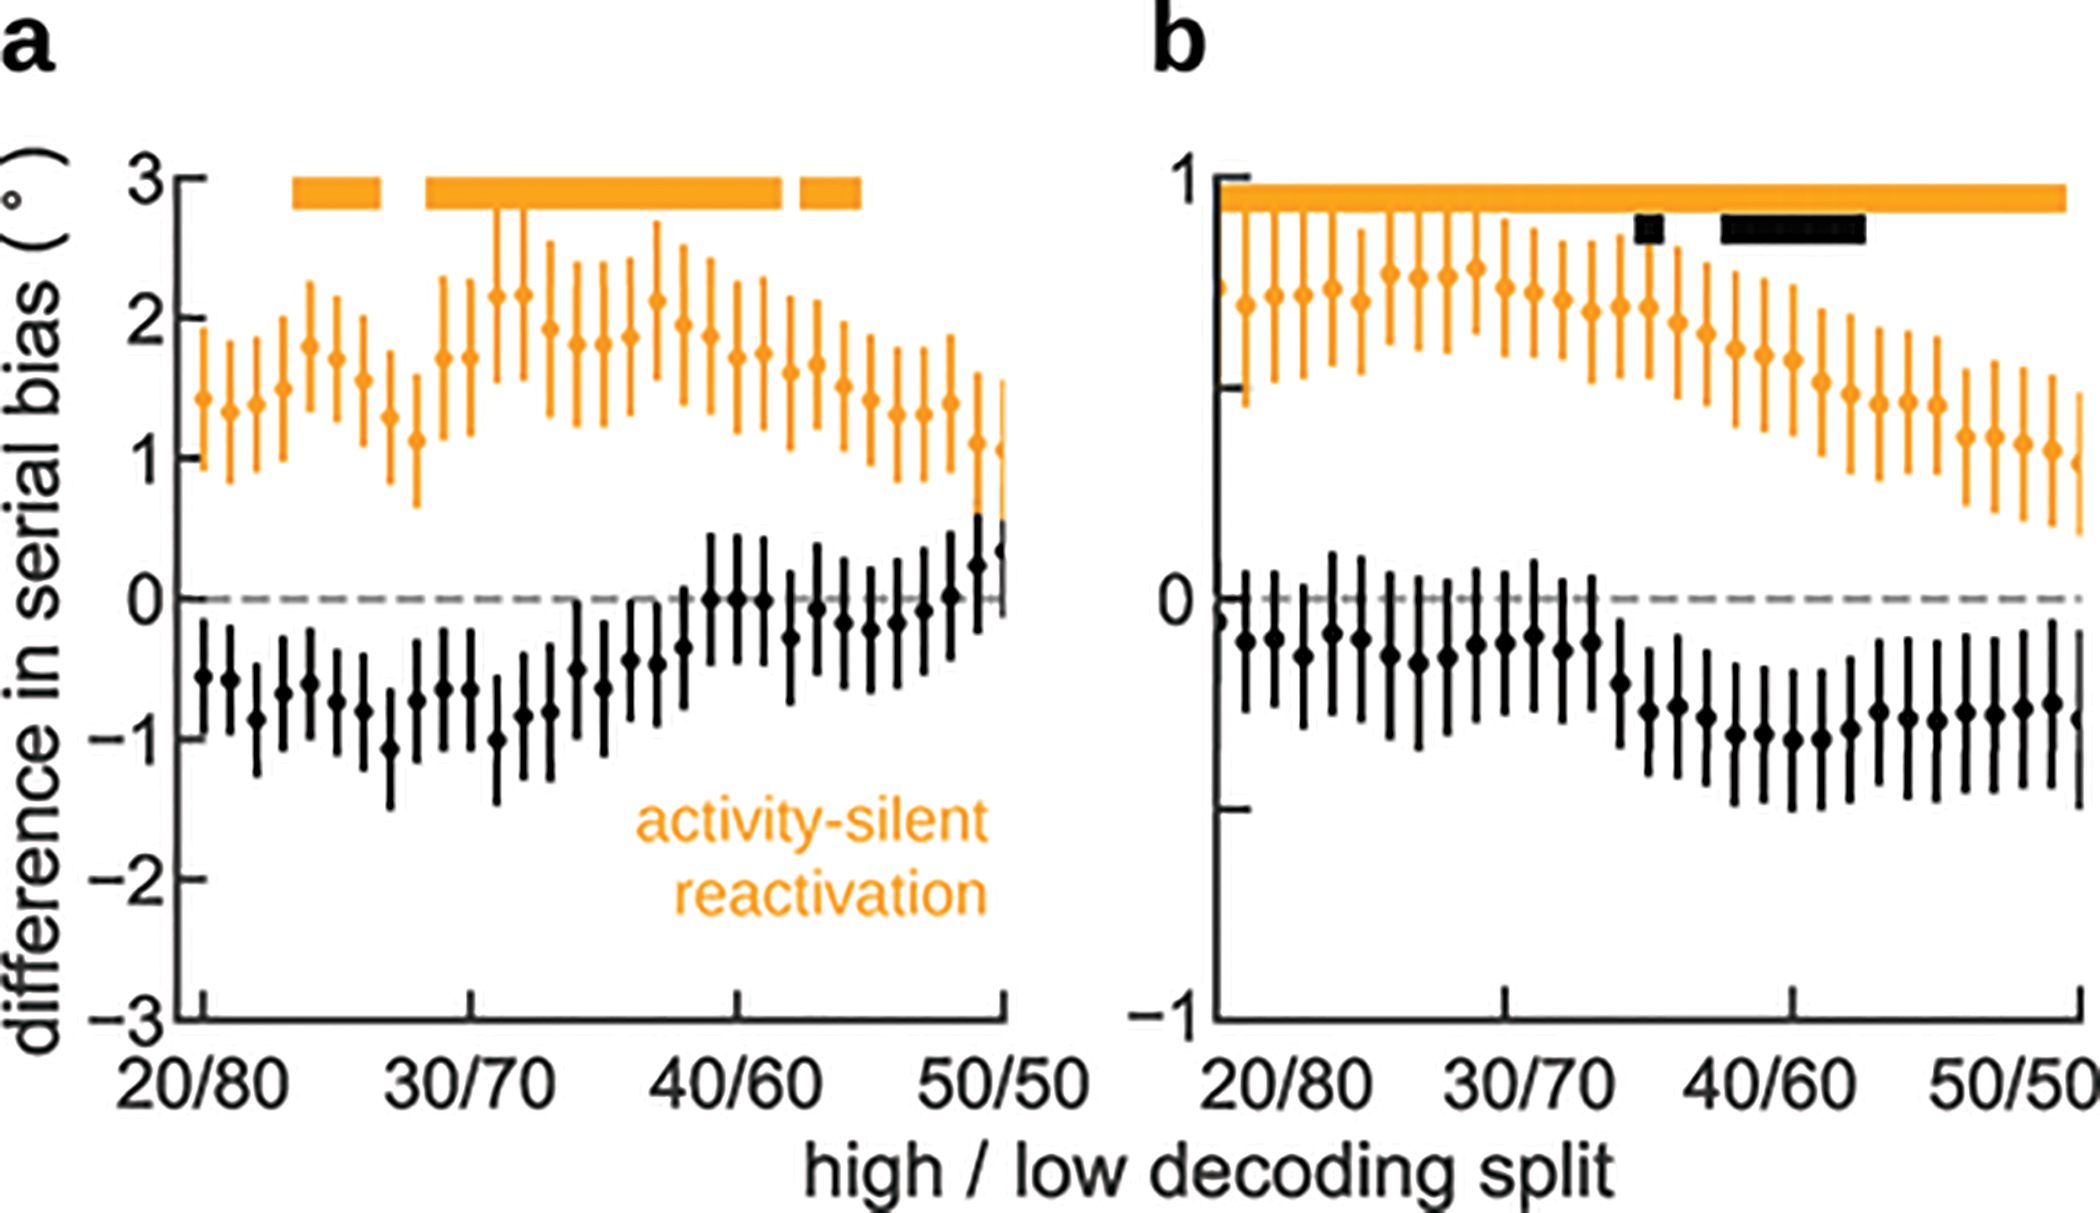
a) In monkey behavior b) In human behavior. X-axis indicates quantiles used for the split in high- and low-decoding trials (Fig. 5), from a total of n=1362 trials in a, and a range of [792, 908] trials per subject in b. Error bars are ±s.e.m. (over n=1362 trials in a, and over n=15 subjects in b) and colored bars mark where corresponding difference in serial biases is different than zero (p<0.05, two-sided bootstrap test).
Extended Data Fig. 7. The effect on serial biases of targeting dlPFC with TMS diminishes in the course of the experimental session.
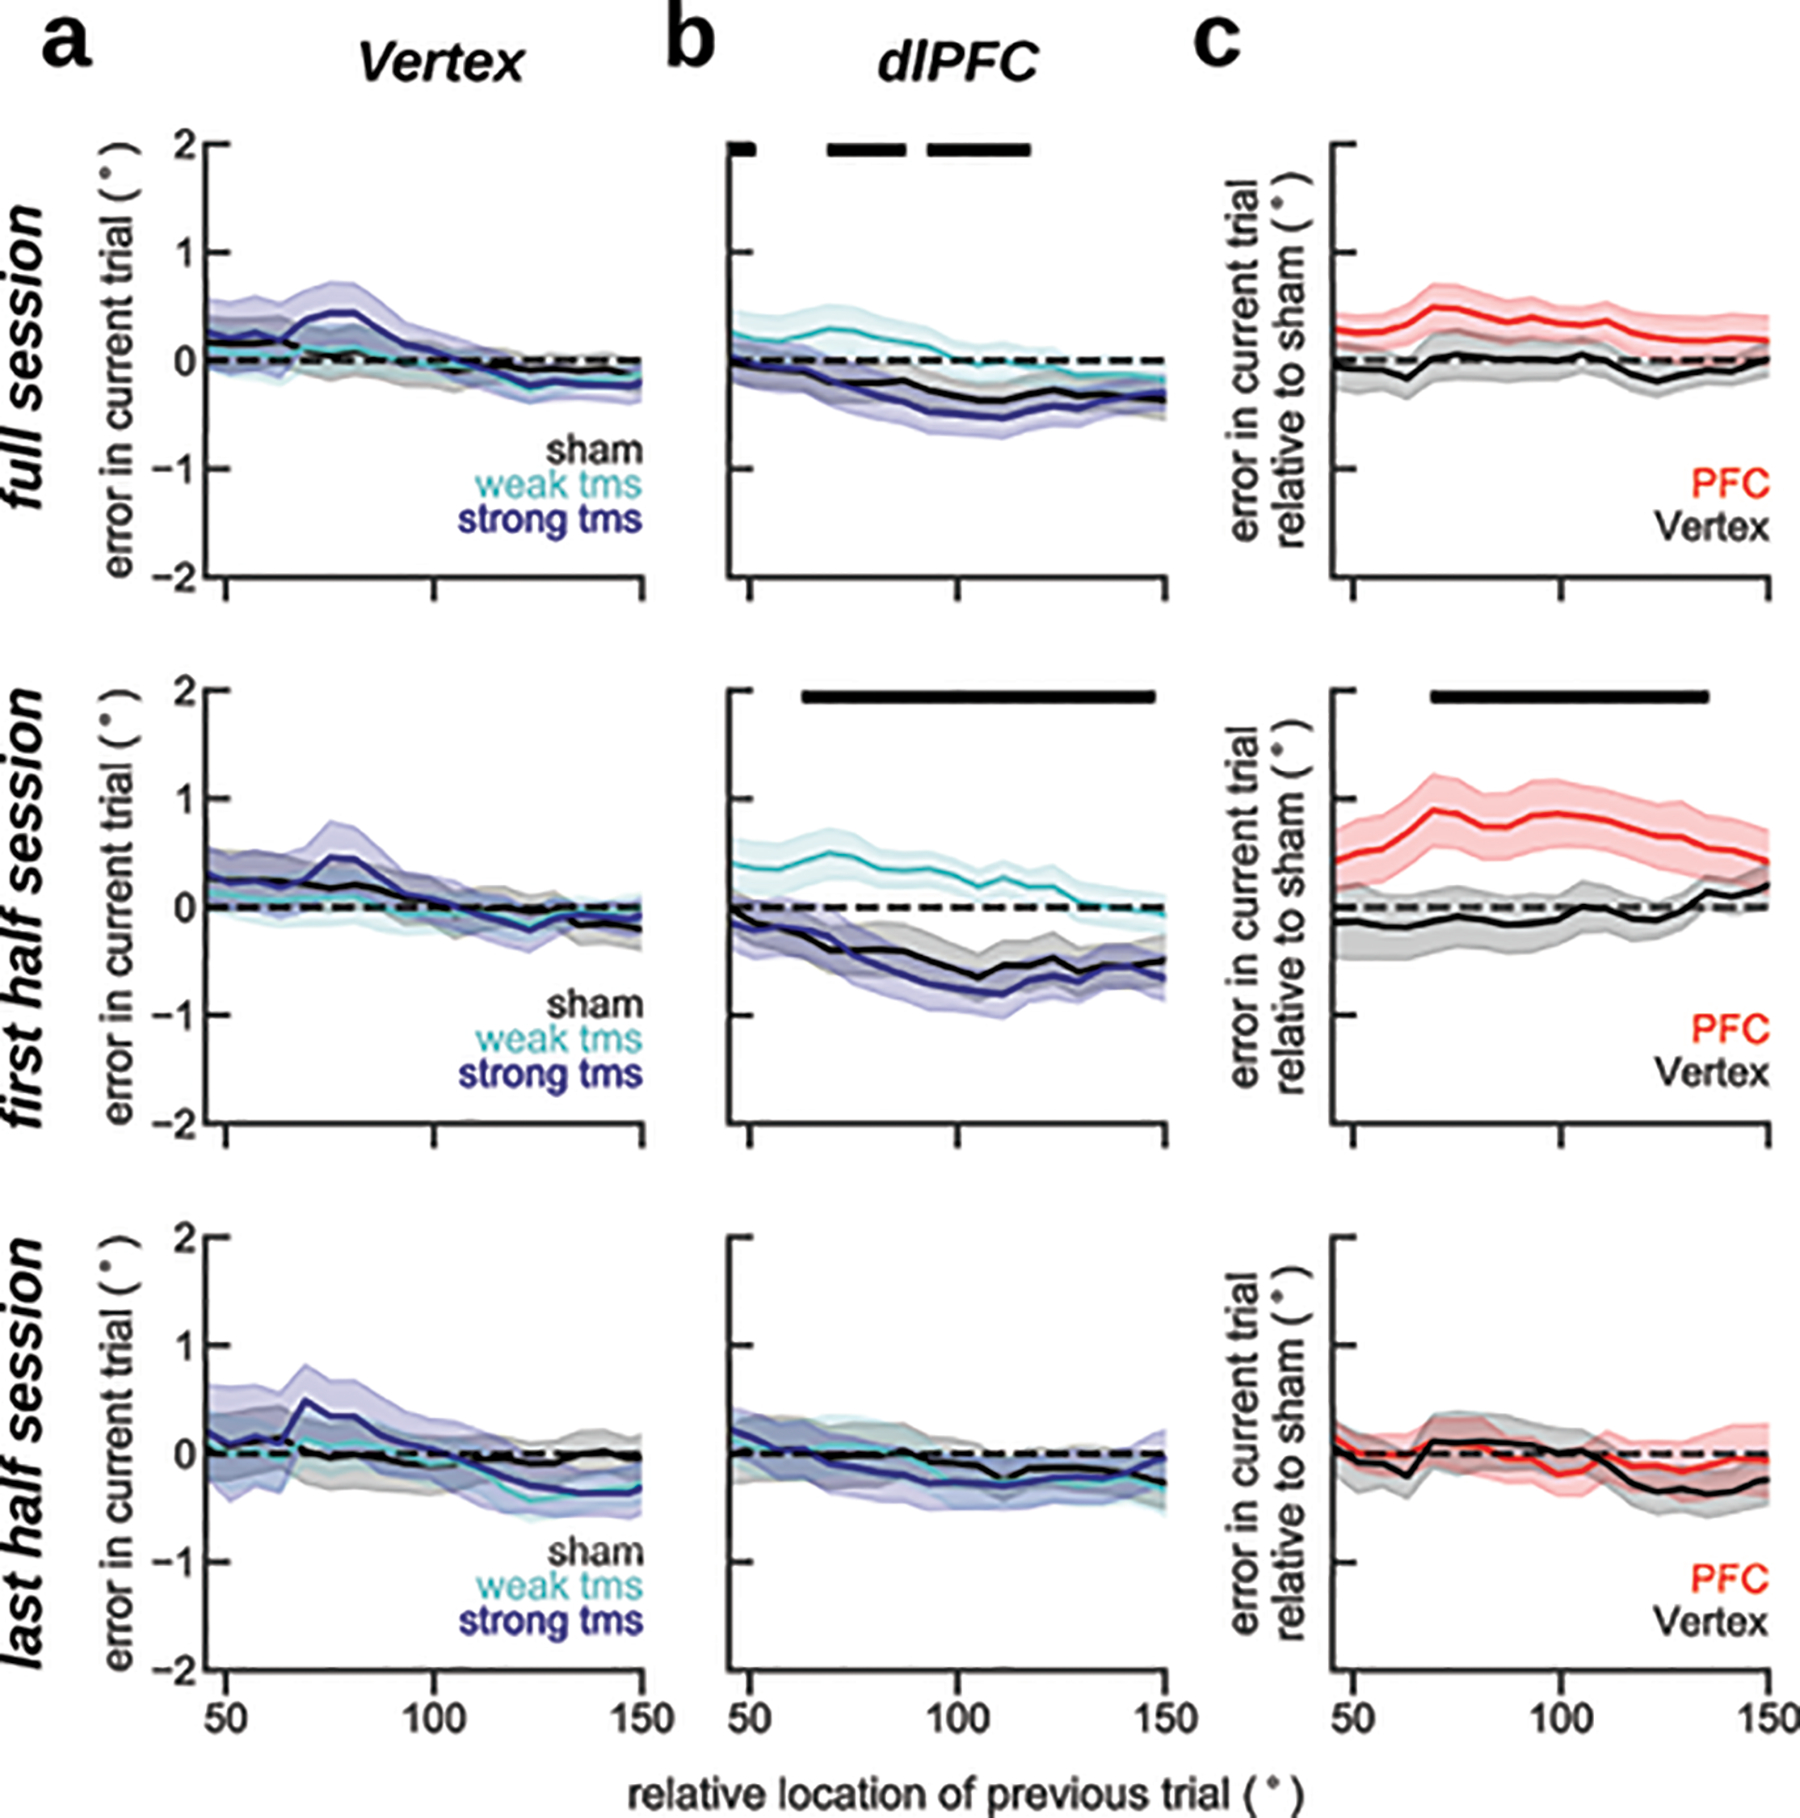
Serial bias plots averaged across n=20 independent subjects for trials with TMS applied in vertex (a) and PFC (b), and difference between serial biases computed for sham and weak-tms trials in vertex (black) and in PFC (red) blocks (c). Same analyses as in Figure 6, but (top) analyzing trials from the full session, (middle) first half session (225 trials, replication of Figure 6) and (bottom) last half session (225 trials). The behavioral impact of PFC TMS stimulation declined through the session, as if subjects desensitized (prev-curr ✕ TMS intensity ✕ session-half t11083=−2.38, p=0.017. Methods, Linear Mixed Models). Serial biases were modulated by TMS in PFC, but not in Vertex (prev-curr ✕ TMS intensity ✕ coil location, t18272=2.21, p=0.027. For dlPFC: prev-curr ✕ TMS intensity, t11087=2.13, p=0.032. For Vertex: t7166=0.03, p=0.97. Methods, Linear mixed models) when analyzing the full session, and analyzing only the first half session (t9133=2.51, p=0.011). x-axis coordinates mark the central value of windows (π/2rad, sliding by π/30 rad) used to calculate behavioral biases.
Extended Data Fig. 8. Consistent fixation-period single-pulse TMS effects on serial biases: first experiment.
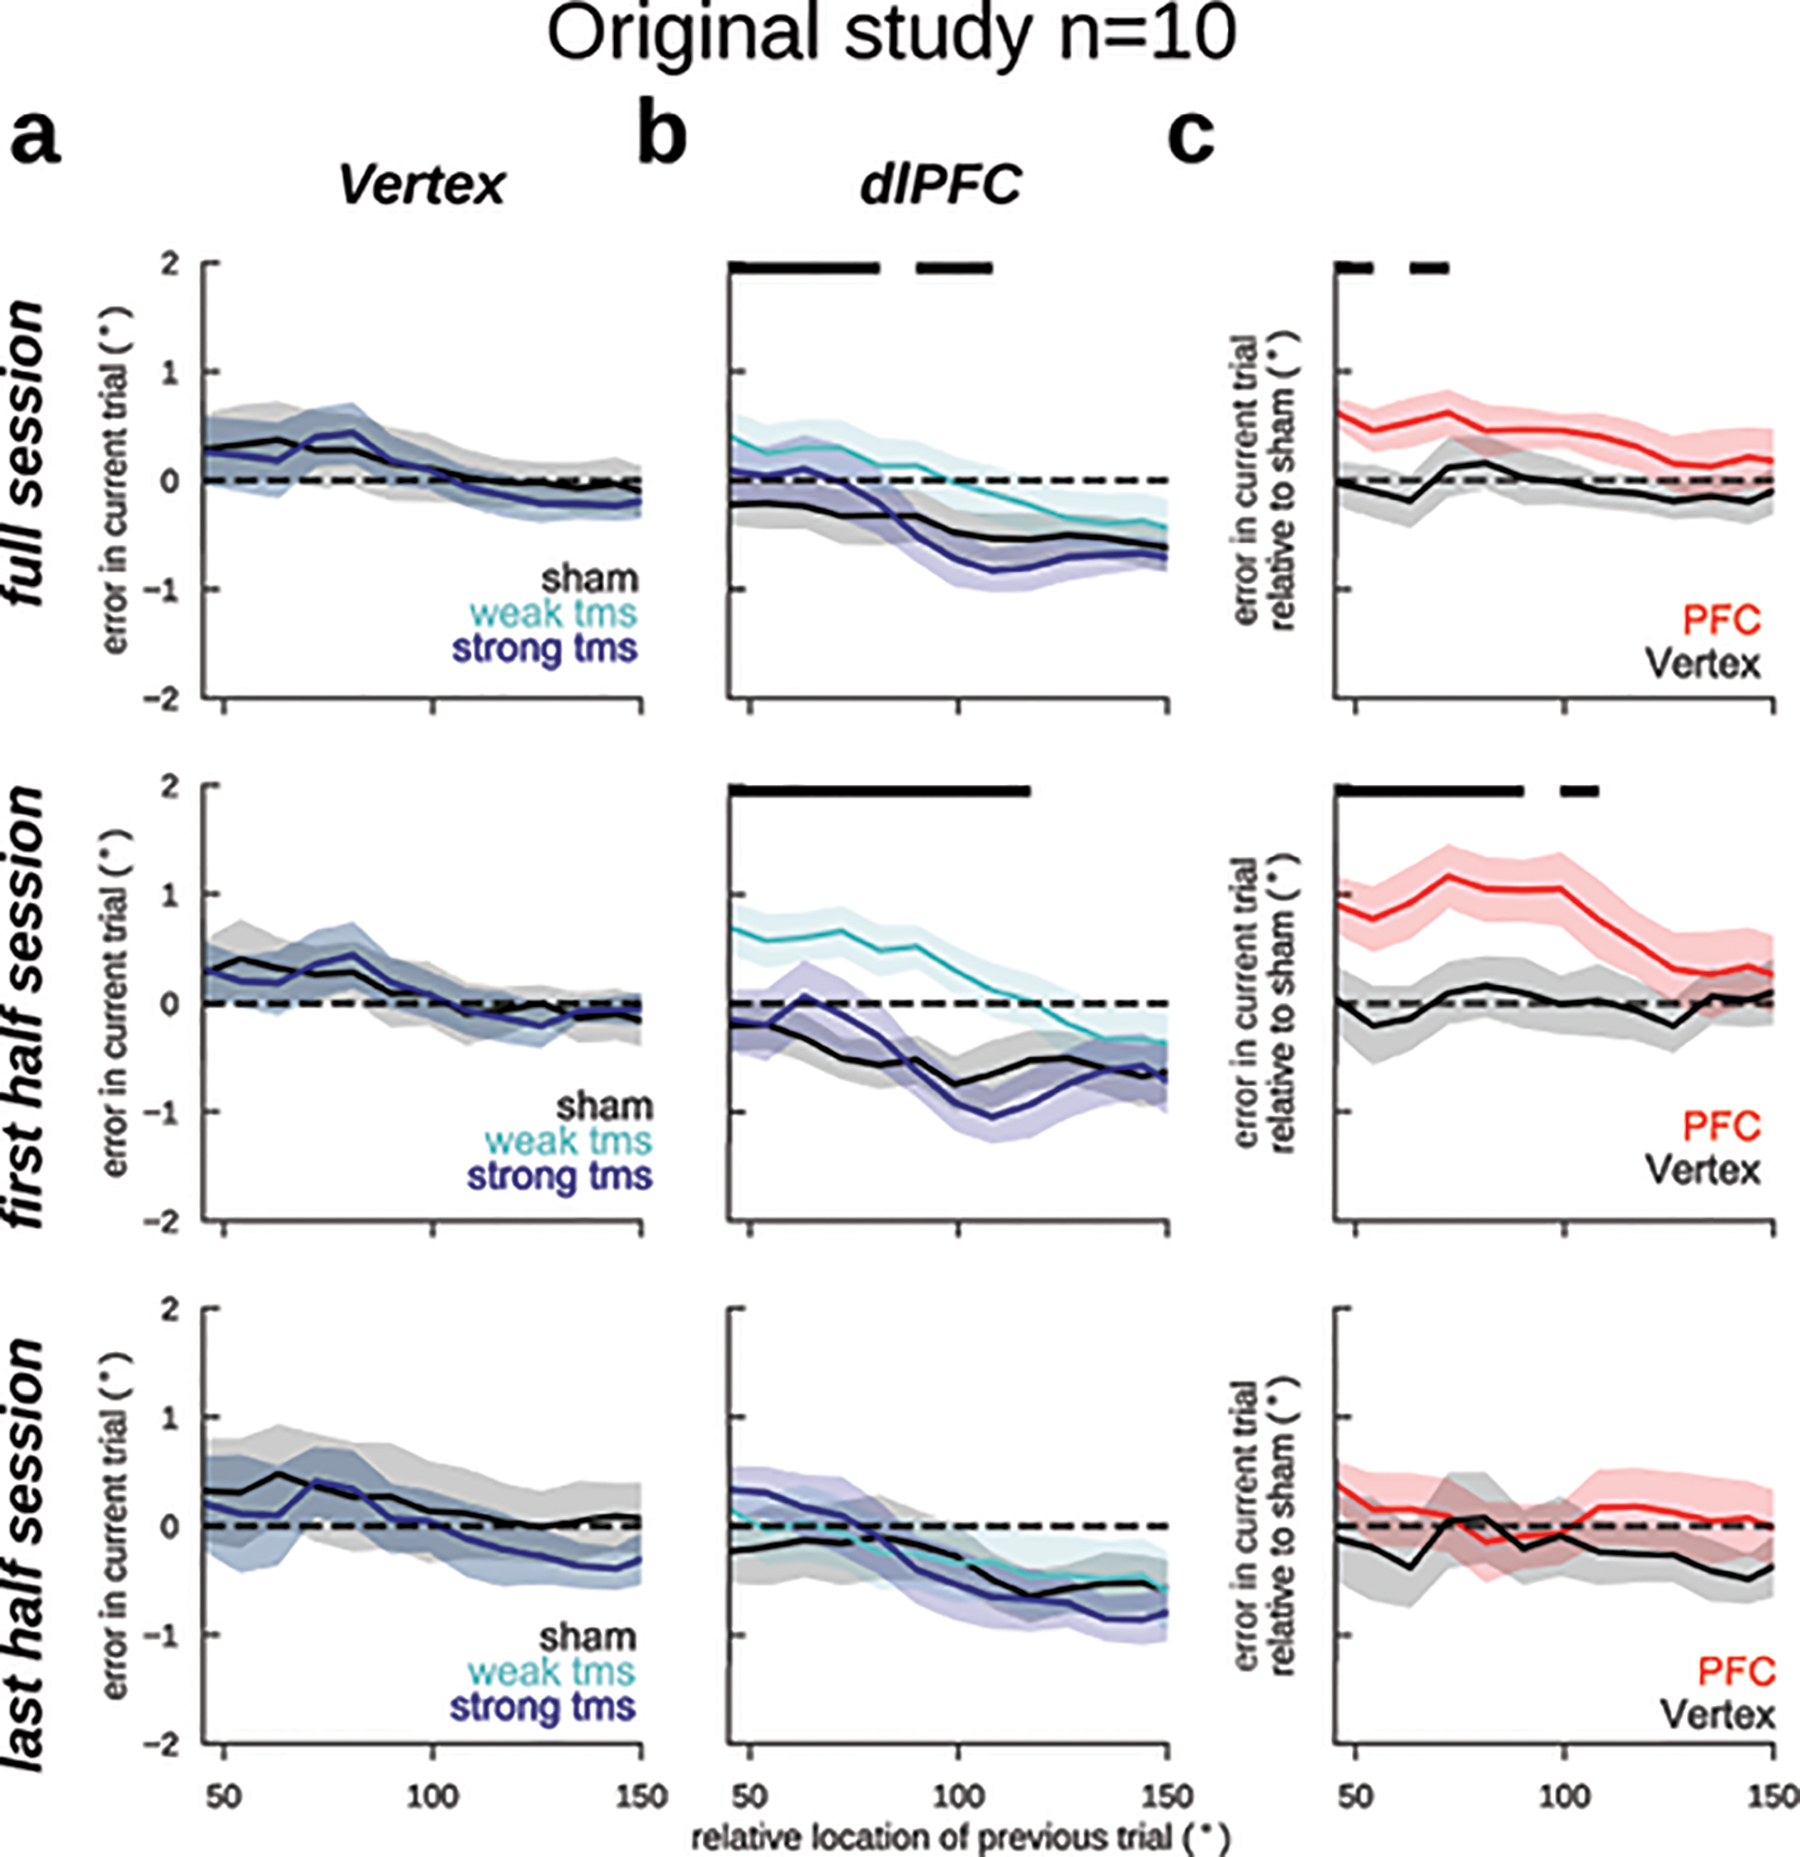
Serial bias plots averaged across n=20 independent subjects for trials with TMS applied in vertex (a) and PFC (b), and difference between serial biases computed for sham and weak-tms trials in vertex (black) and in PFC (red) blocks (c). Same as Extended Data Fig. 6, but only analyzing data from the original study (n=10 subjects). Similarly to when pooling both the original and replication studies together, the behavioral impact of PFC TMS stimulation declined throughout the session, however not significantly (prev-curr ✕ TMS intensity ✕ session-half t5701=−1.73, p=0.08. Methods, Linear Mixed Models). Serial biases were modulated by TMS in PFC, but not in Vertex (t5705=1.92, p=0.05) when analyzing the full session, and analyzing only the first half session (t3059=2.59, p=0.009, Methods). x-axis coordinates mark the central value of windows (π/2rad, sliding by π/30 rad) used to calculate behavioral biases.
Extended Data Fig. 9. Consistent fixation-period single-pulse TMS effects on serial biases: replication experiment.
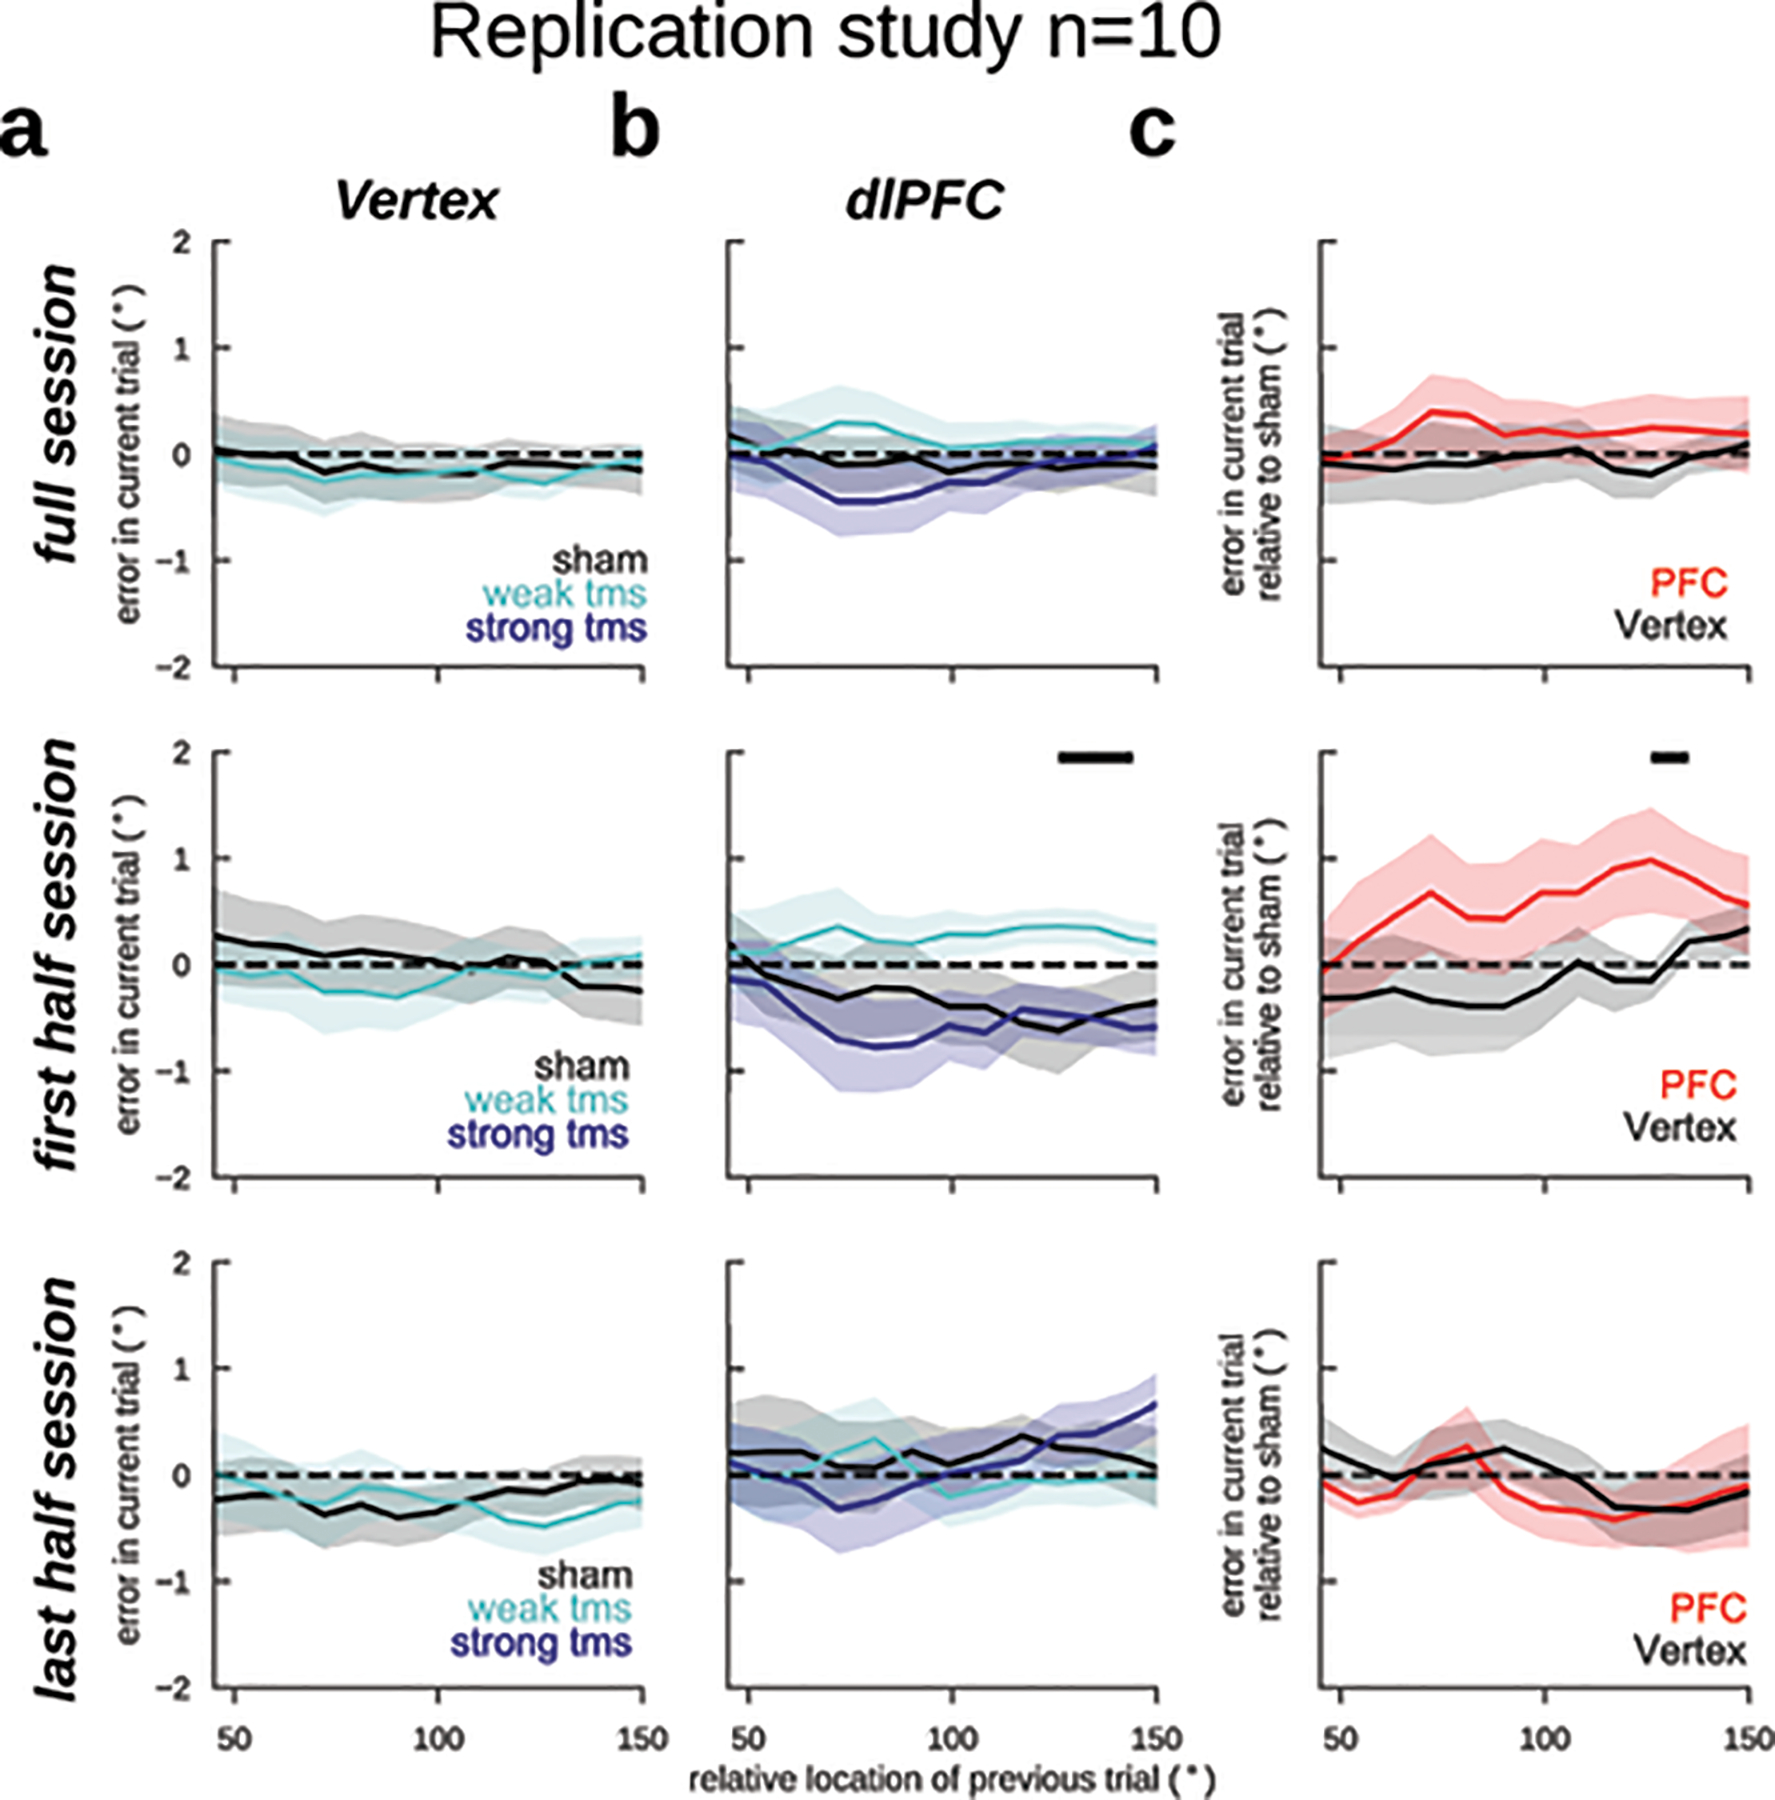
Serial bias plots averaged across n=20 independent subjects for trials with TMS applied in vertex (a) and PFC (b), and difference between serial biases computed for sham and weak-tms trials in vertex (black) and in PFC (red) blocks (c). Same as Extended Data Fig. 6 and 7, but only analyzing data from the pre-registered (https://osf.io/rguzn/) replication study (n=10 subjects). Similarly to the original experiment, the behavioral impact of PFC TMS stimulation declined throughout the session, however not significantly (prev-curr ✕ TMS intensity ✕ session-half t5375=−1.63, p=0.1. Methods, Linear Mixed Models). Similarly to the original study, serial biases were more strongly modulated by TMS in PFC than in Vertex, however not significantly (t5379=1.12, p=0.25) when analyzing the full session and the effect was stronger when analyzing only the first half-session (t2675=1.91, p=0.06, Methods). x-axis coordinates mark the central value of windows (π/2rad, sliding by π/30 rad) used to calculate behavioral biases.
Extended Data Fig. 10. A phenomenological model of our hypothesis on how long-term physiological effects of single TMS pulses affect serial bias curves in event-related experimental sessions.
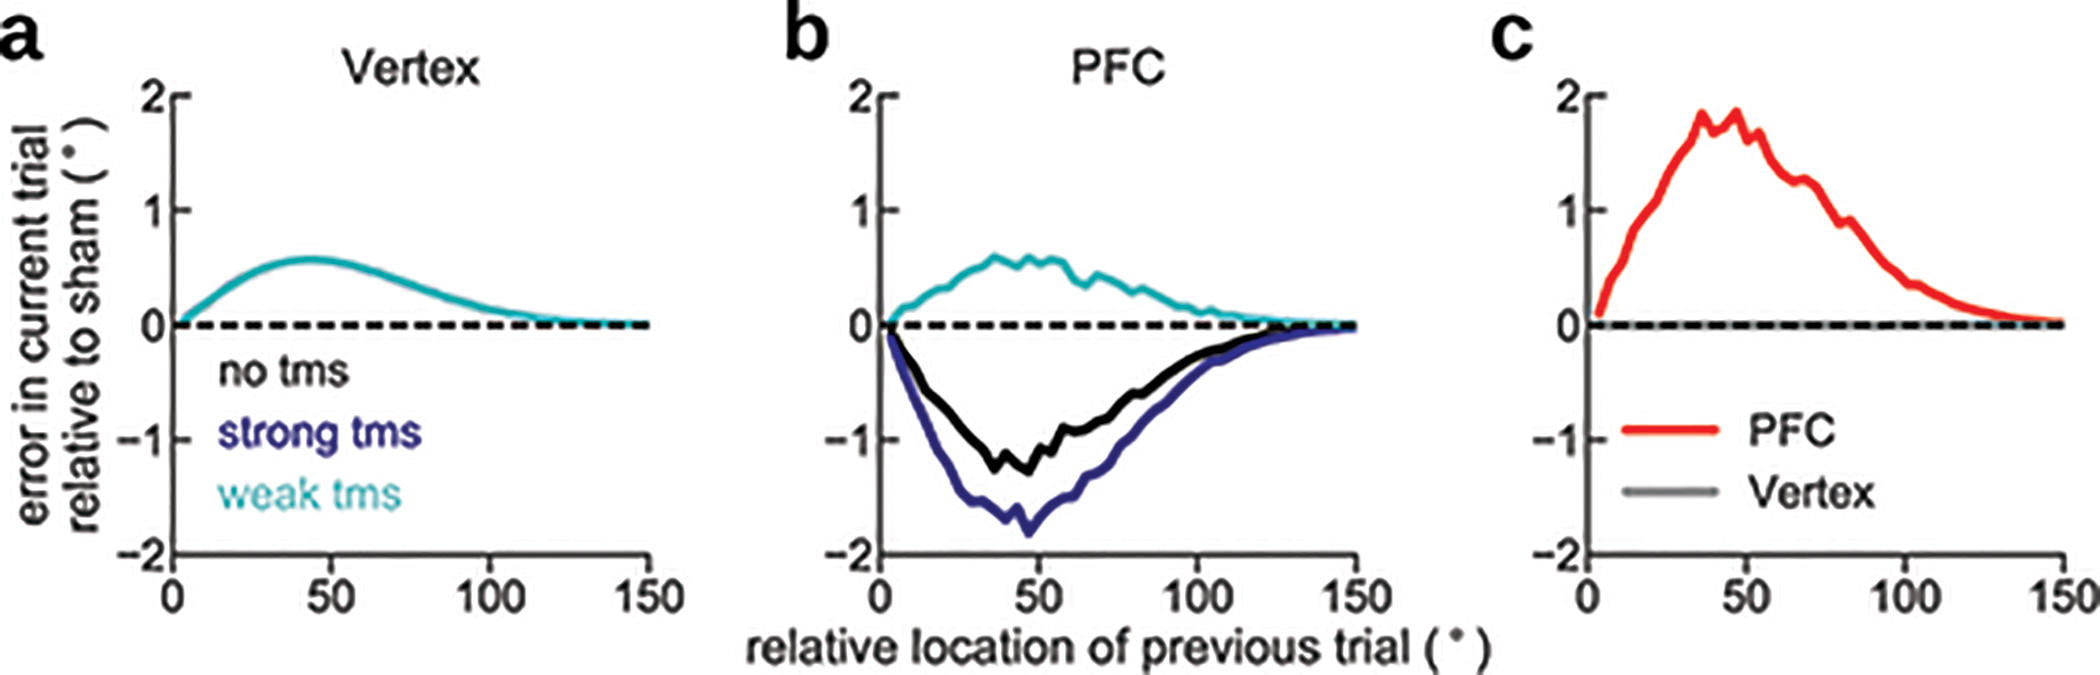
Our TMS results show a difference between the effects of sham stimulation at the vertex and sham stimulation over dlPFC (Fig. 6). We interpret this baseline difference as the possible effect of long-term physiological alterations by single pulses 58 (but see ref. 73) that carry over from “strong TMS” trials to “no TMS” trials. We explicitly implemented this interpretation in the following way: we generated trial-by-trial responses biased depending on the sequence of stimuli according to a given baseline serial bias curve (a, “Vertex” condition where TMS is ineffective). In the “PFC” condition the serial bias strength changed depending on TMS conditions: in “weak tms” trials the pulse had the acute effect of increasing the bias strength momentarily by an additive factor (3 times the baseline bias strength), in “strong tms” trials the effect of the pulse was chronic: the bias changed with a negative additive component (equal in magnitude to the baseline strength), which decayed slowly through subsequent trials (10% decay/trial). When collapsing together “responses” obtained on the basis of this model through a sequence of randomly selected “no tms”, “weak tms” and “strong tms” trials, serial bias curves showed the pattern observed experimentally, where sham (“no tms”) trials show repulsion in the “PFC” condition (panel b) and not in the “Vertex” condition (panel a). The difference of serial bias curves for “weak tms” and “no tms” then showed the modulation clearly in “PFC” and not in “Vertex” (panel c), as seen in the data (Fig. 6).
Supplementary Material
Acknowledgments
This work was funded by the Spanish Ministry of Science and Innovation and European Regional Development Fund (Refs: BFU2015-65315-R and RTI2018-094190-B-I00); by the Institute Carlos III, Spain (grant PIE 16/00014); by the Cellex Foundation; by the “La Caixa” Banking Foundation (Ref: LCF/PR/HR17/52150001); by the Safra Foundation; by the Generalitat de Catalunya (AGAUR 2014SGR1265, 2017SGR01565); and by the CERCA Programme/Generalitat de Catalunya. CC was supported by NIH grant R01 EY017077. JB was supported by the Spanish Ministry of Economy and Competitiveness (FPI program, Ref: BES-2013-062654) and by the Bial Foundation (Ref: 356/18). HS was supported by the “la Caixa” Banking Foundation (Ref: LCF/BQ/IN17/11620008), and the European Union’s Horizon 2020 Marie Skłodowska-Curie grant (Ref: 713673). KCSA was supported by NIH grant T32-MH020002. We thank the Barcelona Supercomputing Center (BSC) for providing computing resources, and the Neurology Department of the Hospital Clínic de Barcelona for granting access to EEG, TMS and neuronavigation equipment. This work was developed at the building Centro Esther Koplowitz, Barcelona. We thank Alba Morató and Diego Lozano-Soldevilla for assistance with EEG analyses, Luis Carlos García del Molino for valuable insights during the development of early versions of the model, and Alfonso Renart and Jaime de la Rocha for their comments on the manuscript.
Footnotes
Competing Interests
JD receives royalties from Athena Diagnostics for the use of Ma2 as an autoantibody test and from Euroimmun for the use of NMDA as an antibody test. He received a licensing fee from Euroimmun for the use of GABAB receptor, GABAA receptor, DPPX and IgLON5 as autoantibody tests; he has received a research grant from Sage Therapeutics.
Data availability
All data that support the findings of this study are available at https://github.com/comptelab/interplayPFC.
Code availability
The custom code used in this study is publicly available at https://github.com/comptelab/interplayPFC.
References
- 1.Funahashi S, Bruce CJ & Goldman-Rakic PS Mnemonic coding of visual space in the monkey’s dorsolateral prefrontal cortex. J. Neurophysiol 61, 331–349 (1989). [DOI] [PubMed] [Google Scholar]
- 2.Kubota K & Niki H Prefrontal cortical unit activity and delayed alternation performance in monkeys. J. Neurophysiol 34, 337–347 (1971). [DOI] [PubMed] [Google Scholar]
- 3.Fuster JM & Alexander GE Neuron activity related to short-term memory. Science 173, 652–654 (1971). [DOI] [PubMed] [Google Scholar]
- 4.Leavitt ML, Mendoza-Halliday D & Martinez-Trujillo JC Sustained activity encoding working memories: not fully distributed. Trends Neurosci 40, 328–346 (2017). [DOI] [PubMed] [Google Scholar]
- 5.Christophel TB, Klink PC, Spitzer B, Roelfsema PR & Haynes J-D The distributed nature of working memory. Trends Cogn Sci (Regul Ed) 21, 111–124 (2017). [DOI] [PubMed] [Google Scholar]
- 6.Wimmer K, Nykamp DQ, Constantinidis C & Compte A Bump attractor dynamics in prefrontal cortex explains behavioral precision in spatial working memory. Nat. Neurosci 17, 431–439 (2014). [DOI] [PubMed] [Google Scholar]
- 7.Inagaki HK, Fontolan L, Romani S & Svoboda K Discrete attractor dynamics underlies persistent activity in the frontal cortex. Nature 566, 212–217 (2019). [DOI] [PubMed] [Google Scholar]
- 8.Stokes MG “Activity-silent” working memory in prefrontal cortex: a dynamic coding framework. Trends Cogn Sci (Regul Ed) 19, 394–405 (2015). [DOI] [PMC free article] [PubMed] [Google Scholar]
- 9.Mongillo G, Barak O & Tsodyks M Synaptic theory of working memory. Science 319, 1543–1546 (2008). [DOI] [PubMed] [Google Scholar]
- 10.Masse NY, Yang GR, Song HF, Wang X-J & Freedman DJ Circuit mechanisms for the maintenance and manipulation of information in working memory. Nat. Neurosci 22, 1159–1167 (2019). [DOI] [PMC free article] [PubMed] [Google Scholar]
- 11.Carter E & Wang X-J Cannabinoid-mediated disinhibition and working memory: dynamical interplay of multiple feedback mechanisms in a continuous attractor model of prefrontal cortex. Cereb. Cortex 17 Suppl 1, i16–26 (2007). [DOI] [PubMed] [Google Scholar]
- 12.Fiebig F & Lansner A A Spiking Working Memory Model Based on Hebbian Short-Term Potentiation. J. Neurosci 37, 83–96 (2017). [DOI] [PMC free article] [PubMed] [Google Scholar]
- 13.Orhan AE & Ma WJ A diverse range of factors affect the nature of neural representations underlying short-term memory. Nat. Neurosci 22, 275–283 (2019). [DOI] [PubMed] [Google Scholar]
- 14.Rose NS et al. Reactivation of latent working memories with transcranial magnetic stimulation. Science 354, 1136–1139 (2016). [DOI] [PMC free article] [PubMed] [Google Scholar]
- 15.Christophel TB, Iamshchinina P, Yan C, Allefeld C & Haynes J-D Cortical specialization for attended versus unattended working memory. Nat. Neurosci 21, 494–496 (2018). [DOI] [PubMed] [Google Scholar]
- 16.Fiebig F & Lansner A A Spiking Working Memory Model Based on Hebbian Short-Term Potentiation. J. Neurosci 37, 83–96 (2017). [DOI] [PMC free article] [PubMed] [Google Scholar]
- 17.Kilpatrick ZP Synaptic mechanisms of interference in working memory. Sci. Rep 8, 7879 (2018). [DOI] [PMC free article] [PubMed] [Google Scholar]
- 18.Tegnér J, Compte A & Wang X-J The dynamical stability of reverberatory neural circuits. Biol. Cybern 87, 471–481 (2002). [DOI] [PubMed] [Google Scholar]
- 19.Seeholzer A, Deger M & Gerstner W Stability of working memory in continuous attractor networks under the control of short-term plasticity. PLoS Comput. Biol 15, e1006928 (2019). [DOI] [PMC free article] [PubMed] [Google Scholar]
- 20.Fischer J & Whitney D Serial dependence in visual perception. Nat. Neurosci 17, 738–743 (2014). [DOI] [PMC free article] [PubMed] [Google Scholar]
- 21.Papadimitriou C, Ferdoash A & Snyder LH Ghosts in the machine: memory interference from the previous trial. J. Neurophysiol 113, 567–577 (2015). [DOI] [PMC free article] [PubMed] [Google Scholar]
- 22.Fritsche M, Mostert P & de Lange FP Opposite effects of recent history on perception and decision. Curr. Biol 27, 590–595 (2017). [DOI] [PubMed] [Google Scholar]
- 23.Bliss DP, Sun JJ & D’Esposito M Serial dependence is absent at the time of perception but increases in visual working memory. Sci. Rep 7, 14739 (2017). [DOI] [PMC free article] [PubMed] [Google Scholar]
- 24.Jonides J & Nee DE Brain mechanisms of proactive interference in working memory. Neuroscience 139, 181–193 (2006). [DOI] [PubMed] [Google Scholar]
- 25.Kiyonaga A, Scimeca JM, Bliss DP & Whitney D Serial Dependence across Perception, Attention, and Memory. Trends Cogn Sci (Regul Ed) 21, 493–497 (2017). [DOI] [PMC free article] [PubMed] [Google Scholar]
- 26.Akrami A, Kopec CD, Diamond ME & Brody CD Posterior parietal cortex represents sensory history and mediates its effects on behaviour. Nature 554, 368–372 (2018). [DOI] [PubMed] [Google Scholar]
- 27.Hermoso-Mendizabal A et al. Response outcomes gate the impact of expectations on perceptual decisions. Nat. Commun 11, 1057 (2020). [DOI] [PMC free article] [PubMed] [Google Scholar]
- 28.Lieder I et al. Perceptual bias reveals slow-updating in autism and fast-forgetting in dyslexia. Nat. Neurosci 22, 256–264 (2019). [DOI] [PubMed] [Google Scholar]
- 29.D’Esposito M, Postle BR, Jonides J & Smith EE The neural substrate and temporal dynamics of interference effects in working memory as revealed by event-related functional MRI. Proc Natl Acad Sci USA 96, 7514–7519 (1999). [DOI] [PMC free article] [PubMed] [Google Scholar]
- 30.Feredoes E, Tononi G & Postle BR Direct evidence for a prefrontal contribution to the control of proactive interference in verbal working memory. Proc Natl Acad Sci USA 103, 19530–19534 (2006). [DOI] [PMC free article] [PubMed] [Google Scholar]
- 31.Bliss DP & D’Esposito M Synaptic augmentation in a cortical circuit model reproduces serial dependence in visual working memory. PLoS ONE 12, e0188927 (2017). [DOI] [PMC free article] [PubMed] [Google Scholar]
- 32.Wolff MJ, Jochim J, Akyürek EG & Stokes MG Dynamic hidden states underlying working-memory-guided behavior. Nat. Neurosci 20, 864–871 (2017). [DOI] [PMC free article] [PubMed] [Google Scholar]
- 33.Papadimitriou C, White RL & Snyder LH Ghosts in the Machine II: Neural Correlates of Memory Interference from the Previous Trial. Cereb. Cortex 27, 2513–2527 (2017). [DOI] [PMC free article] [PubMed] [Google Scholar]
- 34.Foster JJ, Sutterer DW, Serences JT, Vogel EK & Awh E The topography of alpha-band activity tracks the content of spatial working memory. J. Neurophysiol 115, 168–177 (2016). [DOI] [PMC free article] [PubMed] [Google Scholar]
- 35.Trousdale J, Hu Y, Shea-Brown E & Josić K Impact of network structure and cellular response on spike time correlations. PLoS Comput. Biol 8, e1002408 (2012). [DOI] [PMC free article] [PubMed] [Google Scholar]
- 36.Fujisawa S, Amarasingham A, Harrison MT & Buzsáki G Behavior-dependent short-term assembly dynamics in the medial prefrontal cortex. Nat. Neurosci 11, 823–833 (2008). [DOI] [PMC free article] [PubMed] [Google Scholar]
- 37.Barthó P et al. Characterization of neocortical principal cells and interneurons by network interactions and extracellular features. J. Neurophysiol 92, 600–608 (2004). [DOI] [PubMed] [Google Scholar]
- 38.Cohen JY et al. Cooperation and competition among frontal eye field neurons during visual target selection. J. Neurosci 30, 3227–3238 (2010). [DOI] [PMC free article] [PubMed] [Google Scholar]
- 39.Manohar SG, Zokaei N, Fallon SJ, Vogels TP & Husain M Neural mechanisms of attending to items in working memory. Neurosci. Biobehav. Rev 101, 1–12 (2019). [DOI] [PMC free article] [PubMed] [Google Scholar]
- 40.Almeida R, Barbosa J & Compte A Neural circuit basis of visuo-spatial working memory precision: a computational and behavioral study. J. Neurophysiol 114, 1806–1818 (2015). [DOI] [PMC free article] [PubMed] [Google Scholar]
- 41.Nassar MR, Helmers JC & Frank MJ Chunking as a rational strategy for lossy data compression in visual working memory. Psychol. Rev 125, 486–511 (2018). [DOI] [PMC free article] [PubMed] [Google Scholar]
- 42.Stein H et al. Disrupted serial dependence suggests deficits in synaptic potentiation in anti-NMDAR encephalitis and schizophrenia. BioRxiv (2019). doi: 10.1101/830471 [DOI] [PMC free article] [PubMed] [Google Scholar]
- 43.Reinhart RMG et al. Homologous mechanisms of visuospatial working memory maintenance in macaque and human: properties and sources. J. Neurosci 32, 7711–7722 (2012). [DOI] [PMC free article] [PubMed] [Google Scholar]
- 44.Sajad A, Sadeh M, Yan X, Wang H & Crawford JD Transition from Target to Gaze Coding in Primate Frontal Eye Field during Memory Delay and Memory-Motor Transformation. Eneuro 3, (2016). [DOI] [PMC free article] [PubMed] [Google Scholar]
- 45.Bae G-Y & Luck SJ Reactivation of previous experiences in a working memory task. Psychol. Sci 30, 587–595 (2019). [DOI] [PMC free article] [PubMed] [Google Scholar]
- 46.Zokaei N, Manohar S, Husain M & Feredoes E Causal evidence for a privileged working memory state in early visual cortex. J. Neurosci 34, 158–162 (2014). [DOI] [PMC free article] [PubMed] [Google Scholar]
- 47.Moliadze V, Zhao Y, Eysel U & Funke K Effect of transcranial magnetic stimulation on single-unit activity in the cat primary visual cortex. J Physiol (Lond) 553, 665–679 (2003). [DOI] [PMC free article] [PubMed] [Google Scholar]
- 48.Volianskis A et al. Long-term potentiation and the role of N-methyl-D-aspartate receptors. Brain Res 1621, 5–16 (2015). [DOI] [PMC free article] [PubMed] [Google Scholar]
- 49.Wang Y et al. Heterogeneity in the pyramidal network of the medial prefrontal cortex. Nat. Neurosci 9, 534–542 (2006). [DOI] [PubMed] [Google Scholar]
- 50.Hempel CM, Hartman KH, Wang XJ, Turrigiano GG & Nelson SB Multiple forms of short-term plasticity at excitatory synapses in rat medial prefrontal cortex. J. Neurophysiol 83, 3031–3041 (2000). [DOI] [PubMed] [Google Scholar]
- 51.Constantinidis C, Franowicz MN & Goldman-Rakic PS Coding specificity in cortical microcircuits: a multiple-electrode analysis of primate prefrontal cortex. J. Neurosci 21, 3646–3655 (2001). [DOI] [PMC free article] [PubMed] [Google Scholar]
- 52.Compte A et al. Temporally irregular mnemonic persistent activity in prefrontal neurons of monkeys during a delayed response task. J. Neurophysiol 90, 3441–3454 (2003). [DOI] [PubMed] [Google Scholar]
- 53.Constantinidis C, Williams GV & Goldman-Rakic PS A role for inhibition in shaping the temporal flow of information in prefrontal cortex. Nat. Neurosci 5, 175–180 (2002). [DOI] [PubMed] [Google Scholar]
- 54.Constantinidis C & Goldman-Rakic PS Correlated discharges among putative pyramidal neurons and interneurons in the primate prefrontal cortex. J. Neurophysiol 88, 3487–3497 (2002). [DOI] [PubMed] [Google Scholar]
- 55.Murray JD et al. Stable population coding for working memory coexists with heterogeneous neural dynamics in prefrontal cortex. Proc Natl Acad Sci USA 114, 394–399 (2017). [DOI] [PMC free article] [PubMed] [Google Scholar]
- 56.Wang XJ, Tegnér J, Constantinidis C & Goldman-Rakic PS Division of labor among distinct subtypes of inhibitory neurons in a cortical microcircuit of working memory. Proc Natl Acad Sci USA 101, 1368–1373 (2004). [DOI] [PMC free article] [PubMed] [Google Scholar]
- 57.Yarkoni T, Poldrack RA, Nichols TE, Van Essen DC & Wager TD Large-scale automated synthesis of human functional neuroimaging data. Nat. Methods 8, 665–670 (2011). [DOI] [PMC free article] [PubMed] [Google Scholar]
- 58.Rossi S, Hallett M, Rossini PM, Pascual-Leone A & Safety of TMS Consensus Group. Safety, ethical considerations, and application guidelines for the use of transcranial magnetic stimulation in clinical practice and research. Clin. Neurophysiol 120, 2008–2039 (2009). [DOI] [PMC free article] [PubMed] [Google Scholar]
- 59.Barbosa J & Compte A Build-up of serial dependence in color working memory. BioRxiv (2018). doi: 10.1101/503185 [DOI] [PMC free article] [PubMed] [Google Scholar]
- 60.Lumley T, Diehr P, Emerson S & Chen L The importance of the normality assumption in large public health data sets. Annu. Rev. Public Health 23, 151–169 (2002). [DOI] [PubMed] [Google Scholar]
- 61.Pinheiro J, Bates D, DebRoy S, Sarkar D & Team RC nlme: Linear and Nonlinear Mixed Effects Models (2019).
- 62.Worden MS, Foxe JJ, Wang N & Simpson GV Anticipatory biasing of visuospatial attention indexed by retinotopically specific alpha-band electroencephalography increases over occipital cortex. J. Neurosci 20, RC63 (2000). [DOI] [PMC free article] [PubMed] [Google Scholar]
- 63.Kelly SP, Lalor EC, Reilly RB & Foxe JJ Increases in alpha oscillatory power reflect an active retinotopic mechanism for distracter suppression during sustained visuospatial attention. J. Neurophysiol 95, 3844–3851 (2006). [DOI] [PubMed] [Google Scholar]
- 64.Medendorp WP et al. Oscillatory activity in human parietal and occipital cortex shows hemispheric lateralization and memory effects in a delayed double-step saccade task. Cereb. Cortex 17, 2364–2374 (2007). [DOI] [PubMed] [Google Scholar]
- 65.Brouwer GJ & Heeger DJ Decoding and reconstructing color from responses in human visual cortex. J. Neurosci 29, 13992–14003 (2009). [DOI] [PMC free article] [PubMed] [Google Scholar]
- 66.Amarasingham A, Harrison MT, Hatsopoulos NG & Geman S Conditional modeling and the jitter method of spike resampling. J. Neurophysiol 107, 517–531 (2012). [DOI] [PMC free article] [PubMed] [Google Scholar]
- 67.Nougaret S & Genovesio A Learning the meaning of new stimuli increases the cross-correlated activity of prefrontal neurons. Sci. Rep 8, 11680 (2018). [DOI] [PMC free article] [PubMed] [Google Scholar]
- 68.Compte A, Brunel N, Goldman-Rakic PS & Wang XJ Synaptic mechanisms and network dynamics underlying spatial working memory in a cortical network model. Cereb. Cortex 10, 910–923 (2000). [DOI] [PubMed] [Google Scholar]
- 69.Edin F et al. Mechanism for top-down control of working memory capacity. Proc Natl Acad Sci USA 106, 6802–6807 (2009). [DOI] [PMC free article] [PubMed] [Google Scholar]
- 70.Tuckell HC Introduction to Theoretical Neurobiology: Volume 2, Nonlinear and Stochastic Theories (1988).
- 71.Markram H, Wang Y & Tsodyks M Differential signaling via the same axon of neocortical pyramidal neurons. Proc Natl Acad Sci USA 95, 5323–5328 (1998). [DOI] [PMC free article] [PubMed] [Google Scholar]
- 72.de la Rocha J, Doiron B, Shea-Brown E, Josić K & Reyes A Correlation between neural spike trains increases with firing rate. Nature 448, 802–806 (2007). [DOI] [PubMed] [Google Scholar]
- 73.Romero MC, Davare M, Armendariz M & Janssen P Neural effects of transcranial magnetic stimulation at the single-cell level. Nat. Commun 10, 2642 (2019). [DOI] [PMC free article] [PubMed] [Google Scholar]
Associated Data
This section collects any data citations, data availability statements, or supplementary materials included in this article.