

Abstract
Octopus cells in the ventral cochlear nucleus (VCN) have been difficult to study because of the very features that distinguish them from other VCN neurons. We performed in vivo recordings in cats on well-isolated units, some of which were intracellularly labeled and histologically reconstructed. We found that responses to low-frequency tones with frequencies < 1 kHz reveal higher levels of neural synchrony and entrainment to the stimulus than the auditory nerve. In responses to higher frequency tones, the neural discharges occur mostly near the stimulus onset. These neurons also respond in a unique way to 100 % amplitude-modulated (AM) tones with discharges exhibiting a bandpass tuning. Responses to frequency-modulated sounds (FM) are unusual: Octopus cells react more vigorously during the ascending than the descending parts of the FM stimulus. We examined responses of neurons in the ventral nucleus of the lateral lemniscus (VNLL) whose discharges to tones and AM sounds are similar to octopus cells. Repeated stimulation with short tone pips of VCN and VNLL onset neurons evokes trains of action potentials with gradual shifts toward later times in their first spike latency. This behavior parallels short-term post-synaptic depression observed by other authors in in vitro VCN recordings of octopus cells. VCN and VNLL onset units in cats respond to frozen noise stimuli with gaps as narrow as 1 ms with a robust discharge near the stimulus onset following the gap. This finding suggests that VCN and VNLL onset cells play a role in gap detection, which is of great importance to speech perception.
Keywords: cochlear nucleus, ventral nucleus of the lateral lemniscus, temporal processing, synaptic plasticity, gap detection
Introduction
Information about acoustic stimuli is carried in the discharges of auditory nerve fibers (ANFs) and relayed to the cochlear nucleus (CN) in the auditory brainstem. Various features of the acoustic stimuli are then processed by the CN, which in turn sends its discharges to other central auditory nuclei via its output pathways or striae. Most of what we know about the processing of sounds comes from in vivo recordings of the principal cells of the ventral CN (VCN), specifically from stellate as well as two types of bushy cells (globular and spherical).
This work analyzes the discharge properties of a subset of onset units, the octopus cells, located in the posterior VCN (PVCN) and their presumed targets in the VNLL. We also present histological reconstructions of some VCN octopus cells that were physiologically characterized. Input to octopus cells is provided exclusively by ANFs. Characteristic frequencies (CF: frequency of lowest threshold) of ANFs that innervate octopus cells encompass a broad range of frequencies (Golding et al. 1995; McGinley et al. 2012). The innervation pattern of ANFs, first described by Harrison and Irving (1966), is such that low-CF and high-CF ANFs contact the dendrites more ventrally and dorsally, respectively. Because of this, octopus cells are broadly tuned and the consequences of this tuning in the encoding of broadband sounds by octopus cells remain to be fully understood. Axons of octopus cells in the PVCN project primarily to monaural centers via the intermedia acoustic stria (IAS). In rodents, and perhaps other mammals, octopus cells also project to the superior paraolivary nucleus (SPON) in the auditory brainstem (Felix II et al. 2017; Gómez-Alvarez et al. 2018). The types of onset units studied here were originally referred to as “onset type I (OI)” and “onset type L (OL)” by Godfrey et al. (1975), Rhode et al. (1983) and Rouiller and Ryugo (1984) because the discharges occur mostly near the onset of stimulation in their responses to single tones. Cell bodies of these types of neurons lie in the octopus cell region of the PVCN (Osen 1969). Previous publications of onset unit responses (e.g., Kim and Leonard 1988; Rhode and Smith 1986; Rhode and Kettner 1987; Palmer and Winter 1993; Smith et al. 2005; Joris and Smith 2011; Lu et al. 2018) have pointed out that these cells are well suited to encode certain temporal aspects of the input stimuli, such as the onset of stimulation. All this knowledge comes from a relatively low number of records, as in vivo recordings have proven difficult, perhaps because of the biophysical properties of these neurons (Oertel 1997).
Results of in vivo cat experiments by Adams (1997) show that octopus cells project to globular cells within the ventral division of the contralateral VNLL. Neural recordings with metal electrodes in that region show the existence of prepotentials with discharge patterns similar to those found in CN onset units (Adams 1997). Analyses of onset unit responses in the VNLL (Recio-Spinoso and Joris 1994) show similarities with the response patterns of CN onset cells in regard to their responses to single tones, amplitude-modulated (AM) sounds and broad receptive fields.
In this work, we trace a sharpening in the temporal processing of sounds performed by VCN and VNLL onset units relative to the auditory nerve. For example, we show that quantitative measures of phase locking using either the vector strength (VS; Goldberg and Brown 1969) or the entrainment index (EI; Joris et al. 1994) are larger than those computed from ANF discharges for frequencies up to 1 kHz. This result was expected, given that OI cells exhibit the strongest phase locking to the fundamental frequency of vowels when compared to other VCN neurons (Rhode 1998). We also show that onset cells are better than ANFs at detecting the onset of stimulation after a gap in the stimulus. Onset cells in the VCN and the VNLL thus appear to be well suited for temporal tasks that are involved in gap detection.
Gaps in certain types of acoustic stimuli, such as pauses in speech, provide cues that discriminate among different types of sounds. By increasing the separation after the initial consonant, for example, it is possible to distinguish between the sounds “bar” and “par,” an effect referred to as categorical perception (Liberman 1996).
Considering the importance of temporal patterns of neuronal discharges, including gaps, in the representation of speech sounds (Young and Sachs 1979; Shannon et al. 1995; Zeng et al. 2005), the fact that octopus cells so effectively encode gaps suggests that they play a role in speech perception.
Methods
Animal Preparation
Data were obtained from adult cats of either sex (31 onset units in PVCN; 14 in VNLL), which were part of a larger study of CN and VNLL processing of sounds. With the exception of one CN recording, which was obtained at KU Leuven, data presented in this report come from experiments performed at UW-Madison. Surgical approaches and experimental setups were similar at both laboratories.
Animals were anesthetized initially with sodium pentobarbital (50 mg/kg, i.p.). Additional doses were given intravenously as needed to eliminate any withdrawal effect to a paw pinch. A thermostatically controlled heating blanket maintained body temperature at 37 °C. After insertion of a tracheal cannula, the animal was placed on a respirator and expired CO2 was maintained at 4 %. The left ear was removed and the bulla was vented with 20 cm of 1-mm plastic tube. For CN experiments, an opening in the skull was then made over the posterior fossa, followed by partial removal of the cerebellum to expose the CN. Two scales were positioned along the CN and were used to record X and Y coordinates of the position of the recording microelectrode. The depth of the microelectrode was also recorded, as well as changes in the tonotopic map as a function of depth. After covering the CN with a 2 % agar solution to reduce brain pulsations, a chamber was mounted over the skull opening and filled with mineral oil. The chamber was sealed with a glass disk holding the electrode.
VNLL data come from experiments previously presented in Recio-Spinoso and Joris (2014). The initial part of the surgery, up to the transection of the cat’s pinna, is identical to the CN surgery described above. Two approaches were used for VNLL recordings (Recio-Spinoso and Joris 2014). In the first approach, a craniotomy was made in the skull at a location just anterior to the cat’s bony tentorium. Parts of the occipital cerebral hemisphere were removed to expose the inferior colliculus (IC). The electrode penetrated the IC at ≈5–7 mm from the midline in a parasagittal plane. VNLL recordings were obtained starting at a depth of 5–7 mm from the surface of the IC, as judged from dominantly monaural, contralateral responses and, in some cases, a discontinuity in the progression of the units’ CF as the electrode leaves the dorsal nucleus of the lateral lemniscus, which is a binaural and tonotopically arranged nucleus (Aitkin et al. 1970; Davis et al. 2007). In the second approach, the cerebellum was removed until the floor of the IVth ventricle (near the IC) was visualized. The cerebellum overlying the IC was then removed, and the electrode was aimed at a position ventral to the IC, again around 5 mm from the midline. Warm agar was applied over the brain to reduce pulsations.
Acoustic Calibration
Radio Shack supertweeter phones were used to deliver the sound through an earpiece inserted into the external meatus. (The sound delivery systems were similar but not identical at UW-Madison and KU Leuven; please see Recio-Spinoso and Joris 2014 for details). The calibration of the acoustic system (100–50,000 Hz, in 100 steps) was performed using a Bruel and Kjær ½-in. condenser microphone attached to a previously calibrated probe tube, which was placed within 2 mm of the tympanic membrane.
Stimuli and Labeling
For CN experiments, glass electrodes were filled with a 1 M KCl and 1 % Neurobiotin solution. Recording electrodes first entered the dorsal CN and then passed into the PVCN with an accompanying CF change. Electrodes were advanced through the brain in 1-μm steps using a Marzhauser micromanipulator while simultaneously playing a frequency modulated (FM) tone as search stimulus. The FM stimulus was a linear-frequency chirp whose instantaneous frequency, f(t) = kt + f0, varied linearly with time. The duration of the chirp was 2 s. At times t = 0, 1, and 2 s, f(t) = fmin, fmax, and fmin Hz, respectively. The chirp was presented several times, without any pause, until the resulting histogram values were stable. Once a unit was isolated, it was characterized by collecting a response area curve (RA), i.e., a series of iso-intensity responses at different frequencies, a post-stimulus time histogram (PSTH) at the unit’s CF, a rate-intensity curve at CF and an FM sweep response. Stimuli used to estimate the RA curves consists of 50-ms tone pips presented 1 time every 250 ms. To obtain the PSTH at CF, 50-ms tones were presented 250 times every 200 ms. If conditions permitted, an intracellular injection of Neurobiotin was made iontophoretically using a 1- to 2-nA pulsed current (2.5 Hz square wave) for ≤ 10 min. We ascertained that the current was driving the unit by recording the unit’s intracellular response. When possible, we obtained another PSTH after the injection.
For VNLL experiments, glass electrodes were filled with 1 M KCl. Electrodes were advanced through the brain in 1-μm steps using a TrentWells micromanipulator while simultaneously playing a series of single tones as search stimuli. Once a unit was isolated, it was characterized by collecting an RA curve, a PSTH at the unit’s CF and a rate-intensity curve at CF.
For both CN and VNLL experiments, amplitude-modulated (AM) signals were generated as described in Recio-Spinoso and Joris (2014). The carrier frequency was always set to the neuron’s CF. The modulation frequency, fmod, was usually set between 50 Hz and 1050 Hz, in 100-Hz increments. Modulation depth was always equal to 1, that is, 100 % modulation. Unless otherwise indicated, stimulus duration was 100 ms, presented 25 times every 200 ms.
Two types of frozen noise were also used as stimuli: Broadband and narrowband. Broadband Gaussian noise (50-kHz bandwidth) was generated with the Matlab function randn. Frozen broadband noise stimuli consisted of 100 ms Gaussian noise stimulus followed by a 0, 1, 2, 3, …,10-ms silent gap, followed by another 100-ms noise stimulus. Such stimuli were presented in an ascending order of gap duration, 50 times, once per second.
Narrowband noise was generated by filtering a broadband noise sample (see above) with a bandpass digital resonator (see Fig. 5 in Klatt 1980 for a description of the equations) centered at the unit’s CF. The 3-dB bandwidth of the resonator was set to 200 Hz for the results presented in this work.
Unit Classification
Units with high CFs (i.e., above 1–2 kHz) were classified as onset units using the following criteria: a) The shape of the PSTH obtained in response to 60-dB SPL short tones at CF resembles that of previously published onset units (Godfrey et al. 1975; Rhode et al. 1983; Rhode and Smith 1986; Smith et al. 2005), which means the shape of PSTH was either onset-I (19/31) or onset-L (5/31). b) The shape of the RA curve was asymmetric, with elevated thresholds, high vector strength values and high firing rates at frequencies below 1 kHz, and broad, usually 4 octaves or more (RAs could extend up to 6–7 octaves [Rhode 1994]). c) Responses were selective to the upward direction of the FM search stimuli. d) The recordings originated from the PVCN or the intermediate acoustic stria (IAS). Responses of low-CF neurons (7/31) are included in this work only if they originate from octopus cells, as concluded from the histological reconstruction or from the vicinity of the octopus cell region. Thresholds were usually determined visually from the RA curves.
VNLL neurons used in this report were those previously classified as onset neurons (Recio-Spinoso and Joris 2014), which follows the criteria developed by Batra and Fitzpatrick (1999). A VNLL neuron was classified as onset if its steady-state (> 35 ms post-stimulus onset) driven rate was < 25 spikes/s and its driven transient rate (< 35 ms) was at least twice the steady-state rate.
Histological Procedures
For CN recordings, following intravenous injections of 1 ml heparin, 0.5 ml lidocaine hydrochloride, and an overdose of sodium pentobarbital, cats were perfused with 1 L of saline to flush the blood, followed by 1.5 L of a 4 % glutaraldehyde and 0.5 % paraformaldehyde solution. The brain was removed and stored in fixative for at least 1 day. It was then transferred to a sucrose solution for more than 1 day, after which sections were cut on a freezing microtome at either 60 or 80 μm. Processing of the tissue followed the standard procedure for Neurobiotin. A standard ABC elite kit was used to react the tissue for 2.5 h. Selected cells were reconstructed using the Neurolucida (MicroBrightField) anatomic reconstruction system. Six octopus cells were reconstructed using Neurolucida. Histological procedure for VNLL experiments did not include the Neurobiotin procedure. In this case, sections were stained with cresyl violet.
Data Analysis
Analysis of neuronal discharges was performed using ad-hoc programs written in the Matlab programming language (version R2015b). Initial versions of the figures were created in Matlab and finished up in MS PowerPoint (2013). Student’s paired, two-tailed t test was used to compare first-spike latencies, vector strengths and entrainment indices for the same neuron at different times or stimulus presentations. The statistical analysis was performed using MS Excel (2013).
Modulation transfer functions (MTFs) were obtained from the steady-state part of the response (i.e., starting after 10 ms) to AM stimuli. Plots of the average firing rate vs. fmod are referred to as rate MTFs (rMTFs). Similarly, we refer to plots vector strength vs. fmod as temporal MTF (tMTFs). tMTF values are only plotted and analyzed if the VSs are statistically significant (p < 0.01, Rayleigh test; Mardia 1972). MTF bandwidths were defined as the frequency range within which the rate (or synchrony) is above half its maximum value.
Spectrotemporal receptive fields (STRFs, Aertesen and Johannesma 1980) were used to analyze broadband noise responses. STRFs were computed by filtering the broadband noise stimulus with a bank of 50 bandpass gammatone filters (Bell and Wit 2018) and computing the envelope at the output of each filter to estimate within-channel stimulus ensembles. The pre-event stimulus ensembles (PESEs) consist of the average stimulus preceding a spike. Rather than using the signal waveform, we used the envelopes to compute the PESEs (Keller and Takahashi 2000). Envelopes were computed using the Hilbert transform of the output of each filter (Recio-Spinoso et al. 2009; Recio-Spinoso and Joris 2014).
Neural discharges evoked by broadband noise with a gap were analyzed using the detectability function dprime (Viemeister et al. 1992):
| 1 |
In the above equation, μ and σ represent mean and standard deviation, respectively, of a spike count distribution computed at 1-ms time intervals indicated in the Result sections. The subscripts G and N in the equation indicate whether the statistics were computed from discharges evoked by a noise stimulus with a gap (G) or noise alone (N).
Results
Responses to Tonal Stimuli
We analyzed the responses to single tones of 31 onset units in the PVCN. The frequencies of stimulation were at the unit’s CF and, if possible, at other frequencies. Figure 1 a and b display PSTHs obtained from the responses to single tones of two octopus cells located in the PVCN. Both panels reveal two important properties of onset units: Responses to near-CF tones (Fig. 1 a and b) exhibit the highest probability of firing near the stimulus onset, and the timing of the evoked action potentials is near constant across stimulus repetitions. First-spike latencies have average values, μFSL, of 6.33 and 3.33 ms for the results in Fig. 1 a and b, respectively. The corresponding standard deviations, σFSL, of the first spike latencies in Fig. 1 a and b are 0.35 and 0.09 ms, respectively. Such σFSL estimates are much smaller than the corresponding standard deviations for ANFs in cats, which are, on average, above 1 ms (Recio-Spinoso and Joris 2014).
Fig. 1.
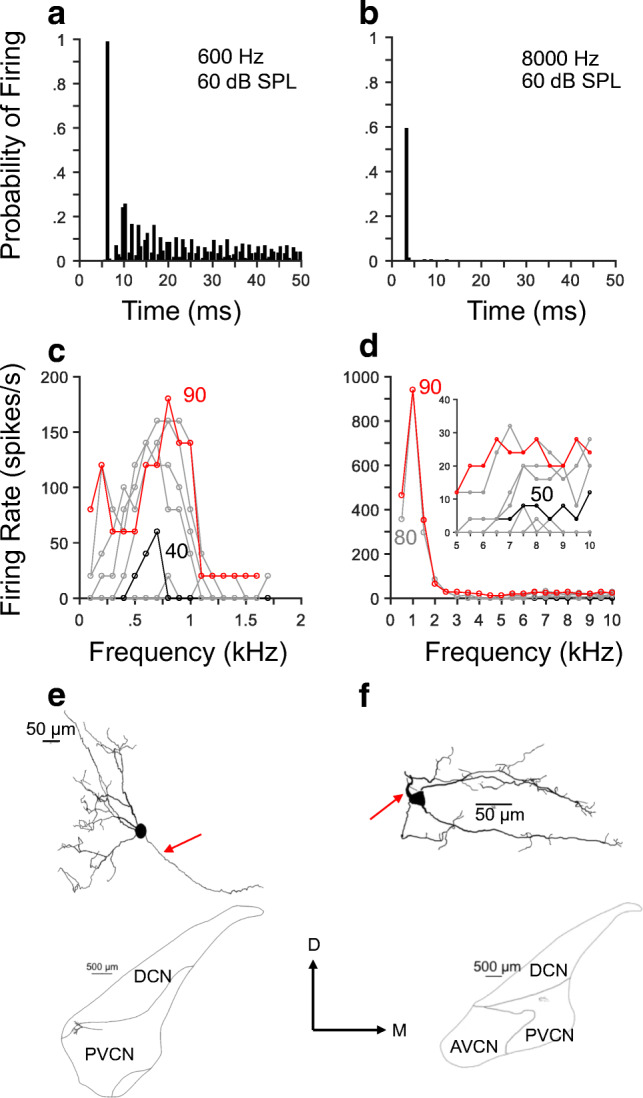
Responses to tones of octopus cells exhibit onset with L-shaped (OL) and I-shaped (OI) patterns. Panels a and b display histograms of responses (PSTHs) of two octopus cells (a L108, u14; b L102, u6) to near-CF tones. Ordinates represent probability of firing an action potential in a 500-μs window. (Stimulus duration = 50 ms, repetition period = 200 ms, number of stimulus presentations = 250.) Panels c and d show response areas (RAs) of neurons whose PSTHs are shown in panels a and b, respectively. Stimulus duration = 50 ms, repetition period = 250 ms, number of stimulus presentation = 1. Inset in panel d displays the RA at a smaller frequency range than the one in the main panel. Histological reconstruction of neurons in A and B are displayed in panels e and f, respectively. Arrows in e and f point to the axons. Insets below reconstructions in e and f show locations of the respective octopus cells in coronal sections. DCN, dorsal cochlear nucleus; AVCN, anteroventral cochlear nucleus; PVCNCN, posteroventral cochlear nucleus. Horizontal lines with the number above them in e and f indicate a length in micrometers
RA profiles of onset cells may be highly asymmetrical, particularly those of high-CF units (Fig. 1d). In other words, their “center of gravity” lies around low frequencies (< 1 kHz) and not near their respective CFs. The inset in Fig. 1d shows detailed versions of the RAs around the estimated CF. Black lines in Fig. 1 c and d represent evoked activity at the threshold stimulus level indicated. Figure 1 d gives an indication of the difficulties in estimating the CF and threshold of high-CF onset cells.
Figure 1 e and f display drawings of the octopus cells from which the data in the same column were obtained. Red arrows in these figures point to the axons. Dendrites are located around one side of the soma. The “OL” pattern exhibited in the responses to single tones in Fig. 1a associated with an octopus cell (Fig. 1e) has also been shown previously (Rhode et al. 1983). Drawings of coronal sections containing cells in Fig. 1 e and f are shown in the same figures. The sections display the location of the cells in the cochlear nucleus.
Discharge properties elucidated in Fig. 1 were also replicated in the results of Fig. 2, which shows responses to near-CF tones of two additional octopus cells. Whereas octopus cell responses to high-frequency tones in Fig. 2b occur near the stimulus onset, responses to low-frequency tones consist of action potentials throughout the stimulus duration (Fig. 2a). Estimates of the σFSL for the responses of the neurons in Fig. 2 were small, irrespective of the stimulus frequency. (σFSL = 0.12 and 0.02 ms for the responses in Fig. 2 a and b, respectively.) Response areas (Fig. 2 c and d) were broad and the CF, particularly that of the high-CF neuron (Fig. 2d), was difficult to discern. Moreover, the CF of the neuron in Fig. 2 a, c, and e might have been higher than 1 kHz. High firing rates evoked by low-frequency stimuli (Figs. 1 and 2) indicate that octopus cells fire with almost every stimulus cycle, i.e., they entrain to the stimulus. Histological reconstruction of the two cells whose PSTHs appear in Fig. 2 a and b are shown in Fig. 2 e and f, respectively. Axons in both cells are situated on one side of the soma and dendrites in a different location of the cell body.
Fig. 2.

Octopus cells display primary-like patterns in responses to low-frequency tones. Panel a shows a PSTH of the responses of a neuron to a near-CF low-frequency tone. Panel b displays a PSTH with an onset pattern obtained from responses to a high-frequency tone. A: L84, u27; B: L100, u14. Panels c–f are similar to those shown in Fig. 1c–f
RAs of two additional high-CF onset cells are displayed in Fig. 3 a and b. Insets in both figures exhibit iso-intensity curves for frequencies around CFs. Neural discharges evoked by low-frequency tones are high, near 700 spikes/s, as in Figs. 1 and 2. Figure 3 c and d display raster plots of the responses of the two onset units to near-CF tones. Ordinates in these plots represent the ith stimulus presentation. Abscissa values indicate time relative to stimulus onset.) The two neurons fire approximately one action potential for every stimulus presentation near the stimulus onset. Insets in Fig. 3 c and d display the corresponding PSTH in units of probability. A value of one in the PSTHs in the two insets indicates that the neuron fires one spike in every stimulus presentation in a 500-μs time window. Second-order statistics of first-spike latencies (FSLs) for the responses in Fig. 3 c and d are consistent with the statistics of other onset neurons (Figs. 1 and 2): σFSL = 0.07 and 0.05 ms for the results in Fig. 3 c and d, respectively. In summary, there is little variability in FSL in the responses of onset cells.
Fig. 3.

Response patterns of two onset units. Panels a and b show RAs obtained from responses of two high-CF onset neurons. (a L102, u24; b L116, u13.) Insets in a and b display RA curves during a smaller frequency range of stimulation. Panels c and e exhibit dot raster plots obtained from responses of the same neuron in panel a to a 2.2-kHz (=CF) and an 800-Hz tone, respectively. Inset in c contain a PSTH obtained from the same responses as in the main panel. Panels d and f show responses similar to c and e, but from the neuron in panel b
The timing of individual neural discharges evoked by stimuli is appreciated in raster plots such as those shown in Fig. 3 e and f. Those figures display the responses to low-frequency tones for the neurons in Fig. 3 a and b, respectively. (Stimulus frequencies and levels are indicated on top of each figure.) Both raster plots show that the two octopus cells fired action potentials with almost every stimulus cycle, as gathered from the near perfect vertical alignment of dots in both plots. The measurements of entrainment, EIs, evaluated during a [3 ms, 50 ms] window, computed from the spike trains in Fig. 3 e and f were 0.765 and 0.936, respectively. The corresponding EI values computed near the stimulus onset ([3 ms, 20 ms]) are 0.97 and 1. σFSLcomputed from the responses in Fig. 3 e and f were 0.05 and 0.03 ms, respectively. Such values in σFSL indicate that the variability in the timing of the initial response of onset neurons is small and independent of the tonal stimulus frequency. Results in Fig. 3e also indicate that even at relatively low levels (60 dB SPL), onset units can entrain to the frequency of stimulation.
Entrainment of high-CF octopus cells to low-frequency stimuli was often observed even for 1-kHz stimulus frequencies (Fig. 4 a and b). During the [3 ms, 20 ms] interval, entrainment indices obtained from the results in Fig. 4 a and b were 0.79 and 1, respectively. When computed during a [3 ms, 50 ms] window, the corresponding indices were 0.47 and 0.98. Entrainment indices of ANF responses to tones in cats and chinchillas have never been reported to be ≥ 0.9 (Joris et al. 1994; Recio-Spinoso 2012).
Fig. 4.

Onset units entrain to tonal stimuli of up to 1 kHz. Panels a and b display dot raster plots of the responses to 1-kHz tones of two high-CF units. a L77, u14; b L102, u6. Panel c shows a scatter plot of vector strength vs. frequency. Panel d exhibits a scatter plot of entrainment index as a function of stimulus frequency. Results in panels c and d were computed during the [3 ms, 20 ms] time interval. Filled and open symbols in panel e represent vector strength values computed during the [5 ms, 15 ms] and [35 ms, 45 ms] intervals, respectively. Results in panel f are organized as in panel e, but using entrainment indices
Figure 4 c and d display vector strength values and entrainment indices, respectively, computed from the responses of a population of onset units. (Both vector strength and entrainment index were computed during the [3 ms, 20 ms] window.) Some of the data points come from the responses of the same neuron to tone pips of different frequency. Many of the neural discharges yielded VS magnitudes above 0.9 for stimulus frequencies between 400 Hz and 1.5 kHz. Entrainment indices could be > 0.9 for frequencies up to 1 kHz. The scatter plot pattern in Fig. 4d resembles the one obtained from the responses of “high-sync” neurons in the cat cochlear nucleus (Recio-Spinoso 2012). High-sync neurons in the cat, however, exhibit entrainment to stimulus frequencies up to around 1.3 kHz.
A comparison of VS and EI values near the stimulus onset and the end of stimulation is shown in Fig. 4. (The comparison was performed only for neurons whose EI in Fig. 4d was ≥ 0.9.) Near the stimulus onset, [5 ms, 15 ms], VS (filled symbols in Fig. 4e) are statistically similar to VS computed during the [35 ms, 45 ms] window (open symbols in Fig. 4e; paired t-test, p = 0.5569, t = 0.61, df = 9). By contrast, entrainment near the stimulus onset (Fig. 4f, filled symbols) is statistically greater than during the second window (Fig. 4f, open symbols; paired t test, p = 0.019, t = 2.8552, df = 9).
The remarkable temporal precision exhibited by the discharges of octopus cells (Figs. 3 and 4) is also observed in bushy cells responses (e.g., Joris et al. 1994; Kuenzel 2019; Recio-Spinoso 2012). In the case of globular bushy cells, their outstanding temporal precision is usually attributed, at least in part, to a large convergence of ANF inputs (e.g., Kuenzel 2019; Rothman et al. 1993). There is also a large convergence of ANF inputs to octopus cells (Golding et al. 1992), which is reflected in the broad tuning of these cells. Figure 5 displays tuning curves tuning curves of one onset unit (black line) and several ANFs of similar CFs. The differences in bandwidth are unmistakable, being much larger for the onset unit (BW10dB = 5.4 kHz) than for the ANFs. Visual inspection of the tuning curves in Fig. 5 reveal that the main difference between the tuning curves of the onset unit and the ANFs is not in the slopes of the high- and low-frequency segments of the tuning curves but in the width of their near-CF tips.
Fig. 5.

Receptive fields of ANFs are narrower than those of a typical onset unit. Panel a displays tuning curves (iso-response curves vs. frequency) of one onset unit (black line with filled symbol) and several ANFs (lines with open symbols) of similar CFs. Panel b shows same information as in panel a but with normalized thresholds and CFs
Short-Term Depression in Octopus Cells
In spite of the small values of σFSL that characterize octopus cell discharges evoked by single tones, it is possible to observe shifts in first-spike latencies. These shifts begin to occur during the initial presentations of the tone stimulus (red oval in Fig. 6a), which indicates that first-spike latencies tend to occur later for every presentation. For example, mean values of first-spike latencies during the first ten (i.e., 1st–10th) and later (100th–109th) stimulus presentations are 2.84 and 2.88 ms, respectively. In other words, there is an average shift, or difference, of approximately 40 μs between FSLs during the initial and later stimulus presentations.
Fig. 6.

Shifts in first-spike latencies in onset unit responses. Panels display dot raster plots of onset units’ responses to near-CF tones around the onset of stimulation. a L100, u14; b L1024, u24: c L116, u9; d L64, u11; e L102, u6; f WH14, u14. Dashed lines are located at arbitrary times to highlight shifts in first-spike latencies. Stimulus frequencies and levels are indicated in each panel
Similar shifts were observed in the responses of additional units, five of which are displayed in Fig. 6b–f. The average shift in the responses of 19 onset units was 90 μs. Although the average value of the shift is small, it is statistically significant (paired t test, p < 0.0001, t = 0.005, df = 18). This phenomenon is also observed in the responses to individual cycles of a low-frequency tone stimulus (red oval in Fig. 7a). Similar effects are shown in Fig. 7b–f, which display raster plots in which the spike times are distributed over one period of the stimulus frequency (indicated in each plot). Average FSL shift was 55 μs and statistically significant (paired t test, p < 0.0001, t = 5.9266, df = 15). Comparable shifts have also been observed in the responses of octopus cells to trains of acoustic clicks (Oertel et al. 2000; Joris and Smith 2011).
Fig. 7.

Shifts in first-spike latencies in onset unit responses to low-frequency stimuli. Panel a exhibit a dot raster plot of the response of a high-CF unit (CF = kHz) to a low-frequency tone (1-kHz, 80-dB SPL). Red oval in that panel points to a shift in FSLs. Panel B displays the same data (L102, u6) as in panel B but spike times are expressed relative to a period of the stimulus frequency. Panels c–f are similar to panel B but for other onset units. c L116, u13; d WH35, u9; e L84, u27; f L110, u14
Synaptic depression has been observed in recordings from young octopus cells in mice in vitro (Golding and Oertel 2012) and could be responsible for shifts in FSLs such as those observed in Figs. 6 and 7. Synaptic depression in adult cats in vivo would not be expected to be identical or even qualitatively similar to that measured in octopus cells from young mice in vitro, not just because of differences in age and species but most importantly because the extracellular calcium concentration is lower in vivo (Borst 2010). Moreover, ANF spontaneous activity is absent in slices, making it harder to notice synaptic depression. This is because synapses might be chronically depressed even by low-spontaneous firing (Wang et al. 2010).
Responses to Frequency-Modulated Tones as Search Stimuli
Onset unit responses to frequency-modulated tones—the stimulus normally used in our experimental setup for searching for neurons—are illustrated in Fig. 8. Abscissa values indicate the instantaneous frequency of the tone stimulus, from the minimum to the maximum frequencies and then back to the minimum value. Instantaneous frequency values are proportional to time, which is indicated in red just below the x axis in Fig. 8a. Notice that during the first half (marked UPWARD) the instantaneous frequency increases linearly as a function of time and then decreases during the second half (DOWNARD) at the same rate. (The stimulus duration was always 2 s in results in Fig. 8.) Responses shown in the panels in Fig. 8a–f indicate that the neurons in each case respond more vigorously to the initial portion, during which the instantaneous frequency increases until it reaches its maximum value, than to the second half of the search stimulus. In Fig. 8a, for example, 443 and 92 spikes were evoked by the upward and downward phases of the frequency tone pips, respectively. Using the measure of symmetry (S) in the neural responses to a frequency-modulated sweep proposed by Britt and Starr (1976), which equals to the absolute value of the difference between the two spike counts divided by their sum, the responses in Fig. 8a are considered asymmetric (S = 0.66). (According to Britt and Starr, the response to a frequency swept stimulus is considered asymmetric if 0.2 < S < 0.8 and unidirectional if S ≥ 0.8.) Similar S values were obtained in the rest of the Fig. 6 panels (b 165 and 5 spikes, S = 0.94; c 299 and 78 spikes, S = 0.59; d 276 and 93 spikes, S = 0.5; e 1747 and 717 spikes, S = 0.42). Figure 8 f displays values of S as a function of CF for 20 onset units at different stimulus levels. Only four of those units were considered symmetric (i.e., S < 0.2). Notice also that, in general, it is difficult to get an accurate estimate of CF with this type of search stimuli. Most of the discharges in Fig. 8 occur at lower frequencies due to entrainment to low-frequency sounds.
Fig. 8.

Asymmetry in onset-unit responses to frequency-modulated tones. Panels a–e display histograms of onset unit responses to search stimuli (FM sweeps). a L105, u28; b L102, u6; c L116, u9; d L112, u18; e L102, u24. Left and right halves of the abscissae indicate upper and downward instantaneous frequency values, respectively. Red numbers in panel A indicate stimulus time. Stimulus level was 75-dB SPL for all the results in panels a–e. Panel f shows a scatter plot of symmetry index as a function of CF at three stimulus levels indicated in the plot
Responses to Amplitude-Modulated Tones
We studied the ability of onset units to represent slow fluctuations in sounds by varying fmod of AM signals (see “Methods”). The carrier frequency of the stimulus was set to the unit’s CF. We determined from the neural responses the synchrony to the stimulus envelope (tMTF) and the average firing rate (rMTF). Dot raster plots in Fig. 9 a and b display responses of an onset cell to a near-CF tone and amplitude-modulated tones, respectively. Responses in Fig. 9a indicate neural discharges predominantly near the stimulus onset, which is a property of onset units. Responses of the same cell to AM stimuli (Fig. 9b) also display neural activity shortly after the stimulus onset. The timing of neural responses in Fig. 9b also indicates evoked activity during the steady-state part of the stimulus but only for certain modulation frequencies (between 50 and 700 Hz in this case). Spike counts of the stimulus-evoked activity are not similar across different fmod, as indicated by the numbers in the right hand of Fig. 9b. For this cell, fmod = 350 Hz elicits the largest spike count or firing rate (= 200 spikes).
Fig. 9.
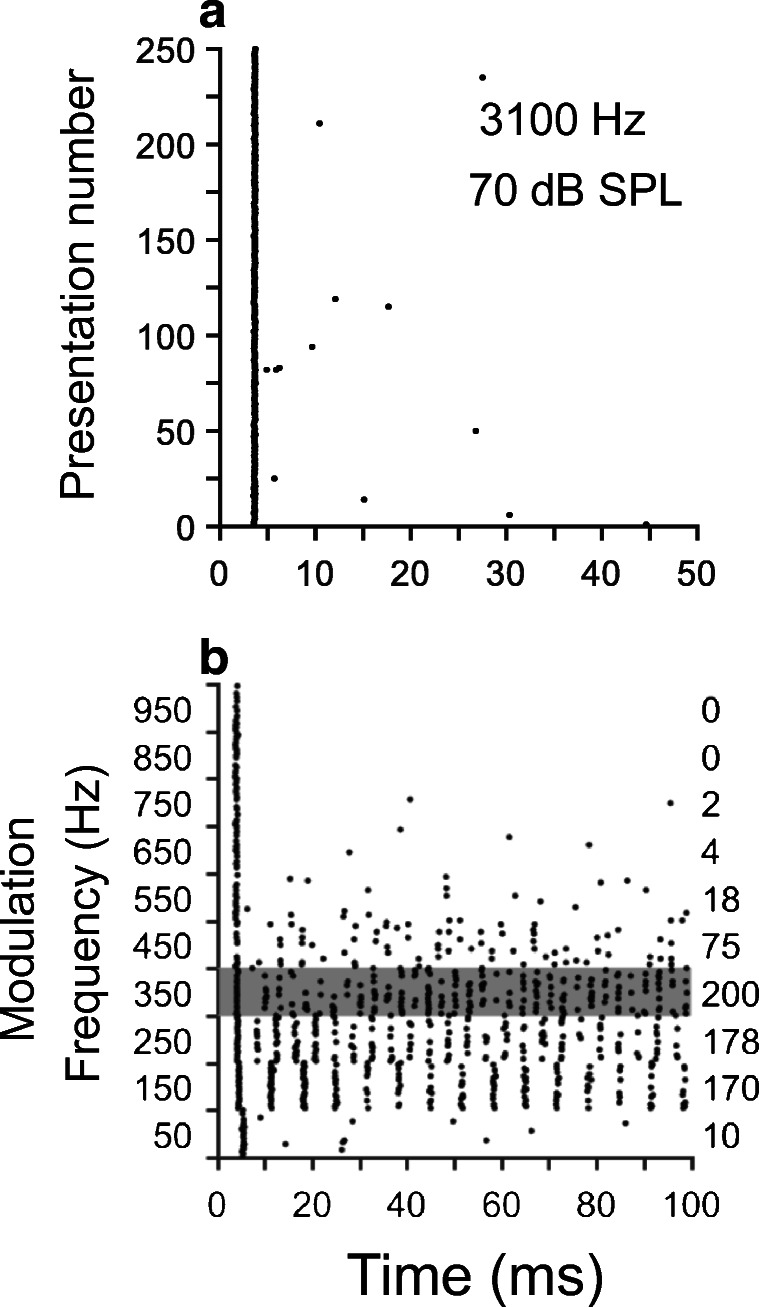
Responses to amplitude-modulated (AM) stimuli. Panel a contains a dot raster plot of the responses of an onset unit to a near-CF tonal stimulus. Panel b displays responses to AM stimuli of the same neuron shown in panel a. Responses in b are in the form of dot raster plots, 25 stimulus presentations per modulation frequency. The duration of the AM stimuli was 100 ms, presented every 200 ms with a carrier level equal to 60-dB SPL. Spike counts in the right of panel b were performed in the [6 ms, 100 ms] interval
Figure 10 displays a family of MTFs obtained from the evoked activity of two onset units at several stimulus levels as indicated in the figure. rMTFs in Fig. 10 a and c display a bandpass shape, with a “best modulation frequency” (rBMF) that evokes the largest firing rate. Shapes of the tMTFs in Fig. 10 b and c are relatively flat, in contrast to the bandpass shape of their corresponding rMTFs. Vector strength values are rather large, i.e., > 0.9, indicating a significant amount of phase locking to the stimulus envelope.
Fig. 10.

Rate (rMTF) and temporal (tMTF) modulation transfer functions exhibit bandpass and nearly flat patterns, respectively. Panels a and c display rMTFs obtained from responses of two onset cells to AM stimuli. a L116, u9; c L77, u 14. tMTFs in panels b and d were obtained from the same responses for which rMTFs are shown in a and d, respectively. Intensities (dB SPL) in panels a and c represent carrier levels. The analysis time window was [10 ms, 100 ms]
In general, MTF values do not monotonically increase or decrease as a function of stimulus level. Note that rBMFs for the results in Fig. 10a are higher than those in Fig. 10b, just as their corresponding CFs. The relationship between rBMF and CF was also observed in our sample of high-CF onset units (Fig. 11b) but only for 30- and 50-dB SPL stimuli as indicated by their respective correlation functions (0.76 and 0.9). The distribution of rBMFs varies between 200 and 600 Hz, approximately, which limits the ability of onset units to encode the envelope of natural stimuli (Rhode 1994). Bandwidths of tMTF curves as a function of CF (Fig. 11a) fluctuate between 100 and 900 Hz.
Fig. 11.

Properties of tMTFs and rMTFs as a function of CF. Panel a displays a scatter plot of bandwidth of tMTFs as a function of CF for three stimulus levels indicated in the plot. Panel b, which is similar to panel a, displays best modulation frequencies vs. CF. Correlation coefficients, r, of the linear fits to the data (blue symbols, 30-dB SPL; black symbols, 50-dB SPL) are indicated in the plot
Responses to Frozen Noise
The ability of onset units to encode temporal patterns of frozen noise samples is shown in Fig. 12. Responses of two onset cells and two ANFs to identical samples of broadband Gaussian noise (i.e., frozen noise) are shown in Fig. 12a–d. Figure 12 b and d exhibit the ability of the onset cell to follow certain aspects of the input stimulus throughout its duration, as judged by the repeated patterns in the cells’ responses. For example, there is a repetition of gaps in the responses across stimulus presentations, at around 20–25 ms in Fig. 12b. There is also a discernable vertical alignment in the responses of these neurons to certain attributes of the stimulus, although not as marked as in the responses to low-frequency single tones (Figs. 3 and 4). The value of σFSL remains very low, 0.03 ms. By contrast, ANF responses to the same stimuli (Fig. 12 a and c) look rather “noisy,” that is, they lack any visible temporal pattern in the responses.
Fig. 12.

Onset unit responses to frozen noise stimuli display similar patterns across stimulus presentations. Panels a and c display dot raster plots of the responses of two ANFs to frozen samples of white noise. Similarly, results in b were obtained from two onset units. Panels e and f display dot raster plots of responses of an ANF and an onset unit, respectively, to narrowband noise stimuli (bandwidth = 200 Hz) centered at CF. a ICSP17, u6; b ICSP17, u4; c ICSP17, u9; d S0425, u4; e WH11, u84; f WH14, u14
Responses of one ANF and onset unit to narrowband noise stimuli (Fig. 12 e and f, respectively) reveal temporal properties similar to those obtained under broadband noise stimulation. Figure 12 f also exhibits vertical alignments in the responses just like the responses shown in Fig. 12 b and d. By contrast, the responses of an ANF (Fig. 12e) displays a less orderly arrangement in the timing of its discharges.
Onset Units in the Ventral Nucleus of the Lateral Lemniscus
Octopus cells in the CN send their axons to the contralateral VNLL, where they contact globular cells through calyceal endings. The latter cells are located in the most ventral region of the VNLL. (The cat VNLL is usually divided into three nuclei: dorsal, intermediate and ventral [Adams 1996].) It is perhaps not surprising that the responses to single tones of these neurons and octopus cells share similarities, a property first reported by Adams (1996). Figure 13 a–d exhibit dot raster plots of single-tone responses of four VNLL onset cells. Insets in those figures display the corresponding responses in the form of PSTHs in probability units. All the units were classified as onset units based on the criteria described in Recio-Spinoso and Joris (2014). Like onset units in the CN, VNLL onset cells also display a shift in their response latencies, similar to that observed in the responses of octopus cells (Fig. 6).
Fig. 13.

Response properties of onset units in the ventral nucleus of the lateral lemniscus. Panels a–d display dot raster plots of onset-unit responses to near CF 60-dB SPL tones. a VNLL21, u3; b VNLL35, u30; c VNLL20, u20; d ICSP8, u14. Vertical dashed lines are for reference only. Insets show the corresponding PSTHs. Panels e and f (same neurons as in c and d, respectively) exhibit rMTFs at three SPL levels for two onset cells. Insets in those panels contain the corresponding tMTFs
rMTFs obtained from the responses to AM stimuli of two VNLL onset neurons are shown in Fig. 13e–f. Both rMTFs in Fig. 13 exhibit a bandpass shape. Corresponding tMTFs (insets in Fig. 13 e and f) are relatively flat at frequencies at which they are statistically significant.
We analyzed the neural responses to broadband and narrowband noise stimuli of ANFs and onset units using shuffled autocorrelograms, which remove effects of the neuron’s refractory period (Louage et al. 2005). Figure 14a displays normalized shuffled autocorrelograms (SACs, Louage et al. 2005) obtained from the responses of a collection of three ANFs (red lines in Fig. 14a) and five onset units. (Black and gray lines in Fig. 14a represent SACs of PVCN onset units in response to broadband and narrowband noise, respectively. The blue line in the same figure was obtained from the responses to broadband noise of a VNLL onset unit.) At zero delay, SACs reach their peak value. Following Louage et al. (2005), the SAC value at zero delay will be called the correlation index (CI). CI values obtained from onset units in Fig. 14a are larger than those originating from ANF responses. Although CI and vector strength values are not necessarily correlated, a higher value of CI denotes a better temporal processing, as it indicates the coincidence-detection capabilities of a neuron.
Fig. 14.

Temporal analysis of onset-unit responses to frozen noise. Panel a displays normalized SACs computed from responses to frozen noise samples. Thin and thick black (gray) lines depicts SACs computed from responses to broadband (narrowband) noise of four PVCN onset units. Blue line displays a SAC obtained from responses to broadband noise of a VNLL onset unit. Red lines continuous (dashed) lines show SACs from responses to broadband (narrowband) noise of ANFs. Panel b shows a scatter plot of CIs as a function of CF. Filled squares represent CIs obtained from responses of PVCN onset units to frozen noise samples (black and gray symbols originate from responses to broadband and narrowband noises, respectively). Filled circles display CIs for VNLL onset units. Filled and open triangles indicate CI values obtained from ANF responses to broadband and narrowband noises, respectively
Figure 14 b shows CI values measured from responses to broadband noise of a population of CN (filled rectangles) and VNLL (filled circles) onset units. CI values obtained from responses to narrowband noise of two PVCN onset units are displayed using gray squares. The same figure also displays CIs of ANFs collected for this work (open and filled triangles), which were always lower than CIs of CN and VNLL onset units.
Responses to broadband white noise were also analyzed using STRFs (see “Methods”). Figure 15 a displays a collection of PESEs for an ANF (red line), a PVCN onset unit (black line) and a VNLL onset unit (blue line). Each of those waveforms represents the average envelope of the stimulus waveform preceding a spike. The stimulus waveform was defined as the output of a bandpass Gamma tone filter (centered at the unit’s CF) whose input is a broadband noise sample. PESEs in Fig. 15a are either monophasic (ANF) or biphasic (PVCN and VNLL onset units). The corresponding amplitude spectra of the PESEs are displayed in Fig. 15b. Such spectra exhibit band-pass and low-pass characteristics for the onset units (black and blue lines) and the ANF (red line), respectively. Figure 15 c–e display STRFs computed from the responses of same units in Fig. 15a. (Unit type is labeled above each STRF.) For each of the plots in Fig. 15c–e, the corresponding STRF shows a maximum value at a frequency region around CF depicted using light or yellowish colors. This region is associated with an increase in firing rate and is called an “activation region” (Kim and Young 1994). The analysis was performed on the responses of the cohort of onset units (6 VNLL and one PVCN) with similar results: the best frequency of the STRF matched approximately the unit’s CF. In spite of the absence of phase-locking to near-CF tones, it is possible to recover tuning information from the responses of high-CF onset units to broadband noise.
Fig. 15.

Spectro-temporal receptive field (STRF) analysis reveals tuning characteristics of onset units. Panel a displays pre-event stimulus ensembles (PESEs) obtained from the response envelopes of an ANF (red line) and a PVCN and a VNLL onset units (black and blue lines, respectively). Panel b shows Fourier transform amplitudes of the corresponding PESE envelopes in a. STRF analyses of the responses to noise of the units whose PESEs appear in a are displayed in panels c–e. Scatter plots of CFs estimated from peak STFRs (CFnoise) plotted against CFs estimated from responses to tones (CFtones) are shown in panel f. c ICSP17, u12; d ICSP17, u4; e ICSP08, u14
Darker blue regions in the STRF of the ANF in Fig. 15c, like those occurring at around 2 ms for frequencies > CF, might be a manifestation of cochlear suppression effects (Kim and Young 1994). By contrast, the dip in energy seen in Fig. 15d between 3 and 4 ms, approximately, at near-CF frequencies are due to the biphasic polarity of the corresponding PESE function (Fig. 15a). Given that the input to octopus cells consists of ANFs, which are excitatory, it is less likely that darker regions in the STRFs of octopus cells are due to inhibitory mechanisms. Darker regions in Fig. 15e might due to the shape to the corresponding PESE functions as well as inhibitory mechanisms.
Gap Detection by Onset Units
Gap detection is an experimental task commonly used to measure temporal resolution, that is, the ability to follow rapid changes in sound (Viemeister and Plack 1993; Werner et al. 2001). To study the neural correlates of gap detection, we stimulated ANFs and onset units with broadband noise stimuli with gaps. Raster plots in Fig.16 a and c display responses of two onset units from the PVCN to broadband noise with gaps of different widths (0 to 10 ms, in 1-ms increments). Red dashed line in Fig. 16 indicate x-axis positions in PSTHs constructed from the responses. (PSTHs have a bin width of 1 ms.) Each red line points to the time of the first bin whose value is above a certain level after the gap ends. (Such level was set to the maximum value of the PSTH divided by half.) Vertical gray lines in each plot are located at time = tFSL10 − 10 ms, where tFSL10 represents the position of the first bin (see above) after a 10-ms gap. (In other words, vertical gray lines point to the onset of the gap, t = 0 ms in Fig. 16) The red dashed lines superimposed on the responses of the two onset units in Fig. 16 clearly align with the beginning of the responses following the gap. (See also PSTHs in Fig. 16e, which were obtained from the responses in Fig. 16c.) In other words, the red dashed lines point to FSL averages following the gaps. In the case of ANF responses (Fig. 16 b and d), however, those lines are misaligned with their response onsets. The latter observation is more obvious in the PSTHs in Fig. 16f, which were obtained from the responses in Fig. 16b.
Fig. 16.

Onset-unit responses to gaps in noise stimulus reveal differences in temporal resolution over auditory nerve fiber processing of the same sounds. Panels a and c show dot raster plots of the responses of two onset units to frozen broadband noise stimuli with gaps of duration indicated in the y-axis. Fifty stimuli were presented per gap duration. Red dashed lines indicate the location of the mean first-spike latency following the gap whose starting point is indicated by the gray vertical line. ANF responses to the same noise stimulus paradigm used in a and c are shown in panels b and d. PSTHs in panels e and f were obtained from the spike trains in panels c and b, respectively, for gap durations (1, 2, and 3 ms) indicated in the panels. Red arrows in e and f point to the corresponding locations in panels c and b, respectively, indicated by red vertical lines. Time 0 in all the plots indicates the beginning of the gap. a ICSP17, u4; b ICSP17, u9; c S0425, u4; d ICSP17, u7
The performance of onset units in the VNLL to detect gaps in the stimulus was also studied. Figure 17 shows responses of four VNLL neurons to frozen noise with gaps. (Responses of those neurons to single near-CF tones indicate that they belong to the onset category.) The discharge pattern of responses in Fig.17 resembles those shown by PVCN onset units (Fig. 16 a, c, and e): Immediately after a gap in the stimulus, onset units in either the VNLL (Fig. 17) or the PVCN (Fig. 16a, c, and e) discharge robustly at the onset of stimulation even when the gap duration is set to 1 ms.
Fig. 17.

Temporal processing by onset units in the VNLL and CN is similar. Panels a–d show dot raster plots of the responses of four VNLL onset units to frozen noise stimulus with gaps of duration indicated in the y-axis. Fifty stimuli were presented per gap duration. Red dashed lines indicate the location of the largest peak in the PSTH (see text) following the gap whose starting point is indicated by the gray vertical line. PSTHs in panels e and f were obtained from the spike trains in panels a and b, respectively, for gap durations (1, 2, and 3 ms) indicated in the panels. Red arrows in e and f point to the corresponding locations in panels a and b, respectively, indicated by red vertical lines. Time 0 indicates the beginning of the gap
The beginning of stimulation following a gap in the frozen noise signal is well represented in the discharges of onset units and, to some extent, in ANFs (Figs. 16 and 17). The timing of the discharges of onset units, in general, seems to coincide more accurately with the onset of stimulation following the gap than in the timing of the responses of ANFs. Figure 18 shows scatter plots of the estimated onsets (mean FSLs ± standard deviations) as a function of gap duration for the neurons in Figs. 16a–d and 17 a and b. Figure 18a, for example, shows that for stimuli with 3-ms gaps, the average response onset (or FSL) for that particular ANF was 5.2 ms (± 0.3 ms). Similar estimates for the onset units in Fig. 18 c and e were, respectively, 3.15 ms (± 0.1 ms) and 3.12 ms (± 0.1 ms). The average standard deviations of FSLs following a 1-ms gap for VNLL onset units and ANFs were 0.137 and 0.256 ms, respectively. (Similarly, for 2-ms gaps, average standard deviations were 0.123 and 0.209 ms.) Most onset units in Fig. 18 show a near perfect alignment between the theoretical and the estimated stimulus onset following the gap.
Fig. 18.

Onset units encode start of stimulus after a brief gap better than ANFs. Panels a–f display scatter plots the of the estimated onset time following a stimulus gap as a function of gap duration. Each symbol in the graph indicates the mean first-spike latency (± standard deviation) following a gap. Neuron type is indicated in each panel
We computed errors in the onset estimates following a gap for our sample of units (Fig. 19a). Error was defined as the difference between estimated onset (± standard deviation) and the gap duration (abscissae in Fig. 19a). ANFs tend to overestimate the duration of the gap more than onset units. In general, onset units exhibited smaller error estimates than ANFs.
Fig. 19.
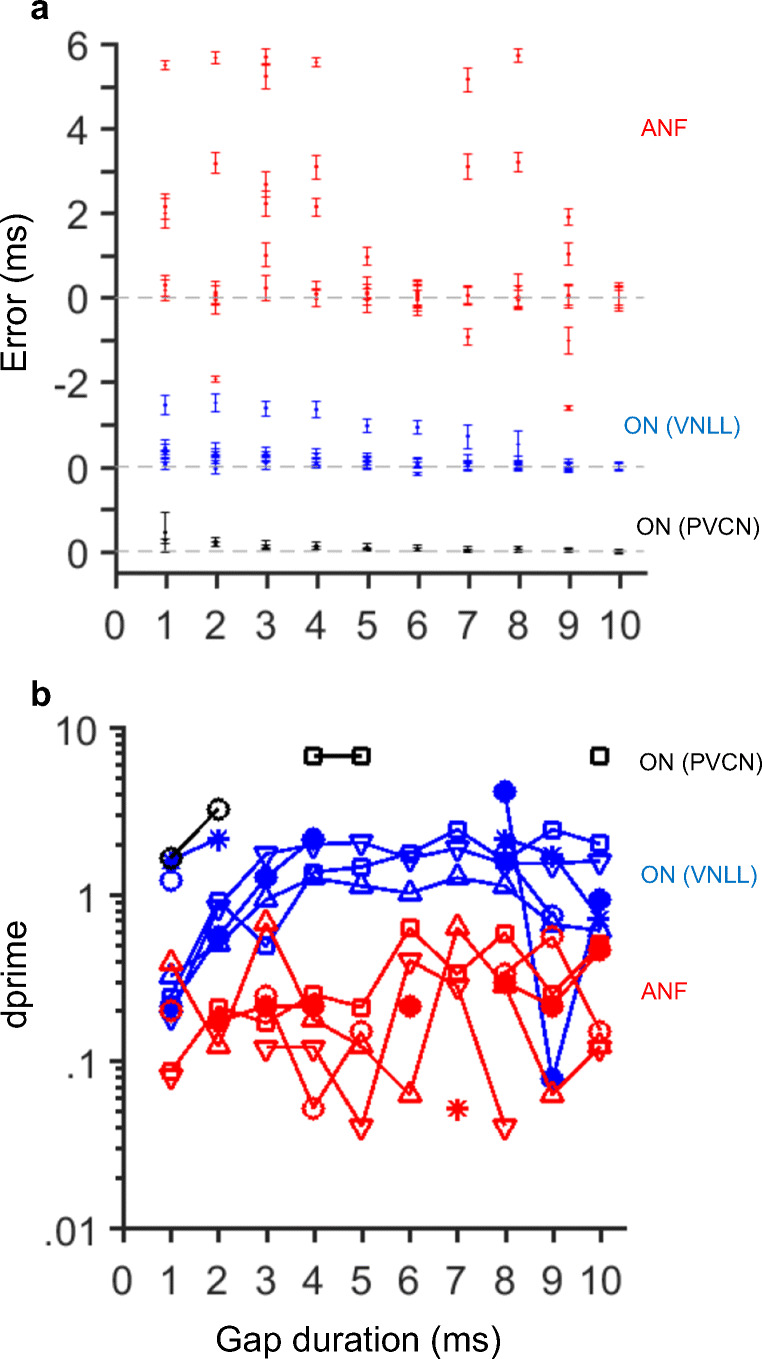
Gap detection thresholds are lower for onset units than for ANFs. Panel a displays errors in FSL estimates following the gap as a function of gap duration for the sample of ANFs (red symbols), PVCN onset units (black symbols) and VNLL onset units (blue symbols). Panel b shows detectability functions as a function of gap duration for the collection of units
Gap detection thresholds can be obtained using either psychoacoustical or electrophysiological measurements (auditory brainstem responses). At least in humans, detection thresholds obtained using any of the two procedures mentioned above are similar, between 2 and 3 ms (Werner et al. 2001).
In order to compare the results of Figs. 16, 17, and 18 to gap detection thresholds measured in humans, we used signal detection theory (Sakitt 1973; Viemeister et al. 1992). This was achieved by computing dprime functions (Eq. 1) as a function of gap duration. Means and standard deviations of the spike count distributions (μG and σG in Eq. 1) were estimated at intervals around the red marks in Figs. 16 and 17. These statistics were also computed from spike counts during the same times in the responses to the noise stimulus without a gap (μN and σN in Eq. 1). For PVCN and VNLL onset units, dprime increases as a function of gap duration (black and blue symbols in Fig. 19B). Missing values in Fig. 19b are a consequence of dprime ≈ ∞, which occurs when one of the standard deviations in Eq.1 equals zero. Values of dprimes are above 1 for the two OI units for all gap durations. For VNLL onset units, dprime = 1 for gap durations between 2 and 3 ms. For ANFs, dprime ≤ 1 regardless of the duration of the gap. If we define threshold as the gap duration at which dprime = 1, we can conclude that VNLL onset units have gap detection thresholds similar to humans. It is also possible that many ANFs are needed in order to yield a dprime = 1 for 2–3-ms gaps.
In conclusion, temporal properties of onset cells in the VCN and the VNLL allow those cells to signal stimulus onsets even after 1-ms gaps, much better than ANFs.
Discussion
Because of the tonotopic organization of the descending ANFs and the orientation of the dendrites, octopus cells receive input from high-CF ANFs at the most distal end of their dendrites and from low-CF units closer to their soma (Harrison and Irving 1966; Fekete et al. 1984; Golding and Oertel 2012). This combination of anatomical and biophysical properties is responsible for some of their remarkable properties of octopus cells.
Octopus Cells as Monaural Coincidence Detectors
The temporal precision in the discharges of octopus cells manifests itself in the values of σFSL, which were always < 1 ms and hence smaller, on the average, than the values obtained from responses of ANFs and other VCN neuron types, with the exception of onset chopper neurons (Rhode and Smith 1986). Vector strength values and entrainment index are usually ≥ 0.9, when computed from the responses to low-frequency tones (Fig. 4). Correlation indices measured from responses to frozen noise samples (Fig. 14) were also higher for VCN onset units than for ANFs. This indicates the ability of octopus cells to detect synchrony or coincidence firing among the ANF inputs.
Computational models of onset cells using only coincidence detection mechanisms (Kalluri and Delgutte 2003; Dicke and Dau 2005) have failed to account for the responses of this type of neuron to single tones. These results suggest that additional mechanisms beside coincidence detection are necessary for octopus cells to process sounds.
Octopus Cells Convey Information from Many ANFs with a Variety of CFs
The dendrite orientation in octopus cells, combined with the large number of ANF synapses, is probably responsible for the broad receptive fields of high-CF onset cells (Figs. 1d, 2d, 3a, b, and 5), with average Q10 = 1.5. As previously mentioned, low-CF ANFs innervate octopus cells closer to their soma than high-CF ANFs. Octopus cells respond more strongly to stimuli whose instantaneous frequency is swept from low to high (Fig. 8), which is likely a consequence of the compensation of traveling-wave delays performed by dendrites of octopus cells (Golding et al. 1999; McGinley et al. 2012). Formant transitions, which are rapid changes in the resonance frequencies of the vocal tract, are important in recognition of speech segments such as vowels. Formant transitions can be upward or downward, so it is fair to speculate that octopus cell responses to stimuli such as vowels can depend on the direction of the frequency sweep.
Responses to Amplitude-Modulated Stimuli
rMTFs computed from onset cell responses to 100 % AM stimuli show unique bandpass characteristics, different from those found in other types of VCN neurons (Rhode and Greenberg 1994). Previous reports of onset unit responses to 200 % AM sounds (Rhode 1994) reveal similar properties. Based on the results of Rhode (1994) and this work, it appears that the bandpass characteristics of onset cells’ rMTFs might be independent of the modulation depth of the AM stimuli.
Whether AM sounds are encoded by either a rate or a synchrony mechanism is still undecided. It is known that IC neurons, in general, exhibit tuned rMTFs (Joris et al. 2004), just like onset units (Figs. 9, 10, and 11). rBMFs are correlated with CF (Fig. 11b). This observation suggests that onset units play a role as rate encoders of the envelope of AM sounds, but with limitations. The range of rBMFs is only from 200 to 600 Hz. Growth of rMTFs with stimulus level is nonmonotonic, as shown in Fig. 10.
Processing of Sounds by VNLL Onset Units
Octopus cells innervate globular cells of the columnar area of the VNLL (Adams 1997). Some neurons in this area seem to be biophysically specialized for encoding temporal information (Wu 1999; Zhao and Wu 2001; Berger et al. 2014). The VNLL output provides an important source of inhibition to the ipsilateral inferior colliculus (Saint Marie et al. 1997; Vater et al. 1997; Zhang et al. 1998). Binaural interactions in VNLL neurons do exist but are relatively weak compared to other auditory brainstem nuclei, such as the lateral superior olive (Recio-Spinoso and Joris 2014). The VNLL is, therefore, usually considered a “monaural” center.
Because octopus cells innervate VNLL globular cells through calyceal synaptic endings, there is likely a fast and reliable relay of information from one neuron to the other. (Berger et al. 2014). This might provide an explanation for the similarities in the responses to sound of octopus cells and VNLL onset units.
Receptive fields of octopus cells and VNLL onset cells are broad (Figs. 1, 2, 3, and 5; Recio-Spinoso and Joris 2014; Smith et al. 2005). Although tuning curves of onset neurons in both auditory nuclei are broad, however, tuning curves of VNLL onset cells might have a W-shaped pattern, which has never been reported for CN neurons in cats. (Winter and Palmer 1995, however, showed bimodal response areas obtained from the responses of a small percentage of onset units in the guinea pig.) Onset units are not the only type of VNLL neuron that exhibits W-shaped tuning curves, as the W shape can also be found in sustained-response neurons with a chopper pattern. This fact indicates that there is probably additional signal processing by VNLL onset units. One possible explanation for the origin of the W-shaped pattern might be the existence of different synaptic weights among the inputs to the neuron (Kadia and Wang 2003).
Fast Synaptic Plasticity in the CN and the VNLL
Synapses allow neurons to communicate with each other and are necessary to neural processing. Rapid and repeated activation of synapses might make them stronger (facilitation) or weaker (depression). Such effects can last hours or days in the case of long-term plasticity, or a few milliseconds or seconds in the case of short-term plasticity. Fast synaptic depression exists at the level of the inner-hair cell synapse with ANFs (Goutman 2017) that might determine adaptation in ANF discharges (Kiang et al. 1965; Yates et al. 1985). At the CN level, long-term plasticity occurs in the dorsal cochlear nucleus, but not in the VCN (Fujino and Oertel 2003; Trussell 2018). Analysis of the results of experiments on large spherical bushy cells located in the AVCN performed by several groups indicates that short-term depression in those neuron types is evident in vitro but not in vivo (Kuenzel et al. 2011; Kuenzel 2019). One reason for the difference is that extracellular calcium concentrations in vivo are lower (1.3 mM) than those generally used for slices (2 mM) (Kuenzel et al. 2011; Yang and Xu-Friedman 2015; Oertel et al. 2018). Absence of spontaneous activity of ANFs in in vitro preparations might also be responsible for short-term depression being consistently detected in slices (Oertel et al. 2018).
It is thought that plasticity, while being part of the optimization process of neural circuits, might introduce distortion in the transfer of information across neural pathways (Oertel et al. 2018). Results of in vitro experiments in octopus cells (Golding et al. 1995) reveal short-term depression. Analysis of excitatory post-synaptic potentials (EPSPs) shows changes in the timing of firing in responses to electrical impulses delivered to the auditory nerve as well as a decrement in the amplitude of EPSPs. (See Fig. 4c in Oertel et al. 2018.) Those changes mimic the changes in spike latencies observed in Figs. 6 and 7.
Deterioration in the entrainment to the stimulus as a function of stimulus duration (Figs. 3e and 4a, f) might also be a consequence of short-term synaptic plasticity. They could reflect a decreased rate of rise of the summed EPSP that evokes a somewhat delayed and less temporally precise action potential. Short-term plasticity is thus evident in vivo with some deterioration in the timing of action potentials.
Responses to Gaussian Noise
Using STRFs (Aertesen and Johannesma 1980), we estimated tuning and CF of onset units in the PVCN and VNLL (Fig. 15). CF prediction was done despite lack of neural synchrony to high frequencies. Each STR is a collection of PESE waveforms and only these obtained from the outputs of gammatone filters centered near CF were significant. Although there is no envelope in the noise stimulus, the mechanical bandpass filtering performed by the cochlea induces amplitude fluctuations proportionate to the bandwidth of the filter (Rice 1945; Recio-Spinoso et al. 2009).
Responses of ANFs to broadband and narrowband noise (Fig. 12 a, c, and e) lack a significant amount of temporal structure. By contrast, responses of onset units to that type of stimuli (Fig. 12 b, d, and f) exhibit repeated patterns in their discharges, as judged by the vertical alignments in the responses of those neurons. This temporal encoding is reflected in their respective CI values. Figure 14 shows that onset units in the PVCN and VNLL yield larger CI values than ANFs.
Onset Units as Gap Detectors
Gaps in certain types of acoustic stimuli, such as pauses in speech, provide cues that discriminate among different types of sounds. Gap detection is also commonly used as an indicator of the temporal resolution of the auditory system (Moore 2012). Whether onset units have the ability to detect gaps in sounds better than the auditory nerve has been a subject of speculation (e.g., Oertel et al. 2000; Oertel and Wickesberg 2002; Oertel et al. 2017). Our measurements from PVCN and VNLL onset units suggest that they encode the beginning of an acoustic stimulus better than ANFs (Figs. 16, 17, 18, and 19a), even for stimuli presented after a 1-ms gap, that is, onset units are effective encoders of the start of a stimulus following a brief pause. This task is probably part of a gap detection mechanism required to understand speech (Oertel and Wickesberg 2002; Oertel et al. 2017; Zeng et al. 2005. The performance of onset cells in the VCN and the VNLL as gap detectors seems to be remarkably similar, although the low number of PVCN onset units in this study is definitely a caveat.
Gap detection thresholds in humans, determined using auditory brainstem responses to broadband noise, are around 2–3 ms (Werner et al. 2001). These thresholds are similar to the estimates one might expect from the performance of onset units (Fig. 19b). Threshold estimates using psychoacoustic or electrophysiological methods are also around 2–3 ms (Moore 2012; Werner et al. 2001), which suggest the importance of peripheral and brainstem processing in gap detection.
Voice-onset time (VOT) represents the delay between the onset of a stop consonant sound and the beginning of a vowel sound (Abramson and Whalen 2017). Differences in VOT provide cues for discriminating phonemes, such as /ba/ and /pa/, hence its importance in phonetics and the need to know its neural representation. The ability of VCN and VNLL onset cells to detect and encode gaps suggests that onset cells can accurately encode VOTs in their discharge times.
Acknowledgments
Thanks to histologists J. Ekleberry, J. Meister, and I. Sigglekow, to R. Kochhar for programming support, to K. Yentner for neuron reconstruction, to Philip Joris for all his help at KUL, and to Donata Oertel and David Ryugo for critiquing the manuscript. We also thank the two anonymous reviewers for their suggestions and comments.
Author Contributions
A.R.S. and W.S.R performed all aspects of this research, including designing the experiments, performing the experiments, analyzing the data, and writing the manuscript.
Funding Information
The project was funded by the NIH-NIDCD DC17590, the Human Frontier Science Program, the Fund for Scientific Research-Flanders (G.0714.09), the Research Fund University of Leuven (OT/09/50), and the European Regional Development Fund.
Compliance with Ethical Standards
Experiments were performed at the University of Wisconsin, Madison, USA, and Katholieke Universiteit Leuven, Leuven, Belgium. At both locations, the work conformed to the animal use standards of the National Institutes of Health, USA, and was approved by the local animal care committee.
Competing Interests
The authors declare that they have no competing interests.
Footnotes
Publisher’s Note
Springer Nature remains neutral with regard to jurisdictional claims in published maps and institutional affiliations.
Contributor Information
Alberto Recio-Spinoso, Email: reci0001@umn.edu.
William S. Rhode, Email: wrhode@hotmail.com
References
- Abramson AS, Whalen DH. Voice onset time (VOT) at 50: theoretical and practical issues in measuring voicing distinctions. J Phon. 2017;63:75–86. doi: 10.1016/j.wocn.2017.05.002. [DOI] [PMC free article] [PubMed] [Google Scholar]
- Adams JC. Projections from octopus cells of the posteroventral cochlear nucleus to the ventral nucleus of the lateral lemniscus in cat and human. Auditory Neurosci. 1997;3:335–350. [Google Scholar]
- Aertesen AMHJ, Johannesma PIM. Spectro-temporal receptive fields of auditory neurons in the grassfrog. Biol Cybernetics. 1980;38:223–234. doi: 10.1007/BF00342772. [DOI] [PubMed] [Google Scholar]
- Aitkin LM, Anderson DJ, Brugge JF. Tonotopic organization and discharge characteristics of single neurons in nuclei of the lateral lemniscus of the cat. J Neurophysiol. 1970;33:421–440. doi: 10.1152/jn.1970.33.3.421. [DOI] [PubMed] [Google Scholar]
- Batra R, Fitzpatrick DC. Discharge patterns of neurons in the ventral nucleus of the lateral lemniscus of the unanesthetized rabbit. J Neurophysiol. 1999;82:1097–1113. doi: 10.1152/jn.1999.82.3.1097. [DOI] [PubMed] [Google Scholar]
- Bell A, Wit HP. Cochlear impulse responses resolved into set of gammatones: the case for beating of closely spaced local resonances. PeerJ. 2018;6:e6016. doi: 10.7717/peerj.6016. [DOI] [PMC free article] [PubMed] [Google Scholar]
- Berger C, Meyer EMM, Ammer JJ, Felmy F. Large somatic synapses on neurons in the ventral lateral lemniscus work in pairs. J Neurosci. 2014;34:3237–3246. doi: 10.1523/JNEUROSCI.3664-13.2014. [DOI] [PMC free article] [PubMed] [Google Scholar]
- Borst JGG. The low synaptic release probability in vivo. Trends Neurosci. 2010;33:259–266. doi: 10.1016/j.tins.2010.03.003. [DOI] [PubMed] [Google Scholar]
- Britt R, Starr A. Synaptic events and discharge patterns of cochlear nucleus cells. II Frequency-modulated tones. J Neurophysiol. 1976;39:179–194. doi: 10.1152/jn.1976.39.1.179. [DOI] [PubMed] [Google Scholar]
- Davis KA, Lomakin O, Pesavento MJ. Response properties of single units in the dorsal nucleus of the lateral lemniscus of decerebrate cats. J Neurophysiol. 2007;98:1475–1488. doi: 10.1152/jn.00451.2007. [DOI] [PubMed] [Google Scholar]
- Dicke U, Dau T. A functional point-neuron model simulating cochlear nucleus ideal onset responses. J Comput Neurosci. 2005;19:239–253. doi: 10.1007/s10827-005-1847-0. [DOI] [PubMed] [Google Scholar]
- Fekete DM, Rouiller EM, Liberman MC, Ryugo DK. The central projections of intracellularly labeled auditory nerve fibers in cats. J Comp Neurol. 1984;229:432–450. doi: 10.1002/cne.902290311. [DOI] [PubMed] [Google Scholar]
- Felix RA, II, Gourévitch B, Gómez-Álvarez M, Leijon SCM, Saldaña E, Magnusson AK. Octopus cells in the posteroventral cochlear nucleus provide the main excitatory input to the superior paraolivary nucleus. Front Neural Circuits. 2017;11:1–35. doi: 10.3389/fncir.2017.00037. [DOI] [PMC free article] [PubMed] [Google Scholar]
- Fujino K, Oertel D. Bidirectional synaptic plasticity in the cerebellum-like mammalian dorsal cochlear nucleus. Proc Natl Acad Sci U S A. 2003;100:265–270. doi: 10.1073/pnas.0135345100. [DOI] [PMC free article] [PubMed] [Google Scholar]
- Godfrey DA, Kiang NYS, Norris B. Single unit activity in the posteroventral cochlear nucleus of the cat. J Comp Neurol. 1975;162:247–268. doi: 10.1002/cne.901620206. [DOI] [PubMed] [Google Scholar]
- Goldberg JM, Brown PB. Response of binaural neurons of dog superior olivary complex to dichotic tonal stimuli: some physiological mechanisms of sound localization. J Neurophysiol. 1969;32:613–636. doi: 10.1152/jn.1969.32.4.613. [DOI] [PubMed] [Google Scholar]
- Golding NL, Oertel D. Synaptic integration in dendrites: exceptional need for speed. J Physiol. 2012;590:5563–5569. doi: 10.1113/jphysiol.2012.229328. [DOI] [PMC free article] [PubMed] [Google Scholar]
- Golding NL, Robertson D, Oertel D. Recordings from slices indicate that octopus cells of the cochlear nucleus detect coincident firing of auditory nerve fibers with temporal precision. J Neurosci. 1995;15:3138–3153. doi: 10.1523/JNEUROSCI.15-04-03138.1995. [DOI] [PMC free article] [PubMed] [Google Scholar]
- Gómez-Alvarez M, Gourévitch B, Felix RA, II, Nyberg T, Hernández-Montiel HL, Magnusson AK. Temporal information in tones, broadband noise and natural vocalizations is conveyed by differential spiking responses in the superior Paraolivary nucleus. Eur J Neurosci. 2018;48:2030–2049. doi: 10.1111/ejn.14073. [DOI] [PubMed] [Google Scholar]
- Harrison JM, Irving R. The organization of the posterior ventral cochlear nucleus in the rat. J Comp Neurol. 1966;126:391–401. doi: 10.1002/cne.901260303. [DOI] [PubMed] [Google Scholar]
- Joris PX, Smith PH (2011) Octopus cells: the temporally most accurate in the brain? Assoc Res Otolaryngol Abs 677
- Joris PX, Carney LH, Smith PH, Yin TC. Enhancement of neural synchronization in the anteroventral cochlear nucleus. I Responses to tones at the characteristic frequency J Neurophysiol. 1994;71:1022–1036. doi: 10.1152/jn.1994.71.3.1022. [DOI] [PubMed] [Google Scholar]
- Kadia SC, Wang X. Spectral integration in A1 of awake primates: neurons with single- and multipeaked tuning characteristics. J Neurophysiol. 2003;89:1603–1622. doi: 10.1152/jn.00271.2001. [DOI] [PubMed] [Google Scholar]
- Kalluri S, Delgutte B. Mathematical models of cochlear nucleus onset neurons: i. point neuron with many weak synaptic inputs. J Comput Neurosci. 2003;14:71–90. doi: 10.1023/a:1021128418615. [DOI] [PMC free article] [PubMed] [Google Scholar]
- Keller CH, Takahashi TT. Representation of temporal features of complex sounds by the discharge patterns of neurons in the owl’s inferior colliculus. J Neurophysiol. 2000;84:2638–2650. doi: 10.1152/jn.2000.84.5.2638. [DOI] [PubMed] [Google Scholar]
- Kim DG, Leonard G (1988) Responses of cochlear nucleus neurones to speech sounds. In: Moore BCJ, Patterson RD (eds) Auditory frequency selectivity, pp 281-288
- Kim PJ, Young ED. Comparative analysis of spectro-temporal receptive fields, reverse correlation functions, and frequency tuning curves of auditory-nerve fibers. J Acoust Soc Am. 1994;95:410–422. doi: 10.1121/1.408335. [DOI] [PubMed] [Google Scholar]
- Klatt DH. Software for a cascade/parallel formant synthesizer. J Acoust Soc Am. 1980;67:971–995. [Google Scholar]
- Kuenzel T. Modulatory influences on time-coding neurons in the ventral cochlear nucleus. Hear Res. 2019;384:107824. doi: 10.1016/j.heares.2019.107824. [DOI] [PubMed] [Google Scholar]
- Kuenzel T, Borst JGG, van der Heijden M. Factors controlling the input-output relationship of spherical bushy cells in the gerbil cochlear nucleus. J Neurosci. 2011;31:4260–4273. doi: 10.1523/JNEUROSCI.5433-10.2011. [DOI] [PMC free article] [PubMed] [Google Scholar]
- Louage DHG, van der Heijden M, Joris PX. Enhanced temporal response properties of anteroventral cochlear nucleus neurons to broadband noise. J Neurosci. 2005;25:1560–1570. doi: 10.1523/JNEUROSCI.4742-04.2005. [DOI] [PMC free article] [PubMed] [Google Scholar]
- Lu H-W, Smith PH, Joris PX. Submillisecond monaural coincidence detection by octopus cells. Acta Acust United Acust. 2018;104:852–855. [Google Scholar]
- Mardia KV. Statistics of directional data. London: Academic Press; 1972. [Google Scholar]
- McGinley MC, Liberman MC, Bal R, Oertel D. Generating synchrony from the asynchronous: compensation for cochlear traveling wave delays of individual brainstem neurons. J Neurosci. 2012;32:9301–9311. doi: 10.1523/JNEUROSCI.0272-12.2012. [DOI] [PMC free article] [PubMed] [Google Scholar]
- Moore BCJ. An introduction to the psychology of hearing. Brill: Sixth Edition; 2012. [Google Scholar]
- Oertel D. Encoding of timing in the brain stem auditory nuclei of vertebrates. Neuron. 1997;19:959–962. doi: 10.1016/s0896-6273(00)80388-8. [DOI] [PubMed] [Google Scholar]
- Oertel D, Wickesberg RE (2002) Ascending pathways through ventral nuclei of the lateral lemniscus and their possible role in pattern recognition in natural sounds. In: Oertel D, Fay RR (eds) Integrative functions in the mammalian auditory pathway, Springer, pp 207–237
- Oertel D, Bal R, Gardner SM, Smith PH, Joris PX. Detection of synchrony in the activity of auditory nerve fibers by octopus cells of the mammalian cochlear nucleus. Proc Natl Acad Sci U S A. 2000;97:11773–11779. doi: 10.1073/pnas.97.22.11773. [DOI] [PMC free article] [PubMed] [Google Scholar]
- Oertel D, Cao X-J, Ison JR, Allen PD. Cellular computations underlying detection of gaps in sounds and lateralizing sound sources. Trends Neurosci. 2017;40:613–624. doi: 10.1016/j.tins.2017.08.001. [DOI] [PMC free article] [PubMed] [Google Scholar]
- Oertel D, Cao X-J, Recio-Spinoso A (2018) The cochlear nuclei: synaptic plasticity in circuits and synapses in the ventral cochlear nuclei. In: Kandler K (ed) The Oxford handbook of the auditory brainstem, Oxford University Press. 10.1093/oxfordhb/9780190849061.013.4
- Osen KK. Cytoarchitecture of the cochlear nuclei in the cat. J Comp Neurol. 1969;136:453–483. doi: 10.1002/cne.901360407. [DOI] [PubMed] [Google Scholar]
- Palmer AR, Winter IM (1993) Coding of fundamental frequency of voiced speech sounds and harmonic complex tones in the ventral cochlear nucleus. In: Merchan MA, Juiz DA, Godfrey DA, Mugnaini (eds) Mammalian cochlear nuclei. Plenum, pp 373–384
- Recio-Spinoso A. Enhancement and distortion in the temporal representation of sounds in the ventral cochlear nucleus of chinchillas and cats. PLoS One. 2012;7:e44286. doi: 10.1371/journal.pone.0044286. [DOI] [PMC free article] [PubMed] [Google Scholar]
- Recio-Spinoso A, Joris PX. Temporal properties of responses to sound in the ventral nucleus of the lateral lemniscus. J Neurophysiol. 2014;111:817–835. doi: 10.1152/jn.00971.2011. [DOI] [PMC free article] [PubMed] [Google Scholar]
- Recio-Spinoso A, Narayan SS, Ruggero MA. Basilar membrane responses to noise at a basal site of the chinchilla cochlea: quasi-linear filtering. J Assoc Res Otolaryngol. 2009;10:471–484. doi: 10.1007/s10162-009-0172-0. [DOI] [PMC free article] [PubMed] [Google Scholar]
- Rhode WS. Temporal coding of 200% amplitude modulated signals in the ventral cochlear nucleus of cat. Hear Res. 1994;77:43–68. doi: 10.1016/0378-5955(94)90252-6. [DOI] [PubMed] [Google Scholar]
- Rhode WS. Neural encoding of single-formant stimuli in the ventral cochlear nucleus of the chinchilla. Hear Res. 1998;117:39–56. doi: 10.1016/s0378-5955(98)00002-1. [DOI] [PubMed] [Google Scholar]
- Rhode WS, Greenberg S. Encoding of amplitude modulation in the cochlear nucleus of the cat. J Neurophysiol. 1994;71:1797–1825. doi: 10.1152/jn.1994.71.5.1797. [DOI] [PubMed] [Google Scholar]
- Rhode WS, Kettner RE. Physiological study of neurons in the dorsal and posteroventral cochlear nucleus of the unanesthetized cat. J Neurophysiol. 1987;57:414–442. doi: 10.1152/jn.1987.57.2.414. [DOI] [PubMed] [Google Scholar]
- Rhode WS, Smith PH. Encoding timing and intensity in the ventral cochlear nucleus of the cat. J Neurophysiol. 1986;56:261–286. doi: 10.1152/jn.1986.56.2.261. [DOI] [PubMed] [Google Scholar]
- Rhode WS, Oertel D, Smith PH. Physiological response properties of cells labeled intracellularly with horseradish peroxidase in cat ventral cochlear nucleus. J Comp Neurol. 1983;213:448–463. doi: 10.1002/cne.902130408. [DOI] [PubMed] [Google Scholar]
- Rice SO. Mathematical analysis of random noise. Bell Syst Tech J. 1945;27:46–156. [Google Scholar]
- Rouiller EM, Ryugo DK. Intracellular marking of physiologically characterized cells in the ventral cochlear nucleus of the cat. J Comp Neurol. 1984;225:167–186. doi: 10.1002/cne.902250203. [DOI] [PubMed] [Google Scholar]
- Sakitt B. Indices of discriminability. Nature. 1973;241:133–134. doi: 10.1038/241133a0. [DOI] [PubMed] [Google Scholar]
- Shannon RV, Zeng F-G, Kamath V, Wygonski J, Ekelid M. Speech recognition with primarily temporal cues. Science. 1995;270:303–304. doi: 10.1126/science.270.5234.303. [DOI] [PubMed] [Google Scholar]
- Smith PH, Massie A, Joris PX. Acoustic stria: anatomy of physiologically characterized cells and their axonal projection patterns. J Comp Neurol. 2005;482:349–371. doi: 10.1002/cne.20407. [DOI] [PubMed] [Google Scholar]
- Trussell LO (2018) In vitro studies of neuromodulation and plasticity in the dorsal cochlear nucleus. In: Kandler K (ed) The Oxford handbook of the auditory brainstem, Oxford University Press. 10.1093/oxfordhb/9780190849061.013.5
- Vater M, Covey E, Casseday JH. The columnar region of the ventral nucleus of the lateral lemniscus in the big brown bat (Eptesicus fuscus): synaptic arrangements and structural correlates of feedforward inhibitory function. Cell Tissue Res. 1997;289:223–233. doi: 10.1007/s004410050869. [DOI] [PubMed] [Google Scholar]
- Viemeister NF, Plack CJ (1993) Time analysis. In: Yost WA, Popper AN, Fay RR (eds.) Human Psychophysics, Springer-Verlag pp. 116–154
- Viemeister NF, Shivapuja BG, Recio A (1992) Physiological correlates of temporal integration. In: Cazals Y, Horner K, Demany L (eds.) Auditory Physiology and Perception, Pergamon pp. 323–330
- Werner LA, Folsom RC, Mancl RL, Syapin CL. Human auditory brainstem responses to temporal gaps in noise. J Speech Lang Hear Res. 2001;44:737–750. doi: 10.1044/1092-4388(2001/058). [DOI] [PubMed] [Google Scholar]
- Winter IM, Palmer AR. Level dependence of cochlear nucleus onset unit responses and facilitation by second tones or broadband noise. J Neurophysiol. 1995;73:141–159. doi: 10.1152/jn.1995.73.1.141. [DOI] [PubMed] [Google Scholar]
- Wu SH. Physiological properties of neurons in the ventral nucleus of the lateral lemniscus of the rat: intrinsic membrane properties and synaptic responses. J Neurophysiol. 1999;81:2862–2874. doi: 10.1152/jn.1999.81.6.2862. [DOI] [PubMed] [Google Scholar]
- Yang H, Xu-Friedman MA. Skipped-stimulus approach reveals that short-term plasticity dominates synaptic strength during ongoing activity. J Neurosci. 2015;35:8297–8307. doi: 10.1523/JNEUROSCI.4299-14.2015. [DOI] [PMC free article] [PubMed] [Google Scholar]
- Young ED, Sachs MB. Representation of steady-state vowels in the temporal aspects of the discharge patterns of populations of auditory-nerve fibers. J Acoust Soc Am. 1979;66:1381–1403. doi: 10.1121/1.383532. [DOI] [PubMed] [Google Scholar]
- Zeng F-G, Kong Y-Y, Michalewski HJ, Starr A. Perceptual consequences of disrupted auditory nerve activity. J Neurophysiol. 2005;93:3050–3063. doi: 10.1152/jn.00985.2004. [DOI] [PubMed] [Google Scholar]
- Zhao M, Wu SH. Morphology and physiology of neurons in the ventral nucleus of the lateral lemniscus in rat brain slices. J Comp Neurol. 2001;433:255–271. doi: 10.1002/cne.1139. [DOI] [PubMed] [Google Scholar]