

Abstract
This article puts forward a technique for extracting the density of trap states (DOST) distribution based on the transient photo-voltage (TPV) measurement result. We prove that when the TPV result is linear, the DOST distribution is exponential type and vice versa. Compared to the approach based on the space charge limited current measurement, the method given in this paper has the advantage of requiring less calculation. The results obtained by our method provides a guidance for preparing less trap states solar cells.
Subject terms: Chemical physics, Electronic properties and materials
Introduction
In order to improve the photo-voltaic performance of perovskite solar cells (PSCs), we need to further explore the mechanism such as carrier mobility1–3, ion migration4–8, density of trap states (DOST) distribution9–13, carrier recombination14–18 and so on. The DOST distribution is a crucial factor that determines the photovoltaic performance of PSCs19–33. According to the literatures in recent years19–23, current density–voltage (J–V) hysteresis is caused by the ion migration and trap assisted carrier recombination. The DOST distribution affects the carrier recombination24–27, influences the open circuit voltage28–30, and hinders the enhancement of power conversion efficiency (PCE)31–34. The DOST distribution cannot be obtained by experimental measurement directly. There are only few methods for the extraction of DOST distribution. The space charge limited current (SCLC) method uses the deconvolution to extract the DOST distribution35–40, based on the measured J–V data at different temperatures. Walter et al.41–45 put forward the impedance spectroscopy (IS) method to extract the DOST distribution. They extract the DOST distribution based on the plot of equivalent chemical capacitance versus frequency given by IS measurement41–45. They regard the capture and de-capture of carrier by the trap states in the PSCs as charging and discharging of the equivalent chemical capacitance41. They put forward the formula DOST (Eω) = (Vbi/eW)(dC/dω)(ω/kB) to extract the DOST distribution41–45. Here, C is the equivalent chemical capacitance. ω is the angular frequency of the ac signal. Vbi is the built-in electric voltage. W is the depletion width. kB is the Boltzmann constant. e is the elementary charge. The corresponding energy level is calculated by the formula Eω = kBTln(ω0/ω), where T is the ambient temperature and ω0 is the attempt-to-escape frequency41–45. Wang et al.46 proposed a transient photo-voltage (TPV) method for DOST distribution extraction. Based on the hypothesis of exponential type DOST distribution46–49, multiple-trapping model46,50–52, and the zero-temperature approximation46,52, they find that when the DOST distribution is exponential type, the logarithm of carrier lifetime and the photo-voltage satisfy linear relation. They use this relation to extract the DOST distribution based on the TPV result46–48. Because of the hypothesis of exponential type distribution46–49, their method is effective only when the TPV result is linear. The DOST distribution extracted by their method is an exponential type distribution46–48.
However, according to the TPV experiments reported in recent years46–48, the majority of TPV results are non-linear. In these cases, the method of Wang et al. is not effective to extract the DOST distribution. In this article, we put forward a new technique for extraction of DOST distribution based on the TPV measurement result. We give up the hypothesis of exponential type DOST distribution46–49 and zero-temperature approximation46,52. The method given in our work is based on the single hypothesis of multiple-trapping model46,50–52. Our method is effective for arbitrary TPV results and can be used to extract general type DOST distribution.
Results and discussion
Establishment of theory and method
In this section, we establish the equation for the extraction of DOST distribution based on the TPV result.
Because of the trap states in the perovskite absorber layer, the behavior of trapping and de-trapping of carrier by the trap states determines the recombination rate, which can be described by the multiple-trapping model46,50–52. According to the multiple-trapping model, the relation of carrier lifetime τn and the free carrier lifetime τf satisfies46,50–52
| 1 |
Here n = nt + nc denotes the sum of electron density in trap states nt and electron density in conduct band nc.
Therefore, we have
| 2 |
which can be rewritten as
| 3 |
The density of electron in trap states satisfies46,52
| 4 |
Here denotes the DOST distribution. denotes the Fermi–Dirac distribution53.
Therefore, we have
| 5 |
According to the Fermi–Dirac distribution53, we have
| 6 |
We rewrite Eq. (6) as
| 7 |
The carrier density in conductor band satisfies46,52,53
| 8 |
Here Nc is the density of effective states in conduction band. Ec is the conduction band energy level position53.
Therefore, we have
| 9 |
According to Eqs. (3), (7), and (9), we have
| 10 |
We rewrite Eq. (10) as
| 11 |
Substituting the Fermi–Dirac distribution into Eq. (11), we have
| 12 |
We rewrite Eq. (12) as
| 13 |
We define a derivation factor
| 14 |
and rewrite Eq. (13) as
| 15 |
According to the TPV result, the carrier lifetime is a function of photo-voltage46–49. Therefore, we rewrite Eq. (15) as
| 16 |
Equation (16) is the fundamental equation of our method. The right-hand side of Eq. (16) can be obtained from experimental measurement. τn(Vph) can be measured from TPV experiment. nc can be obtained from differential charging method5 or from SCLC under different intensity of illumination39. We can use absorbance spectrum, Kelvin probe (KP), ultraviolet photoemission spectroscopy (UPS), and X-ray photoelectron spectroscopy (XPS) to get conduction band energy level position Ec, valence band energy level position Ev, Fermi energy level position EF0 and band gap Eg35, respectively. After getting the conductor band electron density in dark n0 and in different intensity of illumination nc, according to the relation EFn = EF0 + kBTln(nc/n0)53, we obtain the electron quasi Fermi energy level EFn corresponding to the photo-voltage Vph in the different intensity of illumination. The free carrier lifetime τf can be measured or can be calculated according to the equationτf = 1/CnNt54. Here, Nt is the electron trap concentration. Cn denotes the capture coefficients for electrons. Since the left-hand side of Eq. (16) is the convolution integral of the DOST distribution and the derivative factor, we can get the DOST distribution by deconvolution. We use the numerical deconvolution function ([q,r] = deconv(u,v)) of MATLAB to solve the equation for DOST distribution.
For intrinsic perovskite, the electron density in conductor band satisfies53
| 17 |
Here is the electron density in conductor band at dark state53.
Substituting Eq. (17) into Eq. (16), we have
| 18 |
Equation (18) is the fundamental equation for DOST distribution extraction of intrinsic perovskite. Similarly, we obtain the DOST distribution using numerical deconvolution function in MATLAB. The parameters used for calculation are list in Table 127,35.
Table 1.
| Sym | Description | Value |
|---|---|---|
| e | Elementary charge | 1.60 × 10⁻¹⁹ C |
| kB | Boltzmann constant | 1.38 × 10⁻²³ JK−1 |
| Ec | Conduction band minimum | − 4.18 eV |
| Eg | Band gap | 1.52 eV |
| EF0 | Fermi energy level | − 4.3 eV |
| T | Ambient temperature | 300 K |
| Nc | Conduction band DoS | 1 × 1024 m−3 |
| Cn | Electron trap coefficients | 1 × 10–15 m3 s−1 |
| Nt | Electron trap concentration | 1 × 10¹⁹ m−3 |
Exponential type DOST distribution
In this section, we explore the exponential type DOST distribution. Wang et al.46 find that for the exponential type DOST distribution, the logarithm of carrier lifetime is proportional to the photo-voltage (TPV result). The proof of this relation is shown as follows.
The exponential type DOST distribution satisfies46–49
| 19 |
Here, EB is the characteristic energy and NT is the total density of the trapped state. Substituting formula (19) into formula (4), and taking zero-temperature approximation46,52, we have
| 20 |
Making the approximation of n ≈ nT50, we rewrite the multiple-trapping model46,50–52 as
| 21 |
which is equivalent to
| 22 |
The electron density in conductor band satisfies53
| 23 |
According to Eqs. (20), (22), and (23) and from the relation of EFn = EFp + eVph, we have
| 24 |
Here .
We write Eq. (24) as linear mathematical form lnτn = aVph + b.
Here, a = e/EB − e/kBT, b = lnA.
Therefore, we finish the proof of this relation. Note that for the intrinsic perovskite, Eq. (24) can be written as
| 25 |
Here . We write Eq. (25) as linear form lnτn = aVph + b. Here, a = e/2 EB− e/2kBT, b = lnA.
Similarly, we can also prove that when TPV result is linear, the extracted DOST distribution is exponential type. Details of the proof are given in the supporting information. We can use this relation to extract the DOST distribution when the TPV result is linear. Below, this method is called analytic method.
We can use the analytic method to verify the validity of our numerical method. We use both our numerical method and the analytic method to extract the DOST distribution and make a comparison. In Fig. 1a–c, we set the b = − 5 and the slope parameter a as − 1.5, − 2 and − 2.5, respectively. Using the analytic method, we derive EB and NT (see Table 2). Figure 1d–f shows the extracted DOST distributions from Fig. 1a–c using our numerical method. As expected by the analytic method, the DOST distribution is exponential type. In order to compare with the DOST distribution extracted by analytic method, we use the exponential fitting (f(E) = cexp(dE)) to calculate the EB and NT (see Table 2). As shown in Table 2, the EB and NT calculated by our numerical method are consistent with the EB and NT calculated by the analytic method, indicating that the numerical algorithm to do the deconvolution in our calculation is reliable. We explain the slight deviation of EB and NT extracted by the two methods as follows. The analytic method is established based on the three hypothesis of multiple-trapping model46,50–52, zero-temperature approximation46,52, and exponential type DOST distribution46–49. Our numerical method is established based on the unique hypothesis of multiple-trapping model46,50–52. Therefore, the slight deviation of EB and NT extracted by the two methods is attributed to the zero-temperature approximation and the fitting error.
Figure 1.

(a)–(c) Plots of carrier lifetime versus photo-voltage. We set b = − 5 and a as − 1.5, − 2 and − 2.5, respectively. (d)–(f) DOST distributions extracted from (a)–(c), respectively. The blue dots represent the extracted DOST distributions, the red lines represent the exponential fitting of extracted DOST distributions.
Table 2.
Exponential fitting coefficients, distribution coefficients calculated from Fig. 2.
| Coefficients | Example 1 | Example 2 | Example 3 |
|---|---|---|---|
| Chosen parameters | |||
| a | − 1.5 | − 2.0 | − 2.5 |
| b | − 5 | − 5 | − 5 |
| Exponential fitting | |||
| c (exponential fitting) | 1.525 × 1034 | 7.536 × 1033 | 3.666 × 1033 |
| d (exponential fitting) | − 2.542 × 10²⁰ | − 2.466 × 10²⁰ | − 2.388 × 10²⁰ |
| R-square | 1 | 1 | 1 |
| Calculation result | |||
| EB(analytic method) | 28.0 meV | 28.8 meV | 29.7 meV |
| EB(our method) | 24.6 meV | 25.3 meV | 26.1 meV |
| NT(analytic method) | 7.3050 × 1013 cm−3 | 7.5158 × 1013 cm−3 | 7.7392 × 1013 cm−3 |
| NT(our method) | 5.9992 × 1013 cm−3 | 3.0560 × 1013 cm−3 | 1.5352 × 1013 cm−3 |
Non-exponential type DOST distribution
In this section, we investigate the non-exponential type DOST distribution. We take the TPV data in Ref.47 as an example. As shown in Fig. 2a,b, the TPV result is non-linear. Hence, we cannot use the analytic method to extract the DOST distribution.
Figure 2.

Plots of carrier lifetime versus photo-voltage given by TPV measurement47. The black lines represent the result of TPV measurement. The red lines represent linear fitting in the subintervals. (a) shows the linear fittings of TPV in two subintervals, respectively. (b) shows the linear fittings of TPV in three subintervals, respectively.
To overcome this difficulty, Wang et al.47 made a linear fitting in the subintervals of 0.05–0.6 V and 0.6–0.91 V (see Fig. 2a). They used formula (24) to get two values of EB in these two subintervals, respectively47. They explained these two EB as two types of exponential type DOST distribution (They called them as deep trap type and shallow trap type)47. However, there are some difficulties in their method. (1) Equation (24) is derived from one exponential type DOST distribution, not the two types of DOST distribution (deep trap state type DOST distribution and shallow trap state type DOST distribution). We cannot derive Eq. (24) based on these two types of distribution. (2) There is no clear boundary for deep and shallow trap. So the definition of deep and shallow trap is ambiguous. (3) It is more accurate to take linear fittings in three subintervals, respectively (see Fig. 2b). According to the differential theory, we can divide the photo-voltage interval into infinite differential subintervals and use Eq. (24) to calculate the EB in these differential subintervals, respectively. These EB cannot be explained by the concept of deep and shallow trap.
Our method is effective for arbitrary TPV results, which can be used to extract general type DOST distribution. Using our method, we extract the DOST distribution (as illustrated in Fig. 3). It can be seen that the extracted DOST distribution is not an exponential type distribution. Compared to the method given by Wang et al., our method is more accurate and it can give the fine structure of DOST distribution.
Figure 3.
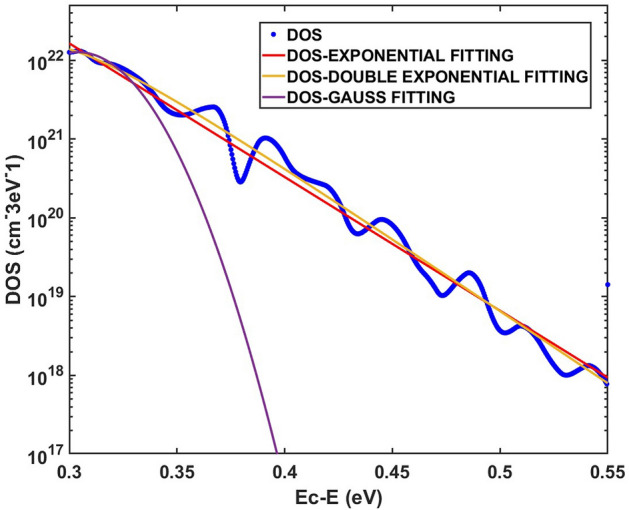
DOST distribution calculated by our method given in this article. The blue dots represent the extracted DOST distribution. The red, yellow and purple lines represent the exponential, double exponential and Gauss fittings for the extracted DOST distribution, respectively.
We make the exponential, double exponential and Gauss fittings for the extracted DOST distribution, respectively (see Fig. 3). The R-square (Coefficient of determination) of these fittings are given in Table 3. It can be see that the R-square of double exponential fitting is larger than the exponential fitting and Gauss fitting, indicating that the DOST distribution is more consistent with the double exponential type distribution than with the exponential type distribution. Therefore, when the TPV result is non-linear, the extracted DOST distribution is non-exponential type.
Table 3.
Different type fitting for extracted DOST distribution.
| Fitting type | Exponential | Double exponential | Gauss |
|---|---|---|---|
| R-square | 0.9679 | 0.9864 | 0.9331 |
Calculation example
In this section, we give some examples of DOST distribution extraction using our method. We take the TPV data in Ref.47 as an example. Figure 4a–c shows the TPV results for meso-structured perovskite solar cells with large, middle and small size of perovskite grain, respectively. Using our method, we extract the DOST distributions from Fig. 4a–c, respectively, (as shown in Fig. 4d–f).
Figure 4.

(a)–(c) TPV results for meso-structured perovskite solar cells with large, middle and small size of perovskite grain47. (d)–(f) DOST distributions extracted by our method from (a)–(c), respectively.
For comparing, we plot the extracted DOST distributions in Fig. 5. Using the formula , we calculate the total amount of trap states for three solar cells. We derived Ttotal = 5.4431 × 1020 cm−3 (large size), Ttotal = 5.9096 × 1020 cm−3 (middle size) and Ttotal = 4.5628 × 1020 cm−3 (small size). It can be seen that the solar cell with small size of perovskite grain has the least amount of trap states. This result could give a guidance for preparing perovskite solar cells with less trap states.
Figure 5.
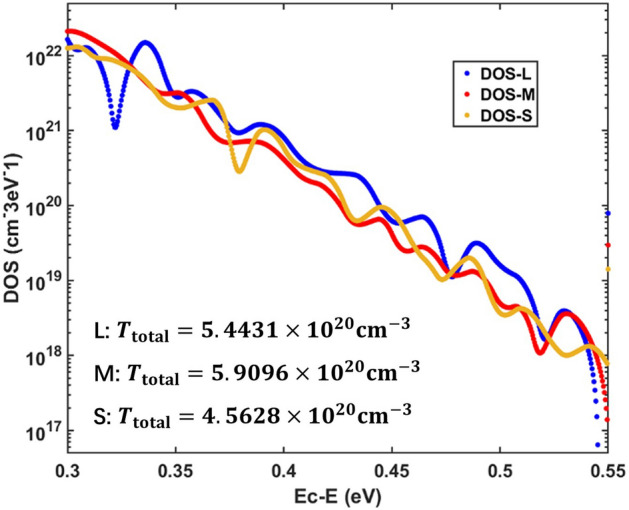
DOST distributions for meso-structured perovskite solar cells with large, middle and small size of perovskite grain extracted by our method given in this paper.
Comparison to SCLC method
SCLC measurement gives the relation of current density and voltage at different temperatures (j = j (U, T)). For SCLC method, we extract the DOST distribution adopting the equations listed as follows35–40
| 26 |
| 27 |
| 28 |
| 29 |
| 30 |
Here j denotes the current density. U denotes the voltage. Ea is the activation energy. m, B, C are the parameters for calculation. L is the thickness of perovskite absorber layer. e is the elementary charge. ε is the dielectric constant of perovskite absorber layer. Based on the SCLC measurement result, we need to calculate Ea, m, B, C and finally use Eq. (30) to extract the DOST by deconvolution35–40. The calculations of Ea, m, B, C are complicated. For our method, we only need to use formula (18) to extract the DOST distribution by deconvolution. Therefore, our method takes less computation.
Conclusion
In conclusion, this article presents a new technique for DOST distribution extraction based on the TPV measurement result. The approach given in this paper is effective for extraction of general type DOST distribution. We prove that when the TPV result is linear, the DOST distribution is exponential type and vice versa. Our method needs less computation than the SCLC method. The obtained results provide a guidance for preparing perovskite solar cells with less trap states.
Methods
The transient photo-voltage measurement is an effective technique for the study of carrier recombination3,46–49. Figure 6a shows the typical TPV measurement result. Figure 6b shows the mechanism of TPV experiment. Photo-voltaic device is held under open circuit. At the start of the TPV experiment, we use a steady-state bias light to illuminate the device until the equilibrium between generation and recombination is established. The steady-state bias light produces a bias photo-voltage Vph. As a result, the Fermi energy level EF0 changes to electron quasi Fermi energy level EFn and hole quasi Fermi energy level EFp. Thereafter, we apply an additional small light pulse to the device. With the perturbation of small light pulse, the photo-voltage increases to Vph + ΔV. The electron quasi Fermi energy level EFn shifts to , and the hole quasi Fermi energy level EFp to . After switching off the small light pulse source, due to carrier recombination, the photo-voltage decays exponentially until it reaches the bias value Vph. The electron quasi Fermi energy level comes back to EFn from and the hole quasi Fermi energy level comes back to EFp from .The carrier lifetime τn is defined as the time taken for the photo-voltage to decay from Vph + ΔV to Vph + ΔV/e. Here, e is the natural constant. By tuning the intensity of steady-state bias light I, we get the relation between the photo-voltage Vph and carrier lifetime τn, which is written as τn = τn(Vph) (TPV result)46–49.
Figure 6.

(a) Result of TPV measurement. (b) Mechanism of TPV experiment.
Supplementary information
Acknowledgements
The author is grateful to N.-H.T. for his helpful comments.
Author contributions
The whole work of this article is finished by Z.L.
Competing interests
The author declares no competing interests.
Footnotes
Publisher's note
Springer Nature remains neutral with regard to jurisdictional claims in published maps and institutional affiliations.
Supplementary information
is available for this paper at 10.1038/s41598-020-69914-y.
References
- 1.Khan MT, Salado M, Almohammedi A, Kazim S, Ahmad S. Elucidating the impact of charge selective contact in halide perovskite through impedance spectroscopy. Adv. Mater. Interfaces. 2019;6:1901193. [Google Scholar]
- 2.Juška G, Arlauskas K, Viliūnas M, Kočka J. Extraction current transients: new method of study of charge transport in microcrystalline silicon. Phys. Rev. Lett. 2000;84:4946–4949. doi: 10.1103/PhysRevLett.84.4946. [DOI] [PubMed] [Google Scholar]
- 3.Mäckel H, MacKenzie RCI. Determination of charge-carrier mobility in disordered thin-film solar cells as a function of current density. Phys. Rev. Appl. 2018;9:034020. [Google Scholar]
- 4.Senocrate A, et al. The nature of ion conduction in methylammonium lead iodide: a multimethod approach. Angew. Chem. Int. Ed. 2017;56:7755–7759. doi: 10.1002/anie.201701724. [DOI] [PMC free article] [PubMed] [Google Scholar]
- 5.Yang T, Gregori G, Pellet N, Grätzel M, Maier J. The significance of ion conduction in a hybrid organic-inorganic lead-iodide-based perovskite photosensitizer. Angew. Chem. Int. Ed. 2015;54:7905–7910. doi: 10.1002/anie.201500014. [DOI] [PubMed] [Google Scholar]
- 6.Yuan Y, Huang J. Ion migration in organometal trihalide perovskite and its impact on photovoltaic efficiency and stability. Acc. Chem. Res. 2016;49:286–293. doi: 10.1021/acs.accounts.5b00420. [DOI] [PubMed] [Google Scholar]
- 7.Eames C, et al. Ionic transport in hybrid lead iodide perovskite solar cells. Nat. Commun. 2015;6:7497. doi: 10.1038/ncomms8497. [DOI] [PMC free article] [PubMed] [Google Scholar]
- 8.Levine I, et al. Interface-dependent ion migration/accumulation controls hysteresis in mapbi3 solar cells. J. Phys. Chem. C. 2016;120:16399–16411. [Google Scholar]
- 9.Kearney K, et al. Computational analysis of the interplay between deep level traps and perovskite solar cell efficiency. J. Am. Chem. Soc. 2018;140:15655–15660. doi: 10.1021/jacs.8b06002. [DOI] [PubMed] [Google Scholar]
- 10.Bai Y, et al. Oligomeric silica-wrapped perovskites enable synchronous defect passivation and grain stabilization for efficient and stable perovskite photovoltaics. ACS Energy Lett. 2019;4:1231–1240. [Google Scholar]
- 11.Li X, et al. Furrowed hole-transport layer using argon plasma in an inverted perovskite solar cell. New J. Chem. 2019;43:14625. [Google Scholar]
- 12.Cai F, et al. Ionic additive engineering toward high-efficiency perovskite solar cells with reduced grain boundaries and trap density. Adv. Funct. Mater. 2018;28:1801985. [Google Scholar]
- 13.Shi D, et al. Low trap-state density and long carrier diffusion in organolead trihalide perovskite single crystals. Science. 2015;347:519–522. doi: 10.1126/science.aaa2725. [DOI] [PubMed] [Google Scholar]
- 14.Calado P, et al. Identifying dominant recombination mechanisms in perovskite solar cells by measuring the transient ideality factor. Phys. Rev. Appl. 2019;11:044005. [Google Scholar]
- 15.Kirchartz T, Pieters BE, Kirkpatrick J, Rau U, Nelson J. Recombination via tail states in polythiophene: fullerene solar cells. Phys. Rev. B. 2011;83:115209. [Google Scholar]
- 16.Ostroverkhova O. Organic optoelectronic materials: mechanisms and applications. Chem. Rev. 2016;116:13279–13412. doi: 10.1021/acs.chemrev.6b00127. [DOI] [PubMed] [Google Scholar]
- 17.Sherkar TS, Momblona C, Gil-Escrig L, Bolink HJ, Koster LJA. Improving perovskite solar cells: insights from a validated device model. Adv. Energy Mater. 2017;7:1602432. [Google Scholar]
- 18.Ren X, Wang Z, Sha WEI, Choy WCH. Exploring the way to approach the efficiency limit of perovskite solar cells by drift-diffusion model. ACS Photonics. 2017;4:934–942. [Google Scholar]
- 19.Shao Y, Xiao Z, Bi C, Yuan Y, Huang J. Origin and elimination of photocurrent hysteresis by fullerene passivation in ch3nh3pbi3 planar heterojunction solar cells. Nat. Commun. 2014;5:5784. doi: 10.1038/ncomms6784. [DOI] [PubMed] [Google Scholar]
- 20.van Reenen S, Kemerink M, Snaith HJ. Modeling anomalous hysteresis in perovskite solar cells. J. Phys. Chem. Lett. 2015;6:3808–3814. doi: 10.1021/acs.jpclett.5b01645. [DOI] [PubMed] [Google Scholar]
- 21.Richardson G, et al. Can slow-moving ions explain hysteresis in the current voltage curves of perovskite solar cells. Energy Environ. Sci. 2016;9:1476–1485. [Google Scholar]
- 22.Calado P, et al. Evidence for ion migration in hybrid perovskite solar cells with minimal hysteresis. Nat. Commun. 2016;7:13831. doi: 10.1038/ncomms13831. [DOI] [PMC free article] [PubMed] [Google Scholar]
- 23.Courtier NE, Cave JM, Foster JM, Walker AB, Richardson G. How transport layer properties affect perovskite solar cell performance: insights from a couples charge transport/ion migration model. Energy Environ. Sci. 2019;12:396–409a. [Google Scholar]
- 24.Ran C, Xu J, Gao W, Huang C, Dou S. Defects in metal triiodide perovskite materials towards high-performance solar cells: origin, impact, characterization, and engineering. Chem. Soc. Rev. 2018;47:4581–4610. doi: 10.1039/c7cs00868f. [DOI] [PubMed] [Google Scholar]
- 25.Luo D, Su R, Zhang W, Gong Q, Zhu R. Minimizing non-radiative recombination losses in perovskite solar cells. Nat. Rev. Mater. 2020;5:44–60. [Google Scholar]
- 26.Lakhwani G, Rao A, Friend RH. Bimolecular recombination in organic photovoltaics. Annu. Rev. Phys. Chem. 2014;65:557–581. doi: 10.1146/annurev-physchem-040513-103615. [DOI] [PubMed] [Google Scholar]
- 27.Sherkar TS, et al. Recombination in perovskite solar cells: significance of grain boundaries, interface traps, and defect ions. ACS Energy Lett. 2017;2:1214–1222. doi: 10.1021/acsenergylett.7b00236. [DOI] [PMC free article] [PubMed] [Google Scholar]
- 28.Sandberg OJ, Sundqvist A, Nyman M, Österbacka R. Relating charge transport, contact properties, and recombination to open-circuit voltage in sandwich-type thin-film solar cells. Phys. Rev. Appl. 2016;5:044005. [Google Scholar]
- 29.Azzouzi M, Kirchartz T, Nelson J. Factors controlling open-circuit voltage losses in organic solar cells. Trends Chem. 2019;1:50–62. [Google Scholar]
- 30.Tress W, Leo K, Riede M. Dominating recombination mechanisms in organic solar cells based on znpc and c60. Appl. Phys. Lett. 2013;102:163901. [Google Scholar]
- 31.Zheng X, et al. Defect passivation in hybrid perovskite solar cells using quaternary ammonium halide anions and cations. Nat. Energy. 2017;2:17102. [Google Scholar]
- 32.Shiiba H, Nakayama M, Kasuga T, Grimes RW, Kilner JA. Calculation of arrangement of oxygen ions and vacancies in double perovskite gdbaco2o5+δ by first-principles dft with Monte Carlo simulations. Phys. Chem. Chem. Phys. 2013;15:10494–10499. doi: 10.1039/c3cp50316j. [DOI] [PubMed] [Google Scholar]
- 33.Saffari M, Mohebpour MA, Soleimani HR, Tagani MB. Dft analysis and fdtd simulation of ch3nh3pbi3-xclx mixed halide perovskite solar cells: role of halide mixing and light trapping technique. J. Phys. D. 2017;50:415501. [Google Scholar]
- 34.Kim J, Yun AJ, Gil B, Lee Y, Park B. Triamine-based aromatic cation as a novel stabilizer for efficient perovskite solar cells. Adv. Funct. Mater. 2019;29:1905190. [Google Scholar]
- 35.Adinolfi V, et al. The in-gap electronic state spectrum of methylammonium lead iodide single-crystal perovskites. Adv. Mater. 2016;28:3406–3410. doi: 10.1002/adma.201505162. [DOI] [PubMed] [Google Scholar]
- 36.Schauer F, Novotny R, Nešpůrek S. Space-charge-limited-current spectroscopy: possibilities and limitations. J. Appl. Phys. 1997;81:1244–1249. [Google Scholar]
- 37.Dacuña J, Salleo A. Modeling space-charge-limited currents in organic semiconductors: extracting trap density and mobility. Phys. Rev. B. 2011;84:195209. [Google Scholar]
- 38.Schauer F, Nešpůrek S, Valerián H. Temperature dependent space-charge-limited currents in amorphous and disordered semiconductors. J. Appl. Phys. 1996;80:880–888. [Google Scholar]
- 39.Pospisil J, et al. Density of bulk trap states of hybrid lead halide perovskite single crystals: temperature modulated space-charge-limited-currents. Sci. Rep. 2019;9:3332. doi: 10.1038/s41598-019-40139-y. [DOI] [PMC free article] [PubMed] [Google Scholar]
- 40.Krellner C, et al. Density of bulk trap states in organic semiconductor crystals: discrete levels induced by oxygen in rebrene. Phys. Rev. B. 2007;75:245115. [Google Scholar]
- 41.Walter T, Herberholz R, Müller C, Schock HW. Determination of defect distributions from admittance measurements and application to cu(in, ga)se2 based heterojunctions. J. Appl. Phys. 1996;80:4411–4420. [Google Scholar]
- 42.Duan H, et al. The identification and characterization of defect states in hybrid organic-inorganic perovskite photovoltaics. Phys. Chem. Chem. Phys. 2015;17:112–116. doi: 10.1039/c4cp04479g. [DOI] [PubMed] [Google Scholar]
- 43.von Hauff E. Impedance spectroscopy for emerging photovoltaics. J. Phys. Chem. C. 2019;123:11329–11346. [Google Scholar]
- 44.Lee B, et al. Aminosilane-modified cugao2 nanoparticles incorporated with cuscn as a hole-transport layer for efficient and stable perovskite solar cells. Adv. Mater. Interfaces. 2019;6:1901372. [Google Scholar]
- 45.Hwang T, et al. Electronic traps and their correlations to perovskite solar cell performance via compositional and thermal annealing controls. ACS Appl. Mater. Interfaces. 2019;11:6907–6917. doi: 10.1021/acsami.8b17431. [DOI] [PubMed] [Google Scholar]
- 46.Wang Y, et al. Correlation between energy and spatial distribution of intragap trap states in the tio2 photoanode of dye-sensitized solar cells. Chem. Phys. Chem. 2015;16:2253–2259. doi: 10.1002/cphc.201500075. [DOI] [PubMed] [Google Scholar]
- 47.Wang H, et al. Mechanism of biphasic charge recombination and accumulation in tio2 mesoporous structured perovskite solar cells. Phys. Chem. Chem. Phys. 2016;18:12128–12134. doi: 10.1039/c6cp01360k. [DOI] [PubMed] [Google Scholar]
- 48.Zhao J, et al. Charge carrier recombination dynamics in a bi-cationic perovskite solar cell. Phys. Chem. Chem. Phys. 2019;21:5409–5415. doi: 10.1039/c8cp07461e. [DOI] [PubMed] [Google Scholar]
- 49.Wang H, et al. Adverse effects of excess residual pbi2 on photovoltaic performance, charge separation, and trap-state properties in mesoporous structured perovskite solar cells. Chem. Eur. J. 2017;23:3986–3992. doi: 10.1002/chem.201605668. [DOI] [PubMed] [Google Scholar]
- 50.Bisquert J, Vikhrenko VS. Interpretation of the time constants measured by kinetic techniques in nanostructured semiconductor electrodes and dye-sensitized solar cells. J. Phys. Chem. B. 2004;108:2313–2322. [Google Scholar]
- 51.Bisquert J, Fabregat-Santiago F, Mora-Seró I, Garcia-Belmonte G, Giménez S. Electron lifetime in dye-sensitized solar cells: theory and interpretation of measurements. J. Phys. Chem. C. 2009;113:17278–17290. [Google Scholar]
- 52.Wang H, et al. Multiple-trapping model for the charge recombination dynamics in mesoporous-structured perovskite solar cells. Chem. Sus. Chem. 2017;10:4872–4878. doi: 10.1002/cssc.201701780. [DOI] [PubMed] [Google Scholar]
- 53.Nelson J. The Physics of Solar Cells. London: Imperial College Press; 2003. [Google Scholar]
- 54.Street RA. Trapping parameters of dangling bonds in hydrogenated amorphous silicon. Appl. Phys. Lett. 1982;41:1060–1062. [Google Scholar]
Associated Data
This section collects any data citations, data availability statements, or supplementary materials included in this article.