

Abstract
Culture permeates across human mind and behavior. Cultural influence is reported even in economic decision making, which involves basic cognitive process, once believed to be invariant across all humans. The current study investigated the neurocognitive processes underlying economic decision making in East Asians and European Americans, with an aim to understand the cross-cultural differences in the discrete mental processes of decision making. Participants performed a risky gambling task that captures the gain maximizing and loss minimizing strategies, while electroencephalography was simultaneously collected. Event-related potentials (ERPs) associated with spontaneous emotional arousal (P2) and effortful attentional allocation (P3) were examined to determine the cultural effects on mental processes during pre-decisional and post-decisional stages. Behaviorally, Americans showed greater loss minimization than Asians. ERPs demonstrated significant cultural differences during post-decisional evaluation of outcomes, but not during pre-decisional processes. In Asians’, ERP associated with emotional arousal (P2) was strongly modulated by gains, while in Americans’, ERP associated with attentional allocation (P3) was strongly modulated by losses. These results suggest that Americans make conscious efforts to be self-reliant when facing financial losses, whereas Asians are more emotionally aroused by financial gains, which invites a refinement to the current theoretical propositions about cultural influence on decision making.
Keywords: culture, risky decision making, loss aversion, event-related potential, P2, P3
Introduction
Culture plays a significant role in shaping the interplay between the mind, brain and behavior (Chiao and Immordino-Yang, 2013; Han et al., 2013). In particular, differences in perception and thinking between East Asians and Western Europeans have been well documented, which have been attributed to differences in social orientation and motivational tendencies (Varnum et al., 2010).
Several lines of work also present cultural influence on economic decision making, which involves basic cognitive process, once believed to be invariant across all humans. In particular prior works show that Asians present with a diminished understanding of the range of probabilities in probabilistic decision making (Wright and Phillips, 1980; Yates, 2010) and demonstrate lower risk aversion and greater risk taking (Bontempo et al., 1997; Weber and Hsee, 1999; Du et al., 2002; Mandel, 2003). Asian’s greater risk taking has been explained in terms of the ‘cushion hypothesis’ (Weber and Hsee, 1999) grounded on the self-construal theory (Markus and Kitayama, 1991), according to which self is considered as fundamentally independent from others in individualistic cultures and to be highly interconnected with other people in collectivistic cultures (Triandis et al., 1988; Markus and Kitayama, 1991). The ‘cushion hypothesis’ focuses on the nature of the tight social support in Asian collectivistic society, which makes it easier for people to receive financial help from their social network and in turn makes Asians to be less risk averse.
A few experimental studies and theoretical frameworks suggest possible neural underpinning of cultural differences in risk taking (Takahashi et al., 2009; Kim et al., 2012; Christopoulos and Tobler, 2016). One study compared the functional magnetic resonance imaging activations of Americans and Koreans during inter-temporal choice (i.e. temporal discounting) (Kim et al., 2012). This study found higher discount rate, indicating greater impulsivity, and greater recruitment of ventral striatum in Americans compared to Koreans, which led to the interpretation that emotional responsivity to rewards contributes to the cultural difference in temporal discounting. Although these results are not in line with the majority of other behavioral findings showing greater risk taking in Asians, it demonstrates a clear cross-cultural difference at a neural processing level which leads to the behavior difference. More importantly, such neuroscientific investigations can provide with a unique opportunity to uncover the underlying mental processes that lead to cultural differences in decision making. Decision making involves evaluation of options, implementation of choice and evaluation of outcomes, and some of these mental processing stages happens prior to or after observable choice behavior (Platt and Plassmann, 2014) which can be effectively studied by neuroscience approaches. Delineating the cultural differences along the decision making processing stages using these approaches will thus contribute to a mechanistic understanding of how sociocultural factors influence discrete mental processes that shape one’s behavior.
The current study investigated the neurocognitive underpinnings of cross-cultural differences in economic decision making, by comparing the choice patterns and the ERPs during a risky decision making task between East Asians and European Americans. We devised the risky gambling task which assesses one’s tendency to maximize gains vs. minimize losses, the two well-distinguishable decision strategies that stem from individuals’ orientation toward achieving gains and avoiding losses (Venkatraman et al., 2009; San Martin et al., 2013; Pang et al., 2015). In our task, the two decision strategies were measured based on one’s tendency to bet high or low, when facing a mixed gamble with different probabilities of winning and losing. Specifically, gain maximizing is reflected in a higher tendency to bet high to a winning gamble (e.g. 75% win 25% lose) and loss minimizing is reflected in a higher tendency to bet low to a losing gambling (e.g. 75% lose 25% win). We used the high-temporal resolution of the event-related potential (ERP) technique, in combination with the task, as a way of studying mental processes that unfold during pre-decisional evaluation of decision options and post-decisional processing of decision outcomes.
ERPs provide a unique opportunity to uncover the temporal unfolding of mental processes involved in decision making. In particular, the frontocentral P2 and the parietocentral P3 are two well-established ERPs known to encode expected rewards and risks as well as choice outcomes (Wu and Zhou, 2009; San Martín et al., 2013; Gheza et al., 2018). The P2 is a relatively early peaking component (~180 ms), reflecting automatic emotional arousal (Carretié et al., 2001; Schutter et al., 2004). Thus, its involvement is thought to reflect instantaneous emotional arousal associated with the prospect or the experience of wins or losses (San Martín et al., 2013; Gheza et al., 2018; Chen et al., 2019). On the other hand, P3 is a later peaking component (~450 ms) involved in attentional allocation and stimulus-induced memory (Donchin and Coles, 1988; Polich, 2007), which is associated with a more effortful assessment of decision options or evaluation of choice outcomes (Wu and Zhou, 2009; San Martín et al., 2013; Chen et al., 2019).
In our analysis, we first compared the choice patterns of East Asians and European Americans in terms of their gain maximizing and loss minimizing tendencies. In line with previous work showing greater risk taking in East Asians, we hypothesized that Asians will exhibit greater gain maximization than Americans, whereas Americans will exhibit greater loss minimization than Asians. More crucially, we aimed to characterize the cultural differences in the temporal unfolding of mental processes that lead to the different behavioral manifestations by assessing the P2 and P3 ERP components during the pre-decisional (cue phase) and post-decisional (outcome phase) stages. We hypothesized that, if culture shapes an individual’s automatic processing of arousal associated with the prospect or the experience of winning or losing, cross-cultural differences should be observed at P2. On the other hand, if culture shapes an individual’s effortful processing of options or outcomes, cross-cultural differences should be observed at P3. Orthogonal to this dimension was another set of hypotheses concerning the different stages of decision making process. Culture could shape the way individuals evaluate both decision options (at pre-decisional stage) and outcomes (at post-decisional stage), or it could shape only one of the two. Teasing these hypotheses apart should provide a mechanistic understanding of how sociocultural factors influence discrete mental processes involved in economic decision making.
Materials and methods
Participants
In all, 34 European Americans and 38 East Asians participated in the study. Two Americans and three Asians were excluded due to electroencephalography (EEG) artifact. All analyses were conducted in the remaining sample of 32 Americans (10 males, age: 20.59 ± 2.45 years) and 35 Asians (7 males, age: 20.03 ± 1.40 years). All study participants were right-handed healthy young adults recruited from the University of Massachusetts Amherst, without a history of psychiatric or neurological illness or alcohol/drug dependence. All participants signed a written informed consent approved by the UMass Institutional Review Board and received course credits for participation. In addition to the base rate credit, bonus credits were granted based on their choice during the risky gambling task. All Asians participants were from families with East Asian cultural background, with both parents from East Asian countries (i.e. China, Japan and Korea). The detailed demographics of the East Asian participants are described in Supplementary Materials. All Americans have identified themselves as Caucasians that are descents of Western European countries.
Procedure
Participants performed the risky gambling task, while continuous scalp EEG was collected. After the EEG experiment, participants completed survey questionnaires measuring their cultural background including the Self-construal scale (Singelis, 1994) and the Asian value scale (Kim et al., 1999). These measures were used primarily to confirm the cross-cultural differences in sociocultural orientation, and in fact the results do demonstrate that our American and Asian participants reliably represent the respective cultures (see Supplementary Materials). Finally, we assessed participants’ explicit attitudes toward gambling via the Gambling Related Cognition Scale (Raylu and Oei, 2004) (for results see Supplementary Materials). All experimental procedures including the delivery of task instructions and surveys were performed in English.
Risky gambling task
The risky gambling task was adapted from San Martin et al. (2013) (Fig. 1). During cue phase, seven different probabilities were shown throughout a total of 500 trials1. The probability conditions can be categorized as likely winning [P (win) > 0.5], neutral [P (win) = 0.5] and likely losing [P (win) < 0.5]. During outcome phase, participants were shown one of the four possible outcomes based on their choice: +8, −8, +2 and − 2. Participant’s choice could only influence the magnitude of outcome and not the valence of it, which is determined by the presented probability. An optimal strategy would be to bet ‘8’ in the likely winning trials and to bet ‘2’ in the likely losing trials. During the experiment, 500 trials were broken down into 25 blocks with 20 trials in each. The trial types (i.e. probability conditions) were randomly spread out across the blocks. The task lasted ~1 h.
Fig. 1.
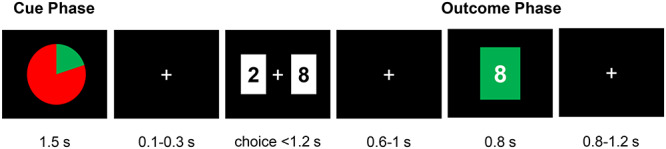
An example trial structure for the risky gambling task. Participants were presented with a pie-chart (1.5 s), with the area in green indicating the winning and the area in red indicating the losing probabilities (cue phase). After a variable ISI (0.1–0.3 s), the two wager options, ‘2’ and ‘8’ points on a white background, were presented on either side of the screen. The left and right positioning of the wager options was randomized across trials. Participants were asked to choose between the two options within 1.2 s. The choice outcome was revealed after another ISI (0.6–1 s) by a color cue: the chosen wager was presented on the center of the screen on a green background for win or on a red background for loss (outcome phase).
Due to the binary nature of choice, the outcomes also conveyed information about what would have happened if the alternate choice was made. For example, if wager ‘8’ was chosen and the outcome was +8, this would be evaluated in reference to the alternate outcome +2, a less preferable outcome. On the other hand, if wager ‘2’ was chosen and the outcome was +2, this would be evaluated in reference to the alternate outcome +8, a more preferable outcome. Based on this scheme, the +8 and − 2 reflect the best possible gain and the best possible loss, respectively, and the +2 and − 8 reflect the worst possible gain and the worst possible loss, respectively. After completion of experiment, participants received a bonus credit determined based on a pre-determined threshold2.
Behavioral data analysis
We characterized individuals’ choices as gain maximization and loss minimization. Gain maximization was computed based on their probability to bet larger (i.e. choose “8″), P, on the ‘likely winning’ trials. These probabilities were expressed on a logit-function scale, γ = log (P/1-P), which allows a better characterization of differences in probability at the low and high ends of the scale (San Martin et al., 2013). The more positive γ estimate in the likely winning trials, thus, indicates higher likelihood to maximize gains (γgainMax). Loss minimization was computed based on their probability to bet smaller (i.e. choose “2″), effectively 1-p, on the ‘likely losing’ trials. After a logit transformation using γ = log (1-p/p), the more positive γ estimate indicates higher likelihood to minimize losses (γlossMin). To avoid γ resulting in infinity, P of 0.999 and 0.001 were assumed when it was 1 and 0, respectively.
Electroencephalogram recording and analysis
EEG was continuously recorded using 64 scalp electrodes embedded in an extended coverage, triangulated equidistant cap (M10, EasyCap, GmbH), with a low-pass filter of 100 Hz at a sampling rate of 1000 Hz (actiCHamp, Brain Products, GmbH). The electro-oculogram (EOG) was monitored with electrodes below the left eye and lateral to the left and right canthi. Electrode impedances were kept below 15 kΩ. The EEG was amplified with a BrainAmp system (Brain Products GmbH, Gilching, Germany). All channels were referenced to the vertex (Cz) during recording.
Offline EEG data were exported to Matlab using EEGLAB (Delorme and Makeig, 2004) and custom scripts. The data were re-referenced to the average of mastoid channels and high-pass filtered by 0.1 Hz. We separated the data into 1200 ms probability cue-locked epoch (cue phase) reflecting pre-decisional stage and 1200 ms outcome-locked epoch (outcome phase) reflecting post-decisional stage, each spanning from 200 ms before to 1000 ms after the onset of the probability cue or the outcomes, respectively. A pre-stimulus period of 200 ms was used as the baseline for all epochs. For each participant, we implemented a procedure for artifact removal using independent component analysis (Delorme and Makeig, 2004; Makeig et al., 2004; Onton and Makeig, 2006). Single trials were also visually inspected to exclude epochs with excessively noisy EEG or muscle artifacts. Five participants with >30% rejections were excluded. In the remaining participants, on average ~96.6% of the trials were included.
ERP analysis was focused on P2 and P3 during cue and outcome phases. ERPs were identified in pre-defined channels/regions of interest (ROI) and time windows. Figure 2 shows the channel locations for each ROI. The P2 was identified by the brainwaves from FCz and the six immediately neighboring channels (San Martin et al., 2013), in the range of 170–210 ms from stimulus onset. The P3 was identified by the brainwaves from Pz and the five immediately neighboring channels (San Martin et al., 2013), in the range of 300–700 ms. These time windows were chosen based on previous studies (Potts et al., 1996; Polich, 2007; San Martin et al., 2013; San Martín et al., 2016) and by visual inspection of the grand averaged waveforms across all participants. ERP amplitudes, averaged across all channels within each ROI and across the time window of interest, served as the magnitude of each component.
Fig. 2.

Channel locations for the frontocentral (in red) and parietocentral (in green) ROIs.
Results
Cultural differences in gain maximization and loss minimization
We determined how Americans and Asians differed across the two decision strategies of gain maximization and loss minimization, using a Group (Americans, Asians) × Strategy (γgainMax, γlossMin) mixed analysis of variance (ANOVA). There was a significant main effect of Strategy (F(1,65) = 5.71, P = 0.02, ηp2 = 0.081), a Group by Strategy interaction (F(1,65) = 9.59, P = 0.003, ηp2 = 0.13) and a non-significant main effect of Group (F(1,65) = 3.30, P = 0.074) (Fig. 3). A follow-up t-test showed a significantly higher γlossMin in Americans (M = 1.88, SD = 0.97) than Asians (M = 1.17, SD = 0.90) (t(65) = 3.09, P = 0.003, Cohen’s d = 0.76). No such difference was found in γgainMax (t(65) = 0.15, P = 0.879). These results demonstrate a significant cultural difference in loss minimization such that it is more pronounced in Americans.
Fig. 3.

Cross-cultural differences in gain maximization (γgainMax) and loss minimization (γlossMin) scores.
ERPs during cue phase
To determine whether the P2 and P3 ERP components are involved in the processing of different probability cues and to what degree it differs between cultures, we performed a Group (Americans, Asians) × Cue (likely winning, neutral, likely losing) mixed ANOVA.
In P2, there was a significant main effect of Cue (F(2,130) = 27.15, P < 0.001, ηp2 = 0.30), driven by a greater P2 magnitude in the likely wining and likely losing conditions than the neutral condition (both Ps < 0.001 with Bonferroni correction; Fig. 4). The difference between likely winning and likely losing conditions were not significant (P = 0.591 with Bonferroni correction). The Group main effect (F(2,130) = 1.32, P = 0.256) and the Group by Cue interaction (F(2,130) < 1, P = 0.656) were not significant.
Fig. 4.

EEG waveforms time-locked to the presentation of probability cue in European Americans and East Asians. Average waveforms from the frontocentral and the parietocentral ROIs, as well as the topomaps, revealed a reliable presence of the P2 and P3 components. Bar graphs represent the average ERP amplitudes computed from the time window indicated by the yellow shading.
In P3, there was a significant main effect of Cue (F(2,130) = 9.65, P < 0.001, ηp2 = 0.13), driven by a greater P3 magnitude in the likely winning condition than the likely losing condition (P < 0.001 with Bonferroni correction; Fig. 4). No significant differences were found between the other two pairwise contrasts (both Ps > 0.05). There was also a significant Group main effect (F(1,65) = 5.53, P = 0.022, ηp2 = 0.08) such that Americans (M = 5.12, SD = 2.60) showed a significantly higher P3 magnitude compared to Asians (M = 3.62, SD = 2.60). The Group by Cue interaction was not significant (F(2,130) = 0.41, P = 0.667).
Modulation of P2 and P3 by the different probability cues suggests that they were both involved in evaluation of the associated risks, with P2 reflecting the degree of uncertainty and P3 reflecting the probability of winning, which are qualitatively identical to what have been previously observed (Chen et al., 2019). The group main effect in P3 may indicate that Americans allocate greater attentional resource in processing of the probability cues in general, regardless of the different risk levels. Importantly, however, these modulatory effects of probability did not interact with culture, suggesting that the two cultural groups varied little in the way they dissociated the different risk levels.
ERPs during outcome phase
Analysis of outcome phase was performed by comparing the ERPs across the worst (+2 for gains and −8 for losses) vs. best (+8 for gains and −2 for losses) and gain vs. loss outcomes and the two cultural groups using a Group (Americans, Asians) x Preference (worst, best) × Valence (gain, loss) mixed ANOVA.
In P2 there was a significant main effect of Preference (F(1,65) = 20.61, P < 0.001, ηp2 = 0.24), Valence (F(1,65) = 41.94, P < 0.001, ηp2 = 0.39), and a Group by Preference by Valence interaction (F(1,65) = 9.40, P = 0.003, ηp2 = 0.13). All other effects were not significant (Fs < 2.6, P > 0.11). In P3 there was a significant main effect of Preference (F(1,65) = 71.18, P < 0.001, ηp2 = 0.52), a Group by Preference (F(1,65) = 4.39, P = 0.04, ηp2 = 0.06), a Preference by Valence (F(1,65) = 17.72, P < 0.001, ηp2 = 0.21), and a Group by Preference by Valence interaction (F(1,65) = 5.01, P = 0.029, ηp2 = 0.07). All other effects were not significant (Fs < 3.7. Ps > 0.06). The three-way interactions in both P2 and P3 were followed up with a Group by Preference ANOVA in gains and losses separately. The ERP contrast between the worst and best outcomes in gains and losses were associated with the behavioral measure of gain maximization and loss minimization, in the previous study (San Martin et al., 2013). Therefore, this follow-up test will determine the neural underpinning of cultural difference in the observed choice behavior. For the purpose of directing attention to the separated analysis in gains and losses, we present results of both P2 and P3 from gain outcomes first, followed by those from loss outcomes.
Gains
In P2, Group by Preference ANOVA showed a significant Group by Preference interaction (F(1,63) = 9.42, P = 0.003, ηp2 = 0.13), with a greater difference between the worst and best gains in Asians than Americans (Fig. 5). This interaction in P2 suggests that culture shapes the degree to which individuals are sensitive to the automatic processing of arousal associated with the experience of winning. The main effect of Group (F(1,63) < 1, P = 0.468) and the main effect of Preference (F(1,63) = 3.91, P = 0.052) were not significant. In P3, there was a significant main effect of Preference (F(1,63) = 27.90, P < 0.001, ηp2 = 0.30). Greater P3 magnitude in the worst gain trials (win 2) indicates a greater attentional allocation placed to the worst outcome, which replicates previous findings (San Martin et al., 2013). The main effect of Group (F(1,63) = 2.49, P = 0.119) and the interaction (F (1,63) < 1, P = 0.997) were not significant, thus showing no evidence for any modulatory effect of culture on P3 for gains.
Fig. 5.

EEG waveforms time-locked to the presentation of the gain outcomes (i.e. ‘+8’ and ‘+2’) in European Americans and East Asians. Average waveforms from the frontocentral and the parietocentral ROIs, as well as the topomaps, revealed a reliable presence of the P2 and P3 components. Bar graphs represent the average ERP amplitudes computed from the time window indicated by the yellow shading.
Losses
In P2, Group by Preference ANOVA showed a significant main effect of Preference (F(1,63) = 11.99, P < 0.001, ηp2 = 0.18) (Fig. 6). Greater P2 magnitude in the worst loss trials (−8) indicates a greater automatic arousal in response to the worst outcome, in line with previous findings (San Martin et al., 2013). The main effect of Group (F(1,63) = 1.12, P = 0.294) and the interaction (F(1,63) = 3.19, P = 0.079) were not significant. In P3, the main effects of Preference (F(1,63) = 50.54, P < 0.001, ηp2 = 0.44) and Group (F(1,63) = 4.31, P = 0.042, ηp2 = 0.06) and the interaction (F(1,63) = 5.79, P = 0.019, ηp2 = 0.08) were all significant. The difference between the worst and best losses was greater in Americans than Asians. These results suggest that culture shapes the degree to which individuals allocate effortful attention to the experience of losing and that Americans were more sensitive to the difference between the two loss outcomes than Asians.
Fig. 6.

EEG waveforms time-locked to the presentation of the loss outcomes (i.e. ‘−2’ and ‘−8’) in European Americans and East Asians. Average waveforms from the frontocentral and the parietocentral ROIs, as well as the topomaps, revealed a reliable presence of the P2 and P3 components. Bar graphs represent the average ERP amplitudes computed from the time window indicated by the yellow shading.
ERP–behavior correlation
In an effort to provide rationale for the investigation of ERPs for understanding the mechanisms of cultural difference in risky decision making behavior, we tested whether the ERPs during cue and outcome phases have direct contributions to the behavior. Details of the analytical approaches are described in the Supplementary Materials.
During cue phase, we found a significantly negative P3-behavior correlation (r = −0.44, P < 0.001, Fig. 7A). Individuals with relatively greater attentional bias towards the likely winning vs. losing probability exhibited relatively greater loss minimization than gain maximization. This suggests that the degree to which P3 attentional mechanisms dissociate the winning and losing probabilities, predicts the behavioral tendency of loss aversion.
Fig. 7.
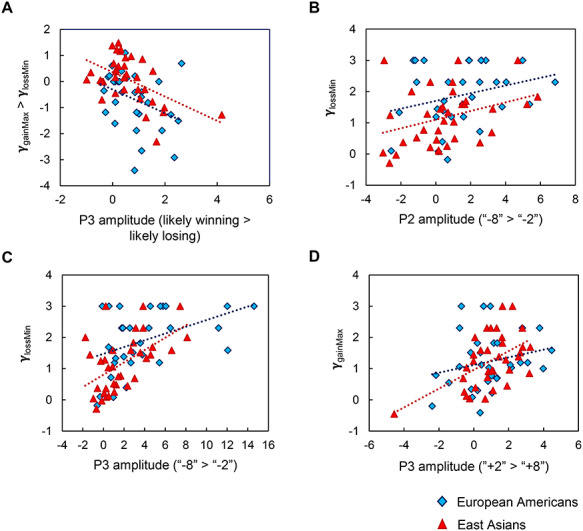
Brain–behavior correlations between the ERP components and decision strategies used. During cue phase, there was a significant negative correlation between the P3 contrast ‘likely winning > likely losing’ and the behavior contrast ‘γgainMax > γlossMin’ in the total sample. This relation held within Asians (r = −0.52, P = 0.001) and within Americans (r = −0.37, P = 0.040) separately (A). During outcome phase in which we looked at the relationship between the ERP contrasts ‘worst > best’ outcomes and the decision strategy, there was a significant positive correlation between the P2 contrast ‘−8 > −2’ and γlossMin (B) and between the P3 contrast ‘−8 > −2’ and γlossMin (C) in the total sample. The relationship held for both P2 (r = 0.34, P = 0.049) and P3 (r = 0.53, P = 0.001) within Asians and held for P3 (r = 0.43, P = 0.013) but not P2 within Americans (r = 0.28, P = 0.127). Additionally, there was a significant positive correlation between the P3 contrast ‘+8 > +2’ and γgainMax (D). The relationship only held within Asians (r = 0.50, P = 0.002) and not within American (r = 0.23, P = 0.199).
During outcome phase, there was a significantly positive P2-behavior correlation (r = 0.36, P = 0.003, Fig. 7B) as well as a P3-behavior correlation (r = 0.52, P < 0.001, Fig. 7C), suggesting that the greater the neural responses to the worst than the best loss, the greater the tendency for loss minimization. Similarly, there was a significant P3-behavior (r = 0.36, P = 0.003, 7D) but not P2-behavior correlation (r = −0.02, P = 0.858), suggesting that the greater the P3 response to the worst than the best gain, the greater the tendency for gain maximization. These significant correlations between the ERP magnitudes and choice strategies further emphasize the functional significance of the ERP signals in explaining behavior.
Discussion
Recent advances in cultural psychology suggest that culture plays an important role in shaping one’s cognitive processes that were once believed to be invariant across all humans (Norenzayan and Nisbett, 2000; Nisbett et al., 2001; Kitayama et al., 2003; Choi et al., 2008; Varnum et al., 2010). Some evidence suggests cultural modulations in risky decision making, showing a greater risk-taking tendency in the Eastern compared to the Western culture (Bontempo et al., 1997; Weber and Hsee, 1999; Du et al., 2002; Mandel, 2003). However, these prior findings require additional support with further investigations clarifying the specific mental processes that contribute to these cultural variations. To address these remaining gaps, we investigated the choice patterns and ERPs during a risky gambling task in East Asians and European Americans.
In the behavioral analysis, we found significantly greater loss minimization in Americans than Asians. This suggests that the characteristic behavioral tendency of loss aversion (Tversky and Kahneman, 1991) is more pronounced in Americans. Indeed, one prior study demonstrated greater loss aversion in individualistic cultures (Wang et al., 2017), which was interpreted to be in line with the ‘cushion hypothesis’, as it predicts greater risk aversion in individualistic cultures. Additionally, they speculated that the cultural difference in loss aversion stems from variations in emotional processing (Kitayama et al., 2000; Miyamoto et al., 2014), based on the association between negative emotions and loss aversion (De Martino et al., 2010; Sokol-Hessner et al., 2013) and the fact that Westerners consider negative emotions to be less socially acceptable and as a personal failure (Eid and Diener, 2001), as opposed to Asians who acknowledge both positive and negative emotions to be mixed in life (Wang et al., 2017).
Cultural difference was also found in the Gambling Related Cognition Scale (Raylu and Oei, 2004), which is a self-report measure of attitudes toward gambling. In line with the cushion hypothesis, Asians demonstrated greater pro-gambling cognitive tendencies. This suggests that cultural influence on risk taking is evident not only in implicit choice tendencies during risky gambling task, but also in an explicit self-report about risk-taking behaviors such as gambling.
As a way of uncovering the mental processes that lead to the differences in behavior, cultural modulations of ERPs were examined in two dimensions. First, we assessed how culture shapes ERPs in the pre-decisional cue phase and in the post-decisional outcome phase. Second, we assessed how culture shapes automatic emotional arousal reflected by the P2 and effortful attentional allocation reflected by the P3.
During the cue phase, both the P2 and P3 were modulated by the probability information, although the modulation of P2 reflected the degree of uncertainty and the modulation of P3 reflected the degree of the likelihood of winning, replicating our previous work (Chen et al., 2019). Importantly, these modulatory effects of probability cues did not interact with culture, providing no evidence that culture shapes the underlying cognitive processes during the pre-decisional stage.
During the outcome phase, we found a general pattern of greater ERP responses in the worst than the best outcomes, replicating the previous findings (San Martin et al., 2013). ERPs in response to the outcomes reflect the amount of cognitive effort involved in updating the prior beliefs, or the internal model about the decision environment, after experiencing the outcomes (San Martin et al., 2013). Several studies suggest that ERPs time-locked to choice outcomes, particularly the P3, reflects this revision of internal model or the updating of the context (Donchin, 1981; Donchin and Coles, 1988). More recent studies propose that P3 reflects the learning signal from the phasic locus coeruleus–norepinephrine activity (Aston-Jones and Cohen, 2005), involved in context updating (Nieuwenhuis et al., 2004, 2005). The ERP contrast between the worst and best outcomes may thus reflect the difference in the amount of effort in context updating and this contrast in gain and loss outcomes will represent the neural sensitivities to gains and losses, respectively. Central to our hypotheses were the significant cultural modulations on neural sensitivity to gains and losses. Compared with Asians, Americans showed a greater P3 sensitivity to losses and compared with Americans, Asians showed a greater P2 sensitivity to gains. These results thus can be interpreted as Americans being more attentionally engaged by the loss outcomes and Asians being more emotionally aroused by the gain outcomes, which may be the underlying mental processes that contribute to differences in behavior whereby Americans compared with Asians showed greater loss minimization.
Based on the binary nature of choice in our task, it is also possible that the ERPs during outcome phase may reflect counterfactual emotions such as regret with the worst outcome and relief with the best outcome (Coricelli et al., 2005; Habib et al., 2012). However, our study does not allow us to clearly characterize these counterfactual emotions as we did not directly assess participant’s emotional experience to the outcomes. Future studies with more proper experimental design for assessing emotional experiences should investigate this question.
Our ERP findings extend and refine the current theories of cultural modulations on decision making by providing the underlying neurocognitive mechanisms. First, our results provide additional support to the idea that culture can influence even the basic cognitive processes such as decision making, by providing neural evidence that demonstrates the relative invariance during the pre-decisional evaluation of options but a strong culture-dependent variation during the post-decisional evaluation of outcomes.
Secondly, our results provide support for a new interpretation of the cushion hypothesis, which focuses on the characteristics of the individualistic cultures. According to the cushion hypothesis, the Asian collectivistic culture allows seeking financial help from others. This is less acceptable in the Western individualistic culture, which values self-reliance that promotes facing one’s own life struggles and building strength to resolve them independently (Triandis and Gelfand, 1998). In line with this idea, the greater sensitivity in losses at P3 but not P2 in Americans may indicate that their processing of losses was enhanced deliberately at the level of effortful attentional allocation and not spontaneously at the level of emotional arousal, as part of an explicit effort to face and resolve the negative outcome in a self-reliant manner.
Lastly, our results provide opportunities to revisit the ‘cushion hypothesis’, which focuses on the collectivistic nature of Asian cultures. According to this hypothesis, Asians take a greater risk based on the reasoning that there exists a tight social network to help them in case of negative financial outcomes, which implies an explicit, conscious-level thought process rather than an automatic arousal process. In our data, cultural differences in sensitivity to gains appeared at a relatively earlier level of processing at P2, reflecting spontaneous and automatic emotional arousal, but not at P3 reflecting effortful conscious-level processing. Thus, the enhanced sensitivity to gains in Asians in our study, as well their greater risk-taking tendencies observed in other studies, could be driven by cultural influence that pervades at a more inherent and primitive level than what the cushion hypothesis assumes. P2 magnitudes have been implicated in predicting individual differences in emotional arousal level due to personality traits or psychiatric conditions (Fritzsche et al., 2011; Anderson and Stanford, 2012) and some studies have also shown cross-cultural differences in P2 magnitude in response to emotional stimuli (Hot et al., 2006). These finding provide support for the idea that this ERP indicator of early arousal can reflect inherent differences in mental process shaped by the culture.
In summary, the current study demonstrates cultural modulations in economic decision making presented as a pronounced loss aversion in Americans compared to Asians, which was reflected in the ERPs during the evaluation of decision outcomes. In particular, Americans were deliberately more sensitive to the losing outcome, as suggested by their attentional allocation to losses, which may relate to making a conscious effort to be self-reliant in case of financial losses. In contrast, Asians were spontaneously more sensitive to the winning outcome, as suggested by their automatic emotional arousal to gains, an effect that cannot be explained solely in terms the cushion hypothesis. Together these findings advance our understanding about how culture influences the mental processes involved in economic decision making.
Declaration of conflicting interest
The authors declare that there is no conflict of interest.
Supplementary Material
Footnotes
The following seven different probabilities were shown during the cue phase: 0.05, 0.20, 0.35, 0.50, 0.65, 0.80 and 0.95. The number of trials for each probability was distributed as follows: 0.05: 50 trials; 0.20: 50 trials; 0.35: 100 trials; 0.50: 100 trials; 0.65: 100 trials; 0.80: 50 trials; and 0.95: 50 trials..
The threshold for bonus credit was determined based on the expected value of the gamble considering the optimal strategy in choice (i.e. bet ‘8’ with [P (win) > 0.5] and to bet ‘2’ with [P (win) < 0.5]) across all trials We set the threshold reward point to be 60% of this expected value under the optimal strategy, which was 400 points.
References
- Anderson N.E., Stanford M.S. (2012). Demonstrating emotional processing differences in psychopathy using affective ERP modulation. Psychophysiology. doi: 10.1111/j.1469-8986.2012.01369.x. [DOI] [PubMed] [Google Scholar]
- Aston-Jones G., Cohen J.D. (2005). An integrative theory of locus coeruleus-norepinephrine function: adaptive gain and optimal performance. Annual Review of Neuroscience.. doi: 10.1146/annurev.neuro.28.061604.135709. [DOI] [PubMed] [Google Scholar]
- Bontempo R.N., Bottom W.P., Weber E.U. (1997). Cross-cultural differences in risk perception: a model-based approach. Risk Analysis, 17(4), 479–88. [Google Scholar]
- Carretié L., Mercado F., Tapia M., Hinojosa J.A. (2001). Emotion, attention, and the ‘negativity bias’, studied through event-related potentials. International Journal of Psychophysiology, 41(1), 75–85. [DOI] [PubMed] [Google Scholar]
- Chen X.-J., McCarthy M., Kwak Y. (2019). Contribution of sensorimotor beta oscillations during value-based action selection. Behavioural Brain Research, 368, 111907. [DOI] [PubMed] [Google Scholar]
- Chiao J.Y., Immordino-Yang M.H. (2013). Modularity and the cultural mind. Perspectives on Psychological Science, 8(1), 56–61. [DOI] [PMC free article] [PubMed] [Google Scholar]
- Choi I., Choi J.A., Norenzayan A. (2004). Culture and decisions In D. J. Koehler & N. Harvey, eds., Blackwell Handbook of Judgment and Decision Making,Malden, MA, USA: Blackwell Publishing Ltd, pp. 504–24.
- Christopoulos G.I., Tobler P.N. (2016). Culture as a response to uncertainty: Foundations of computational cultural neuroscience. In J. Y. Chiao, S.-C. Li, R. Seligman, & R. Turner, eds.,The Oxford handbook of cultural neuroscience., New York, NY, USA: Oxford University Press, pp. 81–104.
- Coricelli G., Critchley H.D., Joffily M., O’Doherty J.P., Sirigu A., Dolan R.J. (2005). Regret and its avoidance: a neuroimaging study of choice behavior. Nature Neuroscience, 8(9), 1255–62. [DOI] [PubMed] [Google Scholar]
- De Martino B., Camerer C.F., Adolphs R. (2010). Amygdala damage eliminates monetary loss aversion. Proceedings of the National Academy of Sciences of the United States of America. doi: 10.1073/pnas.0910230107. [DOI] [PMC free article] [PubMed] [Google Scholar]
- Delorme A., Makeig S. (2004). EEGLAB: an open source toolbox for analysis of single-trial EEG dynamics including independent component analysis. Journal of Neuroscience Methods, 134(1), 9–21. [DOI] [PubMed] [Google Scholar]
- Donchin E. (1981). Surprise!...Surprise? Psychophysiology. doi: 10.1111/j.1469-8986.1981.tb01815.x. [DOI] [Google Scholar]
- Donchin E., Coles M.G.H. (1988). Is the P300 component a manifestation of context updating? Behavioral and Brain Sciences, 11(03), 357. [Google Scholar]
- Du W., Green L., Myerson J. (2002). Cross-cultural comparisons of discounting delayed and probabilistic rewards. The Psychological Record, 52(4), 479–92. [Google Scholar]
- Eid M., Diener E. (2001). Norms for experiencing emotions in different cultures: inter- and intranational differences. Journal of Personality and Social Psychology.. doi: 10.1037/0022-3514.81.5.869. [DOI] [PubMed] [Google Scholar]
- Fritzsche A.S., Stahl J., Gibbons H. (2011). An ERP study of target competition: individual differences in functional impulsive behavior. International Journal of Psychophysiology. doi: 10.1016/j.ijpsycho.2011.03.014. [DOI] [PubMed] [Google Scholar]
- Gheza D., Paul K., Pourtois G. (2018). Dissociable effects of reward and expectancy during evaluative feedback processing revealed by topographic ERP mapping analysis. International Journal of Psychophysiology, 132, 213–25. [DOI] [PubMed] [Google Scholar]
- Habib M., Cassotti M., Borst G., et al. (2012). Counterfactually mediated emotions: a developmental study of regret and relief in a probabilistic gambling task. Journal of Experimental Child Psychology, 112(2), 265–74. [DOI] [PubMed] [Google Scholar]
- Han S., Northoff G., Vogeley K., Wexler B.E., Kitayama S., Varnum M.E.W. (2013). A cultural neuroscience approach to the biosocial nature of the human brain. Annual Review of Psychology, 64(1), 335–59. [DOI] [PubMed] [Google Scholar]
- Hot P., Saito Y., Mandai O., Kobayashi T., Sequeira H. (2006). An ERP investigation of emotional processing in European and Japanese individuals. Brain Research.. doi: 10.1016/j.brainres.2006.09.020. [DOI] [PubMed] [Google Scholar]
- Kim B.S.K., Atkinson D.R., Yang P.H. (1999). The Asian values scale: development, factor analysis, validation, and reliability. Journal of Counseling Psychology. doi: 10.1037/0022-0167.46.3.342. [DOI] [Google Scholar]
- Kim B., Sung Y.S., McClure S.M. (2012). The neural basis of cultural differences in delay discounting. Philosophical Transactions of the Royal Society B: Biological Sciences.. doi: 10.1098/rstb.2011.0292. [DOI] [PMC free article] [PubMed] [Google Scholar]
- Kitayama S., Markus H.R., Kurokawa M. (2000). Culture, emotion, and well-being: good feelings in Japan and the United States. Cognition and Emotion.. doi: 10.1080/026999300379003. [DOI] [Google Scholar]
- Kitayama S., Duffy S., Kawamura T., Larsen J.T. (2003). Perceiving an object and its context in different cultures. Psychological Science, 14(3), 201–6. [DOI] [PubMed] [Google Scholar]
- Makeig S., Debener S., Onton J., Delorme A. (2004). Mining event-related brain dynamics. Trends in Cognitive Sciences, 8(5), 204–10. [DOI] [PubMed] [Google Scholar]
- Mandel N. (2003). Shifting selves and decision making: the effects of self-construal priming on consumer risk-taking. Journal of Consumer Research, 30(1), 30–40. [Google Scholar]
- Markus H.R., Kitayama S. (1991). Culture and the self: implications for cognition, emotion, and motivation. Psychological Review, 98(2), 224. [Google Scholar]
- Miyamoto Y., Ma X., Petermann A.G. (2014). Cultural differences in hedonic emotion regulation after a negative event. Emotion. doi: 10.1037/a0036257. [DOI] [PubMed] [Google Scholar]
- Nieuwenhuis S., Yeung N., Holroyd C.B., Schurger A., Cohen J.D. (2004). Sensitivity of electrophysiological activity from medial frontal cortex to utilitarian and performance feedback. Cerebral Cortex.. doi: 10.1093/cercor/bhh034. [DOI] [PubMed] [Google Scholar]
- Nieuwenhuis S., Aston-Jones G., Cohen J.D. (2005). Decision making, the P3, and the locus coeruleus-norepinephrine system. Psychological Bulletin.. doi: 10.1037/0033-2909.131.4.510. [DOI] [PubMed] [Google Scholar]
- Nisbett R.E., Choi I., Peng K., Norenzayan A. (2001). Culture and systems of thought: holistic versus analytic cognition. Psychological Review.. doi: 10.1037/0033-295X.108.2.291. [DOI] [PubMed] [Google Scholar]
- Norenzayan A., Nisbett R.E. (2000). Culture and causal cognition. Current Directions in Psychological Science, 9(4), 132–5. [Google Scholar]
- Onton J., Makeig S. (2006). Information-based modeling of event-related brain dynamics. Progress in Brain Research, 159, 99–120. [DOI] [PubMed] [Google Scholar]
- Pang B., Otto A.R., Worthy D.A. (2015). Self-control moderates decision making behavior when minimizing losses versus maximizing gains. Journal of Behavioral Decision Making.. doi: 10.1002/bdm.1830. [DOI] [Google Scholar]
- Platt M.L., Plassmann H. (2014). Multistage valuation signals and common neural currencies. Neuroeconomics, 237–58. [Google Scholar]
- Polich J. (2007). Updating P300: an integrative theory of P3a and P3b. Clinical Neurophysiology, 118(10), 2128–48. [DOI] [PMC free article] [PubMed] [Google Scholar]
- Potts G.F., Liotti M., Tucker D.M., Posner M.I. (1996). Frontal and inferior temporal cortical activity in visual target detection: evidence from high spatially sampled event-related potentials. Brain Topography.. doi: 10.1007/BF01191637. [DOI] [Google Scholar]
- Raylu N., Oei T.P.S. (2004). The gambling related cognitions scale (GRCS): development, confirmatory factor validation and psychometric properties. Addiction, 99(6), 757–69. [DOI] [PubMed] [Google Scholar]
- San Martin R., Appelbaum L.G., Pearson J.M., Huettel S.A., Woldorff M.G. (2013). Rapid brain responses independently predict gain maximization and loss minimization during economic decision making. Journal of Neuroscience.. doi: 10.1523/jneurosci.4242-12.2013. [DOI] [PMC free article] [PubMed] [Google Scholar]
- San Martín R., Appelbaum L.G., Pearson J.M., Huettel S.A., Woldorff M.G. (2013). Rapid brain responses independently predict gain maximization and loss minimization during economic decision making. The Journal of Neuroscience : The Official Journal of the Society for Neuroscience, 33(16), 7011–9. [DOI] [PMC free article] [PubMed] [Google Scholar]
- San Martín R., Kwak Y., Pearson J.M., Woldorff M.G., Huettel S.A. (2016). Altruistic traits are predicted by neural responses to monetary outcomes for self vs charity. Social Cognitive and Affective Neuroscience, 11(6), 863–76. [DOI] [PMC free article] [PubMed] [Google Scholar]
- Schutter D.J.L.G., de Haan E.H.F., van Honk J. (2004). Functionally dissociated aspects in anterior and posterior electrocortical processing of facial threat. International Journal of Psychophysiology, 53(1), 29–36. [DOI] [PubMed] [Google Scholar]
- Singelis T.M. (1994). The measurement of independent and interdependent self-Construals. Personality and Social Psychology Bulletin, 20(5), 580–91. [Google Scholar]
- Sokol-Hessner P., Camerer C.F., Phelps E.A. (2013). Emotion regulation reduces loss aversion and decreases amygdala responses to losses. Social Cognitive and Affective Neuroscience.. doi: 10.1093/scan/nss002. [DOI] [PMC free article] [PubMed] [Google Scholar]
- Takahashi T., Hadzibeganovic T., Cannas S.A., Makino T., Fukui H., Kitayama S. (2009). Cultural neuroeconomics of intertemporal choice. Activitas Nervosa Superior Rediviva.. doi: 10.11167/jbef.3.133. [DOI] [PubMed] [Google Scholar]
- Triandis H.C., Gelfand M.J. (1998). Converging measurement of horizontal and vertical individualism and collectivism. Journal of Personality and Social Psychology, 74(1), 118–28. [Google Scholar]
- Triandis H.C., Bontempo R., Villareal M.J., Asai M., Lucca N. (1988). Individualism and collectivism: cross-cultural perspectives on self-ingroup relationships. Journal of Personality and Social Psychology, 54(2), 323. [Google Scholar]
- Tversky A., Kahneman D. (1991). Loss aversion in riskless choice: a reference-dependent model. The Quarterly Journal of Economics, 106(4), 1039–61. [Google Scholar]
- Varnum M.E.W., Grossmann I., Kitayama S., Nisbett R.E. (2010). The origin of cultural differences in cognition. Current Directions in Psychological Science, 19(1), 9–13. [DOI] [PMC free article] [PubMed] [Google Scholar]
- Venkatraman V., Payne J.W., Bettman J.R., Luce M.F., Huettel S.A. (2009). Separate neural mechanisms underlie choices and strategic preferences in risky decision making. Neuron, 62(4), 593–602. [DOI] [PMC free article] [PubMed] [Google Scholar]
- Wang M., Rieger M.O., Hens T. (2017). The impact of culture on loss aversion. Journal of Behavioral Decision Making.. doi: 10.1002/bdm.1941. [DOI] [Google Scholar]
- Weber E.U., Hsee C.K. (1999). Models and mosaics: investigating cross-cultural differences in risk perception and risk preference. Psychonomic Bulletin and Review, 6(4), 611–7. [DOI] [PubMed] [Google Scholar]
- Wright G.N., Phillips L.D. (1980). Cultural variation in probabilistic thinking: alternative ways of dealing with uncertainty. International Journal of Psychology, 15(1–4), 239–57. [Google Scholar]
- Wu Y., Zhou X. (2009). The P300 and reward valence, magnitude, and expectancy in outcome evaluation. Brain Research, 1286, 114–22. [DOI] [PubMed] [Google Scholar]
- Yates J.F. (2010). Culture and probability judgment. Social and Personality Psychology Compass, 4(3), 174–88. [Google Scholar]
Associated Data
This section collects any data citations, data availability statements, or supplementary materials included in this article.