

Abstract
Exogenous attention allows the automatic detection of relevant stimuli and the reorientation of our current focus of attention towards them. Faces from an ethnic outgroup tend to capture exogenous attention to a greater extent than faces from an ethnic ingroup. We explored whether prejudice toward the outgroup, rather than lack of familiarity, is driving this effect. Participants (N = 76) performed a digit categorization task while distractor faces were presented. Faces belonged to (i) a prejudiced outgroup, (ii) a non-prejudiced outgroup and (iii) their ingroup. Half of the faces were previously habituated in order to increase their familiarity. Reaction times, accuracy and event-related potentials (ERPs) were recorded to index exogenous attention to distractor faces. Additionally, different indexes of explicit and implicit prejudice were measured, the latter being significantly greater towards prejudiced outgroup. N170 amplitude was greater to prejudiced outgroup—regardless of their habituation status—than to both non-prejudiced outgroup and ingroup faces and was associated with implicit prejudice measures. No effects were observed at the behavioral level. Our results show that implicit prejudice, rather than familiarity, is under the observed attention-related N170 effects and that this ERP component may be more sensitive to prejudice than behavioral measures under certain circumstances.
Keywords: exogenous attention, ethnic outgroup, implicit prejudice, N170, habituation
Exogenous attention assures the detection of salient and potentially significant stimuli outside the current focus of attention, the interruption of endogenous attention and its reorientation away from the current target and towards the potentially relevant distractor (Corbetta and Shulman, 2002; Corbetta et al., 2008). Behavioral evidence has shown that faces pertaining to an ethnic outgroup tend to capture exogenous attention to a greater extent than faces pertaining to an ethnic ingroup ( Correll et al., 2014; Dickter et al., 2015; Guillermo and Correll, 2016). Some authors have claimed that negative attitudes towards the ethnic outgroup may explain this bias (i.e. Donders et al., 2008; Trawalter et al., 2008). However, another study (Al-Janabi et al., 2012) found that an outgroup for which participants had not a negative attitude also captured exogenous attention to a greater extent than the participants’ ingroup. In consequence, several other authors have proposed the lack of perceptual experience—or familiarity—with faces from the outgroup as an explanatory factor of this bias (Al-Janabi et al., 2012; Correll et al., 2017). The aim of the present study was to shed light on whether an outgroup has necessarily to be associated with negative concepts (e.g. prejudice-laden) to capture exogenous attention to a greater extent than an ingroup or if the lack of perceptual experience with their facial morphology would be enough to elicit this difference.
Exogenous attention is frequently measured by ‘contingent but distinct target distractor’ (CDTD) tasks. In these tasks, distractors are presented concurrently with the targets to which participants must attend. The greater the saliency or relevance of each distractor, the greater their disrupting effect on the task, reflected in slower reaction times and/or lower accuracy in the main task (see a review in Carretié, 2014). In the present study, we employed a CDTD task where prejudiced and non-prejudiced outgroup and ingroup face pictures were presented as background distractors while participants carried out a digit categorization task. Our scope was to compare the capability of these three groups of distractor faces to grab exogenous attention manipulating their familiarity, as explained below. To that aim, we recorded the behavioral performance in the task [error rates (ER), reaction times (RT)] along with event-related potentials (ERPs). ERPs are particularly useful when analyzing early and rapid processes as exogenous attention because of its millisecond resolution. In previous studies employing face stimuli, the amplitude of the face-sensitive N170 ERP component has been reported to increase with enhanced attentional capture by faces (Mohamed et al., 2009; Carretié et al., 2012; Zhang et al., 2014; Bekhtereva et al., 2015; Neumann et al., 2018).
Distractors in our CDTD task were faces from an outgroup associated with high probability of being object of prejudice (prejudiced outgroup), from an outgroup associated with low probability of being object of prejudice (non-prejudiced outgroup), and from the ingroup. Importantly, participants were previously habituated to half of the faces of each group to increase their perceptual experience with faces of each of the three groups and, thus, to control this factor. If both outgroups captured attention to a greater extent than the ingroup, we might conclude that the lack of perceptual experience towards these faces would drive the attentional bias. However, if only the prejudiced outgroup elicited greater attentional capture than the other groups, we might conclude that prejudice would be an explanatory factor of the attentional bias. We hypothesize that faces pertaining to the prejudiced outgroup will capture attention to a greater extent than both ingroup and non-prejudiced outgroup faces, even though they had been previously habituated. Thus, we expect to find greater RTs, ERs and N170 amplitude for facial distractors belonging to the prejudiced outgroup compared to the other two groups, even if habituated.
Methods
Participants
Ninety-eight psychology students from the Universidad Autónoma de Madrid participated in this experiment, although data from only 76 of them (66 women, Mage = 19.34 years, age range: 18–35 years, s.d. = 1.73) could be analyzed, as explained later. The study was previously approved by the research ethics committee of this university. All participants reported normal or corrected-to-normal visual acuity, provided informed consent according to the Declaration of Helsinki and received academic reward.
Stimuli
Stimuli included four ingroup, non-prejudiced outgroup and prejudiced outgroup oval-shaped cropped male faces that served as distractors. These faces were selected from a previous questionnaire in which independent participants (N = 43, 40 females, Mage = 19.79, s.d. = 3.18) evaluated a pool of 30 faces from 6 different ethnic groups. Faces selected for the present study presented neutral expressive valence and neutral attractiveness and were perceived by at least 70% of the sample as pertaining to the group they were supposed to belong. Given the results of this previous questionnaire, faces from Northwestern Europe were selected as non-prejudiced outgroup, and faces from Central–South America were selected as prejudiced outgroup. Ingroup for our sample were faces from Spain. A detailed description of the stimuli, their low-level and high-level characteristics, as well as the procedure followed for their evaluation and selection phase is included in the Supplementary data.
During the CDTD task, a central dot and two digits (that served as targets) on each side of the dot were superimposed on each face (Figure 1). Twenty-four combination of digits were created and presented in each facial category (i.e. targets did not vary across conditions). Thus, each facial identity was presented 24 times. Faces subtended 21.52° high and 14.81° wide, and digits subtended 1.72° high and 5.72° wide in all cases.
Fig. 1.

Example of the stimuli displayed on the screen for the exogenous attention task.
Procedure
First session: habituation and CDTD task
Participants entered in an electrically shielded and sound-attenuated room, sat at 100 cm from the screen where the faces were presented and underwent a habituation task. To carry out this task, three types of stimuli were presented at the center of the screen: two ingroup faces, two non-prejudiced outgroup faces and two prejudiced outgroup faces of the same size as the faces that would be used during the CDTD task. Each stimulus was presented 100 times during 320 ms each, intertrial interval (ITI; the lapse between the offset of a stimulus and the onset of the next) being 2000 ms. Thus, the habituation task comprised 600 trials divided into 5 blocks, separated by a short resting period. Presentation order of conditions was randomized within each block. Half of the faces wore glasses artificially superimposed through a graphic design software. To ensure that participants were actively viewing the pictures, they were instructed to indicate, through a keypad, whether the presented face was wearing glasses or not.
Once finished the habituation task, participants underwent the CDTD task. According to the type of distractor, six types of facial distractors were presented: habituated ingroup, habituated non-prejudiced outgroup, habituated prejudiced outgroup, non-habituated ingroup, not-habituated non-prejudiced outgroup and non-habituated prejudiced outgroup. Each condition was presented 48 times and included two different facial identities. Therefore, the task comprised 288 trials, which were divided into 4 blocks separated by a short resting period. Presentation order of conditions was randomized within each block. Stimuli remained on the screen for 320 ms and ITI was 2400 ms. Participants were instructed to press as accurately and fast as possible one key if both digits were even or if both were odd (i.e. concordant) and a different key if one digit was even and the other one was odd (i.e. discordant). Among the 24 combinations of digits, half were concordant and the other half discordant. Participants were also instructed to look continuously at the fixation dot and to try to avoid blinking during stimulus presentation.
Second session: prejudice measures
During a second session, carried out 5 to 40 days later (M = 23.11, s.d. = 9.04), we asked participants to fill out several prejudice related and contact measure questionnaires, briefly described next (further details of each measure are described in the Supplementary data).
Implicit association test (Greenwald et al., 1998). Implicit prejudice against the non-prejudiced and the prejudiced outgroup was measured through two computer-based implicit association tests (IAT). This test took around 7 min.
Affective thermometer (Frias-Navarro, 2009). This test measured warmth for the non-prejudiced and the prejudiced outgroup. It took around 1 min.
Internal and external motivation to respond without prejudice (Plant and Devine, 1998). This test measures to which extent a person’s motivation to avoid prejudiced responses is internal (e.g. personal egalitarian values) or external (e.g. social reprobation). The test took around 20 min to be completed.
Close contact. We measured participants’ amount of close contact with each outgroup. This test took around 5 min to complete.
Ad hoc scale for non-prejudiced and prejudiced outgroup. We used three items from the Spanish adaptation (Frias-Navarro, 2009) of the subtle and blatant prejudice scale (Pettigrew and Meertens, 1995) to measure the explicit prejudice toward the non-prejudiced and the prejudiced outgroup. Completing this test took approximately 5 min.
EEG recording and pre-processing
EEG activity was recorded using an electrode cap (Electro-Cap International, Eaton, OH) with tin electrodes. Fifty-nine electrodes were placed at the scalp following a homogeneous distribution within the international 10–20 system. All scalp electrodes were referenced to the nose tip. Electrooculographic (EOG) data were recorded supraorbitally and infraorbitally (vertical EOG) as well as from the left vs right orbital rim (horizontal EOG). An online analog high-pass filter of 0.3 Hz was applied. Recordings were continuously digitized at a sampling rate of 420 Hz. An offline digital Butterworth bandpass filter (order, 4; direction, zero phase forward and reverse; two-pass filter) of 0.3–30 Hz was applied to continuous (pre-epoched) data using FieldTrip software (fieldtrip.fcdonders.nl; Oostenveld et al., 2011). The continuous recording was divided into 1000 ms epochs for each trial, beginning 200 ms before stimulus onset. Ocular artifact removal was carried out through a strategy based on independent component analysis (ICA) (Jung et al., 2000), as provided in FieldTrip. After the removal process based on ICA, a second stage of visual inspection of the EEG data was conducted. If any further artifact was present, the corresponding epoch was discarded. This artifact rejection procedure led to the average admission of 44.28 (s.d. = 3.66) habituated ingroup trials, 44.86 (3.23) habituated non-prejudiced outgroup trials, 45.25 (3.26) habituated prejudiced outgroup trials, 45.26 (2.90) non-habituated ingroup trials, 44.99 (3.22) non-habituated non-prejudiced outgroup trials and 45.51 (2.85) non-habituated prejudiced outgroup trials. The minimum number of trials accepted for averaging was 32 per participant and condition. Channels showing anomalous recordings were interpolated from neighbor channels within a radius of 5.5 cm and only when 10% or less channels were affected (i.e. six or less channels); if anomalous channels surpassed this percentage, we discarded the data from the corresponding participant. Five out of the 98 original participants were discarded for this reason. Five additional participants were discarded due to equipment failures that made not possible to properly record their data. All trials were analyzed, including those in which responses were incorrect or omitted, considering that attentional capture by facial distractors may produce precisely this kind of behavioral effects. Twelve additional participants were discarded due to wrong answers in the questionnaires of the second session, as explained in the Supplementary data.
Data analyses
Prejudice analyses
To compare participants’ attitude toward the prejudiced outgroup vs the non-prejudiced outgroup, we applied a repeated measures t-test on all questionnaires: IAT, affective thermometer, internal and external motivation to respond without prejudice, close contact and the ad hoc scale.
Behavioral analyses
We considered the average RT of correct responses from valid trials (i.e. trials with a response between 200 and 2000 ms) for each condition and ER as the number of incorrectly responded trials divided by the number of valid trials. Further, we carried out a 3 × 2 (group [ingroup, non-prejudiced outgroup, prejudiced outgroup] × habituation [habituated, non-habituated]) repeated measures ANOVA on RT and ER.
Detection, spatiotemporal characterization and quantification of ERP components
Detection and quantification of N170 was carried out through a covariance–matrix-based temporal PCA (tPCA), a strategy that has repeatedly been recommended for these purposes (e.g. Chapman and McCrary, 1995; Dien, 2010). In brief, tPCA computes the covariance between all ERP time points, which tends to be high between those involved in the same component and low between those belonging to different components, and groups them into temporal factors (TFs). Once quantified in temporal terms, N170 topography at the scalp level was decomposed into its main spatial regions via a spatial PCA (sPCA) performed on TF scores. sPCA provides a reliable division of the scalp into different regions or spatial factors (SFs). Basically, each SF is formed by the scalp points where recordings tend to covary. TF and SF scores are the parameters in which TFs and SFs can be quantified and are linearly related to amplitudes. The decision on the number of factors to select, both in the tPCA and the sPCA, was based on the scree test (Cliff, 1987). Extracted factors were submitted to promax rotation in both cases (Dien, 2010). Although we controlled attractivenes, facial expression and luminance of facial stimuli (Supplementary data), other low-level differences might remain uncontrolled, given that facial identities are different across the three groups; thus, we also analyzed P1, an ERP component that is strongly affected by low-level characteristics of visual stimuli (Rossion and Caharel, 2011). Parallely to N170, P1 was detected and quantified through tPCA, and the corresponding TF was also submitted to a subsequent sPCA in order to extract its main spatial regions or SFs. EEG, behavioral and questionnaires data are available at osf.io/tsbyw/.
ERP analyses
Experimental effects on N170 were tested by introducing group (ingroup, non-prejudiced outgroup, prejudiced outgroup) and habituation (habituated, non-habituated) as within-participant factors in two repeated measures ANOVA (one for each spatial factor). We computed effect sizes in these ANOVAs using the partial eta-square ( ) method, and we used the Bonferroni correction for post hoc comparisons to determine the significance of pairwise contrasts. Sphericity violations were corrected applying the Greenhouse–Geisser correction. The same analytical procedure was carried out for P1 component to infer any potential effect of low-level differences among experimental conditions.
Results
Prejudice measures
Repeated measures t-tests on attitude questionnaires revealed that, first, participants showed a more negative bias in the IAT towards the prejudiced outgroup (M = −0.44, s.d. = 0.30), compared to the non-prejudiced outgroup (M = −0.09, s.d. = 0.35; t(70) = −6.58, P < 0.001). Both scores resulted different from 0 (t(75) = −10.704, P < 0.001 for prejudiced outgroup and t(75) = −2.571, P = 0.012 for the non-prejudiced outgroup). This implies that the ingroup presented stronger preference compared to both outgroups. Second, in the affective thermometer, participants reported a ‘warmer’ relationship with the non-prejudiced outgroup (M = 7.32, s.d. = 1.57) than with the prejudiced outgroup (M = 6.72, s.d. = 2.17; t(70) = 2.66, P = 0.010). Third, external motivation to respond without prejudice was greater for the prejudiced outgroup (M = 16.36, s.d. = 7.15) compared to the non-prejudiced outgroup (M = 13.53, s.d. = 6.80; t(70) = −5.38, P < 0.001). However, internal motivation to respond without prejudice did not show any significant difference for the prejudiced outgroup (M = 29.84, s.d. = 4.39) compared to the non-prejudiced outgroup (M = 30.44, s.d. = 4.30; t(70) = 1.41, P = 0.162). The ad hoc scale neither yielded a significant difference for the prejudiced outgroup (M = 9.46, s.d. = 2.95) compared to the non-prejudiced outgroup (M = 9.16, s.d. = 2.90; t(70) = −1.05, P = 0.474). Finally, participants reported to have had more close contact with the prejudiced outgroup (M = 20.43, s.d. = 6.08) compared to the non-prejudiced outgroup (M = 14.84, s.d. = 6.19), t(70) = −5.22, P < 0.001). This result was expected given that immigration from Central and South America is approximately 2.3 times greater than immigration from Northwestern Europe (National Institute of Statistics, https://bit.ly/2WEL52S). Table 1 includes descriptive data and results for all contrasts related to the questionnaires.
Table 1.
Means and s.d. (in parenthesis) for prejudice scales. t and P value for the contrast between non-prejudiced (non-P) and prejudiced (P) outgroup
| Non-P outgroup | P outgroup | t (70) | P value | |
|---|---|---|---|---|
| IAT | −0.09 (0.30) | −0.44 (0.35) | -6.580 | <0.001 |
| Affective thermometer | 7.32 (1.57) | 6.72 (2.17) | 2.660 | 0.010 |
| Ad hoc prejudice | 9.16 (2.90) | 9.46 (2.95) | -1.045 | 0.474 |
| External motivation | 13.53 (6.80) | 16.36 (7.15) | -5.375 | <0.001 |
| Internal motivation | 30.44 (4.30) | 29.84 (4.39) | 1.413 | 0.162 |
| Contact | 14.84 (6.19) | 20.43 (6.08) | -5.221 | <0.001 |
Behavioral measures
Analyses on RT and ER failed to reach significance in any contrast (P > 0.05). Table 2 shows means and s.d. for RT and ER contrasts.
Table 2.
Means and s.d. (in parenthesis) and percentage of errors for ingroup, non-prejudiced outgroup (non-P outgroup) and prejudiced outgroup (P outgroup)
| Reaction times | Error rates | |||
|---|---|---|---|---|
| Non-habituated | Habituated | Non-habituated | Habituated | |
| Ingroup | 865.10 (15.60) | 875.54 (16.07) | 10.78 (0.79) | 10.67 (0.79) |
| Non-P outgroup | 872.28 (15.58) | 865.69 (15.95) | 11.07 (0.83) | 12.56 (0.86) |
| P outgroup | 873.01 (16.22) | 867.61 (15.82) | 11.40 (0.83) | 10.93 (0.86) |
Electrophysiological measures
Detection, spatiotemporal characterization and quantification of N170 and P1
The first analytical step consisted in detecting and quantifying the left and right N170 through tPCA and sPCA (see Data analyses section). Nine TFs were extracted by tPCA and submitted to promax rotation (Figure 2A). Factor peak latency (188 ms after stimulus presentation) revealed TF6 as the critical component (Figure 2B). Next, sPCA decomposed TF6 into five SFs or scalp regions. Of these regions, the relevant ones would be those showing the occipitoparietal lateral topographies that typically characterize N170, SF4 and SF3, as can be seen in Figure 2D and F, respectively. The SF scores (equivalent to amplitudes, as previously explained) of SF3 and SF4 (right and left N170, hereafter) were extracted per participant and condition. Grand averages corresponding to representative channels for left and right N170 are presented in Figure 2C and E, respectively. In the case of P1, factor peak latency (around 160 ms after stimulus presentation) revealed TF7 as the critical component. Next, sPCA decomposed TF7 in 5 SF or scalp regions. Of these regions, SF2 showed the occipital topography that characterizes the P1 sensitivity to visual attributes. Also in this case, the SF scores were extracted per participant and condition and submitted to ANOVA analysis.
Fig. 2.

(A) Loads for temporal factor 6 (blue) at each time point. (B) TF6 loads for each channel. (C) Left N170 (and P1) at PO7 grand averages. (D) Spatial factor 4 (left N170) loads for each channel. (E) Right N170 (and P1) at PO8 grand averages. (F) Spatial factor 3 (right N170) loads for each channel.
Experimental effects
We carried out two 3 × 2 (group [ingroup, non-prejudiced outgroup, prejudiced outgroup] × habituation [habituated, non-habituated]) repeated measures ANOVAs, one for the left and the other one for the right N170 factor scores. Table 3 summarizes the main results of these analyses. The right N170 ANOVA revealed a significant main effect only for group (F(2,150) = 9.58, P < 0.001,  =0.113). Post hoc comparisons showed more negative N170 for the prejudiced outgroup compared to both the ingroup (P = 0.001) and the non-prejudiced outgroup (P = 0.001). No other pairwise comparisons resulted significant. The habituation main effect was not significant (F(1,75) = 0.292, P = 0.590), and neither was the interaction effect (F(2,150) = 1.673, P = 0.191).
Table 3.
ANOVA results for right and left N170 and P1
| Right N170 | Left N170 | P1 | ||
|---|---|---|---|---|
| Group | F(2,150) | 9.575 | 7.727 | 4.035 |
| P | <0.001 | 0.001 | 0.020 | |

|
0.108 | 0.060 | 0.051 | |
| Habituation | F(1,75) | 0.292 | 0.976 | 1.508 |
| P | 0.590 | 0.326 | 0.223 | |

|
0.004 | 0.013 | 0.051 | |
| Interaction | F(2,150) | 1.673 | 0.664 | 0.155 |
| P | 0.191 | 0.516 | 0.857 | |

|
0.022 | 0.009 | 0.002 | |
The left N170 ANOVA also yielded a significant main effect for group (F (2,150) = 7.727, Greenhouse–Geisser (0.90) corrected P = 0.001,  =0.093). Again, post hoc comparisons showed more negative N170 scores for the prejudiced outgroup compared to both the ingroup (P < 0.001) and the non-prejudiced outgroup (P = 0.014), other pairwise contrasts being non-significant. Neither the habituation main effects (F(1, 75) = 0.976, P = 0.326) nor the group–habituation interaction (F(2,150) = 0.664, P = 0.516) reached significance. Figure 3 shows means and SEMs of SF scores for right and left N170.
Fig. 3.
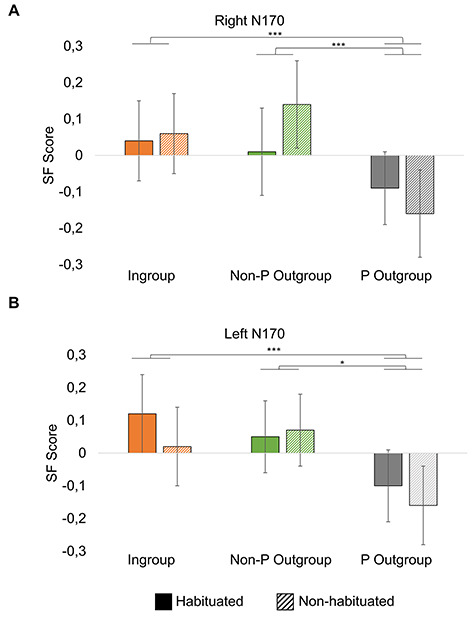
Right (A) and left (B) N170 spatial factor scores (linearly related to amplitudes) for habituated and non-habituated Ingroup, non-prejudiced outgroup (non-P outgroup) and prejudiced outgroup (P outgroup) (*P < 0.05, ***P < 0.001).
As a sort of control analysis on the potential effect of low-level visual attributes in brain activity, an equivalent ANOVA was carried out for P1, as explained. This ANOVA yielded a significant main effect of the group (F(2,150) = 4.035, P = 0.020,  =0.051). Post hoc comparisons showed that P1 was greater for the ingroup compared to the non-prejudiced outgroup (P = 0.031). No other pairwise comparisons were significant. The habituation main effect was not significant (F(1,75) = 1.508, P = 0.223), and neither was the interaction effect (F(2,150) = 0.155, P = 0.857). To explore whether the effects observed in N170 were explained, at least partially, by the neural processes reflected in P1, an additional ANCOVA analysis was carried out on N170 amplitudes introducing the same variables as in the ANOVA, plus P1 as a covariate. Results showed that, after removing the effects of P1 from the model, the group main effect remained significant in N170, both right and left (F(2,363) = 13.349, P < 0.001 and F(2,363) = 12.436, P < 0.001, respectively). Post hoc comparisons also revealed the same effects (i.e. more negative N170 for the prejudiced outgroup compared to both the ingroup and the non-prejudiced outgroup (all P < 0.005). There was no significant interaction of P1 with any effect of the model (all P > 0.05).
Relationship between N170 and prejudice measures
To explore the relationship between exogenous attention, indexed through N170 amplitude, and prejudice, it was necessary to reduce N170 to two group levels, the same levels of the prejudice measures, without losing relevant information. To that aim, we calculated an exogenous attention index for each outgroup. Since ANOVAs revealed that habituation factor did not elicit significant differences, we computed the average of N170 amplitudes evoked by both habituated and non-habituated faces for each group. Next, we subtracted the average N170 for the ingroup from the average N170 for each outgroup. This index reflects the outgroup vs ingroup differential exogenous attention. A negative value means that outgroup N170 amplitude is greater (more negative) than ingroup amplitude. Two indices were obtained for each participant, one for the prejudiced outgroup and one for the non-prejudiced outgroup. We used a stepwise multiple regression model to determine if this N170 index may be explained by one or more of the prejudice measures, which had shown significant differences between groups (i.e. IAT, affective thermometer and external motivation to respond without prejudice). For both right and left N170 topographies, we found that IAT scores were able to explain N170 differences between the non-prejudiced and the prejudiced outgroup, compared to the ingroup (F(1,150) = 4.663, P = 0.032, β = 0.174, R2 = 0.024 and F(1,150) = 4.448, P = 0.037, β = 0.170, R2 = 0.022, for right and left N170, respectively), while the affective thermometer and external motivation measures seemed to be redundant after including IAT in the regression model (P of all β > 0.05). This positive relation means that the greater (the more negative) the N170 for the outgroup compared to the ingroup, the more negative is the IAT score (meaning more prejudice).
Discussion
The present study was carried out in order to shed light on the question whether greater exogenous attention to an outgroup, compared to the ingroup, is due to its association with negative concepts or due to the lack of perceptual experience with this outgroup. To this end, a CDTD task was implemented employing both habituated and non-habituated prejudiced and non-prejudiced outgroup and ingroup faces as distractors while participants carried out a digit categorization task and their behavioral performance and N170 amplitudes were recorded. Additionally, subjective prejudice measures were collected.
Prejudice measures corroborated that prejudice was greater for the prejudiced outgroup than for the non-prejudiced outgroup. Specifically, participants showed a more negative bias in the IAT towards the prejudiced outgroup compared to the non-prejudiced outgroup and a ‘warmer’ relationship with the non-prejudiced outgroup compared to the prejudiced outgroup, as indicated by the affective thermometer. The close contact scale showed that participants have more contact with the prejudiced outgroup than with the non-prejudiced outgroup. With respect to the internal and external motivation to respond without prejudice, participants did not show any significant differences in the internal scale but showed a greater external motivation in respect to the prejudiced outgroup compared to the non-prejudiced outgroup. Devine et al. (2002) suggested that only people with low external motivation to respond without prejudice are truly unprejudiced; thus, this result is compatible with the view that people have stronger prejudices against the prejudiced outgroup compared to the non-prejudiced outgroup. In line with this, the lack of significant difference in the three items forming the ad hoc scale might be explained by participants refraining from explicitly showing their true beliefs.
Our results suggest that exogenous attention towards an outgroup seems to be driven by prejudice and not by the lack of familiarity. First, prejudice-related results measured using several scales allow us to conclude that our prejudiced outgroup was indeed perceived as more negative than the non-prejudiced outgroup. Second, right and left N170 amplitudes as an index of exogenous attention to facial distractors were enhanced for the prejudiced outgroup compared to both the non-prejudiced outgroup and ingroup, which did not differ significantly. Importantly, there was no evidence of a significant interaction between habituation and group. This result implies that the lack of perceptual experience with an outgroup does not seem enough to capture attention to a greater extent than the ingroup. A third key result that further supports our hypothesis is the association between IAT scores and N170 amplitude for each outgroup compared to the ingroup, as revealed by regression analyses.
A relevant issue at this point is whether high-level (or top-down) processes—such as social prejudice—may modulate N170 as they modulate later components such as EPN or LPP (Baum et al., 2018; Baum and Abdel-Rahman, 2020). It is widely and traditionally accepted that N170 is sensitive to configural (low-level) aspects of faces (e.g. see a review in Eimer, 2011), but a key question is whether this low-level processing is influenced by high-level mechanisms. The fact that N170 is influenced by biographical information (Galli et al., 2006), by the context generated by other faces (e.g. Lin et al., 2015) or by facial emotional expressions (see a meta-analysis in Hinojosa et al., 2015) points to this possibility. Crucially, and as regards facial emotional expressions, N170 appears to be sensitive to their global meaning: expressions requiring rapid social responses in the receiver eliciting the greatest N170 amplitudes (Hinojosa et al., 2015). Prejudice would potentially involve these high-order influences (among others) as mentioned in the Introduction, since certain biographical, contextual and/or emotional inferences may be automatically triggered by out- and ingroup faces.
Behavioral measures, unlike N170 amplitudes, did not show any significant effect for group, habituation or their interaction. Within the literature, behavioral evidence has been elusive. For example, Trawalter et al. (2008), experiment 1, only found preferential attention to the outgroup in the first half of the task. Similarly, Donders et al. (2008) and Dickter et al. (2015) did not find greater attentional capture for the outgroup but a relationship between attentional capture and measures of stereotype towards the outgroup and close contact with the outgroup, respectively. When interpreting the lack of correspondence between behavioral and ERP outcomes, it is important to bear in mind that a behavioral response such as that required here is a single output or final balance resulting from a set of multiple cognitive stages such as perception, attention, decision-making and motor execution, among others, which may point in different directions (e.g. some inhibiting others). Contrarily, ERPs may reflect, separately, these different stages and disentangle their specific behavior as regards the stimulus. At this respect, N170 may be reflecting prejudice-related processes that are inhibited by top-down influences in other processing stages, leading to a ‘neutralized’—in terms of prejudice—behavioral response. This lack of behavioral evidence is congruent with the results of a comprehensive review showing that neural indices of exogenous attention are more sensitive to attentional capture than behavioral measures (Carretié, 2014).
Previous studies showing greater exogenous attention allocation for negatively laden outgroups corroborate the present conclusion (e.g. Donders et al., 2008; Trawalter et al., 2008; Dickter et al., 2015; Guillermo and Correll, 2016). Outcomes of these studies have usually been interpreted as a bias towards threat-related stimuli. In contrast, Al-Janabi et al. (2012) had proven that faces of an ethnic outgroup—which participants explicitly evaluated as similarly threatening as the ingroup—also captured exogenous attention to a greater extent than the ingroup. Thus, according to these authors, any ethnic outgroup, negatively considered or not, would engender greater attentional capture than the ingroup due to the lack of perceptual experience: participants are not familiarized with the facial morphs of the outgroup. In line with this idea, the perceptual enrichment, expectancy and reciprocity (PEER) model (Correll et al., 2017) establishes that our experience perceiving faces creates an expectancy about how a face should look like, that is, a canonical face. When a face deviates from that expectancy, attention is driven towards it due to that deviation from a canonical face. But importantly, though the authors of the PEER model claim that the deviation of the canonical face would be enough to provoke an attentional bias, they do not discard that part of this bias might be due to negative associations with the outgroup.
A question that arises is why N170 has not shown significant differences between the ingroup and the non-prejudiced outgroup, since the possibility that this component generally reflects intergroup facial differences—regardless the prejudice—has been raised (Ito and Bartholow, 2009). However, evidence from studies that explored N170 sensitivity to ethnic background is heterogeneous. On the one hand, several of them have shown no modulation of ethnic background in N170 (e.g. Caldara et al., 2003; Caldara et al., 2004; Wiese et al., 2009; Hahn et al., 2012; Chen et al., 2013; Lv et al., 2015) and even greater N170 amplitudes for the ingroup (Ito and Urland, 2005; Senholzi and Ito, 2012, Ethnic categorization task 2). On the other hand, a good number of studies have found evidence of a greater N170 for the outgroup compared to the ingroup (Herrmann et al., 2007; Stahl et al., 2008, 2010; Caharel et al., 2011; Senholzi and Ito, 2012; Montalan et al., 2013; Komes et al., 2014; Ran et al., 2014, Identity categorization task; Walker et al., 2008; Wiese et al., 2012). In the vast majority of all these studies, participants were Caucasians, and outgroups were Afro-Americans or Asians. Whereas the prejudice that participants could hold against these outgroups was not measured, this factor is probably underlying, at least partially, the observed effects (Cottrell and Neuberg, 2005). Interestingly, N170 amplitude has been previously related to intergroup attitudes. Ofan et al. (2011) showed that automatic preference towards the ingroup correlated with N170 amplitude towards an outgroup. Additionally, Walker et al. (2008) showed that greater quality of contact with the outgroup correlated with a reduced difference of the N170 amplitude to outgroup vs ingroup faces. Thus, under the assumption that greater N170 amplitude for an outgroup is probably driven by prejudice, the lack of difference between the ingroup and the non-prejudiced outgroup seems reasonable.
In this study, and to disentangle the possible confusion between familiarity and prejudice, we directly compared a prejudice laden outgroup and a non-prejudiced laden outgroup and found that only the prejudiced laden outgroup caused the increase of exogenous attention, which corroborates that it is necessary for an outgroup to be laden with prejudice to bias attention. For our participants—Spanish with Spanish parents—faces of both outgroups were much less common than the ones they are used to perceive. Interestingly, they even reported more contact with the prejudiced outgroup than with the non-prejudiced outgroup (i.e. they reported more perceptual experience with the former than with the latter), so that the results should have been the opposite (i.e. maximal exogenous attention to the non-prejudiced outgroup) in order to confirm the perceptual experience hypothesis. In any case, our results are compatible with the PEER model (Correll et al., 2017), which does not discard that part of the attentional bias might be due to negative associations with the outgroup. Indeed, our data cannot completely dismiss the influence of perceptual experience in exogenous attention to social groups since both outgroups, though not as frequent as Spanish people, are relatively familiar in our country. Future studies exploring more unfamiliar outgroups should be carried out to explore this issue.
To the best of our knowledge, this is the first study that analyzed exogenous attention to an ingroup vs outgroup including a non-prejudiced outgroup, i.e. an outgroup presenting relatively low probability to be the object of prejudice. Furthermore, it is the first study that measured exogenous attention employing ERPs and that measured prejudice in both an explicit and implicit manner. Additionally, as far as we know, it is the only one using a habituation procedure to control for perceptual experience with the faces. In conclusion, our results suggest that the capability of outgroup faces to capture exogenous attention seems not to be due to their unfamiliarity but to the prejudice against that group. This study points to an enhanced sensitivity of ERPs—as compared to behavioral measures—to prejudice, at least in exogenous attention tasks.
Supplementary Material
Acknowledgments
The authors would like to thank Amalio Blanco for his useful suggestions on prejudice subjective measurements.
Funding
This work was supported by the Ministerio de Ciencia e Innovación, Spain (PGC2018-093570-B-I00); the Universidad Autónoma de Madrid/Comunidad de Madrid, Spain (2017-T2/SOC-5569); the Comunidad de Madrid (HUM19-HUM5705, SI1-PJI-2019-00011); and by the Ministerio de Educación, Cultura y Deporte, Spain (FPU13/06512). This work was presented as a poster at the meeting of the European Society for Cognitive and Affective Neuroscience (ESCAN) in Leiden, 2018.
Declaration of interest
The authors declare no conflict of interest.
References
- Al-Janabi S., MacLeod C., Rhodes G. (2012). Non-threatening other-race faces capture visual attention: evidence from a dot-probe task. PLoS One, 7(10), e46119. [DOI] [PMC free article] [PubMed] [Google Scholar]
- Baum J., Abdel-Rahman R.A. (2020). Emotional news affects information processing and social judgments independent of perceived media credibility. Biorxiv, 2020.02.29.971234. [DOI] [PMC free article] [PubMed] [Google Scholar]
- Baum J., Rabovsky M., Rose S.B., Abdel Rahman R. (2018). Clear judgments based on unclear evidence: person evaluation is strongly influenced by untrustworthy gossip. Emotion, 20, 248–60. [DOI] [PubMed] [Google Scholar]
- Bekhtereva V., Craddock M., Müller M.M. (2015). Attentional bias to affective faces and complex iaps images in early visual cortex follows emotional cue extraction. NeuroImage, 112, 254–66. [DOI] [PubMed] [Google Scholar]
- Caharel S., Montalan B., Fromager E., Bernard C., Lalonde R., Mohamed R. (2011). Other-race and inversion effects during the structural encoding stage of face processing in a race categorization task: an event-related brain potential study. International Journal of Psychophysiology, 79(2), 266–71. [DOI] [PubMed] [Google Scholar]
- Caldara R., Thut G., Servoir P., Michel C., Bovet P., Renault B. (2003). Face versus non-face object perception and the ‘other-race’effect: a spatiotemporal event-related potential study. Clinical Neurophysiology, 114(3), 515–28. [DOI] [PubMed] [Google Scholar]
- Caldara R., Rossion B., Bovet P., Hauert C.A. (2004). Event-related potentials and time course of the ‘other-race’ face classification advantage. Neuroreport, 15(5), 905–10. [DOI] [PubMed] [Google Scholar]
- Carretié L. (2014). Exogenous (automatic) attention to emotional stimuli: a review. Cognitive, Affective, & Behavioral Neuroscience, 14(4), 1228–58. [DOI] [PMC free article] [PubMed] [Google Scholar]
- Carretié L., Kessel D., Carboni A., et al. (2012). Exogenous attention to facial vs non-facial emotional visual stimuli. Social Cognitive and Affective Neuroscience, 8(7), 764–73. [DOI] [PMC free article] [PubMed] [Google Scholar]
- Chapman R.M., McCrary J.W. (1995). EP component identification and measurement by principal components-analysis. Brain and Cognition, 27(3), 288–310. [DOI] [PubMed] [Google Scholar]
- Chen Y., Pan F., Wang H., Xiao S., Zhao L. (2013). Electrophysiological correlates of processing own-and other-race faces. Brain Topography, 26(4), 606–15. [DOI] [PubMed] [Google Scholar]
- Cliff N. (1987). Analyzing Multivariate Data, Harcourt Brace Jovanovich. [Google Scholar]
- Corbetta M., Shulman G.L. (2002). Control of goal-directed and stimulus driven attention in the brain. Nature Reviews Neuroscience, 3(3), 201. [DOI] [PubMed] [Google Scholar]
- Corbetta M., Patel G., Shulman G.L. (2008). The reorienting system of the human brain: from environment to theory of mind. Neuron, 58(3), 306–24. [DOI] [PMC free article] [PubMed] [Google Scholar]
- Correll J., Guillermo S., Vogt J. (2014). On the flexibility of attention to race. Journal of Experimental Social Psychology, 55, 74–9. [Google Scholar]
- Correll J., Hudson S.M., Guillermo S., Earls H.A. (2017). Of kith and kin: perceptual enrichment, expectancy, and reciprocity in face perception. Personality and Social Psychology Review, 21(4), 336–60. [DOI] [PubMed] [Google Scholar]
- Cottrell C.A., Neuberg S.L. (2005). Different emotional reactions to different groups: a sociofunctional threat-based approach to "prejudice". Journal of Personality and Social Psychology, 88(5), 770. [DOI] [PubMed] [Google Scholar]
- Devine P.G., Plant E.A., Amodio D.M., Harmon-Jones E., Vance S.L. (2002). The regulation of explicit and implicit race bias: the role of motivations to respond without prejudice. Journal of Personality and Social Psychology, 82(5), 835. [PubMed] [Google Scholar]
- Dickter C.L., Gagnon K.T., Gyurovski I.I., Brewington B.S. (2015). Close contact with racial outgroup members moderates attentional allocation towards outgroup versus ingroup faces. Group Processes & Intergroup Relations, 18(1), 76–88. [Google Scholar]
- Dien J. (2010). The ERP PCA toolkit: an open source program for advanced statistical analysis of event-related potential data. Journal of Neuroscience Methods, 187(1), 138–45. [DOI] [PubMed] [Google Scholar]
- Donders N.C., Correll J., Wittenbrink B. (2008). Danger stereotypes predict racially biased attentional allocation. Journal of Experimental Social Psychology, 44(5), 1328–33. [Google Scholar]
- Eimer M. (2011). The face-sensitive N170 component of the event-related brain potential In: Calder A.J., Rhodes G., Johnson M.H., Haxby J.V., editors. The Oxford Handbook of Face Perception, Oxford: Oxford University Press, pp. 329–44. [Google Scholar]
- Frias-Navarro D. (2009). Adaptación al español del instrumento de Prejuicio Manifiesto y Sutil de Pettigrew y Meertens (1995). Valencia: Universidad de Valencia; Available:http://www.uv.es/friasnav/pmps.pdf. [Google Scholar]
- Galli G., Feurra M., Viggiano M.P. (2006). “Did you see him in the newspaper?” electrophysiological correlates of context and valence in face processing. Brain Research, 1119, 190–202. [DOI] [PubMed] [Google Scholar]
- Greenwald A.G., McGhee D.E., Schwartz J.L. (1998). Measuring individual differences in implicit cognition: the implicit association test. Journal of Personality and Social Psychology, 74(6), 1464. [DOI] [PubMed] [Google Scholar]
- Guillermo S., Correll J. (2016). Attentional biases toward latinos. Hispanic Journal of Behavioral Sciences, 38(2), 264–78. [Google Scholar]
- Hahn A.C., Jantzen K.J., Symons L.A. (2012). Thatcherization impacts the processing of own-race faces more so than other-race faces: an ERP study. Social Neuroscience, 7(2), 113–25. [DOI] [PubMed] [Google Scholar]
- Herrmann M., Schreppel T., Jäger D., Koehler S., Ehlis A.-C., Fallgatter A. (2007). The other-race effect for face perception: an event-related potential study. Journal of Neural Transmission, 114(7), 951. [DOI] [PubMed] [Google Scholar]
- Hinojosa J.A., Mercado F., Carretié L. (2015). N170 sensitivity to facial expression: a meta-analysis. Neuroscience & Biobehavioral Reviews, 55, 498–509. [DOI] [PubMed] [Google Scholar]
- Ito T.A., Bartholow B.D. (2009). The neural correlates of race. Trends in Cognitive Sciences, 13(12), 524–31. [DOI] [PMC free article] [PubMed] [Google Scholar]
- Ito T.A., Urland G.R. (2005). The influence of processing objectives on the perception of faces: an ERP study of race and gender perception. Cognitive, Affective, & Behavioral Neuroscience, 5(1), 21–36. [DOI] [PubMed] [Google Scholar]
- Jung T.P., Makeig S., Humphries C., et al. (2000). Removing electroencephalographic artifacts by blind source separation. Psychophysiology, 37(2), 163–78. [PubMed] [Google Scholar]
- Komes J., Schweinberger S.R., Wiese H. (2014). Preserved fine-tuning of face perception and memory: evidence from the own-race bias in high-and low-performing older adults. Frontiers in Aging Neuroscience, 6, 60. [DOI] [PMC free article] [PubMed] [Google Scholar]
- Lin H., Schulz C., Straube T. (2015). Fearful contextual expression impairs the encoding and recognition of target faces: an ERP study. Frontiers in Behavioral Neuroscience, 9, 237. [DOI] [PMC free article] [PubMed] [Google Scholar]
- Lv J., Yan T., Tao L., Zhao L. (2015). The role of configural processing in face classification by race: an ERP study. Frontiers in Human Neuroscience, 9, 679. [DOI] [PMC free article] [PubMed] [Google Scholar]
- Mohamed T.N., Neumann M.F., Schweinberger S.R. (2009). Perceptual load manipulation reveals sensitivity of the face-selective N170 to attention. Neuroreport, 20(8), 782–7. [DOI] [PubMed] [Google Scholar]
- Montalan B., Veujoz M., Boitout A., et al. (2013). Investigation of effects of face rotation on race processing: an ERPs study. Brain and Cognition, 81(3), 360–9. [DOI] [PubMed] [Google Scholar]
- Neumann M.F., Viska C.G., Huis S., Palermo R. (2018). Similar distraction, but differential suppression, for faces and non-face objects: evidence from behaviour and event-related potentials. Biological Psychology, 139, 39–46. [DOI] [PubMed] [Google Scholar]
- Ofan R.H., Rubin N., Amodio D.M. (2011). Seeing race: N170 responses to race and their relation to automatic racial attitudes and controlled processing. Journal of Cognitive Neuroscience, 23(10), 3153–61. [DOI] [PubMed] [Google Scholar]
- Oostenveld R., Fries P., Maris E., Schoffelen J.M. (2011). Fieldtrip: open source software for advanced analysis of MEG, EEG, and invasive electrophysiological data. Computational Intelligence and Neuroscience, 2011, 1. [DOI] [PMC free article] [PubMed] [Google Scholar]
- Pettigrew T.F., Meertens R.W. (1995). Subtle and blatant prejudice in Western Europe. European Journal of Social Psychology, 25(1), 57–75. [Google Scholar]
- Plant E.A., Devine P.G. (1998). Internal and external motivation to respond without prejudice. Journal of Personality and Social Psychology, 75(3), 811. [DOI] [PubMed] [Google Scholar]
- Ran G., Zhang Q., Chen X., Pan Y. (2014). The effects of prediction on the perception for own-race and other-race faces. PLoS One, 9(11), e114011. [DOI] [PMC free article] [PubMed] [Google Scholar]
- Rossion B., Caharel S. (2011). ERP evidence for the speed of face categorization in the human brain: disentangling the contribution of low-level visual cues from face perception. Vision Research, 51(12), 1297–311. [DOI] [PubMed] [Google Scholar]
- Senholzi K.B., Ito T.A. (2012). Structural face encoding: how task affects the N170’s sensitivity to race. Social Cognitive and Affective Neuroscience, 8(8), 937–42. [DOI] [PMC free article] [PubMed] [Google Scholar]
- Stahl J., Wiese H., Schweinberger S.R. (2008). Expertise and own-race bias in face processing: an event-related potential study. Neuroreport, 19(5), 583–7. [DOI] [PubMed] [Google Scholar]
- Stahl J., Wiese H., Schweinberger S.R. (2010). Learning task affects ERPcorrelates of the own-race bias, but not recognition memory performance. Neuropsychologia, 48(7), 2027–40. [DOI] [PubMed] [Google Scholar]
- Trawalter S., Todd A.R., Baird A.A., Richeson J.A. (2008). Attending to threat: race-based patterns of selective attention. Journal of Experimental Social Psychology, 44(5), 1322–7. [DOI] [PMC free article] [PubMed] [Google Scholar]
- Walker P.M., Silvert L., Hewstone M., Nobre A.C. (2008). Social contact and other-race face processing in the human brain. Social Cognitive and Affective Neuroscience, 3(1), 16–25. [DOI] [PMC free article] [PubMed] [Google Scholar]
- Wiese H., Stahl J., Schweinberger S.R. (2009). Configural processing of other-race faces is delayed but not decreased. Biological Psychology, 81(2), 103–9. [DOI] [PubMed] [Google Scholar]
- Wiese H., Kaufmann J.M., Schweinberger S.R. (2012). The neural signature of the own-race bias: evidence from event-related potentials. Cerebral Cortex, 24(3), 826–35. [DOI] [PubMed] [Google Scholar]
- Zhang D., Liu Y., Zhou C., Chen Y., Luo Y. (2014). Spatial attention effects of disgusted and fearful faces. PLoS One, 9(7), e101608. [DOI] [PMC free article] [PubMed] [Google Scholar]
Associated Data
This section collects any data citations, data availability statements, or supplementary materials included in this article.