

Abstract
Background
Since December 2019, an outbreak of Coronavirus disease 2019 (COVID-19) caused by the severe acute respiratory syndrome coronavirus 2 (SARS-Cov-2) initially emerged in Wuhan, China, and has spread worldwide now. Clinical features of patients with COVID-19 have been described. However, risk factors leading to in-hospital deterioration and poor prognosis in COVID-19 patients with severe disease have not been well identified.
Methods
In this retrospective, single-center cohort study, 1190 adult inpatients (≥ 18 years old) with laboratory-confirmed COVID-19 and determined outcomes (discharged or died) were included from Wuhan Infectious Disease Hospital from December 29, 2019 to February 28, 2020. The final follow-up date was March 2, 2020. Clinical data including characteristics, laboratory and imaging information as well as treatments were extracted from electronic medical records and compared. A multivariable logistic regression model was used to explore the potential predictors associated with in-hospital deterioration and death.
Results
1190 patients with confirmed COVID-19 were included. Their median age was 57 years (interquartile range 47–67 years). Two hundred and sixty-one patients (22%) developed a severe illness after admission. Multivariable logistic regression demonstrated that higher SOFA score (OR 1.32, 95% CI 1.22–1.43, per score increase, p < 0.001 for deterioration and OR 1.30, 95% CI 1.11–1.53, per score increase, p = 0.001 for death), lymphocytopenia (OR 1.81, 95% CI 1.13–2.89 p = 0.013 for deterioration; OR 4.44, 95% CI 1.26–15.87, p = 0.021 for death) on admission were independent risk factors for in-hospital deterioration from not severe to severe disease and for death in severe patients. On admission D-dimer greater than 1 μg/L (OR 3.28, 95% CI 1.19–9.04, p = 0.021), leukocytopenia (OR 5.10, 95% CI 1.25–20.78), thrombocytopenia (OR 8.37, 95% CI 2.04–34.44) and history of diabetes (OR 11.16, 95% CI 1.87–66.57, p = 0.008) were also associated with higher risks of in-hospital death in severe COVID-19 patients. Shorter time interval from illness onset to non-invasive mechanical ventilation in the survivors with severe disease was observed compared with non-survivors (10.5 days, IQR 9.25–11.0 vs. 16.0 days, IQR 11.0–19.0 days, p = 0.030). Treatment with glucocorticoids increased the risk of progression from not severe to severe disease (OR 3.79, 95% CI 2.39–6.01, p < 0.001). Administration of antiviral drugs especially oseltamivir or ganciclovir is associated with a decreased risk of death in severe patients (OR 0.17, 95% CI 0.05–0.64, p < 0.001).
Conclusions
High SOFA score and lymphocytopenia on admission could predict that not severe patients would develop severe disease in-hospital. On admission elevated D-dimer, leukocytopenia, thrombocytopenia and diabetes were independent risk factors of in-hospital death in severe patients with COVID-19. Administration of oseltamivir or ganciclovir might be beneficial for reducing mortality in severe patients.
Keywords: Risk factors, COVID-19, Development, Severe, Mortality
Introduction
Since December 2019, respiratory tract infection cases caused by virus occurred in Wuhan, Hubei Province, China [1, 2]. At first, a majority of cases was clustered around the local Huanan Seafood Wholesale Market, where wild animals were illegally sold. Then, the disease had rapidly spread from Wuhan to all over the China and to many foreign countries [3]. On Jan 7, the responsible novel coronavirus was identified by the Chinese Center for Disease Control and Prevention (CDC), and was subsequently named as severe acute respiratory syndrome coronavirus 2 (SARS-CoV-2; previously known as 2019-nCoV) by WHO, and pneumonia caused by 2019-nCoV was named COVID-19 [4]. The emerging virus was rapidly characterized as a novel member of the coronavirus family [5].
Some case series have demonstrated the clinical characteristics and epidemiological features of COVID-19 [6–8]. Clinical manifestations caused by SARS-CoV-2 varied, encompassing asymptomatic infection, pneumonia, acute respiratory distress syndrome (ARDS) and even death [6–8]. The mortality of patients with severe illness is extremely high [9]. However, risk factors leading to deterioration and poor outcome in severe COVID-19 patients have not been well described. In the present study, the clinical data of 1190 COVID-19 patients admitted in Wuhan Infectious Disease Hospital (discharge or death) were collected to analyze the clinical features and potential predictors for deterioration and/or death in COVID-19 patients. We paid close attention to the issues as below: first, comparing the clinical features between different severity and outcomes, shedding light on the risk factors for mortality and progression prediction; second, comparing the time interval to respiratory supports between survivors and non-survivors, exploring the preferable respiratory support to decrease mortality.
Methods
Study design and participants
This was a single-center, retrospective, observational study conducted from December 29, 2019, to February 28, 2020. A total of 1190 adult (18–94 years) patients with confirmed COVID-19 from Wuhan Infectious Disease Hospital were enrolled. All patients with confirmed COVID-19 enrolled in this study were diagnosed according to World Health Organization (WHO) interim guidance [10]. This study was approved by the Medicine Institutional Review Board of Wuhan Infectious Disease Hospital (KY-2020-03.01). Informed consents were waived from study participants.
Data collection
The epidemiological, demographic, clinical, laboratory data were extracted mostly on admission from medical records. The collected information included age, sex, comorbidities, exposure history, oxygen support during hospitalization (nasal cannula, non-invasive mechanical ventilation, invasive mechanical ventilation or invasive medical ventilation with extracorporeal membrane oxygenation [ECMO]), symptoms onset on admission, vital signs, serum laboratory tests (including blood routine tests, blood chemical variables, procalcitonin, coagulation function tests), chest X-ray and computed tomographic (CT) scans, therapeutic strategy during hospitalization (antivirus treatment [ganciclovir, oseltamivir, arbidol, lopinavir and ritonavir, interferon], antibiotics [cefprozil, ceftriaxone, cefoperazone–sulbactam, piperacillin–tazobactam, biapenem, meropenem, vancomycin, linezolid, sulfamethoxazole, levofloxacin and moxifloxacin], glucocorticoids) and outcomes. Throat-swab specimens from patients with history of epidemiology and characteristics of virus pneumonia in chest CT or X-ray, were obtained. The time interval between two specimens was at least 24 h apart. Detection of 2019-nCoV nucleic acid was performed at the CDC before January 23, 2020, and subsequently at designated hospitals (Chinese Academy of Medical Sciences, Academy of Military Medical Sciences, and Wuhan Institute of Virology of the Chinese Academy of Sciences) as previously described. Patients with at least two consecutive times of positive results from high-throughput sequencing or real-time reverse-transcriptase polymerase chain reaction (RT-PCR) assay of nasal and pharyngeal swab specimens were confirmed with COVID-19. The included patients in the current study were all with determined laboratory results.
Definition
COVID-19 diagnosis was according to WHO interim guidance [10]. The severity of COVID-19 was classified into mild, moderate, severe and critical type. The classification was assessed according to the diagnosis and treatment of COVID-19 guidelines (sixth version) published by the National Health Commission of China [11] (Additional file 1). Progressors were defined as mild or moderate patients who developed severe or critically illness during hospitalization. Non-progressors were defined as mild or moderate patients who never developed severe or critically illness during hospitalization. The disease onset was defined as the day when related symptoms first appeared.
Endpoints
In the present study, the endpoints included in-hospital deterioration and/or death among those with severe disease. The time intervals from symptom onset or admission to high-flow nasal oxygen, non-invasive mechanical ventilation (NIV), invasive mechanical ventilation (IMV), extracorporeal membrane oxygenation (ECMO) were also recorded.
Statistical analysis
Statistical analyses were performed using SPSS (version 24.0, SPSS Inc., Chicago, IL, USA) and SAS (version 9.3, SAS Institute, Cary, NC). Continuously normally distributed data were reported as mean (deviation) and compared using Student’s t test. Continuously non-normally distributed data were reported as median (interquartile range) and compared using Wilcoxon rank-sum test. Categorical data were presented as n (percentage) and compared using Chi-square test, Fisher’s exact test, and Cochran–Mantel–Haenszel test, as appropriate.
The potential risk factors for in-hospital deterioration (from not severe to severe disease) and death particularly in severe COVID-19 patients were determined using univariable and multivariable logistic regression model and displayed as odds ratio (OR) and 95% confidence interval (CI). Variables with a p value of 0.05 or less in the univariable analysis were considered as candidate variables in the multivariable analysis. Due to the statistical rule that the ratio of events and per variable should be ten or more, only 16 variables were finally selected based on the clinical importance. To exclude the possible bias introduced by missing data, we performed a sensitivity analysis using multiple imputations to account for missing data. Five imputations of complete data were generated and refitted into the multivariable logistic regression to test whether a selected variable remained to be the independent factor for illness deterioration and in-hospital mortality.
To evaluate the effects of anti-viral agents on clinical outcomes, we compared the difference of mortality and median survival time between patients who received or not received the anti-viral agents as follows: oseltamivir, ganciclovir, lopinavir–ritonavir, γ-interferon, arbidol. Kaplan–Meier curves and log-rank test were also used for survival analyses. To explore whether a specific anti-viral agent was independently associated with prolonged survival, we used multivariable Cox proportional-hazards model to compute the hazard ratio (HR) for each anti-viral agent by incorporating the same co-variables used in the multivariable logistic regression model for adjustment. A two-sided p value less than 0.05 was defined as statistically significant for all the analyses.
Results
Demographic and clinical characteristics
1190 patients with confirmed COVID-19 were recorded in Wuhan Infectious Disease Hospital during the study period, including 555 (46.6%) females and 635 males (53.4%), with an average age of 57 years (47–67). The flowchart of the current study is shown in Fig. 1. Demographic and clinical details were obtained for all the patients (Table 1). In total, 131 (11.4%) patients had a history of exposure to the Huanan seafood market, 132 (11.2%) were household clustered, and 16 (1.4%) were medical staff. The most commonly self-reported symptoms on admission were fever (n = 971, 81.9%), cough (n = 879, 74.2%), dyspnea (n = 548, 46.3%), fatigue (n = 434, 36.7%) and sputum production (n = 417, 35.2%). 441 (37.1%). Patients had comorbidities, including chronic obstructive pulmonary disease (n = 22, 1.9%), diabetes (n = 144, 12.2%), hypertension (n = 308, 26.1%), chronic cardiac disease (n = 86, 7.3%), chronic kidney disease (n = 30, 2.6%), chronic liver disease (n = 40, 3.4%), stroke (n = 39, 3.3%), malignancy (n = 34, 2.9%), immunosuppression (n = 24, 2.0%), and tuberculosis (n = 15, 1.3%).
Fig. 1.
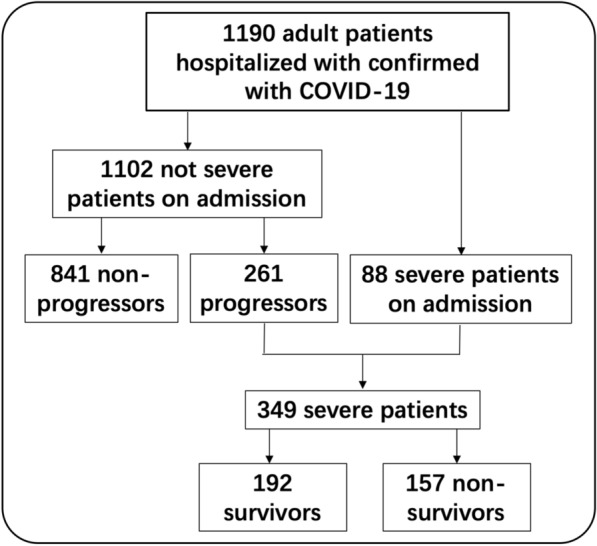
Flowchart in the present study
Table 1.
Clinical characteristics, radiographic, laboratory results of patients with COVID-19
| All patients (n = 1190) | Survivor (n = 1033) | Non-survivor (n = 157) | p value | |
|---|---|---|---|---|
| Age | ||||
| Median (IQR), year | 57 (47, 67) | 56 (46, 65) | 69 (62, 77) | < 0.0001 |
| Sex, n (%) | ||||
| Female | 555 (46.6) | 498 (48.2) | 57 (36.3) | 0.0053 |
| Male | 635 (53.4) | 535 (51.8) | 100 (63.7) | |
| Smoking, n (%) | 45 (4.5) | 40 (4.6) | 5 (3.8) | 1 |
| Drinking, n (%) | 48 (4.6) | 43 (4.7) | 5 (3.9) | 0.6901 |
| Epidemic disease history, n (%) | ||||
| Influenza A | ||||
| Negative | 1131 (96.5) | 987 (96.7) | 144 (94.8) | 0.4308 |
| Positive | 19 (1.6) | 15 (1.5) | 4 (2.6) | |
| Unchecked or unknown | 22 (1.9) | 18 (1.8) | 4 (2.6) | |
| Influenza B | ||||
| Negative | 1133 (96.6) | 990 (97.0) | 143 (94.1) | 0.1257 |
| Positive | 18 (1.5) | 13 (1.2) | 5 (3.3) | |
| Unchecked or unknown | 22 (1.9) | 18 (1.8) | 4 (2.6) | |
| Exposure history, n (%) | ||||
| Huanan seafood market | 131 (11.4) | 125 (12.5) | 6 (4.1) | 0.0028 |
| Wuhan exposure | 1119 (94.7) | 968 (94.2) | 151 (98.1) | 0.0451 |
| Other parts of Hubei | 56 (5.0) | 54 (5.5) | 2 (1.4) | 0.0373 |
| Contact with wildlife | 17 (1.5) | 17 (1.8) | 0 (0.0) | 0.2238 |
| Medical staff | 16 (1.4) | 16 (1.6) | 0 (0.0) | 0.2446 |
| Clustered cases | 132 (11.2) | 118 (11.5) | 14 (9.2) | 0.6726 |
| Any comorbidity, n (%) | 441 (37.1%) | 345 (33.4%) | 96 (61.15%) | < 0.0001 |
| Chronic obstructive pulmonary disease | 22 (1.9) | 14 (1.4) | 8 (5.3) | 1 |
| Diabetes | 144 (12.2) | 105 (10.2) | 39 (25.5) | < 0.0001 |
| Hypertension | 308 (26.1) | 244 (23.8) | 64 (41.8) | < 0.0001 |
| Chronic cardiac disease | 86 (7.3) | 61 (6.0) | 25 (16.3) | < 0.0001 |
| Chronic kidney disease | 30 (2.6) | 24 (2.4) | 6 (3.9) | 0.38 |
| Chronic liver disease | 40 (3.4) | 32 (3.1) | 8 (5.2) | 0.1779 |
| Stroke | 39 (3.3) | 28 (2.7) | 11 (7.2) | 0.0041 |
| Malignancy | 34 (2.9) | 26 (2.5) | 8 (5.2) | 0.1115 |
| Immunosuppression | 24 (2.0) | 15 (1.5) | 9 (5.9) | 0.0009 |
| Tuberculosis | 15 (1.3) | 10 (1.4) | 5 (3.3) | 0.0475 |
| Signs and symptoms at admission, n (%) | ||||
| Fever | 971 (81.9) | 834 (80.9) | 137 (89.0) | 0.0152 |
| Median highest temperature (IQR), °C | 38.5 (38.0, 39.0) | 38.5 (38.0, 39.0) | 38.5 (38.0, 39.0) | 0.0233 |
| Nasal congestion | 11 (0.9) | 8 (0.8) | 3 (2.0) | 1 |
| Nasal discharges | 16 (1.4) | 13 (1.3) | 3 (2.0) | 0.7521 |
| Sneeze | 5 (0.4) | 4 (0.4) | 1 (0.7) | 0.5019 |
| Sore throat | 39 (3.3) | 36 (3.5) | 3 (2.0) | 0.3171 |
| Cough | 879 (74.2) | 751 (72.8) | 128 (83.7) | 0.0041 |
| Sputum production | 417 (35.2) | 352 (34.1) | 65 (42.5) | 0.0438 |
| Dyspnoea | 548 (46.3) | 439 (42.6) | 109 (71.2) | < 0.0001 |
| Chest pain | 62 (5.3) | 56 (5.5) | 6 (3.9) | 0.427 |
| Hemoptysis | 14 (1.2) | 11 (1.1) | 3 (2.0) | 0.5846 |
| Headache | 61 (5.2) | 59 (5.8) | 2 (1.3) | 0.0204 |
| Myalgia | 133 (11.3) | 116 (11.3) | 17 (11.1) | 0.937 |
| Fatigue | 434 (36.7) | 369 (35.9) | 65 (42.5) | 0.1128 |
| Gastrointestinal symptoms | 214 (18.2) | 189 (18.4) | 25 (16.3) | 0.5333 |
| Eye symptoms | 23 (2.0) | 22 (2.2) | 1 (0.7) | 0.3502 |
| Ronchi | 57 (4.8) | 47 (4.6) | 10 (6.5) | 0.2953 |
| Crackles | 170 (14.4) | 143 (13.9) | 27 (17.5) | 0.2265 |
| Systolic pressure | ||||
| Median (IQR), mmHg | 122 (111, 135) | 122 (110, 134) | 130.5 (117, 144) | 0.0002 |
| Diastolic pressure | ||||
| Median (IQR), mmHg | 80 (72, 87) | 80 (73, 87) | 80 (72, 87) | 0.0944 |
| Heart rate | ||||
| Median (IQR), bpm | 86 (79, 96) | 86 (78, 96) | 89 (82, 102) | < 0.0001 |
| Respiratory rate | ||||
| Median (IQR), bpm | 22 (20, 25) | 21 (20, 25) | 23 (20, 28) | 0.9936 |
| SOFA | 3 (1, 5) | 2 (1, 4) | 10 (6, 18) | < 0.0001 |
| APACHEII | 3 (1, 6) | 3 (1, 5) | 10.5 (8, 17) | < 0.0001 |
| Laboratory findings | ||||
| Leucocytes (IQR-109/L) | 6.3 (4.6, 9.1) | 6.0 (4.5, 8.1) | 15.5 (8.9, 21.9) | < 0.0001 |
| Distribution, n (%) | ||||
| < 4 | 185 (16.1) | 171 (16.9) | 14 (10.1) | < 0.0001 |
| 4–10 | 726 (63.0) | 702 (69.2) | 24 (17.3) | |
| > 10 | 242 (21.0) | 141 (13.9) | 101 (72.6) | |
| Neutrophils (IQR-109/L) | 4.4 (2.9, 7.3) | 4.1 (2.8, 6.2) | 14.7 (9.9, 20.3) | < 0.0001 |
| Distribution, n (%) | ||||
| < 1.8 | 65 (5.8) | 61 (6.1) | 4 (3.1) | < 0.0001 |
| 1.8–6.3 | 715 (63.2) | 702 (70.2) | 13 (10.0) | |
| > 6.3 | 351 (31.0) | 237 (23.7) | 114 (87.0) | |
| Lymphocytes (IQR-109/L) | 1.2 (0.7, 1.6) | 1.2 (0.9, 1.6) | 0.5 (0.3, 0.9) | < 0.0001 |
| Distribution, n (%) | ||||
| < 0.8 | 315 (28.0) | 221 (22.2) | 94 (72.9) | < 0.0001 |
| ≥ 0.8 | 809 (72.0) | 774 (77.8) | 35 (27.1) | |
| CD3 (IQR-/μL) | 618 (427, 964) | 647 (468, 991) | 367 (267, 409) | < 0.0001 |
| CD4 (IQR-/μL) | 366 (242, 594) | 388 (275, 645) | 211 (275, 645) | < 0.0001 |
| CD8 (IQR-/μL) | 235 (138, 337) | 242 (156, 356) | 129 (87, 144) | < 0.0001 |
| Hemoglobin (IQR-g/L) | 120 (109.0, 130.0) | 120 (110.0, 130.0) | 120 (103.0, 133.0) | 0.4723 |
| Distribution, n (%) | ||||
| ≤ 90 | 54 (4.7) | 7 (3.7) | 17 (12.8) | < 0.0001 |
| > 90 | 1092 (95.3) | 976 (96.3) | 116 (87.3) | |
| Platelets (IQR-109/L) | 193 (143.0, 250.0) | 201 (154.0, 256.0) | 90.5 (50.0, 165.0) | < 0.0001 |
| Distribution, n (%) | ||||
| < 100 | 122 (10.6) | 49 (4.8) | 73 (52.9) | < 0.0001 |
| ≥ 100 | 1029 (89.4) | 964 (95.2) | 65 (47.1) | |
| Prothrombin time (IQR-s) | 11.5 (10.7, 12.6) | 11.4 (10.6, 12.3) | 14 (12.4, 17.5) | < 0.0001 |
| Distribution, n (%) | ||||
| < 10.5 | 201 (18.0) | 197 (20.0) | 4 (3.0) | < 0.0001 |
| 10.5–13.5 | 763 (68.2) | 711 (72.3) | 52 (38.8) | |
| > 13.5 | 154 (13.8) | 76 (7.7) | 78 (58.2) | |
| Activated-partial thromboplastin time (IQR-s) | 27.7 (24.3, 32.5) | 27.2 (24.2, 31.8) | 33.4 (26.1, 38.9) | < 0.0001 |
| Distribution, n (%) | ||||
| < 21 | 68 (6.1) | 61 (6.2) | 7 (5.4) | < 0.0001 |
| 21–37 | 927 (83.4) | 847 (86.3) | 80 (62.0) | |
| > 37 | 116 (10.4) | 74 (7.5) | 42 (32.6) | |
| Thrombin time (IQR, s) | 17.9 (16.7, 20.6) | 17.8 (16.7, 20.4) | 18.4 (17.1, 23.0) | 0.0054 |
| Distribution, n (%) | ||||
| < 13 | 8 (0.7) | 8 (0.8) | 0 (0.0) | 0.0321 |
| 13–21 | 842 (75.9) | 753 (76.7) | 89 (69.5) | |
| > 21 | 260 (23.4) | 221 (22.5) | 39 (30.5) | |
| D-dimer (IQR, μg/mL) | 0.9 (0.4, 2.5) | 0.8 (0.4, 1.6) | 17.8 (4.5, 56.5) | < 0.0001 |
| Distribution, n (%) | ||||
| ≤ 0.5 | 323 (29.6) | 319 (33.2) | 4 (3.1) | < 0.0001 |
| 0.5–1 | 279 (25.6) | 270 (28.1) | 9 (6.9) | |
| > 1 | 489 (44.8) | 371 (38.7) | 118 (90.9) | |
| Total bilirubin (IQR, μmol/L) | 13 (10.1, 17.7) | 12.4 (9.8, 16.1) | 24.9 (16.6, 36.1) | < 0.0001 |
| Distribution, n (%) | ||||
| ≤ 26 | 1005 (90.0) | 932 (94.8) | 73 (54.5) | < 0.0001 |
| > 26 | 112 (10.0) | 51 (5.2) | 61 (45.5) | |
| Alanine aminotransferase (IQR-U/L) | 42 (25.0, 66.0) | 40 (24.0, 62.0) | 47 (31.0, 84.0) | 0.0003 |
| Distribution, n (%) | ||||
| ≤ 40 | 559 (48.8) | 508 (50.2) | 51 (37.8) | 0.0065 |
| > 40 | 587 (51.2) | 503 (49.8) | 84 (62.2) | |
| Aspartate aminotransferase (IQR-U/L) | 35 (26.0, 51.0) | 33 (25.0, 46.0) | 58 (44.0, 109.0) | < 0.0001 |
| Distribution, n (%) | ||||
| ≤ 40 | 702 (61.2) | 680 (67.3) | 22 (16.1) | < 0.0001 |
| > 40 | 445 (38.8) | 330 (32.7) | 115 (83.9) | |
| Albumin (IQR, g/L) | 31.3 (28.0, 34.7) | 32 (29.0, 35.2) | 26.15 (24.3, 28.3) | < 0.0001 |
| Distribution, n (%) | ||||
| < 40 | 1106 (96.2) | 966 (95.6) | 140 (100.0) | 0.0144 |
| 40–55 | 41 (3.6) | 41 (4.1) | 0 (0.0) | |
| > 55 | 3 (0.3) | 3 (0.3) | 0 (0.0) | |
| Serum prealbumin (IQR-g/L) | 125 (80.0, 187.0) | 137 (91.0, 194.0) | 48.5 (29.5, 75.0) | < 0.0001 |
| Distribution, n (%) | ||||
| < 200 | 874 (79.2) | 748 (76.7) | 126 (98.4) | < 0.0001 |
| 200–430 | 229 (20.8) | 227 (23.3) | 2 (1.6) | |
| Blood urea nitrogen (IQR-mmol/L) | 5.2 (4.1, 6.8) | 4.97 (4.0, 6.2) | 13.2 (7.7, 20.3) | < 0.0001 |
| Distribution, n (%) | ||||
| < 3.1 | 81 (7.1) | 81 (8.0) | 0 (0.0) | < 0.0001 |
| 3.1–8 | 865 (75.7) | 827 (82.1) | 38 (28.4) | |
| > 8 | 196 (17.2) | 100 (9.9) | 96 (71.6) | |
| Serum creatinine (IQR, μmol/L) | 72.6 (59.6, 88.6) | 71.5 (59.0, 84.3) | 107.8 (69.2, 196.7) | <0.0001 |
| Distribution, n (%) | ||||
| > 133 | 84 (7.4) | 32 (3.2) | 52 (39.4) | < 0.0001 |
| ≤ 133 | 1051 (92.6) | 971 (96.8) | 80 (60.6) | |
| Creatine kinase (IQR-U/L) | 78 (51.0, 151.0) | 73 (49.0, 132.5) | 240 (101.0, 553.0) | < 0.0001 |
| Distribution, n (%) | ||||
| < 50 | 243 (23.7) | 236 (25.7) | 7 (6.6) | < 0.0001 |
| 50–310 | 676 (65.9) | 619 (67.3) | 57 (53.8) | |
| > 310 | 107 (10.4) | 65 (7.0) | 42 (39.6) | |
| Creatine kinase isoenzyme MB (IQR-U/L) | 14 (10.0, 18.0) | 13 (10.0, 17.0) | 24 (18.0, 47.0) | < 0.0001 |
| Distribution, n (%) | ||||
| ≤ 24 | 960 (88.4) | 896 (93.3) | 64 (50.8) | < 0.0001 |
| > 24 | 126 (11.6) | 64 (6.7) | 62 (49.2) | |
| C-reactive protein (IQR, mg/L) | 30.1 (5.7, 92.0) | 22.5 (4.3, 67.2) | 160 (124.2, 177.1) | < 0.0001 |
| Distribution, n (%) | ||||
| ≤ 6.9 | 290 (28.4) | 287 (32.1) | 3 (2.3) | < 0.0001 |
| > 6.9 | 731 (71.6) | 606 (67.9) | 125 (97.7) | |
| Serum amyloid protein A (IQR-mg/L) | 190.8 (34.3, 275.9) | 178.6 (25.6, 270.3) | 260.1 (188.9, 284.0) | < 0.0001 |
| Distribution, n (%) | ||||
| ≤ 10 | 151 (15.8) | 149 (17.5) | 2 (1.9) | < 0.0001 |
| > 10 | 805 (84.2) | 702 (82.5) | 103 (98.1) | |
| Serum ferritin (IQR-ng/mL) | 406.1 (137.2, 800.8) | 384.8 (146.0, 711.8) | 616.6 (38.7, 2000.0) | 0.0099 |
| Distribution, n (%) | ||||
| < 21.8 | 36 (4.7) | 32 (4.9) | 4 (3.6) | 0.7535 |
| 21.8–274.6 | 263 (34.2) | 224 (34.1) | 39 (34.8) | |
| > 274.6 | 470 (61.1) | 401 (61.0) | 69 (61.6) | |
| Interleukin-6 (IQR-pg/mL) | 14.45 (8.0, 416.0) | 13.2 (7.7, 366.2) | 31.9 (11.1, 1487.0) | < 0.0001 |
| Distribution, n (%) | ||||
| ≤ 7 | 28 (3.4) | 25 (3.5) | 3 (2.8) | 0.909 |
| > 7 | 789 (96.6) | 684 (96.5) | 105 (97.2) | |
| Radiologic findings | ||||
| Abnormalities, n (%) | ||||
| Ground-glass opacity | 1027 (92.3) | 910 (92.3) | 117 (92.1) | 0.9474 |
| Pulmonary consolidation | 194 (17.4) | 155 (15.7) | 39 (30.7) | < 0.0001 |
| Pulmonary interstitial abnormalities | 700 (63.0) | 609 (61.8) | 91 (71.7) | 0.0309 |
| Pneumothorax | 31 (2.8) | 24 (2.4) | 7 (5.5) | 0.0901 |
| Pleural effusion | 49 (4.4) | 43 (4.4) | 6 (4.7) | 0.851 |
SOFA Sequential Organ Failure Assessment, APACHEII Acute Physiology and Chronic Health Evaluation II, ICU intensive care unit, MV mechanical ventilation
On admission, the conditions of most patients (1102, 92.6%) were not severe, of whom 261 (22.7%) patients progressed into severe disease after admission (median 12 days, IQR 2–15 days). Compared with non-progressors, patients that progressed into a severe disease were older (62 vs. 55 year, p < 0.0001) and more male (60.1% vs. 51.0%, p = 0.0097), had more comorbidities such as diabetes (16.5% vs. 9.8%, p = 0.0033), hypertension (29.7% vs. 22.6%, p = 0.0208), stroke (7.3% vs. 2.2%, p = 0.0001), malignancy (4.7% vs. 2.0%, p = 0.0214) and immunosuppression (4.7% vs. 0.8%, p = 0.0001), and showed more severe initial symptoms, such as dyspnea (60.1% vs. 39.7%, p < 0.0001) and higher heart rate (89 vs. 85 bpm, p = 0.0002) (Table 2).
Table 2.
Treatments and clinical outcomes of patients with COVID-19
| All patients (n = 1190) | Survivor (n = 1033) | Non-survivor (n = 157) | p value | |
|---|---|---|---|---|
| Treatments, n (%) | ||||
| Antibiotic | 977 (87.7) | 859 (87.0) | 118 (92.9) | 0.0575 |
| Antifungal | 50 (4.5) | 35 (3.6) | 15 (11.8) | < 0.0001 |
| Antiviral | 681 (61.1) | 626 (63.4) | 55 (43.3) | < 0.0001 |
| Glucocorticoids | 289(25.9) | 213 (21.6) | 76 (59.8) | < 0.0001 |
| Oxygen therapy, n (%) | < 0.0001 | |||
| None | 203 (17.1) | 203 (19.7) | 0 (0.0) | |
| Nasal cannula | 792(66.6) | 776 (75.1) | 16(10.2) | |
| Mask oxygen | 27 (2.3) | 19 (1.9) | 7 (4.5) | |
| High-flow nasal cannula | 60 (5.0) | 24 (2.3) | 36 (22.9) | |
| Non-invasive mechanical ventilation | 62 (5.2) | 4 (0.4) | 58 (36.9) | |
| Invasive mechanical ventilation | 42 (3.5) | 6 (0.6) | 36 (22.9) | |
| ECMO | 4(0.3) | 0 | 4 (2.6) | |
| Outcomes | ||||
| Duration of MV (IQR), days | 5 (2.0, 8.0) | 6 (5.0, 9.0) | 4 (2.0,8.0) | 0.1563 |
| Duration of ICU stay (IQR), days | 6 (3.0, 10.5) | 7 (4.0, 11.0) | 5 (2.0, 9.0) | 0.0522 |
| Duration of in-hospital stay (IQR), days | 11 (7.0, 14.5) | 11 (8.0, 15.0) | 8 (4.0, 12.0) | < 0.0001 |
| In-hospital mortality, n (%) | 157 (13.2) | 0 (0.0) | 157 (100.0) | < 0.0001 |
ECMO extracorporeal membrane oxygenation, ICU intensive care unit, MV mechanical ventilation
A total of 349 severe patients were found including 88 patients who were severe on admission and 261 patients who had an initial not severe disease that progressed to a severe disease during their hospital stay. There were 157 (45.0%) deaths among the 349 severe patients. Non-survivors were older than in survivors (69 vs. 57 year, p < 0.0001). There were more comorbidities including diabetes (25.5% vs. 12.2%, p = 0.0015), hypertension (41.8% vs. 29.0%, p = 0.0127) and chronic cardiac disease (16.3% vs. 6.3%, p = 0.0029) in the non-survivor group than in the survivor group. The major in-hospital complication rates were higher in the non-survivor group than in the survivor group (Additional file 2: Table S1). Compared with survivors, non-survivors presented with more dyspnea (71.2% vs. 55.2%, p = 0.0023) on admission (Table 3).
Table 3.
Clinical characteristics, radiographic, laboratory results of the study patients
| Not severe patients at admission (n = 1102) | Non-progressors (n = 841) | Progressors (n = 261) | p value | Severe patients (n = 349) | Survivor (n = 192) | Non-survivor (n = 157) | p value | |
|---|---|---|---|---|---|---|---|---|
| Age | ||||||||
| Median (IQR), year | 56 (46, 66) | 55 (45, 65) | 62 (52, 70) | < 0.0001 | 63 (53, 72) | 57 (48, 66) | 69 (62, 77) | < 0.0001 |
| Sex, n (%) | ||||||||
| Female | 516 (46.8) | 412 (49.0) | 104 (39.9) | 0.0097 | 143 (41.0) | 86 (44.8) | 57 (36.3) | 0.1088 |
| Male | 586 (53.2) | 429 (51.0) | 157 (60.1) | 206 (59.0) | 106 (55.2) | 100 (63.7) | ||
| Smoking, n (%) | 40 (4.3) | 25 (3.5) | 15 (7.2) | 1 | 20 (7.0) | 15 (9.9) | 5 (3.8) | 1 |
| Drinking, n (%) | 44 (4.6) | 25 (3.3) | 19 (8.8) | 0.0006 | 23 (7.9) | 18 (11.0) | 5 (3.9) | 0.0251 |
| Epidemic disease history, n (%) | ||||||||
| Influenza A | ||||||||
| Negative | 1045 (96.3) | 799 (96.3) | 246 (96.5) | 0.4315 | 332 (97.1) | 188 (98.9) | 144 (94.8) | 0.0421 |
| Positive | 19 (1.8) | 13 (1.6) | 6 (2.3) | 6 (1.7) | 2 (1.1) | 4 (2.6) | ||
| Unchecked or unknown | 21 (1.9) | 18 (2.1) | 3 (1.2) | 4 (1.2) | 0 (0.00) | 4 (2.6) | ||
| Influenza B | ||||||||
| Negative | 1048 (96.5) | 800 (96.3) | 248 (97.3) | 0.6044 | 333 (97.4) | 190 (100.0) | 143 (94.1) | 0.0032 |
| Positive | 17 (1.6) | 13 (1.5) | 4 (1.6) | 5 (1.5) | 0 (0.0) | 5 (3.3) | ||
| Unchecked or unknown | 21 (1.9) | 18 (2.2) | 3 (1.1) | 4 (1.1) | 0 (0.0) | 4 (2.6) | ||
| Exposure history, n (%) | ||||||||
| Huanan seafood market | 126 (11.9) | 96 (11.8) | 30 (12.2) | 0.8499 | 35 (10.5) | 29 (15.7) | 6 (4.1) | 0.0006 |
| Wuhan exposure | 1032 (94.3) | 788 (94.0) | 244 (95.3) | 0.4385 | 331 (96.2) | 180 (94.7) | 151 (98.1) | 0.1089 |
| Other parts of Hubei | 55 (5.2) | 44 (5.4) | 11 (4.6) | 0.6121 | 12 (3.8) | 10 (5.7) | 2 (1.4) | 0.0458 |
| Contact with wildlife | 17 (1.6) | 10 (1.2) | 7 (3.0) | 0.1169 | 7 (2.2) | 7 (4.0) | 0 (0.0) | 0.0404 |
| Medical staff | 16 (1.5) | 16 (1.9) | 0 (0.0) | 0.0608 | 0 (0.0) | 0 (0.0) | 0 (0.0) | 1 |
| Clustered cases | 125 (11.5) | 88 (10.6) | 37 (14.5) | 0.1597 | 44 (12.8) | 30 (15.8) | 14 (9.2) | 0.1736 |
| Any comorbidity, n (%) | 383 (34.8) | 265 (31.5) | 118 (45.2) | < 0.0001 | 176 (50.4) | 80 (41.7) | 96 (61.2) | 0.0003 |
| Chronic obstructive pulmonary disease | 18 (1.7) | 9 (1.1) | 9 (3.6) | 0.2117 | 13 (3.8) | 5 (2.7) | 8 (5.3) | 1 |
| Diabetes | 124 (11.4) | 82 (9.8) | 42 (16.5) | 0.0033 | 62 (18.1) | 23 (12.2) | 39 (25.5) | 0.0015 |
| Hypertension | 265 (24.3) | 189 (22.6) | 76 (29.7) | 0.0208 | 119 (34.7) | 55 (29.0) | 64 (41.8) | 0.0127 |
| Chronic cardiac disease | 70 (6.4) | 49 (5.9) | 21 (8.2) | 0.1823 | 37 (10.8) | 12 (6.3) | 25 (16.3) | 0.0029 |
| Chronic kidney disease | 29 (2.7) | 20 (2.4) | 9 (3.5) | 0.3326 | 10 (2.9) | 4 (2.1) | 6 (3.9) | 0.5022 |
| Chronic liver disease | 37 (3.4) | 28 (3.4) | 9 (3.5) | 0.9165 | 12 (3.5) | 4 (2.1) | 8 (5.2) | 0.1132 |
| Stroke | 36 (3.3) | 18 (2.2) | 18 (7.3) | 0.0001 | 21 (6.1) | 10 (5.3) | 11 (7.2) | 0.4595 |
| Malignancy | 29 (2.7) | 17 (2.0) | 12 (4.7) | 0.0214 | 17 (5.0) | 9 (4.7) | 8 (5.2) | 0.8347 |
| Immunosuppression | 19 (1.8) | 7 (0.8) | 12 (4.7) | 0.0001 | 17 (5.0) | 8 (4.2) | 9 (5.9) | 0.4695 |
| Tuberculosis | 14 (1.3) | 8 (1.0) | 6 (2.4) | 0.1589 | 7 (2.1) | 2 (1.1) | 5 (3.3) | 0.2858 |
| Signs and symptoms at admission, n (%) | ||||||||
| Fever | 889 (81.0) | 671 (80.0) | 218 (84.2) | 0.1329 | 300 (86.7) | 163 (84.9) | 137 (89.0) | 0.2684 |
| Median highest temperature (IQR) °C | 38.5 (38.0, 39.0) | 38.4 (38.0, 39.0) | 38.55 (38.0, 39.0) | 0.4549 | 38.5 (38.0, 39.0) | 38.5 (38.0, 39.0) | 38.5 (38.0, 39.0) | 0.0554 |
| Nasal congestion | 11 (1.0) | 5 (0.6) | 6 (2.3) | 1 | 6 (1.7) | 3 (1.6) | 3 (2.0) | 1 |
| Nasal discharges | 16 (1.5) | 10 (1.2) | 6 (2.3) | 0.309 | 6 (1.7) | 3 (1.6) | 3 (2.0) | 1 |
| Sneeze | 5 (0.5) | 2 (0.2) | 3 (1.2) | 0.1646 | 3 (0.9) | 2 (1.0) | 1 (0.7) | 1 |
| Sore throat | 36 (3.3) | 31 (3.7) | 5 (1.9) | 0.1611 | 8 (2.3) | 5 (2.6) | 3 (2.0) | 0.9725 |
| Cough | 810 (73.8) | 600 (71.4) | 210 (81.4) | 0.0015 | 279 (80.9) | 151 (78.7) | 128 (83.7) | 0.2394 |
| Sputum production | 391 (35.6) | 282 (33.6) | 109 (42.3) | 0.0113 | 135 (39.1) | 70 (36.5) | 65 (42.5) | 0.2546 |
| Dyspnoea | 488 (44.5) | 333 (39.7) | 155 (60.1) | < 0.0001 | 215 (62.3) | 106 (55.2) | 109 (71.2) | 0.0023 |
| Chest pain | 57 (5.2) | 46 (5.5) | 11 (4.3) | 0.4294 | 16 (4.6) | 10 (5.2) | 6 (3.9) | 0.5723 |
| Hemoptysis | 11 (1.0) | 8 (1.0) | 3 (1.2) | 1 | 6 (1.7) | 3 (1.6) | 3 (2.0) | 1 |
| Headache | 60 (5.5) | 52 (6.3) | 8 (3.1) | 0.0527 | 9 (2.6) | 7 (3.7) | 2 (1.3) | 0.3106 |
| Myalgia | 126 (11.6) | 88 (10.6) | 38 (14.7) | 0.0684 | 45 (13.0) | 28 (14.6) | 17 (11.1) | 0.3414 |
| Fatigue | 397 (36.3) | 298 (35.6) | 99 (38.5) | 0.3878 | 136 (39.5) | 71 (37.2) | 65 (42.5) | 0.3167 |
| Gastrointestinal symptoms | 200 (18.3) | 163 (19.5) | 37 (14.3) | 0.059 | 51 (14.8) | 26 (13.5) | 25 (16.3) | 0.4669 |
| Eye symptoms | 23 (2.1) | 16 (1.9) | 7 (2.7) | 0.442 | 7 (2.0) | 6 (3.1) | 1 (0.7) | 0.2175 |
| Rhonchi | 51 (4.6) | 33 (3.9) | 18 (7.0) | 0.0438 | 24 (6.9) | 14 (7.3) | 10 (6.5) | 0.7715 |
| Crackles | 150 (13.7) | 111 (13.2) | 39 (15.1) | 0.454 | 59 (17.1) | 32 (16.7) | 27 (17.5) | 0.8315 |
| Systolic pressure | ||||||||
| Median (IQR), mmHg | 122 (110, 134) | 121 (110, 133) | 123 (112, 136) | 0.2233 | 126 (115, 139) | 123 (112, 136) | 130.5 (117, 144) | 0.0201 |
| Diastolic pressure | ||||||||
| Median (IQR), mmHg | 80 (72, 87) | 80 (72, 88) | 80 (72, 87) | 0.173 | 80 (73, 87) | 80 (75, 87) | 80 (72, 87) | 0.2204 |
| Heart rate | ||||||||
| Median (IQR), bpm | 86 (79, 96) | 85 (78, 95) | 89 (80, 100) | 0.0002 | 89 (80, 100) | 88 (80, 98) | 89 (82, 102) | 0.1859 |
| Respiratory rate | ||||||||
| Median (IQR), bpm | 21 (20, 25) | 21 (20, 24) | 22 (20, 26) | 0.3707 | 23 (20, 28) | 22 (20, 28) | 23 (20, 28) | 0.2702 |
| SOFA | 2 (1, 5) | 2 (0, 14) | 4 (2, 8) | < 0.0001 | 5 (3, 10) | 3 (2, 5) | 10 (6, 18) | < 0.0001 |
| APACHEII | 3 (1, 5) | 3 (1, 5) | 5 (3, 8) | < 0.0001 | 6 (3, 10) | 5 (2, 7) | 10.5 (8, 17) | < 0.0001 |
| Laboratory findings | ||||||||
| Leucocytes- (IQR-109/L) | 6.1 (4.5, 8.5) | 5.8 (4.5, 7.8) | 8.1 (5.0, 13.6) | < 0.0001 | 9.4 (5.8, 15.6) | 7.3 (4.8, 10.2) | 15.5 (8.9, 21.9) | < 0.0001 |
| Distribution, n (%) | ||||||||
| <4 | 180 (16.8) | 145 (17.5) | 35 (14.4) | < 0.0001 | 40 (12.3) | 26 (14.0) | 14 (10.0) | < 0.0001 |
| 4–10 | 707 (66.0) | 593 (71.6) | 114 (46.7) | 133 (40.9) | 109 (58.6) | 24 (17.3) | ||
| >10 | 185 (17.2) | 90 (10.9) | 95 (38.9) | 152 (46.8) | 51 (27.4) | 101 (72.7) | ||
| Hemoglobin (IQR-g/L) | 121 (110.0, 131.0) | 121 (110.0, 130.0) | 119 (108.0, 131.0) | 0.1872 | 118 (107.0, 130.0) | 116.5 (108.0, 129.0) | 120 (103.0, 133.0) | 0.5845 |
| Distribution, n (%) | ||||||||
| ≤ 90 | 47 (4.4) | 27 (3.3) | 20 (8.3) | 0.0008 | 27 (8.5) | 10 (5.4) | 17 (12.8) | 0.0191 |
| >90 | 1021 (95.6) | 800 (96.7) | 221 (91.7) | 292 (91.5) | 176 (94.6) | 116 (87.2) | ||
| Platelets (IQR-109/L) | 196 (147.0, 253.0) | 204 (159.0, 260.0) | 153 (105.0, 216.0) | < 0.0001 | 151.5 (90.5, 208.0) | 179.5 (140.0, 241.0) | 90.5 (50.0, 165.0) | < 0.0001 |
| Distribution, n (%) | ||||||||
| <100 | 91 (8.5) | 34 (4.1) | 57 (23.5) | < 0.0001 | 88 (27.2) | 15 (8.1) | 73 (52.9) | < 0.0001 |
| ≥ 100 | 979 (91.5) | 793 (95.9) | 186 (76.5) | 236 (72.8) | 171 (91.9) | 65 (47.1) | ||
| Neutrophils (IQR-109/L) | 4.2 (2.8, 6.6) | 3.8 (2.7, 5.7) | 7.0 (3.6, 13.3) | < 0.0001 | 8.3 (4.6, 15.1) | 5.6 (3.3, 9.1) | 14.7 (9.9, 20.3) | < 0.0001 |
| Distribution, n (%) | ||||||||
| < 1.8 | 65 (6.2) | 57 (6.9) | 8 (3.4) | < 0.0001 | 8 (2.6) | 4 (2.3) | 4 (3.1) | < 0.0001 |
| 1.8–6.3 | 703 (66.5) | 606 (73.5) | 97 (41.6) | 109 (35.5) | 96 (54.5) | 13 (9.9) | ||
| > 6.3 | 289 (27.3) | 161 (19.6) | 128 (55.0) | 190 (61.9) | 76 (43.2) | 114 (87.0) | ||
| Lymphocytes (IQR-109/L) | 1.2 (0.8, 1.6) | 1.3 (0.9, 1.7) | 0.8 (0.5, 1.3) | < 0.0001 | 0.8 (0.4, 1.2) | 1.0 (0.6, 1.4) | 0.5 (0.3, 0.9) | < 0.0001 |
| Distribution, n (%) | ||||||||
| < 0.8 | 269 (25.6) | 154 (18.8) | 115 (49.6) | < 0.0001 | 161 (53.0) | 67 (38.3) | 94 (72.9) | < 0.0001 |
| ≥ 0.8 | 783 (74.4) | 666 (81.2) | 117 (50.4) | 143 (47.0) | 108 (61.7) | 35 (27.1) | ||
| CD3 (IQR-/μL) | 626 (445, 964) | 710 (470, 1132) | 522 (367, 636.) | < 0.0001 | 522 (364, 659) | 562 (427, 793) | 367 (267, 409) | 0.0004 |
| CD4 (IQR-/μL) | 368 (252, 612) | 416 (283, 730) | 292 (207, 432) | 0.0006 | 289 (185, 432) | 353 (261, 489) | 211 (145, 248) | 0.0003 |
| CD8 (IQR-/μL) | 237 (139, 337) | 269 (188, 400) | 155 (114, 252) | < 0.0001 | 155 (116, 252) | 207 (128, 288) | 129 (87, 144) | 0.0044 |
| Prothrombin time (IQR-s) | 11.4 (10.7, 12.4) | 11.3 (10.6, 12.2) | 11.9 (11.1, 13.4) | < 0.0001 | 12.4 (11.3, 13.9) | 11.6 (10.0, 12.6) | 14 (12.4, 17.5) | < 0.0001 |
| Distribution, n (%) | ||||||||
| <10.5 | 198 (19.1) | 163 (20.4) | 35 (14.7) | < 0.0001 | 38 (11.9) | 34 (18.4) | 4 (3.0) | < 0.0001 |
| 10.5–13.5 | 726 (70.0) | 580 (72.6) | 146 (61.3) | 183 (57.4) | 131 (70.8) | 52 (38.8) | ||
| >13.5 | 113 (10.9) | 56 (7.0) | 57 (24.0) | 98 (30.7) | 20 (10.8) | 78 (58.2) | ||
| Activated-partial thromboplastin time (IQR-s) | 27.6 (24.3, 32.2) | 27 (23.9, 31.1) | 29.9 (25.7, 35.8) | < 0.0001 | 30 (25.0, 35.8) | 29 (24.7, 34.3) | 33.4 (26.1, 38.9) | 0.0006 |
| Distribution, n (%) | ||||||||
| <21 | 64 (6.2) | 47 (5.9) | 17 (7.3) | < 0.0001 | 21 (6.7) | 14 (7.7) | 7 (5.4) | < 0.0001 |
| 21–37 | 870 (84.2) | 699 (87.5) | 171 (73.1) | 228 (73.1) | 148 (80.9) | 80 (62.0) | ||
| >37 | 99 (9.6) | 53 (6.6) | 46 (19.6) | 63 (20.1) | 21 (11.4) | 42 (32.6) | ||
| Thrombin time (IQR-s) | 17.8 (16.7, 20.6) | 17.7 (16.7, 20.0) | 18.4 (17.1, 22.4) | < 0.0001 | 18.4 (17.1, 21.7) | 18.3 (17.1, 21.3) | 18.4 (17.1, 23.0) | 0.5313 |
| Distribution, n (%) | ||||||||
| <13 | 8 (0.8) | 8 (1.0) | 0 (0.0) | 0.0044 | 0 (0.0) | 0 (0.0) | 0 (0.0) | 0.4132 |
| 13–21 | 782 (75.7) | 618 (77.4) | 164 (70.1) | 224 (72.0) | 135 (73.8) | 89 (69.5) | ||
| >21 | 243 (23.5) | 173 (21.6) | 70 (29.9) | 87 (28.0) | 48 (26.2) | 39 (30.5) | ||
| D-dimer (IQR-μg/mL) | 0.8 (0.4, 1.9) | 0.74 (0.4, 1.4) | 1.38 (0.5, 9.4) | < 0.0001 | 2.21 (0.7, 18.1) | 0.95 (0.5, 2.8) | 17.83 (4.5, 56.5) | < 0.0001 |
| Distribution, n (%) | ||||||||
| ≤ 0.5 | 322 (31.9) | 268 (34.5) | 54 (23.2) | < 0.0001 | 55 (17.5) | 51 (27.9) | 4 (3.1) | < 0.0001 |
| 0.5–1 | 271 (26.8) | 227 (29.2) | 44 (18.9) | 52 (16.6) | 43 (23.5) | 9 (6.9) | ||
| >1 | 417 (41.3) | 282 (36.3) | 135 (57.9) | 207 (65.9) | 89 (48.6) | 118 (90.0) | ||
| Total bilirubin (IQR-μmol/L) | 12.7 (9.9, 17.0) | 12.1 (9.6, 15.6) | 16 (11.7, 24.9) | < 0.0001 | 16.7 (11.9, 26.4) | 14.05 (11.0, 18.4) | 24.9 (16.6, 36.1) | < 0.0001 |
| Distribution, n (%) | ||||||||
| ≤ 26 | 954 (91.8) | 777 (95.8) | 177 (77.6) | < 0.0001 | 228 (74.5) | 155 (90.1) | 73 (54.5) | < 0.0001 |
| >26 | 85 (8.2) | 34 (4.2) | 51 (22.4) | 78 (25.5) | 17 (9.9) | 61 (45.5) | ||
| Alanine aminotransferase ( (IQR-U/L) | 41.5 (25.0, 64.0) | 38 (23.0, 60.0) | 51 (34.0, 83.0) | < 0.0001 | 50 (32.0, 79.0) | 50 (33.0, 75.0) | 47 (31.0, 84.0) | 0.7016 |
| Distribution, n (%) | ||||||||
| ≤ 40 | 524 (49.2) | 436 (52.9) | 88 (36.5) | < 0.0001 | 123 (38.3) | 72 (38.7) | 51 (37.8) | 0.8654 |
| >40 | 542 (50.8) | 389 (47.1) | 153 (63.5) | 198 (61.7) | 114 (61.3) | 84 (62.2) | ||
| Aspartate aminotransferase (IQR-U/L) | 34 (26.0, 49.0) | 31 (24.0, 44.0) | 46.5 (34.0, 72.0) | < 0.0001 | 48 (35.0, 74.0) | 40 (31.0, 57.0) | 58 (44.0, 109.0) | < 0.0001 |
| Distribution, n (%) | ||||||||
| ≤ 40 | 679 (63.7) | 584 (70.9) | 95 (39.3) | < 0.0001 | 118 (36.5) | 96 (51.6) | 22 (16.1) | < 0.0001 |
| >40 | 387 (36.3) | 240 (29.1) | 147 (60.7) | 205 (63.5) | 90 (48.4) | 115 (83.9) | ||
| Albumin (IQR-g/L) | 31.7 (28.5, 35.0) | 32.4 (29.6, 35.7) | 28.3 (26.0, 31.5) | < 0.0001 | 28 (25.5, 30.7) | 29.5 (27.4, 32.3) | 26.2 (24.3, 28.3) | < 0.0001 |
| Distribution, n (%) | ||||||||
| <40 | 1024 (95.9) | 780 (94.7) | 244 (100.0) | 0.0003 | 326 (100.0) | 186 (100.0) | 140 (100.0) | 1 |
| 40–55 | 41 (3.8) | 41 (5.0) | 0 (0.0) | 0 (0.0) | 0 (0.0) | 0 (0.0) | ||
| >55 | 3 (0.3) | 3 (0.3) | 0 (0.0) | 0 (0.0) | 0 (0.0) | 0 (0.0) | ||
| Blood urea nitrogen (IQR-mmol/L) | 5 (4.0, 6.4) | 4.8 (3.8, 5.8) | 6.5 (5.0, 10.2) | < 0.0001 | 7.2 (5.4, 11.7) | 6.1 (4.7, 7.7) | 13.2 (7.7, 20.3) | < 0.0001 |
| Distribution, n (%) | ||||||||
| <3.1 | 81 (7.6) | 74 (9.0) | 7 (2.9) | < 0.0001 | 7 (2.2) | 7 (3.8) | 0 (0.0) | < 0.0001 |
| 3.1–8 | 838 (78.6) | 688 (83.6) | 150 (61.7) | 177 (55.5) | 139 (75.1) | 38 (28.4) | ||
| >8 | 147 (13.8) | 61 (7.4) | 86 (35.4) | 135 (42.3) | 39 (21.1) | 96 (71.6) | ||
| Serum creatinine (IQR-umol/L) | 72.4 (59.4, 87.2) | 70.9 (59.0, 83.0) | 78.8 (62.5, 104.0) | < 0.0001 | 79.6 (63.0, 109.8) | 73.9 (59.5, 91.6) | 107.8 (69.2, 196.7) | < 0.0001 |
| Distribution, n (%) | ||||||||
| >133 | 65 (6.1) | 24 (2.9) | 41 (16.9) | < 0.0001 | 60 (18.9) | 8 (4.3) | 52 (39.4) | < 0.0001 |
| ≤ 133 | 995 (93.9) | 794 (97.1) | 201 (83.1) | 257 (81.1) | 177 (95.7) | 80 (60.6) | ||
| Creatine kinase (IQR-U/L) | 76 (50.0, 141.0) | 71 (49.0, 123.0) | 123 (54.0, 247.0) | < 0.0001 | 124.5 (55.5, 274.5) | 89 (48.0, 196.0) | 240 (101.0, 553.0) | < 0.0001 |
| Distribution, n (%) | ||||||||
| <50 | 235 (24.4) | 190 (25.2) | 45 (21.5) | < 0.0001 | 53 (19.5) | 46 (27.7) | 7 (6.6) | < 0.0001 |
| 50–310 | 640 (66.5) | 517 (68.6) | 123 (58.9) | 159 (58.4) | 102 (61.5) | 57 (53.8) | ||
| >310 | 88 (9.1) | 47 (6.2) | 41 (19.6) | 60 (22.1) | 18 (10.8) | 42 (39.6) | ||
| Creatine kinase isoenzyme MB (IQR-U/L) | 13 (10.0, 17.0) | 13 (10.0, 16.0) | 17 (13.0, 24.0) | < 0.0001 | 18 (14.0, 27.0) | 15 (12.0, 20.0) | 24 (18.0, 47.0) | < 0.0001 |
| Distribution, n (%) | ||||||||
| ≤ 24 | 921 (90.8) | 747 (95.3) | 174 (75.7) | < 0.0001 | 213 (70.5) | 149 (84.7) | 64 (50.8) | < 0.0001 |
| >24 | 93 (9.2) | 37 (4.7) | 56 (24.3) | 89 (29.5) | 27 (15.3) | 62 (49.2) | ||
| Serum prealbumin (IQR-g/L) | 132 (85.0, 191.0) | 144 (98.0, 201.0) | 86 (48.0, 132.0) | < 0.0001 | 78 (44.5, 122.5) | 105.5 (70.5, 152.5) | 48.5 (29.5, 75.0) | < 0.0001 |
| Distribution, n (%) | ||||||||
| <200 | 799 (77.9) | 588 (74.0) | 211 (91.3) | < 0.0001 | 286 (92.9) | 160 (88.9) | 126 (98.4) | 0.0013 |
| 200–430 | 227 (22.1) | 207 (26.0) | 20 (8.7) | 22 (7.1) | 20 (11.1) | 2 (1.6) | ||
| Serum amyloid protein A (IQR-mg/L) | 186 (28.9, 272.3) | 151.6 (20.6, 259.1) | 242.4 (177.4, 284.0) | < 0.0001 | 246.45 (180.4, 284.0) | 241.2 (132.4, 284.0) | 260.1 (188.9, 284.0) | 0.0103 |
| Distribution, n (%) | ||||||||
| ≤ 10 | 150 (16.9) | 140 (20.0) | 10 (5.4) | < 0.0001 | 11 (4.3) | 9 (6.0) | 2 (1.9) | 0.2075 |
| >10 | 737 (83.1) | 560 (80.0) | 177 (94.6) | 245 (95.7) | 142 (94.0) | 103 (98.1) | ||
| C-reactive-protein (IQR-mg/L) | 25.6 (4.9, 79.1) | 18.4 (3.8, 54.4) | 86.25 (22.3, 160.0) | < 0.0001 | 102.5 (37.6, 160.0) | 52.4 (12.1, 103.0) | 160 (124.2, 177.1) | < 0.0001 |
| Distribution, n (%) | ||||||||
| ≤ 6.9 | 287 (30.2) | 259 (35.4) | 28 (12.8) | < 0.0001 | 31 (10.7) | 28 (17.4) | 3 (2.3) | < 0.0001 |
| >6.9 | 663 (69.8) | 473 (64.6) | 190 (87.2) | 258 (89.3) | 133 (82.6) | 125 (97.7) | ||
| Serum ferritin (IQR-ng/mL) | 377.72 (133.72, 723.96) | 344.66 (136.53, 625.70) | 557.58 (79.26, 1264.47) | 0.0002 | 618.13 (150.31, 1503.90) | 647.98 (245.35, 1193.72) | 616.55 (38.68, 2000.00) | 0.8666 |
| Distribution, n (%) | ||||||||
| <21.8 | 35 (5.0) | 27 (5.2) | 8 (4.4) | 0.0931 | 9 (3.6) | 5 (3.6) | 4 (3.6) | 0.1069 |
| 21.8-274.6 | 247 (35.1) | 192 (36.9) | 55 (30.0) | 71 (28.5) | 32 (23.4) | 39 (34.8) | ||
| > 274.6 | 421 (59.9) | 301 (57.9) | 120 (65.6) | 169 (67.9) | 100 (73.0) | 69 (61.6) | ||
| Interleukin-6 (IQR-pg/mL) | 14.0 (7.8, 398.8) | 14.6 (7.8, 354.4) | 13.3 (8.0, 648.4) | 0.1783 | 13.9 (8.4, 660.9) | 10.5 (7.2, 458.0) | 31.9 (11.1, 1487.0) | < 0.0001 |
| Distribution, n (%) | ||||||||
| ≤ 7 | 28 (3.7) | 20 (3.4) | 8 (4.6) | 0.4741 | 8 (3.4) | 5 (4.0) | 3 (2.8) | 0.8896 |
| > 7 | 729 (96.3) | 563 (96.6) | 166 (95.4) | 226 (96.6) | 121 (96.0) | 105 (97.2) | ||
| Radiologic findings | ||||||||
| Abnormalities, n (%) | ||||||||
| Ground-glass opacity | 958 (92.3) | 734 (91.9) | 224 (93.7) | 0.3444 | 293 (93.3) | 176 (94.1) | 117 (92.1) | 0.4881 |
| Pulmonary consolidation | 171 (16.5) | 106 (13.3) | 65 (27.2) | < 0.0001 | 88 (28.0) | 49 (26.2) | 39 (30.7) | 0.383 |
| Pulmonary interstitial abnormalities | 646 (62.3) | 471 (59.0) | 175 (73.2) | < 0.0001 | 229 (72.9) | 138 (73.8) | 91 (71.7) | 0.6749 |
| Pneumothorax | 26 (2.5) | 18 (2.3) | 8 (3.4) | 0.3437 | 13 (4.1) | 6 (3.2) | 7 (5.5) | 0.3147 |
| Pleural effusion | 44 (4.2) | 33 (4.1) | 11 (4.6) | 0.7505 | 16 (5.1) | 10 (5.4) | 6 (4.7) | 0.8053 |
SOFA Sequential Organ Failure Assessment, APACHEII Acute Physiology and Chronic Health Evaluation II
Radiologic and laboratory findings
A total of 1027 (92.3%) patients had findings of ground-glass opacity on radiographic imaging, 700 (63.0%) patients had interstitial abnormalities. Complex radiologic features such as consolidation (27.2% vs. 13.3%, p < 0.0001) and interstitial changes (73.2% vs. 59.0%, p < 0.0001) and abnormal laboratory results such as hyperleukocytosis (38.9% vs. 10.9%, p < 0.0001), lymphocytopenia (49.6% vs. 18.8%, p < 0.0001), thrombocytopenia (23.5% vs. 4.1%, p < 0.0001) and hypercoagulability (APTT, PT, TT, D-dimer, all p < 0.0001) occurred more in progressors than in non-progressors. There were no significant differences in IL-6 level between the two groups (14.6 pg/ml in non-progressors vs. 13.3 pg/ml in progressors, p = 0.178). Abnormal results of laboratory tests (e.g., hyperleukocytosis [71.7% vs. 27.4%, p < 0.0001], lymphocytopenia [72.9% vs. 38.3%, p < 0.0001], lower CD4 count [211/μL vs. 353/μL, p = 0.0003], thrombocytopenia [52.9% vs. 8.1%, p < 0.0001], hypercoagulability especially elevated D-dimer [90.1% vs. 48.6%, p < 0.0001]) were also common in non-survivors (Tables 1, 2).
Treatment
During hospitalization, most (n = 987, 82.9%) of patients received oxygen therapy, including nasal cannula (n = 792, 66.6%), mask oxygen inhalation (n = 27, 2.3%), high-flow nasal cannula (n = 60, 5.0%), non-invasive mechanical ventilation (n = 62, 5.2%), invasive mechanical ventilation (n = 42, 3.5%) and ECMO (n = 4, 0.3%, Table 2). 10.2% (n = 16) severe patients who suddenly died treated with nasal cannula, 4.5% (n = 7) dead severe patients treated with mask oxygen inhalation, 22.9% (n = 36) dead severe patients treated with high-flow nasal cannula, 36.9% (n = 58) dead severe patients treated with non-invasive mechanical ventilation, 22.9% (n = 36) with invasive mechanical ventilation and 2.6% (n = 4) with ECMO. Among not severe patients, 259 (99.2%) patients received oxygen therapy in the progression group vs. 640 (76.1%) in the non-progression group (p < 0.0001). Compared with the survivors with severe disease, significantly more non-survivors received non-invasive mechanical ventilation, invasive mechanical ventilation and ECMO (62.4% vs. 4.7%, p < 0.0001) and antiviral treatment (71.8% vs. 43.3% p < 0.0001). More remarkably, there were more non-survivors treated with glucocorticoids (59.8% vs. 39.7%, p = 0.0005) among severe patients (Table 4).
Table 4.
Treatments during hospital stay and clinical outcomes of the study patients
| Not severe patients at admission (n = 1102) | Non-progressors (n = 841) | Progressors (n = 261) | p value | Severe patients (n = 349) | Survivor (n = 192) | Non-survivor (n = 157) | p value | |
|---|---|---|---|---|---|---|---|---|
| Treatments, n (%) | ||||||||
| Antibiotic | 905 (87.1) | 690 (84.9) | 215 (95.1) | < 0.0001 | 287 (95.4) | 169 (97.1) | 118 (92.9) | 0.0865 |
| Antifungal | 44 (4.2) | 22 (2.7) | 22 (9.7) | < 0.0001 | 28 (9.3) | 13 (7.5) | 15 (11.8) | 0.2005 |
| Antiviral | 654 (63.0) | 501 (61.6) | 153 (67.7) | 0.0943 | 180 (59.8) | 125 (71.8) | 55 (43.3) | < 0.0001 |
| Glucocorticoids | 251 (24.2) | 144 (17.7) | 107 (47.4) | < 0.0001 | 145 (48.2) | 69 (39.7) | 76 (59.8) | 0.0005 |
| Oxygen therapy, n (%) | < 0.0001 | < 0.0001 | ||||||
| None | 203 (18.4) | 201 (23.9) | 2 (0.8) | 2 (0.6) | 2 (1.0) | 0 | ||
| Nasal cannula | 792 (71.9) | 634 (75.4) | 158 (60.5) | 158 (45.3) | 142 (74.0) | 16 (10.2) | ||
| Mask oxygen | 17 (1.5) | 4 (0.5) | 13 (5.0) | 23 (6.6) | 16 (8.3) | 7 (4.5) | ||
| High-flow nasal cannula | 25 (2.3) | 1 (0.1) | 24 (9.2) | 59 (16.9) | 23 (12.0) | 36 (22.9) | ||
| Non-invasive mechanical ventilation | 34 (3.1) | 0 (0.0) | 34 (13.0) | 62 (17.8) | 4 (2.1) | 58 (36.9) | ||
| Invasive mechanical ventilation | 28 (2.5) | 1 (0.1) | 27 (10.3) | 41 (11.8) | 5 (2.6) | 36 (22.9) | ||
| ECMO | 3 (0.3) | 0 (0.0) | 3 (1.2) | 4 (1.2) | 0 (0.0) | 4 (2.6) | ||
| Outcomes | ||||||||
| Duration of MV (IQR), days | 4 (2.0, 8.0) | 0 | 4 (2.0, 8.0) | 5 (2.0, 8.0) | 6 (5.0, 9.0) | 4 (2.0, 8.0) | 0.1563 | |
| Duration of ICU stay (IQR), days | 0 | 0 | 6 (3.0, 10.0) | 6 (3.0, 10.5) | 7 (4.0, 11.0) | 5 (2.0, 9.0) | 0.0522 | |
| Duration of in-hospital stay (IQR), days | 11 (8.00, 15.00) | 11 (8.0, 14.0) | 12 (8.0, 16.0) | 0.0021 | 11 (7, 16) | 14 (10.0, 18.0) | 8 (4.0, 12.0) | < 0.0001 |
| In-hospital mortality, n (%) | 91 (8.26) | 0 (0.0) | 91 (34.9) | < 0.0001 | 157 (45.0) | 0 (0.0) | 157 (100.0) | < 0.0001 |
ECMO extracorporeal membrane oxygenation, ICU intensive care unit, MV mechanical ventilation
Nine hundred and seventy-seven (87.7%) patients were treated with empirical antibiotic treatment (e.g., ceftriaxone, moxifloxacin and azithromycin), 681 (61.1%) antiviral therapy (e.g., oseltamivir, ganciclovir, lopinavir/ritonavir, arbidol and interferon), and 289 (25.9%) glucocorticoids. Empirical antibiotic treatment, antiviral therapy and glucocorticoids on admission were also given more commonly to progressors than to non-progressors (Tables 2, 4).
Outcomes
Two hundred and sixty-one (22.7%) patients without severe condition on admission progressed to severe pneumonia. To analyze the associations between patients’ variables and disease development, a multivariate analysis was performed. As shown in Fig. 2a, independent risk factors for development from not severe to severe disease were presence of pulmonary consolidation (OR 2.59, 95% CI 1.61–4.18, p < 0.001), SOFA score on admission (OR 1.32, 95% CI 1.22–1.43, p < 0.001), lymphocytopenia (OR 1.81, 95% CI 1.13–2.89, p = 0.013) and thrombocytopenia (OR 2.39, 95% CI 1.13–5.03, p = 0.022). Of note, the deterioration of disease cannot be prevented by glucocorticoids (OR 3.79, 95% CI 2.39–6.01, p < 0.001), but could be prevented by NIV. Independent risk factors for death among all the included patients are shown in Additional file 3: Table S2.
Fig. 2.

Odds ratios for risk factors associated with in-hospital progression a in COVID-19 patients and in-hospital mortality b in severe COVID-19 patients. SOFA: Sequential Organ Failure Assessment. IMV: invasive mechanical ventilation. Nasal cannula, glucocorticoids treatment, IMV and antiviral drugs during hospital stay; SOFA score, pulmonary consolidation, leukocytosis, thrombocytopenia and lymphocytopenia, prothrombin time and D-dimer on admission
Among severe patients, 192 survived and 157 died. Figure 3b shows the survival curve. The risk of death was more than 11 times higher in patients with diabetes than those without diabetes (OR 11.16, 95% CI 1.87–66.57, p = 0.008; Fig. 2b). Other significant independent risk factors for mortality were on admission SOFA score (OR 1.30, 95% CI 1.11–1.53, p = 0.001), leukocytopenia (OR 5.10, 95% CI 1.25–20.78, p = 0.023), lymphocytopenia (OR 4.44, 95% CI 1.26–15.87, p = 0.021), thrombocytopenia (OR 8.37, 95% CI 2.04–34.44, p = 0.003) and elevated D-dimer (OR 3.28, 95% CI 1.19–9.04, p = 0.021, Fig. 4). Survival curves of severe patients according to those mortality predictors are shown in Fig. 5. In a multivariate analysis, antiviral treatment during hospital stay was negatively associated with death (OR 0.17, 95% CI 0.05–0.64, p = 0.008) among severe patients with COVID-19. In order to figure out which of them made the major contribution to prolong survival, we conducted survival analysis and found the administration of oseltamivir (HR 0.21, 95% CI 0.10–0.43; p < 0.001) or ganciclovir (HR 0.20, 95% CI 0.07–0.55, p < 0.001) appeared to have reduced the risk of death in severe patients (Fig. 5).
Fig. 3.
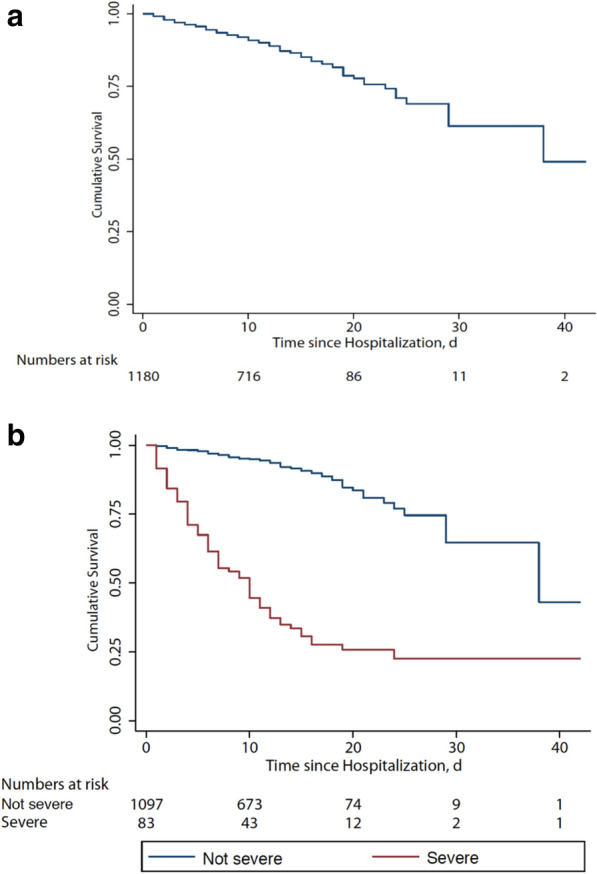
Survival curve in with coronavirus disease. a In all enrolled patients. b In not severe and severe patients. Nine patients died on admission as a result of unsuccessful rescue efforts
Fig. 4.

Cumulative survival curves among severe COVID-19 patients. a With DM and without DM; b SOFA score > 5 and SOFA score ≤ 5 on admission; c PLT counts on admission; d Lym counts on admission; e D-dimmer on admission. DM diabetes mellitus, SOFA Sequential Organ Failure Assessment, PLT platelet; Lym lymphocyte
Fig. 5.
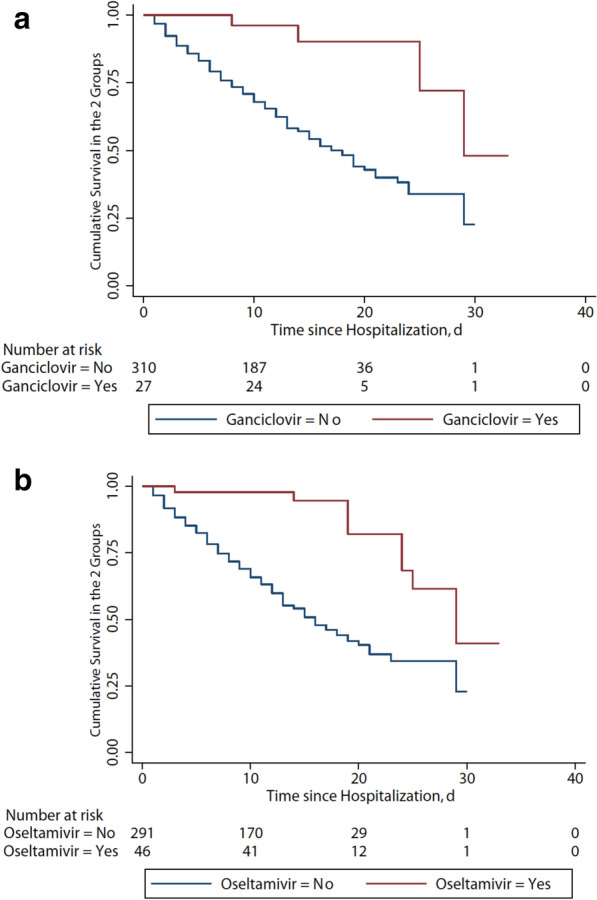
Cumulative survival curve in severe COVID-19 patients with oseltamivir or ganciclovir. a Use of ganciclovir during hospital stay reduced the risk of death (hazard ratio, 0.20; 95% CI 0.07–0.55; p < 0.001). b Use of oseltamivir during hospital stay reduced the risk of death (hazard ratio, 0.21; 95% CI 0.10–0.43; p < 0.001)
The time interval from disease onset to high-flow nasal cannula, non-invasive mechanical ventilation, invasive mechanical ventilation in survivors with severe disease was 12 day (IQR, 10–17), 11 days (IQR, 9–11), 19 days (IQR 19–41), respectively. However, the time interval from admission to high-flow nasal cannula was 12 days (IQR, 9–17), to non-invasive mechanical ventilation was 16 days (IQR, 11–19), to invasive mechanical ventilation was 18 days (IQR, 13–21) and to ECMO was 22 days (IQR, 22–25) in non-survivors with severe disease. The time interval from admission to high-flow nasal cannula was 1 day (IQR, 0–3), to non-invasive mechanical ventilation was 1 day (IQR, 1–2), to invasive mechanical ventilation was 4 days (IQR, 3–29) in the survivors with severe disease. In the non-survivors with severe disease, the time interval from disease onset to high-flow nasal cannula, non-invasive mechanical ventilation, invasive mechanical ventilation and ECMO was 1 day (IQR, 0–5), 2 days (IQR, 0–5), 6 days (IQR 2–9) and 12 (9–18), respectively (Fig. 6).
Fig. 6.

Time interval between admission and disease onset to respiratory supports. Respiratory supports include high-flow oxygen, non-invasive mechanical ventilation, invasive mechanical ventilation and ECMO. ECMO extracorporeal membrane oxygenation
Discussion
This retrospective cohort study included a very large number of COVID-19 patients reported clinical outcomes and potential risk factors for development from not severe to severe manifestations after admission, as well as those who progressed from severe disease to death. In particular, higher SOFA score, lymphocytopenia on admission were independent risk factors for development to severe manifestations and death. On admission, level of D-dimer greater than 1 μg/L and diabetes were associated with higher risks of in-hospital death in patients with severe COVID-19. Administration of glucocorticoids seemed to increase the risk of deterioration to severe disease after admission. Anti-virus drugs (ganciclovir, oseltamivir) seemed to be associated with less deterioration from not severe to severe disease and from severe disease to death. Moreover, early IMV may be helpful to decrease mortality in severe patients. The risk factors presented in the current study may be helpful for clinicians to early identify patients who will probably progress to severe illness during in-hospital stay. Early interventions could be given to decrease mortality in COVID-19 patients with abnormal biological results. However, the benefits of anti-virus drugs should be interpreted with caution in the absence of data from randomized controlled studies.
COVID-19 patients with Acute Respiratory Distress Syndrome (ARDS) are severe, therefore the respiratory support of COVID-19 patients is essential to decrease mortality. However, there is still controversy regarding the prognosis of COVID-19 after the initiation of mechanical ventilation [12]. Also it is still necessary to explore that if invasive mechanical ventilation could improve outcome of COVID-19 patients when compared to non-invasive mechanical ventilation [13]. The present results show that time interval from admission to non-invasive mechanical ventilation in survivors with severe disease was shorter compared with that in non-survivors with severe disease. COVID-19 patients may acquire prognostic benefit from early respiratory support. Since frequent monitoring is needed during process of non-invasive mechanical ventilation, non-invasive mechanical ventilation treatment should be used with caution in resource-limited settings.
The SOFA score is an important marker to indicate the severity of multiple organ dysfunction [14]. Although the common pathogen to cause sepsis or septic shock is bacteria, virus also causes sepsis particularly in community-acquired pneumonia [15]. In the present study, higher SOFA score on admission increases the risk of death of severe COVID-19 patients. This is consistent with previous results [16]. A recent study suggested that the spike protein of SARS-CoV-2 has a strong affinity to human angiotensin-converting enzyme 2 (ACE 2) for host infection [17]. The SARS-CoV-2 spike protein directly binds with the host cell surface ACE2 receptor facilitating virus entry and replication. ACE2 was expressed in many organs, and is rich in lungs, heart, kidneys and intestine [18]. Therefore, organ injuries caused by SARS-CoV-2 are extensive and become highly lethal because the virus deregulates an organ protective pathway [19].
Presence of comorbidities was found to be an independent predictor of poor outcome in our patients. Previous history of cardiovascular diseases (CVD) is independent associated with increased all-cause mortality and in-hospital deterioration COVID-19 patients [20]. This may be related with enhanced severity of an underlying CVD by occurrence of COVID-19. The prognostic effect of diabetes mellitus has been previously reported in other cohorts of patients with Middle East respiratory syndrome (MERS) [21] and SARS [22]. The prognostic relationship between diabetes mellitus and acute viral respiratory infections has been already identified [23]. Diabetes mellitus has also been identified as a prognostic factor for death in patients with community-acquired pneumonia (CAP) [24]. This is consistent with the fact that diabetes could predispose patients to be immunologically vulnerable [25]. The innate immunity is impaired through suppression of the number and function of T cells and neutrophils in diabetic patients [26]. Secondary infections are common in diabetic patients due to impaired inflammatory and immune biomarker profiles [27]. The counts of T cells including CD3 T cells, CD4 T cells and CD8 T cells decreased in non-survivors of COVID-19 in the present study. All these findings indirectly argue in favor of the role of diabetes mellitus as a prognostic factor in our patients. However, the direct influence of diabetes mellitus on SARS-Cov-2 infection still needs to be elucidated.
Lymphocytopenia was found as a potential predictor for disease development and death. Thrombocytopenia and leukocytosis also occurred in the severe cases. This may suggest that enhanced inflammation and cytokine storm started from the initial stage. These biological abnormalities were previously observed in patients with severe MERS-CoV-infected patients [28]. Cytokines are mostly secreted from neutrophils. In patients with MERS, lung injury was correlated with migration of neutrophils and macrophages from peripheral blood to extensive pulmonary [29, 30]. ARDS caused by cytokine storm was a leading cause of death in patients with Middle East respiratory syndrome [31]. In our study, only serum IL-6 level has been quantified in some of the COVID-19 patients. However, it is difficult to clarify the influence of cytokine storm on outcome due to missing of IL-6 and other cytokines data.
D-dimer produced by fibrin degradation, reflects the severity of hyper-coagulable state [32]. Coagulation could be activated to enhance physiological response to several infections [33]. Microvascular failure and subsequent multiple organ failure could be alleviated through inhibiting activation of coagulation and subsequently improve outcome during systemic hyperinflammation and fulminant sepsis [34]. D-dimer was previously found to be associated with pneumonia progression [35] and in-hospital mortality [36]. The association between elevated D-dimer level with lethal outcome of COVID-19 patients was also reported in a previous study [16]. ACE 2 is also expressed on vascular endothelial cells [37]. Thus, one can postulate that coagulation is activated due to high affinity of SARS-CoV-2 with vascular endothelial cells. This can potentially contribute to elevated D-dimer level.
This study has several limitations. First, some laboratory data were missing or not available due to the retrospective data extraction. It should be noted that if important laboratory parameters (such as cardiac troponin, lactic dehydrogenase) were not included in the multivariable analyses, it may cause bias for results. However, we used CK-MB as an alternative indicator of cardiac injury. In addition, we also performed a sensitivity analysis using multiple imputations to account for missing data. The results did not change significantly before or after multiple imputations. Second, benefits of anti-virus drugs on mortality were observed in this study, but we could not further analyze the reason. The mixed virus infection of COVID-19 patients administered with anti-virus drugs should be further explored. Third, although the current study included over 1100 patients from Wuhan Infectious Disease Hospital, still there is a lack of dynamic change for related indicators. Fourth, treatment with methylprednisolone was harmful for not severe patients, however, the dose and duration of methylprednisolone varied, detailed results failed to demonstrate. However, this was the largest cohort study of COVID-19 patients from Wuhan Infectious Disease Hospital until now. A large multi-center cohort study of patients with COVID-19 pneumonia needs to further explore the clinical characteristics and risk factors of the disease.
Conclusions
In this cohort study, higher SOFA score and lymphocytopenia on admission could predict that not severe patients would develop severe disease in-hospital. Elevated D-dimer on admission, leukocytopenia, thrombocytopenia and diabetes were independent risk factors of in-hospital death in severe patients with COVID-19. These specific characteristics will help clinicians to clarify the progression and the poor prognosis of COVID-19 patients.
Supplementary information
Additional file 1. The classification of COVID-19.
Additional file 2: Table S1. Major complications in survivors and non-survivors.
Additional file 3: Table S2. Multivariate analysis of risk factors associated with in-hospital death in COVID-19 patients.
Acknowledgements
We thank all the staff in Wuhan Infectious Disease Hospital to take care of COVID-19 patients, and all the patients and their families included in the current study.
Abbreviations
- COVID-19
Coronavirus disease 2019
- SARS-Cov-2
Severe acute respiratory syndrome coronavirus 2
- SOFA
Sequential Organ Failure Assessment
- CDC
Center for Disease Control and Prevention
- ARDS
Acute respiratory distress syndrome
- WHO
World Health Organization
- ECMO
Extracorporeal membrane oxygenation
- CT
Computed tomographic
- RT-PCR
Real-time reverse-transcriptase polymerase chain reaction
- NIV
Non-invasive mechanical ventilation
- IMV
Invasive mechanical ventilation
- MERS
Middle East respiratory syndrome
- CAP
Community-acquired pneumonia
Authors’ contributions
JL and SZ drafted the manuscript. ZXW, XD, SY and GL collected the clinical data. SZ and YXF did statistical analysis. LDZ, MD, YZC, HXD, YAL, ZLW, TW, SSH and LMC summarized all the collected data. JMQ and DCD revised the manuscript. All authors read and approved the final manuscript.
Funding
None.
Availability of data and materials
Not applicable for no datasets were generated or analyzed in our study.
Ethics approval and consent to participate
This study was approved by the Medicine Institutional Review Board of Wuhan Infectious Disease Hospital (KY-2020-03.01).
Consent for publication
Not applicable.
Competing interests
The authors declare that they have no competing interests.
Footnotes
Publisher's Note
Springer Nature remains neutral with regard to jurisdictional claims in published maps and institutional affiliations.
Jiao Liu, Sheng Zhang, Zhixiong Wu, You Shang, Xuan Dong and Guang Li contributed equally to this work
Contributor Information
Jieming Qu, Email: jmqu0906@163.com.
Dechang Chen, Email: chengdechangsh@hotmail.com.
Supplementary information
Supplementary information accompanies this paper at 10.1186/s13613-020-00706-3.
References
- 1.Lu H, Stratton CW, Tang YW. Outbreak of pneumonia of unknown etiology in Wuhan China: the mystery and the miracle. J Med Virol. 2020;92:401–402. doi: 10.1002/jmv.25678. [DOI] [PMC free article] [PubMed] [Google Scholar]
- 2.Hui DS, Azhar I, Madani TA, et al. The continuing 2019-nCoV epidemic threat of novel coronaviruses to global health: the latest 2019 novel coronavirus outbreak in Wuhan, China. Int J Infect Dis. 2020;2020(91):264–266. doi: 10.1016/j.ijid.2020.01.009. [DOI] [PMC free article] [PubMed] [Google Scholar]
- 3.Wuhan Municipal Health Commission. Report of novel coronavirus-infected pneumonia in China. 2020.
- 4.WHO. Novel coronavirus (2019-nCoV): situation report-15. 2020.
- 5.Zhu N, Zhang D, Wang W, et al. A novel coronavirus from patients with pneumonia in China. N Engl J Med. 2020;382:727–733. doi: 10.1056/NEJMoa2001017. [DOI] [PMC free article] [PubMed] [Google Scholar]
- 6.Chen N, Zhou M, Dong X, et al. Epidemiological and clinical characteristics of 99 cases of 2019 novel coronavirus pneumonia in Wuhan, China: a descriptive study. Lancet. 2020;395:507–513. doi: 10.1016/S0140-6736(20)30211-7. [DOI] [PMC free article] [PubMed] [Google Scholar]
- 7.Huang C, Wang Y, Li X, et al. Clinical features of patients infected with 2019 novel coronavirus in Wuhan, China. Lancet. 2020;395:497–506. doi: 10.1016/S0140-6736(20)30183-5. [DOI] [PMC free article] [PubMed] [Google Scholar]
- 8.Guan WJ, Ni ZY, Hu Y, et al. Clinical Characteristics of Coronavirus Disease 2019 in China. N Engl J Med. 2020;382(18):1708–1720. doi: 10.1056/NEJMoa2002032. [DOI] [PMC free article] [PubMed] [Google Scholar]
- 9.Yang X, Yu Y, Xu J, et al. Clinical course and outcomes of critically ill patients with SARS-CoV-2 pneumonia in Wuhan, China: a single-centered, retrospective, observational study. Lancet Respir Med. 2020;8(5):475–481. doi: 10.1016/S2213-2600(20)30079-5. [DOI] [PMC free article] [PubMed] [Google Scholar]
- 10.WHO. Clinical management of severe acute respiratory infection when novel coronavirus (2019-nCoV) infection is suspected: interim guidance. 2020. https://apps.who.int/iris/handle/10665/330893.
- 11.Metlay JP, Waterer GW, Long AC, et al. Diagnosis and treatment of adults with community-acquired pneumonia. An Official Clinical Practice Guideline of the American Thoracic Society and Infectious Diseases Society of America. Am J Respir Crit Care Med. 2019;200:e45–e67. doi: 10.1164/rccm.201908-1581ST. [DOI] [PMC free article] [PubMed] [Google Scholar]
- 12.Zareifopoulos N, Lagadinou M, Karela A, et al. Intubation and mechanical ventilation of patients with COVID-19: what should we tell them? Monaldi Arch Chest Dis. 2020;90:1. doi: 10.4081/monaldi.2020.1296. [DOI] [PubMed] [Google Scholar]
- 13.Alraddadi BM, Qushmaq I, Al-Hameed FM, et al. Noninvasive ventilation in critically ill patients with the Middle East respiratory syndrome. Influenza Other Respir Viruses. 2019;13:382–390. doi: 10.1111/irv.12635. [DOI] [PMC free article] [PubMed] [Google Scholar]
- 14.Ferreira FL, Bota DP, Bross A, et al. Serial evaluation of the SOFA score to predict outcome in critically ill patients. JAMA. 2001;286:1754–1758. doi: 10.1001/jama.286.14.1754. [DOI] [PubMed] [Google Scholar]
- 15.Zhou F, Wang Y, Liu Y, et al. Disease severity and clinical outcomes of community-acquired pneumonia caused by non-influenza respiratory viruses in adults: a multicentre prospective registry study from the CAP-China Network. Eur Respir J. 2019;54:1. doi: 10.1183/13993003.02406-2018. [DOI] [PubMed] [Google Scholar]
- 16.Zhou F, Yu T, Du R, et al. Clinical course and risk factors for mortality of adult inpatients with COVID-19 in Wuhan, China: a retrospective cohort study. Lancet. 2020 (Epub ahead of print). [DOI] [PMC free article] [PubMed]
- 17.Zhou P, Yang XL, Wang XG, et al. A pneumonia outbreak associated with a new coronavirus of probable bat origin. Nature. 2020;579:270–273. doi: 10.1038/s41586-020-2012-7. [DOI] [PMC free article] [PubMed] [Google Scholar]
- 18.Zhao Y, Zhao Z, Wang Y, et al. Single-cell RNA expression profiling of ACE2, the putative receptor of Wuhan 2019-nCov. BioRxiv. 2020.
- 19.Hoffmann M, Kleine-Weber H, Schroeder S, et al. SARS-CoV-2 cell entry depends on ACE2 and TMPRSS2 and is blocked by a clinically proven protease inhibitor. Cell. 2020, undefined. [DOI] [PMC free article] [PubMed]
- 20.Aggarwal G, Cheruiyot I, Aggarwal S, et al. Association of cardiovascular disease with coronavirus disease 2019 (COVID-19) severity: a meta-analysis. Curr Probl Cardiol. 2020; undefined: 100617. [DOI] [PMC free article] [PubMed]
- 21.Arabi YM, Arifi AA, Balkhy HH, et al. Clinical course and outcomes of critically ill patients with Middle East respiratory syndrome coronavirus infection. Ann Intern Med. 2014;160:389–397. doi: 10.7326/M13-2486. [DOI] [PubMed] [Google Scholar]
- 22.Booth CM, Matuka LM, Tomlinson GA, et al. Clinical features and short-term outcomes of 144 patients with SARS in the Greater Toronto area. JAMA. 2003;289:2801–2809. doi: 10.1001/jama.289.21.JOC30885. [DOI] [PubMed] [Google Scholar]
- 23.Niederman MS, Mandell LA, Anzueto A, et al. American Thoracic Society guidelines for the management of adults with community-acquired pneumonia. Am J Respir Crit Care Med. 2001;163:1730–1754. doi: 10.1164/ajrccm.163.7.at1010. [DOI] [PubMed] [Google Scholar]
- 24.Fine MJ, Smith MA, Carson CA, et al. Prognosis and outcomes of patients with community-acquired pneumonia: a meta-analysis. JAMA. 1996;275:134–141. doi: 10.1001/jama.1996.03530260048030. [DOI] [PubMed] [Google Scholar]
- 25.Matsuyama R, Nishiura H, Kutsuna S, et al. Clinical determinants of the severity of Middle East respiratory syndrome (MERS): a systematic review and meta-analysis. BMC Public Health. 2016;16:1203. doi: 10.1186/s12889-016-3881-4. [DOI] [PMC free article] [PubMed] [Google Scholar]
- 26.Grossmann V, Schmitt VH, Zeller T, et al. Profile of the immune and inflammatory response in individuals with prediabetes and type 2 diabetes. Diabetes Care. 2015;38:1356–1364. doi: 10.2337/dc14-3008. [DOI] [PubMed] [Google Scholar]
- 27.Chan JWM, Ng CK, Chan YH, et al. Short term outcome and risk factors for adverse clinical outcomes in adults with severe acute respiratory syndrome (SARS) Thorax. 2003;58:686–689. doi: 10.1136/thorax.58.8.686. [DOI] [PMC free article] [PubMed] [Google Scholar]
- 28.Ko JH, Park GE, Lee JY, et al. Predictive factors for pneumonia development and progression to respiratory failure in MERS-CoV infected patients. J Infect. 2016;73:468–475. doi: 10.1016/j.jinf.2016.08.005. [DOI] [PMC free article] [PubMed] [Google Scholar]
- 29.Ng DL, Al Hosani F, Keating MK, et al. Clinicopathologic, immunohistochemical, and ultrastructural findings of a fatal case of Middle East respiratory syndrome coronavirus infection in the United Arab Emirates, April 2014. Am J Pathol. 2016;186:652–658. doi: 10.1016/j.ajpath.2015.10.024. [DOI] [PMC free article] [PubMed] [Google Scholar]
- 30.Min CK, Cheon S, Ha NY, et al. Comparative and kinetic analysis of viral shedding and immunological responses in MERS patients representing a broad spectrum of disease severity. Sci Rep. 2016;6:25359. doi: 10.1038/srep25359. [DOI] [PMC free article] [PubMed] [Google Scholar]
- 31.Kim ES, Choe PG, Park WB, et al. Clinical progression and cytokine profiles of Middle East respiratory syndrome coronavirus infection. J Korean Med Sci. 2016;31:1717–1725. doi: 10.3346/jkms.2016.31.11.1717. [DOI] [PMC free article] [PubMed] [Google Scholar]
- 32.Adam SS, Key NS, Greenberg CS. D-dimer antigen: current concepts and future prospects. Blood. 2009;113:2878–2887. doi: 10.1182/blood-2008-06-165845. [DOI] [PubMed] [Google Scholar]
- 33.Kwiecinski JM, Horswill AR. Staphylococcus aureus bloodstream infections: pathogenesis and regulatory mechanisms. Curr Opin Microbiol. 2020;53:51–60. doi: 10.1016/j.mib.2020.02.005. [DOI] [PMC free article] [PubMed] [Google Scholar]
- 34.Niessen F, Schaffner F, Furlan-Freguia C, et al. Dendritic cell PAR1-S1P3 signalling couples coagulation and inflammation. Nature. 2008;452:654–658. doi: 10.1038/nature06663. [DOI] [PubMed] [Google Scholar]
- 35.Querol-Ribelles JM, Tenias JM, Grau E, et al. Plasma d-dimer levels correlate with outcomes in patients with community-acquired pneumonia. Chest. 2004;126:1087–1092. doi: 10.1378/chest.126.4.1087. [DOI] [PubMed] [Google Scholar]
- 36.Shilon Y, Shitrit B, Rudensky B, et al. A rapid quantitative D-dimer assay at admission correlates with the severity of community-acquired pneumonia. Blood Coagul Fibrinolysis. 2003;14:745–748. doi: 10.1097/00001721-200312000-00009. [DOI] [PubMed] [Google Scholar]
- 37.Mendoza-Torres E, Oyarzún A, Mondaca-Ruff D, et al. ACE2 and vasoactive peptides: novel players in cardiovascular/renal remodeling and hypertension. Ther Adv Cardiovasc Dis. 2015;9:217–237. doi: 10.1177/1753944715597623. [DOI] [PubMed] [Google Scholar]
Associated Data
This section collects any data citations, data availability statements, or supplementary materials included in this article.
Supplementary Materials
Additional file 1. The classification of COVID-19.
Additional file 2: Table S1. Major complications in survivors and non-survivors.
Additional file 3: Table S2. Multivariate analysis of risk factors associated with in-hospital death in COVID-19 patients.
Data Availability Statement
Not applicable for no datasets were generated or analyzed in our study.