

This cross-sectional study evaluates whether diversity of practice, clinical productivity, and Medicare payment differ between male and female otolaryngologists and whether any identified variation is influenced by practice setting.
Key Points
Question
Do physician productivity, diversity of practice, and Medicare payments differ between male and female otolaryngologists?
Findings
In this cross-sectional study of publicly available Medicare data for 8456 otolaryngologists who received Medicare payments in 2017, female otolaryngologists billed for fewer unique codes (ie, had decreased diversity of practice), provided a lower number of services (ie, had lower productivity), and received less payment from Medicare than male otolaryngologists. When stratified by levels of clinical productivity, highly productive women collected less Medicare payment than highly productive men; gender-based disparities were more pronounced in the non–facility-based setting (eg, physician office) compared with the facility-based (ie, hospital) setting.
Meaning
Female sex is associated with decreased diversity of practice, lower clinical productivity, and decreased Medicare payment in the field of otolaryngology; further efforts are necessary to identify and address potential causes of disparity within the specialty.
Abstract
Importance
Women comprise an increasing proportion of the otolaryngology workforce. Prior studies have demonstrated gender-based disparity in physician practice and income in other clinical specialties; however, research has not comprehensively examined whether gender-based income disparities exist within the field of otolaryngology.
Objective
To determine whether diversity of practice, clinical productivity, and Medicare payment differ between male and female otolaryngologists and whether any identified variation is associated with practice setting.
Design, Setting, and Participants
Retrospective cross-sectional analysis of publicly available Medicare data summarizing payments to otolaryngologists from January 1 through December 31, 2017. Male and female otolaryngologists participating in Medicare in facility-based (FB; hospital-based) and non–facility-based settings (NFB; eg, physician office) for outpatient otolaryngologic care were included.
Main Outcomes and Measures
Number of unique billing codes (diversity of practice) per physician, number of services provided per physician (physician productivity), and Medicare payment per physician. Outcomes were stratified by practice setting (FB vs NFB).
Results
A total of 8456 otolaryngologists (1289 [15.2%] women; 7167 [84.8%] men) received Medicare payments in 2017. Per physician, women billed fewer unique codes (mean difference, −2.10; 95% CI, −2.46 to −1.75; P < .001), provided fewer services (mean difference, −640; 95% CI, −784 to −496; P < .001), and received less Medicare payment than men (mean difference, −$30 246 (95% CI, −$35 738 to −$24 756; P < .001). When stratified by practice setting, women in NFB settings billed 1.65 fewer unique codes (95% CI, −2.01 to −1.29; P < .001) and provided 633 fewer services (95% CI, −791 to −475; P < .001). In contrast, there was no significant gender-based difference in number of unique codes billed (mean difference, 0.04; 95% CI, −0.217 to 0.347; P = .81) or number of services provided (mean difference, 5.1; 95% CI, −55.8 to 45.6; P = .85) in the FB setting. Women received less Medicare payment in both settings compared with men (NFB: mean difference, −$27 746; 95% CI, −$33 502 to −$21 989; P < .001; vs FB: mean difference, −$4002; 95% CI, −$7393 to −$612; P = .02), although the absolute difference was lower in the FB setting.
Conclusions and Relevance
Female sex is associated with decreased diversity of practice, lower clinical productivity, and decreased Medicare payment among otolaryngologists. Gender-based inequity is more pronounced in NFB settings compared with FB settings. Further efforts are necessary to better evaluate and address gender disparities within otolaryngology.
Introduction
Income disparity between male and female physicians across specialties is well documented within the medical literature.1 This compensation gap often begins with a physician’s starting salary and continues years into practice, despite controlling for factors such as age, hours worked, and academic productivity.1,2,3 Persistent salary differences are often attributed to unmeasured, and thus difficult to control, factors (eg, implicit managerial bias).1,2,3,4 Within the field of otolaryngology, survey data suggest that female otolaryngologists earn less than their male peers.5,6 However, the strength of this evidence is limited owing to small sample sizes and dated compensation data.
In recent years, the Centers for Medicare & Medicaid Services (CMS) has begun releasing physician-level payment data under the 2010 Patient Protection and Affordable Care Act.7 These data have permitted further empirical investigation of the extent and drivers of gender-based income inequality. Recent analyses leveraging these data have demonstrated that women receive less Medicare payment compared with men within the fields of radiation oncology and ophthalmology.8,9 These differences stem in part from decreased breadth of practice and lower clinical productivity among female physicians in both specialties.8,9
Prior research has not comprehensively examined whether gender-based income disparities exist within the field of otolaryngology. We therefore sought to compare diversity of practice, clinical productivity, and resulting payment among male and female otolaryngologists providing care to Medicare beneficiaries.
Methods
Data Source
We used the CMS Physician and Other Supplier Public Use File to obtain physician-level payment information for services provided by otolaryngologists (specialty code 04) from January 1 through December 31, 2017.10 This database links Healthcare Common Procedure Coding System (HCPCS) codes submitted to Medicare to individual physicians identifiable via unique National Provider Identifier (NPI) numbers. To maintain privacy, any aggregated records comprising 10 or fewer Medicare beneficiaries are excluded from the data set.11 This study analyzed publicly available Medicare data and did not involve human participants and therefore did not require institutional board review by the Massachusetts Eye and Ear Human Research Protections Program or informed consent.
Study Cohort
We excluded nonphysicians (eg, physician assistants) from analysis on the basis of information provided within the “Credentials” fields. We then identified all unique physicians by NPI number and categorized their gender (male/female). This binary classification was provided by CMS. There were no ambiguous or missing data.
Study Variables
For each physician, we extracted HCPCS code-level information on the number of services provided, mean charges allowed (ie, average payment amount), practice setting (facility-based [FB] vs non–facility-based [NFB]), and total payment amount (calculated as number of services multiplied by mean payment amount). Facilities include settings such as hospital-based outpatient departments. Non–facility-based settings include settings such as physician offices and ambulatory surgical centers.11 These practice settings are not mutually exclusive, as otolaryngologists may routinely practice in both (eg, perform clinic visits in a physician office and perform surgeries within a hospital outpatient department). Payment for physician services varies by practice setting under the Medicare Physician Fee Schedule.12
Study Outcomes
For each physician, we aggregated HCPCS code-level results and evaluated 3 primary outcome measures: (1) physician diversity of clinical practice, (2) physician clinical productivity, and (3) physician Medicare payment. These outcome measures were defined in accordance with previously established methods.8,9
We defined the diversity of physician practice as the total number of unique HCPCS codes billed by each physician. We defined physician clinical productivity as the total number of services provided. We calculated total Medicare payment as the sum of payments for all billed HCPCS codes.
We performed a subset analysis to explore potential differences in the level of complexity of outpatient evaluation and management (ie, clinic) visits by gender. We determined the number and complexity (ie, CMS level 1-5) of all new (99201-99205) and established (99211-99215) clinic visits performed by otolaryngologists using HCPCS codes. We aggregated visits by otolaryngologist gender and stratified the results by practice setting.
Statistical Analyses
We used descriptive statistics to characterize physician diversity of practice, clinical productivity, and Medicare payment. We evaluated for differences in these outcomes by gender and practice setting. In accordance with established methods,8,9 we additionally categorized all physicians into 8 quantiles of productivity (cutoffs of 12.5%, 25%, 37.5%, 50%, 62.5%, 75%, and 87.5% for number of provided services) and compared Medicare payment between genders within each quantile. Values that were exactly at the cutoff (eg, 25%) were categorized within the lower quantile.
We performed sensitivity analyses to explore whether childbearing could explain gender-based differences in productivity. We linked our data set to 2017 Medicare Physician Compare13—which includes physician demographic information—using NPI numbers, which are unique to each physician. Based on publicly available estimates from the Association of American Medical Colleges14 and Centers for Disease Control and Prevention,15 we determined a mean age of medical school matriculation of 24 years and childbearing age of younger than 38 years. Accordingly, we then excluded any female physicians with medical school graduation year (column K, “grd_year”) of 2007 or later (age <38 years) to eliminate potential confounding owing to decreased female productivity during childbearing years.
Mean values were compared using 2-tailed t tests. Medians were compared using the nonparametric Wilcoxon rank sum test. Median differences and 95% CIs were estimated using quantile regression models. P values < .05 were considered significant. Statistical analyses were performed using both Stata, version 13 (StataCorp LP) and Microsoft Excel 2016 (Microsoft Corporation). Data analysis was performed from March 10 to April 1, 2020.
Results
Physician Demographics
In 2017, a total of 8456 otolaryngologists (of 9520 total active otolaryngologists16; 88.8%) provided care to Medicare beneficiaries. Women accounted for 15.2% (1289 of 8456) of otolaryngologists participating in Medicare and men accounted for 84.8% (7167 of 8456) (eTable 1 in the Supplement). Women represented 14.7% ( 1131 of 7711) and 13.6% (482 of 3542) of otolaryngologists billing in the NFB and FB settings, respectively.
Diversity of Practice
Otolaryngologists received payment for 834 unique billing codes in 2017. Women billed a total of 387 (46.4%) unique codes while men billed 804 (96.4%) unique codes. Nearly three-quarters (620 of 834; 74.3%) of codes were billed in the NFB setting and approximately one-half (433 of 834; 51.9%) were billed in the FB setting.
Across both practice settings, otolaryngologists billed a mean (SD; range) of 11.1 (6.0; 1-52) and median (interquartile range) of 10 (7-14) unique billing codes per physician (eTable 2 in the Supplement). Female otolaryngologists overall billed fewer mean (mean difference, −2.10; 95% CI, −2.46 to −1.75; P < .001) and median (median difference, −1.0; 95% CI, −1.31 to −0.689; P < .001) unique codes per physician than male otolaryngologists (eTable 2 in the Supplement). This difference was driven by practice patterns in the NFB setting (Table 1), where female otolaryngologists billed fewer mean (mean difference, −1.7; 95% CI, −2.0 to −1.3; P < .001) and median (median difference, 1.0, 95% CI, −1.59 to −0.405; P < .001) unique codes per physician. There was no difference in number of unique codes billed between female and male otolaryngologists in the FB setting (Table 2).
Table 1. Unique Billing Codes, Number of Services, and Medicare Payment to Otolaryngologists in Non–Facility-Based Settings in 2017.
| Variable | Total, No. (%) | Mean (SD) | Mean difference (95% CI) | P value | t Statistic | Median (IQR) | Estimated median difference (95% CI) | P value, median | z Score |
|---|---|---|---|---|---|---|---|---|---|
| Codes per clinician | |||||||||
| All | 52 | 10.67 (5.70) | NA | 10 (7 to 14) | NA | ||||
| Women | 1 to 39 | 9.26 (5.02) | −1.65 (−2.01 to −1.29) | <.001 | −9.03 | 9 (6 to 12) | −1.0 (−1.59 to −0.405) | <.001 | −9.52 |
| Men | 1 to 52 | 10.92 (5.77) | NA | 10 (7 to 14) | NA | ||||
| Services, No. | |||||||||
| All | 13 092 123 | 1697 (2510) | NA | 973 (453 to 1928) | NA | ||||
| Women | 1 309 339 (10.0) | 1157 (1729) | −633 (−791 to −475) | <.001 | −7.87 | 669 (288 to 1308) | −375 (−453 to −297) | <.001 | −12.33 |
| Men | 11 782 784 (90.0) | 1791 (2690) | NA | 1044 (493 to 2040) | NA | ||||
| Payments, $ | |||||||||
| All | 626 537 510 | 81 252 (91 746) | NA | 57 573 (27 882 to 101 711) | NA | ||||
| Women | 65 118 173 (10.4) | 57 575 (74 838) | −27 746 (−33 502 to −21 989) | <.001 | −9.45 | 40 538 (19 240 to 73 793) | −20 397 (−24 576 to −16 217) | <.001 | −12.42 |
| Men | 561 419 337 (89.6) | 85 322 (93 753) | NA | 60 931 (30 229 to 106 581) | NA | ||||
Abbreviations: IQR, interquartile range; NA, not applicable.
Table 2. Unique Billing Codes, Number of Services, and Medicare Payment to Otolaryngologists in Facility-Based Settings in 2017.
| Variable | Total, No. (%) | Mean (SD) | Mean difference (95% CI) | P value | t Statistic | Median (IQR) | Estimated median difference (95% CI) | P value, median | z Score |
|---|---|---|---|---|---|---|---|---|---|
| Codes per clinician | |||||||||
| All | 24 | 3.83 (3.22) | NA | 3 (1 to 5) | NA | ||||
| Women | 1 to 14 | 3.86 (2.94) | 0.04 (−0.217 to 0.347) | .81 | 0.24 | 3 (1 to 6) | 0 (−0.43 to 0.43) | .20 | −1.28 |
| Men | 1 to 24 | 3.83 (3.26) | NA | 3 (1 to 5) | NA | ||||
| Services, No. | |||||||||
| All | 655 417 | 185 (528) | NA | 55 (22 to 198) | NA | ||||
| Women | 87 083 (13.3) | 180 (255) | −5.1 (−55.8 to 45.6) | .85 | 0.20 | 64 (24 to 225) | 11 (−0.57 to 22.59) | .01 | −2.45 |
| Men | 568 334 (86.7) | 185 (559) | NA | 53 (22 to 188) | NA | ||||
| Payments, $ | |||||||||
| All | 60 491 491 | 17 078 (35 306) | NA | 8055 (2681 to 20 738) | NA | ||||
| Women | 6 564 893 (10.9) | 13 620 (17 848) | −4002 (−7393 to −612) | .02 | −2.32 | 6381 (2110 to 15 860) | −1923 (− 3481 to −366) | <.001 | −3.34 |
| Men | 53 926 598 (89.1) | 17 623 (37 291) | NA | 8315 (2784 to 21 200) | NA | ||||
Abbreviations: IQR, interquartile range; NA, not applicable.
Number of Services
Across both practice settings, otolaryngologists provided a total of 13 747 540 services to Medicare beneficiaries in 2017. Women provided 1 396 422 services (10.2% of total), and men provided 12 351 118 services (89.8%) (eTable 2 in the Supplement). The vast majority (13 092 123; 95.2%) of services were provided in the NFB setting; the remainder (655 417; 4.8%) were provided in the FB setting.
Female otolaryngologists overall billed fewer mean (mean difference, −640; 95% CI, −784 to −496; P < .001) and median (median difference, −341, 95% CI, −409 to −273; P < .001) services per physician than male otolaryngologists. This difference was driven by practice patterns in the NFB setting (Table 1), where female otolaryngologists billed fewer mean (mean difference per physician, −633; 95% CI, −791 to −475; P < .001) and median (median difference, −375; 95% CI, −453 to −297; P < .001) services per physician. There was no difference in number of services per physician between female and male otolaryngologists in the FB setting (Table 2).
Payment
Otolaryngologists received a total of $687 028 998 in Medicare payment in 2017. Women accounted for $71 683 065 (10.4%) and men received $615 345 933 (89.6%) in payment (eTable 2 in the Supplement). The vast majority ($626 537 510; 91.2%) of payment was for services provided in the NFB setting; the remainder ($60 491 491; 8.8%) was for services provided in the FB setting.
Female otolaryngologists overall received less mean (mean difference, −$30 246; 95% CI, −$35 738 to −$24 756; P < .001) and median (median difference, −$21 632; 95% CI, −$25 575 to −$17 691; P < .001) payment per physician than male otolaryngologists (eFigure 1 and eFigure 2 in the Supplement). This difference existed in both the NFB (Table 1; Figure, A and B) and FB (Table 2; Figure, C and D) settings.
Figure. Total Medicare Payment to Otolaryngologists in 2017.
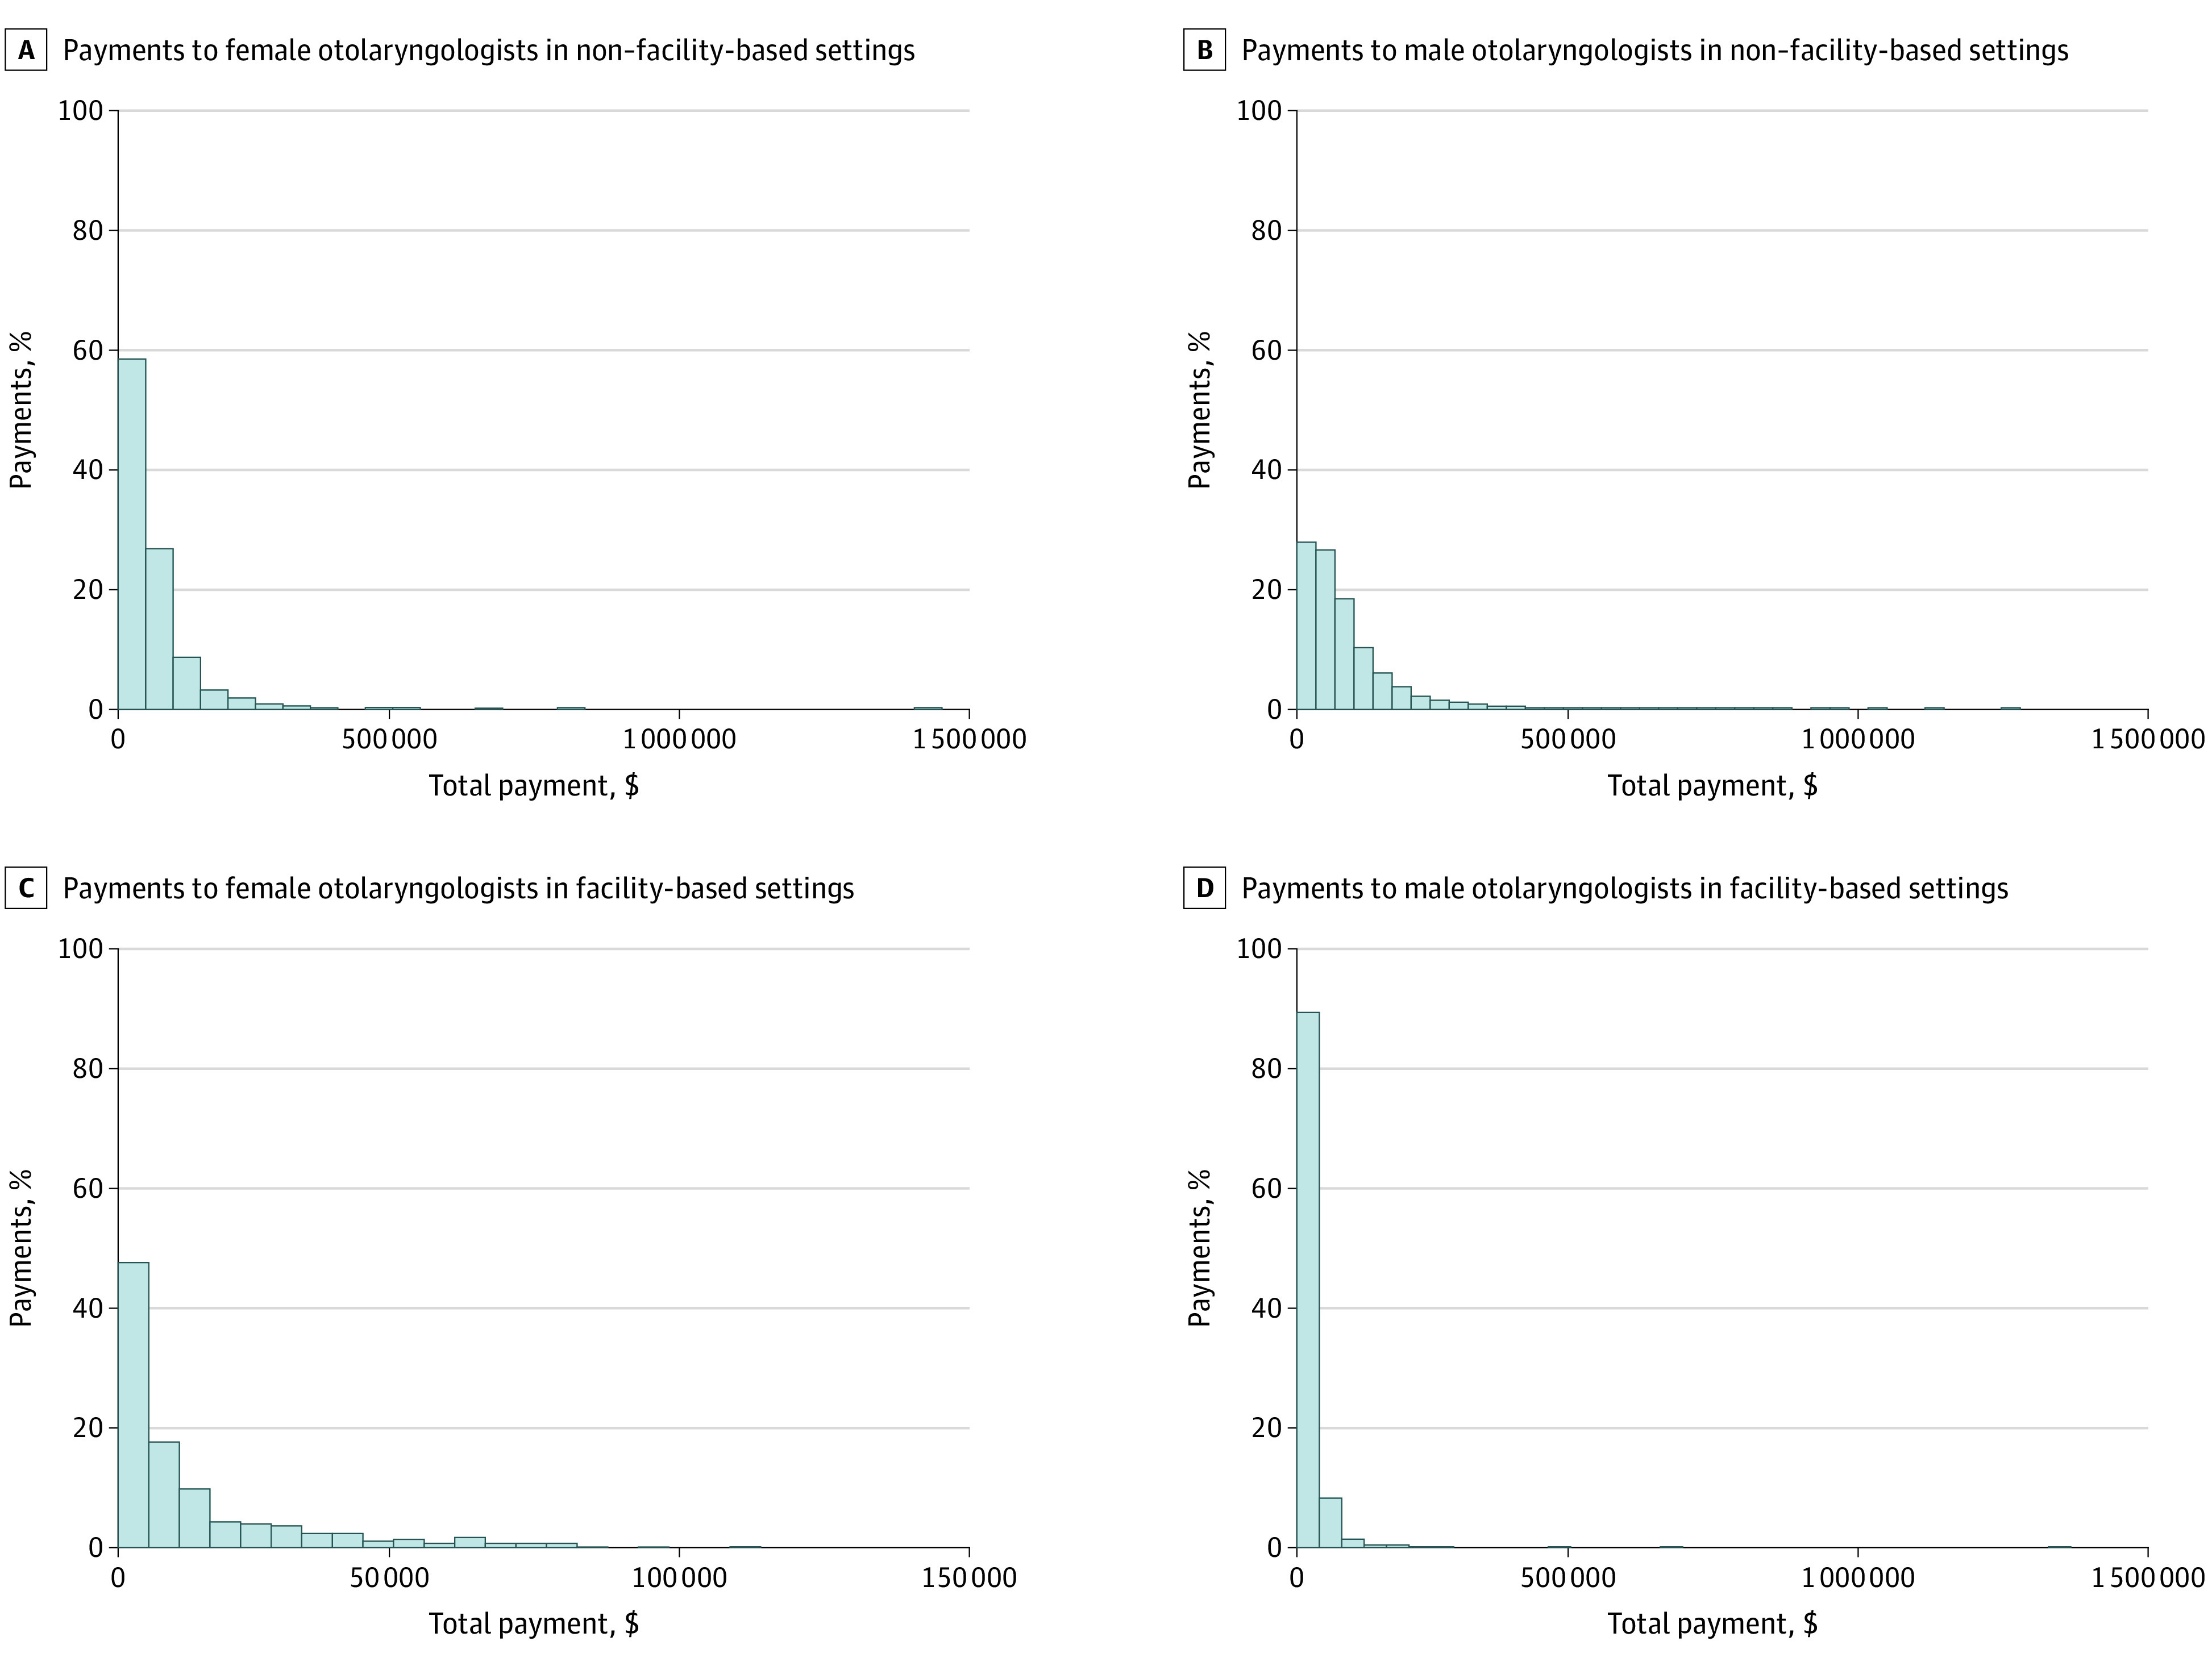
In each graph, the x-axis represents total payment in dollars ($) for individual otolaryngologists (panel C is adjusted for scale). The y-axis represents the percentage of otolaryngologists practicing in that setting.
Influence of Clinical Productivity on Payment
Female otolaryngologists overall comprised a disproportionately high share (24.5%) of the lowest productivity group (259 of 1057) and a disproportionately low share (7.5%) of the highest productivity group (79 of 1057) (eTable 3 in the Supplement). This difference was primarily driven by the NFB setting, where female otolaryngologists comprised 22.9% (221 of 967) of the lowest productivity group and 7.5% (72 of 963) of the highest productivity group (Table 3). In the FB setting, women comprised 10.9% (52 of 479) of the lowest productivity group and 14.7% (65 of 441) of the highest productivity group (Table 4).
Table 3. Otolaryngologist Gender and Level of Productivity (Number of Charges) Provided in Non–Facility-Based Settings in 2017.
| Variable | Total, No. (%) | Payments mean (SD), $ | Mean difference (95% CI), $ | P value | t Statistic | Payments median (IQR), $ | Estimated median difference (95% CI), $ | P value, median | z Score |
|---|---|---|---|---|---|---|---|---|---|
| Group 1 (cutoff of 219 charges) | |||||||||
| All | 967 | 7980 (14 426) | NA | NA | 6610 (2666 to 14 663) | NA | NA | ||
| Women | 221 (22.9) | 7791 (5636) | −245 (−2414 to 1924) | .83 | 0.22 | 7036 (2982 to 11 265) | 643 (−487 to 1773) | .13 | 1.51 |
| Men | 746 (77.1) | 8037 (16 138) | NA | NA | 6388 (2570 to 10 354) | NA | NA | ||
| Group 2 (cutoff of 453 charges) | |||||||||
| All | 963 | 23 684 (13 093) | NA | NA | 21 514 (16 861 to 27 360) | NA | NA | ||
| Women | 197 (20.5) | 23 409 (8208) | −347 (−2400 to 1707) | .74 | 0.33 | 22 667 (17 005 to 27 894) | 1339 (−145 to 2824) | .20 | 1.29 |
| Men | 766 (79.5) | 23 755 (14 080) | NA | NA | 21 318 (16 762 to 27 094) | NA | NA | ||
| Group 3 (cutoff of 697 charges) | |||||||||
| All | 966 | 39 666 (18 573) | NA | NA | 36 517 (30 495 to 44 431) | NA | NA | ||
| Women | 169 (17.5) | 40 413 (16 637) | 906 (−2181 to 3994) | .57 | 0.58 | 38 198 (31 890 to 45 832) | 2039 (104 to 3974) | .04 | 2.01 |
| Men | 797 (82.5) | 39 507 (18 965) | NA | NA | 36 159 (30 143 to 44 230) | NA | NA | ||
| Group 4 (cutoff of 973 charges) | |||||||||
| All | 961 | 57 101 (27 483) | NA | NA | 52 788 (44 028 to 64 597) | NA | NA | ||
| Women | 146 (15.2) | 52 118 (14 511) | −5877 (−10 712 to −1042) | .02 | −2.39 | 50 651 (41 982 to 62 183) | −2267 (−5401 to 863) | .048 | −1.98 |
| Men | 815 (84.8) | 57 995 (29 121) | NA | NA | 53 079 (44 220 to 65 109) | NA | NA | ||
| Group 5 (cutoff of 1334 charges) | |||||||||
| All | 963 | 74 177 (30 324) | NA | NA | 70 828 (56 991 to 84 766) | NA | NA | ||
| Women | 121 (12.6) | 74 298 (27 495) | 138 (−5651 to 5926) | .96 | 0.05 | 75 214 (59 565 to 85 379) | 5017 (121 to 9912) | .23 | 1.21 |
| Men | 842 (87.4) | 74 160 (30 724) | NA | NA | 70 148 (56 815 to 84 731) | NA | NA | ||
| Group 6 (cutoff of 1928 charges) | |||||||||
| All | 965 | 100 996 (60 369) | NA | NA | 92 415 (72 449 to 113 971) | NA | NA | ||
| Women | 108 (11.2) | 92 700 (51 369) | −9342 (−21 431 to 2746 | .13 | −1.52 | 88 151 (65 366 to 108 659) | −3795 (−11 761 to 4170) | .08 | −1.77 |
| Men | 857 (88.8) | 102 042 (61 358) | NA | NA | 92 883 (72 835 to 115 649) | NA | NA | ||
| Group 7 (cutoff of 3265 charges) | |||||||||
| All | 963 | 131 715 (70 527) | NA | NA | 122 811 (85 611 to 162 408) | NA | NA | ||
| Women | 97 (10.1) | 117 979 (74 173) | −15 275 (−30 070 to −480) | .04 | −2.03 | 113 032 (62 834 to 154 432) | −11 630 (−26 314 to 3054) | .008 | −2.67 |
| Men | 866 (89.9) | 133 254 (69 984) | NA | NA | 124 518 (87 470 to 163 137) | NA | NA | ||
| Group 8 (maximum of 40 536 charges) | |||||||||
| All | 963 | 215 039 (156 509) | NA | NA | 172 504 (114 621 to 264 191) | NA | NA | ||
| Women | 72 (7.5) | 193 056 (193 411) | −23 760 (−61380 to 13 860) | .22 | −1.24 | 155 418 (89 405 to 214 101) | −17 584 (−52 898 to 17 728) | .01 | −2.49 |
| Men | 891 (92.5) | 216 816 (153 135) | NA | NA | 174 277 (116 666 to 266 111) | NA | NA | ||
Abbreviations: IQR, interquartile range; NA, not applicable.
Table 4. Otolaryngologist Gender and Level of Productivity (Number of Charges) Provided in Facility-Based Settings in 2017.
| Variable | Total, No. (%) | Payments, mean (SD), $ | Mean difference (95% CI), $ | P value | t Statistic | Payments, median (IQR), $ | Estimated median difference (95% CI), $ | P value, median | z Score |
|---|---|---|---|---|---|---|---|---|---|
| Group 1 (cutoff of 13 charges) | |||||||||
| All | 479 | 2676 (2838) | NA | NA | 1654 (1064 to 3123) | NA | NA | ||
| Women | 52 (10.9) | 2124 (2366) | −619 (−1438 to 198) | .14 | −1.49 | 1372 (1022 to 1976) | −300 (−719 to 119) | .11 | −1.59 |
| Men | 427 (89.1) | 2744 (2886) | NA | NA | 1678 (1078) | NA | NA | ||
| Group 2 (cutoff of 22 charges) | |||||||||
| All | 422 | 3681 (4459) | NA | NA | 1973 (1384 to 3129) | NA | NA | ||
| Women | 62 (14.7) | 2578 (3591) | −1293 (−2493 to −93) | .03 | −2.12 | 1679 (1015 to 2323) | −335 (−770 to 99.7) | .008 | −2.66 |
| Men | 360 (85.3) | 3871 (4569) | NA | NA | 2024 (1425 to 3314) | NA | NA | ||
| Group 3 (cutoff of 34 charges) | |||||||||
| All | 444 | 6022 (5675) | NA | NA | 3968 (2385 to 8379) | NA | NA | ||
| Women | 51 (11.5) | 3497 (3573) | −2852 (−4493 to −1212) | <.001 | −3.42 | 2187 (1345 to 4401) | −1952 (−3345 to −558) | <.001 | −4.95 |
| Men | 393 (88.5) | 6350 (5816) | NA | NA | 4138 (2600 to 8600) | NA | NA | ||
| Group 4 (cutoff of 55 charges) | |||||||||
| All | 436 | 9319 (9243) | NA | NA | 5426 (3071 to 11 903) | NA | NA | ||
| Women | 55 (12.6) | 6920 (7770) | −2745 (−5355 to −134) | .04 | −2.07 | 3727 (2278 to 8625) | −2524 (−4911 to −137) | .003 | −3.02 |
| Men | 381 (87.4) | 9665 (9395) | NA | NA | 6251 (3303 to 12 439) | NA | NA | ||
| Group 5 (cutoff of 95 charges) | |||||||||
| All | 434 | 12 390 (10 149) | NA | NA | 8162 (4622 to 18 578) | NA | NA | ||
| Women | 49 (11.3) | 7718 (6755) | −5267 (−8255 to −2279) | <.001 | −3.46 | 5379 (3631 to 8916) | −3186 (−7727 to 1354) | <.001 | −3.78 |
| Men | 385 (88.7) | 12 985 (10 359) | NA | NA | 8565 (4695 to 19 449) | NA | NA | ||
| Group 6 (cutoff of 198 charges) | |||||||||
| All | 443 | 18 449 (15 833) | NA | NA | 11 072 (7036 to 25 823) | NA | NA | ||
| Women | 69 (15.6) | 11 516 (11 015) | −8211 (−12 220 to −4202) | <.001 | −4.03 | 7537 (5973 to 10 730) | −4724 (−9465 to 17.2) | <.001 | −4.76 |
| Men | 374 (84.4) | 19 728 (16 261) | NA | NA | 12 208 (7490 to 29 330) | NA | NA | ||
| Group 7 (cutoff of 417 charges) | |||||||||
| All | 443 | 26 077 (22 897) | NA | NA | 17 831 (12 558 to 30 167) | NA | NA | ||
| Women | 79 (17.8) | 18 894 (12 212) | −8741 (−14 273 to −3210) | .002 | −3.11 | 14 530 (11 526 to 24 027) | −3964 (−7655 to −274) | <.001 | −3.39 |
| Men | 364 (82.2) | 27 636 (24 345) | NA | NA | 18 431 (12 903 to 32 614) | NA | NA | ||
| Group 8 (maximum of 21 274 charges) | |||||||||
| All | 441 | 58 542 (81 229) | NA | NA | 42 683 (28 367 to 61 852) | NA | NA | ||
| Women | 65 (14.7) | 47 233 (20 313) | −13 263 (−34 697 to 8170) | .22 | −1.22 | 42 950 (31 644 to 61 209) | 274 (−8204 to 8753) | .861 | 0.18 |
| Men | 376 (85.3) | 60 497 (87 438) | NA | NA | 42 562 (27 910 to 62 728) | NA | NA | ||
Abbreviations: IQR, interquartile range; NA, not applicable.
There was no statistically significant difference in mean Medicare payment per physician (mean difference, −$30 628; 95% CI, −$67 647 to $6389; P = .10) between female and male otolaryngologists within the highest productivity group. However, female otolaryngologists in the highest (median difference, −$31 473; 95% CI, −$65 862 to $2916; P = .004) and second-highest (median difference, −$11 337; 95% CI, −$24 644 to $1969; P = .009) productivity groups both received lower median Medicare payment per physician than male otolaryngologists in these groups.
This difference in median payment was primarily driven by the NFB setting, where female otolaryngologists in the highest productivity group earned lower median payment per physician (median difference, −$17 584; 95% CI, −$52 898 to $17 728; P = .01) than male otolaryngologists. There was no statistically significant difference in median Medicare payment per physician between female and male otolaryngologists practicing in the FB setting. Female otolaryngologists in multiple productivity groups received less mean and median Medicare payment per physician in both the NFB and FB setting (Table 3 and Table 4).
Physician-Level Variables
After adjusting for age (graduation year) as a covariate, gender remained a highly significant predictor for all outcomes of interest (unique codes: β = 2.36; P < .001; number of services: β = 678.5; P < .001; payment: β = 30006; P < .001) in the overall analysis. In subsequent sensitivity analyses excluding female physicians of childbearing age (younger than 38 years),15 gender disparities persisted in number of unique charges, number of services, and total Medicare payment (eTable 4 in the Supplement). There was no apparent difference in the distribution of visit complexity between genders in either practice setting (eTable 5 and eTable 6 in the Supplement).
Discussion
In this retrospective, cross-sectional analysis of compensation and productivity among otolaryngologists participating in Medicare in 2017, we found that female otolaryngologists overall submitted significantly fewer unique billing codes (ie, had a less diverse scope of practice), provided fewer services (ie, were less clinically productive), and received lower Medicare payment than male otolaryngologists. This disparity was more pronounced in NFB settings rather than FB (ie, hospital) practice settings. In the FB setting, female otolaryngologists had similar diversity of practice and clinical productivity as male otolaryngologists. Nonetheless, Medicare payment to female otolaryngologists was still significantly less than for men in both FB and NFB settings. The exclusion of women of childbearing age and adjustment for physician age did not influence observed gender disparities for any outcome measures.
The influence of gender on professional opportunities and advancement within the field of otolaryngology is well described in the literature. Female otolaryngologists have less National Institutes of Health grant funding than male otolaryngologists at all time points in their career and have lower h-indices (index of scientific research impact) than male otolaryngologists.17,18 Female otolaryngologists additionally have fewer financial relationships with industry and receive less industry contributions than male otolaryngologists.19 Lower levels of federal research funding and industry collaborations may in part explain why women are less likely to advance to higher academic ranks (ie, associate and full professor) and positions of leadership (eg, department chairs and other senior leadership) within the field of otolaryngology.20,21,22 Despite these inequities, female otolaryngologists who achieve senior academic rank have increased productivity compared with men, indicating that female otolaryngologists are able to achieve high levels of performance in academic medicine despite potential barriers.18 In addition to senior-career productivity, female otolaryngologists are now beginning to achieve parity in several other key spheres of influence, including specialty society membership and leadership positions,23 publication of peer-reviewed literature,24,25 and authorship of opinion pieces.26
Despite such progress, our study demonstrates that income inequality remains a barrier to true gender parity. Our findings are consistent with analogous studies in the fields of radiation oncology and ophthalmology, which suggest that gender-based payment disparities may in part be attributed to lower productivity and narrower scopes of practice among female physicians. Our results reveal that income inequity persists even among the most highly productive (as measured by service count) groups of otolaryngologists. This indicates that female otolaryngologists are typically performing less remunerative services. This difference was not driven by complexity of clinic visits but instead may be related to the number or relative value units of procedural aspects of care.
Although our study did not examine the potential factors underlying this phenomenon, the literature describes a number of reasons for gender-based income inequality, such as an increased desire for part-time and flexible scheduling among female physicians,27,28 gender-based differences in procedure intensity and acuity,29 inequities in salary negotiation,27,30 and a disproportionate participation in noncompensated activities and committee membership for female physicians.30 In addition to these factors, many acknowledge that implicit gender biases continue to contribute to gender pay inequity.2,4,31,32 Strategies to address implicit biases include human capital investment (eg, contract negotiations training) in female physicians and awareness and bias reduction strategies targeted toward department leadership (ie, those with most control over salary and promotions).32
Although women can be effective in raising awareness about these inequities, female otolaryngologists must partner with their male colleagues to meaningfully drive action to achieve gender parity. Recent research has demonstrated that women are disproportionately represented as authors of pieces advocating for gender equality in medicine, particularly related to compensation.33 However, in an era in which female medical students outnumber men34 and women account for more than one-third of otolaryngology residents,35 effort must be directed at both at the pipeline as well as the proverbial glass ceiling to meaningfully effect change. In a hospital-based organization, leadership may use multiple strategies, including recruitment targets, mentorship programs, and block time allocation, to promote gender parity. Organizational adoption of such strategies to date may help explain our findings of gender parity with respect to diversity of practice and clinical productivity in the FB setting. In contrast, there may be fewer institutional efforts focused on gender parity in NFB settings, such as independent physician practices. Senior-level physicians within such practices—who are most often male—should consider both formal means (eg, practice support, including physician extenders) and informal means (eg, referral patterns of patients likely to require procedures) to promote equitable practice growth among their female colleagues.
Limitations
Our study has limitations. First, our analysis was limited to outpatient Medicare data, which reflects a portion of physician practice and compensation within otolaryngology. However, based on existing salary-level data, we believe that our findings are likely representative of overall gender-based payment disparities in our field and that gender-based disparity would be increased with inclusion of higher-paying commercial payer and inpatient populations.5,6 Second, our retrospective analysis was restricted to a single year (2017) and may therefore fail to reflect current patterns of practice and compensation. Third, we did not adjust for physician subspecialty in our analysis, although such information is not consistently available for all physicians participating in Medicare. Additional research is necessary to delineate differences in patient and/or payer mix among male and female otolaryngologists and evaluate trends over time.
Conclusions
Female sex is associated with decreased diversity of practice, lower clinical productivity, and decreased Medicare payment among otolaryngologists. Gender-based inequity is more pronounced in NFB settings compared with FB settings. Further efforts are necessary to better evaluate and address gender disparities within otolaryngology. Such efforts will benefit from the engagement and support of male colleagues and organizational leadership.
eTable 1. Gender Demographics of Otolaryngologists Participating in Medicare in 2017.
eTable 2. Unique Billing Codes, Number of Services, and Medicare Payment to Otolaryngologists in 2017.
eTable 3. Otolaryngologist Gender and Level of Productivity (Number of Charges) Provided in Non-Facility and Facility-Based Settings in 2017.
eTable 4. Sensitivity Analysis. Unique Billing Codes, Number of Services, and Medicare Payment to Otolaryngologists in 2017.
eTable 5. Distribution of Office Visit Types Among Otolaryngologists in Non-Facility Based Settings in 2017.
eTable 6. Distribution of Office Visit Types Among Otolaryngologists in Facility Based Settings in 2017.
eFigure 1. Total Medicare Payment to Female Otolaryngologists in 2017.
eFigure 2. Total Medicare Payment to Male Otolaryngologists in 2017.
References
- 1.Saunders MR, Turner BJ. Unequal pay for equal work: where are we now? Ann Intern Med. 2018;169(9):654-655. doi: 10.7326/M18-1879 [DOI] [PubMed] [Google Scholar]
- 2.Laine C, Turner BJ. Unequal pay for equal work: the gender gap in academic medicine. Ann Intern Med. 2004;141(3):238-240. doi: 10.7326/0003-4819-141-3-200408030-00019 [DOI] [PubMed] [Google Scholar]
- 3.Lo Sasso AT, Armstrong D, Forte G, Gerber SE. Differences in starting pay for male and female physicians persist; explanations for the gender gap remain elusive. Health Aff (Millwood). 2020;39(2):256-263. doi: 10.1377/hlthaff.2019.00664 [DOI] [PubMed] [Google Scholar]
- 4.Henderson MT, Fijalkowski N, Wang SK, et al. Gender differences in compensation in academic medicine: the results from four neurological specialties within the University of California Healthcare System. Scientometrics. 2014;100:297-306. doi: 10.1007/s11192-014-1266-y [DOI] [Google Scholar]
- 5.Grandis JR, Gooding WE, Zamboni BA, et al. The gender gap in a surgical subspecialty: analysis of career and lifestyle factors. Arch Otolaryngol Head Neck Surg. 2004;130(6):695-702. doi: 10.1001/archotol.130.6.695 [DOI] [PubMed] [Google Scholar]
- 6.Peckham C. Medscape otolaryngologist compensation report 2018. Accessed March 22, 2020. https://www.medscape.com/slideshow/2018-compensation-otolaryngologist-6009666
- 7.HealthCare.gov. Affordable Care Act (ACA). Accessed March 16, 2020. https://www.healthcare.gov/glossary/affordable-care-act/
- 8.Valle L, Weng J, Jagsi R, et al. Assessment of differences in clinical activity and Medicare payments among female and male radiation oncologists. JAMA Netw Open. 2019;2(3):e190932. doi: 10.1001/jamanetworkopen.2019.0932 [DOI] [PMC free article] [PubMed] [Google Scholar]
- 9.Reddy AK, Bounds GW, Bakri SJ, et al. Differences in clinical activity and Medicare payments for female vs male ophthalmologists. JAMA Ophthalmol. 2017;135(3):205-213. doi: 10.1001/jamaophthalmol.2016.5399 [DOI] [PubMed] [Google Scholar]
- 10.Centers for Medicare & Medicaid Services Medicare provider utilization and payment data: physician and other supplier. Accessed March 16, 2020. https://www.cms.gov/research-statistics-data-and-systems/statistics-trends-and-reports/medicare-provider-charge-data/physician-and-other-supplier
- 11.Centers for Medicare & Medicaid Services Medicare fee-for-service provider utilization & payment data physician and other supplier public use file: a methodological overview. Accessed March 16, 2020. https://www.cms.gov/Research-Statistics-Data-and-Systems/Statistics-Trends-and-Reports/Medicare-Provider-Charge-Data/Downloads/Medicare-Physician-and-Other-Supplier-PUF-Methodology.pdf
- 12.Centers for Medicare & Medicaid Services Physician fee schedule. Accessed March 30, 2020. https://www.cms.gov/Medicare/Medicare-Fee-for-Service-Payment/PhysicianFeeSched
- 13.Data.Medicare.gov Archived datasets. Accessed May 30, 2020. https://data.medicare.gov/data/archives/physician-compare
- 14.Association of American Medical Colleges Table A-6: age of applicants to US medical schools at anticipated matriculation by sex and race/ethnicity, 2014-2015 through 2017-2018. Accessed May 30, 2020. https://www.aamc.org/system/files/d/1/321468-factstablea6.pdf
- 15.Martin JA, Hamilton BE, Osterman MJK, Driscoll AK. Births: final data for 2018. Natl Vital Stat Rep. 2019;68(13):1-47. [PubMed] [Google Scholar]
- 16.Association of American Medical Colleges Active physicians by sex and specialty, 2017. Accessed March 30, 2020. https://www.aamc.org/data-reports/workforce/interactive-data/active-physicians-sex-and-specialty-2017
- 17.Eloy JA, Svider PF, Kovalerchik O, Baredes S, Kalyoussef E, Chandrasekhar SS. Gender differences in successful NIH grant funding in otolaryngology. Otolaryngol Head Neck Surg. 2013;149(1):77-83. doi: 10.1177/0194599813486083 [DOI] [PubMed] [Google Scholar]
- 18.Eloy JA, Svider P, Chandrasekhar SS, et al. Gender disparities in scholarly productivity within academic otolaryngology departments. Otolaryngol Head Neck Surg. 2013;148(2):215-222. doi: 10.1177/0194599812466055 [DOI] [PubMed] [Google Scholar]
- 19.Eloy JA, Bobian M, Svider PF, et al. Association of gender with financial relationships between industry and academic otolaryngologists. JAMA Otolaryngol Head Neck Surg. 2017;143(8):796-802. doi: 10.1001/jamaoto.2017.0276 [DOI] [PMC free article] [PubMed] [Google Scholar]
- 20.Eloy JA, Mady LJ, Svider PF, et al. Regional differences in gender promotion and scholarly productivity in otolaryngology. Otolaryngol Head Neck Surg. 2014. 150(3):371-377. doi: 10.1177/0194599813515183 [DOI] [PubMed] [Google Scholar]
- 21.Society of University Otolaryngologists 2018 Newsletter v2. Accessed March 31, 2020. https://suo-aado.org/page/2018Newsletterv2
- 22.Mensah M, Beeler W, Rotenstein L, et al. Sex differences in salaries of department chairs at public medical schools. JAMA Intern Med. 2020;180(5):789-792. doi: 10.1001/jamainternmed.2019.7540 [DOI] [PMC free article] [PubMed] [Google Scholar]
- 23.Choi SS, Miller RH. Women otolaryngologist representation in specialty society membership and leadership positions. Laryngoscope. 2012;122(11):2428-2433. doi: 10.1002/lary.23566 [DOI] [PubMed] [Google Scholar]
- 24.Bergeron JL, Wilken R, Miller ME, Shapiro NL, Bhattacharyya N. Measurable progress in female authorship in otolaryngology. Otolaryngol Head Neck Surg. 2012;147(1):40-43. doi: 10.1177/0194599812438171 [DOI] [PubMed] [Google Scholar]
- 25.Arrighi-Allisan AE, Shukla DC, Meyer AM, et al. Gender trends in authorship of original otolaryngology publications: a fifteen-year perspective. Laryngoscope. Published online December 4, 2019. doi: 10.1002/lary.28372 [DOI] [PubMed] [Google Scholar]
- 26.Miller AL, Rathi VK, Gray ST, Bergmark RW. Female authorship of opinion pieces in leading otolaryngology journals between 2013 and 2018. Otolaryngol Head Neck Surg. 2020;162(1):35-37. doi: 10.1177/0194599819886119 [DOI] [PubMed] [Google Scholar]
- 27.Association of American Medical Colleges Closing the gender pay gap in medicine. Accessed March 22, 2020. https://www.aamc.org/news-insights/closing-gender-pay-gap-medicine
- 28.MarketWatch Too many female doctors go part-time or stop working—why that’s a big problem. Accessed March 28, 2020. https://www.marketwatch.com/story/too-many-female-doctors-go-part-time-or-stop-working-and-thats-bad-for-patients-2019-08-06
- 29.Mahr MA, Hayes SN, Shanafelt TD, Sloan JA, Erie JC. Gender differences in physician service provision using Medicare claims data. Mayo Clin Proc. 2017;92(6):870-880. doi: 10.1016/j.mayocp.2017.02.017 [DOI] [PubMed] [Google Scholar]
- 30.Rotenstein LS, Dudley J How to close the gender pay gap in US medicine. Accessed March 28, 2020. https://hbr.org/2019/11/how-to-close-the-gender-pay-gap-in-u-s-medicine
- 31.Salles A, Awad M, Goldin L, et al. Estimating implicit and explicit gender bias among health care professionals and surgeons. JAMA Netw Open. 2019;2(7):e196545-e196545. doi: 10.1001/jamanetworkopen.2019.6545 [DOI] [PMC free article] [PubMed] [Google Scholar]
- 32.Girod S, Fassiotto M, Grewal D, et al. Reducing implicit gender leadership bias in academic medicine with an educational intervention. Acad Med. 2016;91(8):1143-1150. doi: 10.1097/ACM.0000000000001099 [DOI] [PubMed] [Google Scholar]
- 33.Larson AR, Cawcutt KA, Englander MJ, et al. Representation of women in authorship and dissemination of analyses of physician compensation. JAMA Netw Open. 2020;3(3):e201330. doi: 10.1001/jamanetworkopen.2020.1330 [DOI] [PMC free article] [PubMed] [Google Scholar]
- 34.Association of American Medical Colleges 2019. Facts: applicants and matriculants data. Accessed March 31, 2020. https://www.aamc.org/data-reports/students-residents/interactive-data/2019-facts-applicants-and-matriculants-data
- 35.Association of American Medical Colleges ACGME residents and fellows by sex and specialty, 2017. Accessed May 5, 2019. https://www.aamc.org/data-reports/workforce/interactive-data/acgme-residents-and-fellows-sex-and-specialty-2017
Associated Data
This section collects any data citations, data availability statements, or supplementary materials included in this article.
Supplementary Materials
eTable 1. Gender Demographics of Otolaryngologists Participating in Medicare in 2017.
eTable 2. Unique Billing Codes, Number of Services, and Medicare Payment to Otolaryngologists in 2017.
eTable 3. Otolaryngologist Gender and Level of Productivity (Number of Charges) Provided in Non-Facility and Facility-Based Settings in 2017.
eTable 4. Sensitivity Analysis. Unique Billing Codes, Number of Services, and Medicare Payment to Otolaryngologists in 2017.
eTable 5. Distribution of Office Visit Types Among Otolaryngologists in Non-Facility Based Settings in 2017.
eTable 6. Distribution of Office Visit Types Among Otolaryngologists in Facility Based Settings in 2017.
eFigure 1. Total Medicare Payment to Female Otolaryngologists in 2017.
eFigure 2. Total Medicare Payment to Male Otolaryngologists in 2017.