Abstract
The mortality-to-incidence ratio (MIR) can be computed from readily accessible, public-use data on cancer incidence and mortality, and a high MIR value is an indicator of poor survival relative to incidence. Newly available data on congressional district-specific cancer incidence and mortality from the U.S. Cancer Statistics (USCS) database from 2011 to 2015 were used to compute MIR values for overall (all types combined), breast, cervix, colorectal, esophagus, lung, oral, pancreas, and prostate cancer. Congressional districts in the South and Midwest, including MS, AL, and KY, had higher (worse) MIR values for all cancer types combined than for the U.S. as a whole. For all cancers combined, there was a positive correlation between each district’s percent of rural residents and the MIR (r = 0.47; p < .001). The MIR for all cancer types combined was lower in districts within states that expanded Medicaid vs. those states that did not expand Medicaid (0.36 vs. 0.38; p < .001). A positive correlation was seen between the proportion of non-Hispanic Black residents and MIR (r = 0.15; p < .01 for all cancers). Lower MIRs were observed in districts in New England and in states that expanded Medicaid. However, there also were some interesting departures from this rule (e.g., Wyoming, South Dakota, parts of Wisconsin and Florida). Rural congressional districts have generally higher MIRs than more urban districts. There is some concern that poorer, more rural states that did not expand Medicaid may experience greater disparities in MIRs relative to Medicaid expansion states in the future.
Keywords: Neoplasms; Cancer incidence; Cancer mortality; Mortality-to-incidence ratio; Racial; disparities, Congressional Districts, Rurality
1. Introduction
The mortality-to-incidence ratio (MIR) is an indicator of how well a population does after receiving a cancer diagnosis. High MIR values for a region are an indicator of poor cancer outcomes relative to incidence, thereby indicating areas for targeting interventions related to access to screening, treatment and improved survivorship care. The MIR can be computed from readily accessible, public-use data on cancer incidence and mortality for the entire country–i.e., without costly and cumbersome data linkage–while survival data (considered to be superior to the MIR) is publicly available only for the SEER (Surveillance, Epidemiology, and End Results) database covering a minimal 9 regions or states since 1975 in our nation, or about 9.4% of the entire U.S. population, to slightly over ⅓ (34.6%) in SEER 18 https://seer.cancer.gov/registries/data.html (2019). Prior studies have used the MIR to portray disease severity across geographic regions (e.g., county) and by key demographic subgroups such as race/ethnicity (Adams et al., 2015a, 2015b; Babatunde et al., 2016; Hebert et al., 2009; Odahowski et al., 2018; Sunkara and Hebert, 2015, 2016b; Wagner et al., 2012). The recent availability of U.S. congressional district-specific cancer incidence and mortality data from the Centers for Disease Control and Prevention (CDC) United States Cancer Statistics (USCS) visualization tool provides a unique opportunity to calculate and depict the MIR using a fairly consistent denominator across districts (e.g., congressional districts are designed with an average population size of around 711,000), and to contribute to data-driven decision-making at the legislative level.
This project was designed to display maps of MIRs by congressional district with the goal of discerning regional patterns. We also compare MIRs in congressional districts nested within states that expanded Medicaid vs. those that did not; which expands on our team’s previous work (Choi et al., 2015), and examine MIR differences by race (i.e., comparing Black vs. non-Hispanic White residents) in expansion and non-expansion states.
2. Methods
We obtained overall and race-specific 2011–2015 age-adjusted incidence and mortality rates for all cancers combined and for the following cancers: [female] breast, cervix, colorectal, esophagus, lung, oral, pancreas, and prostate for each congressional district in the U.S. We then calculated the MIR, by dividing the mortality rate by the incidence rate for each congressional district and cancer type, respectively. Because incidence data were suppressed for Illinois, Kansas, and Minnesota, we were unable to calculate MIRs for congressional districts in these states.
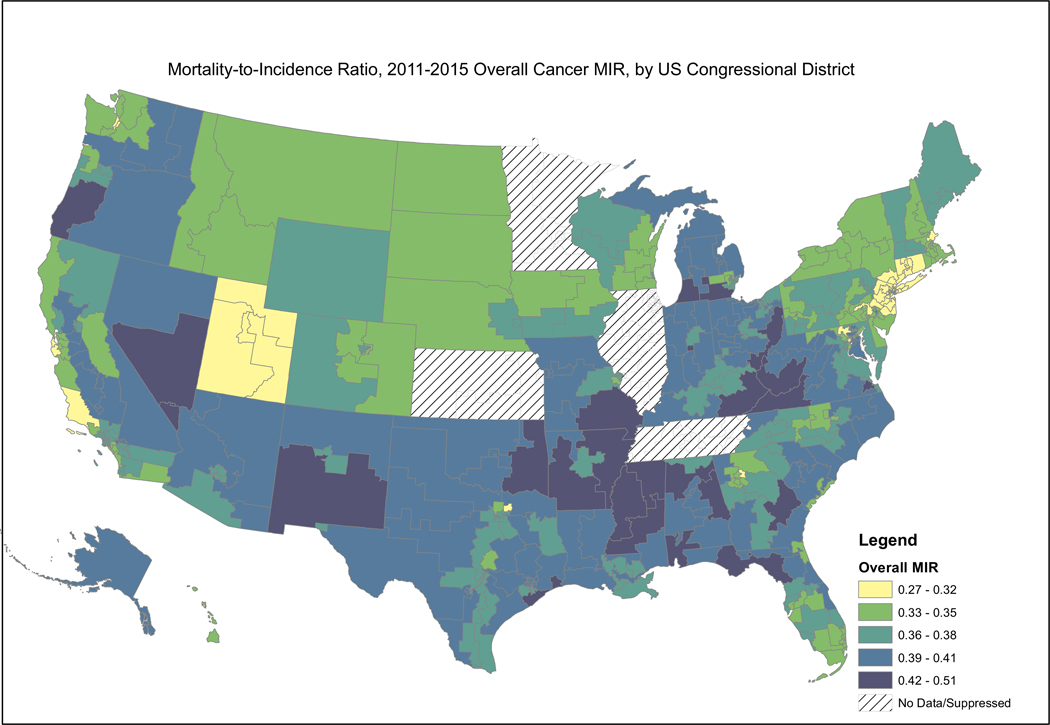
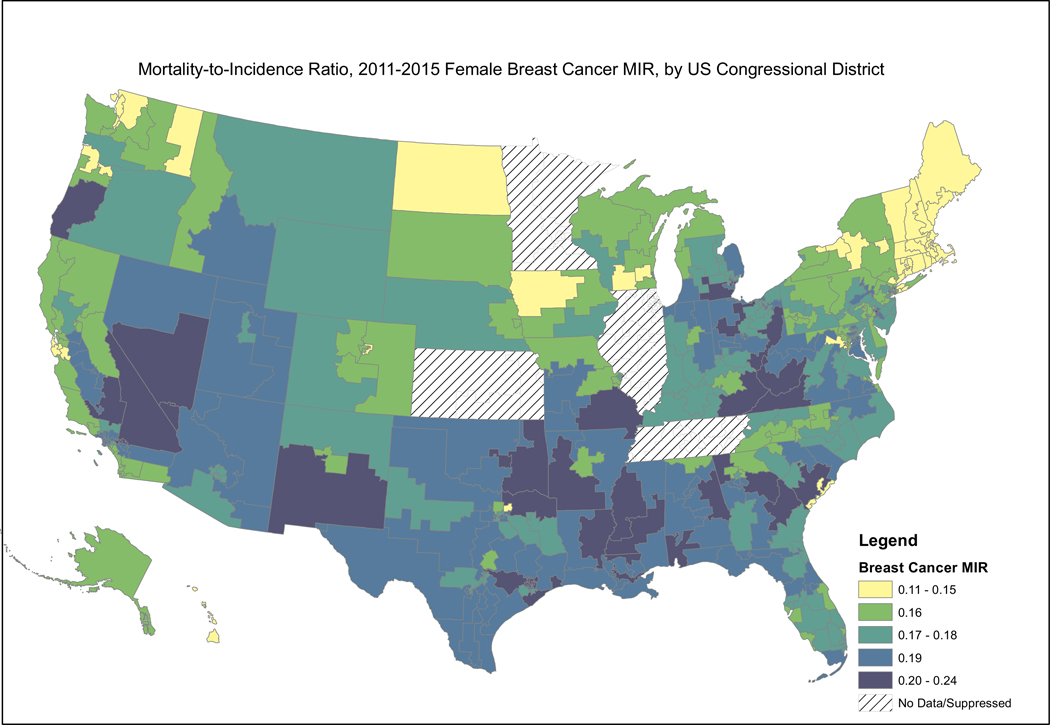
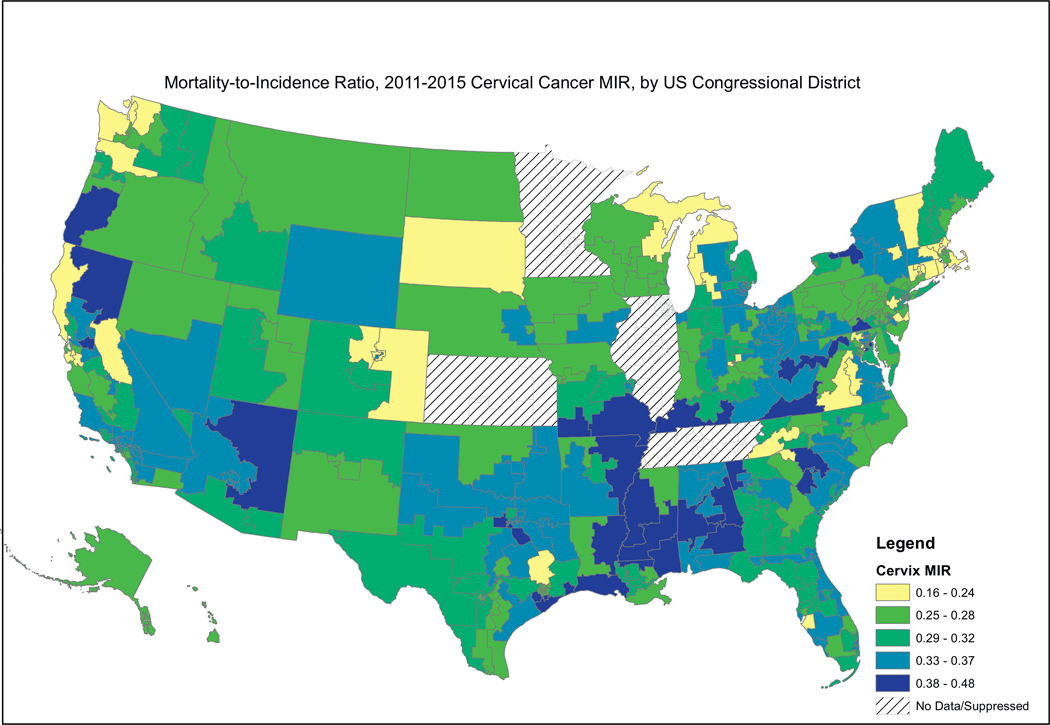
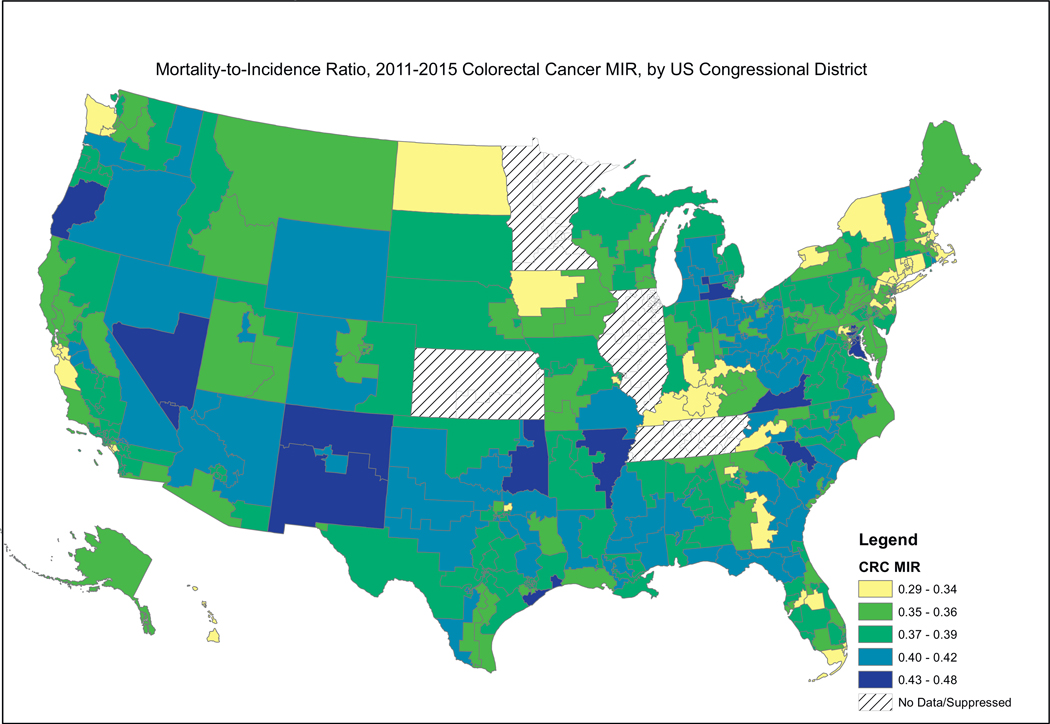
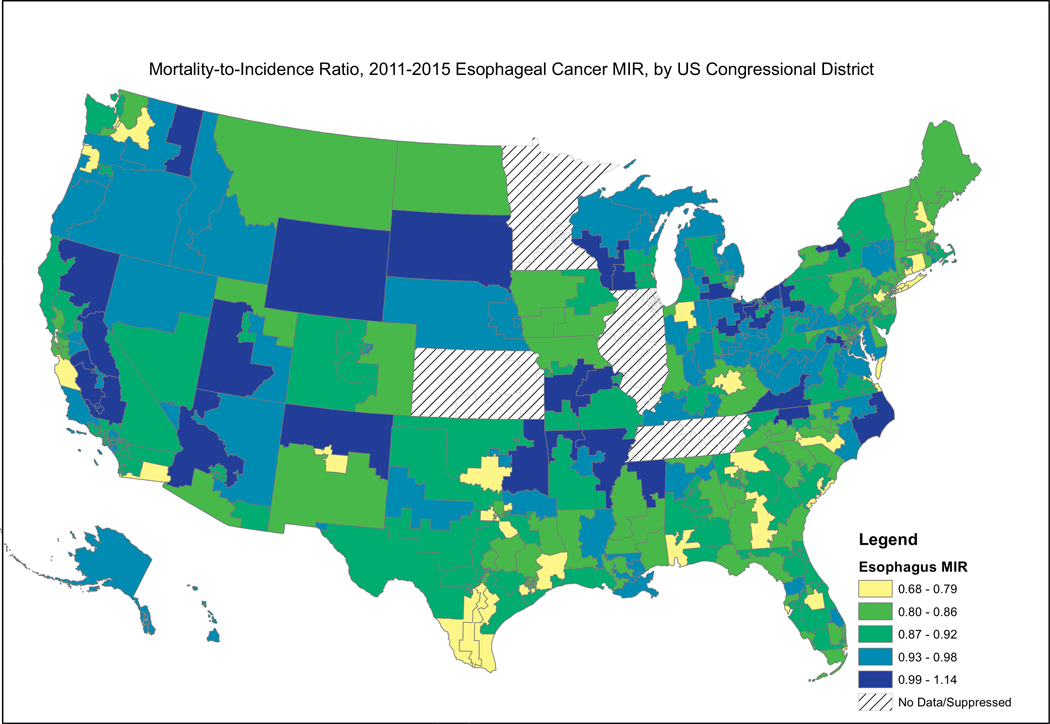
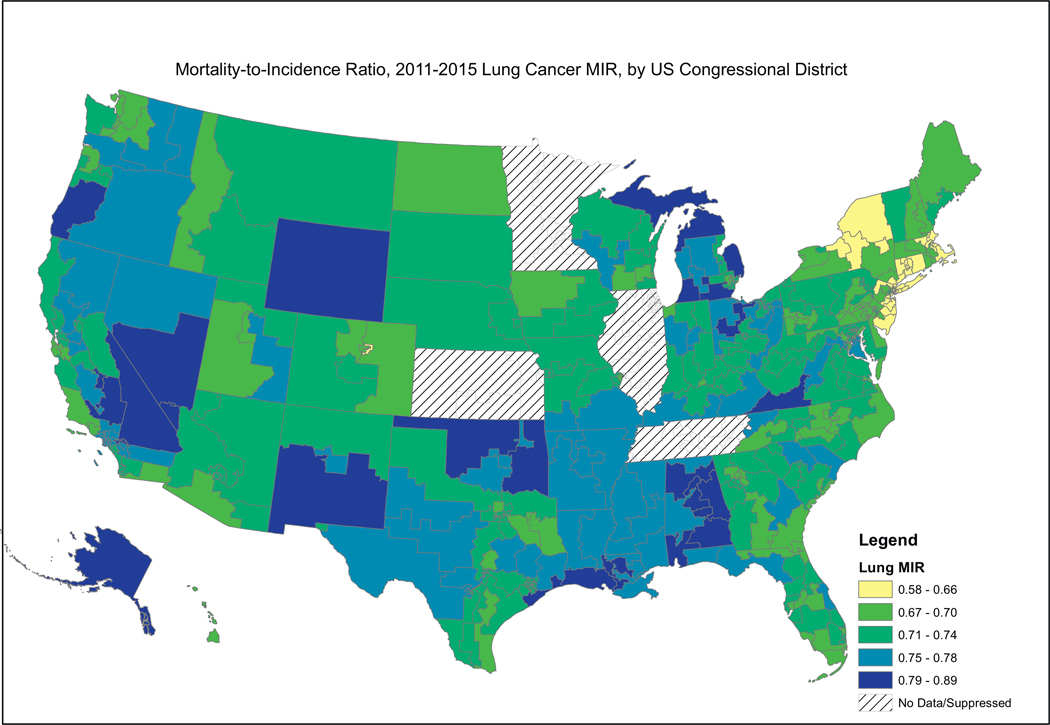
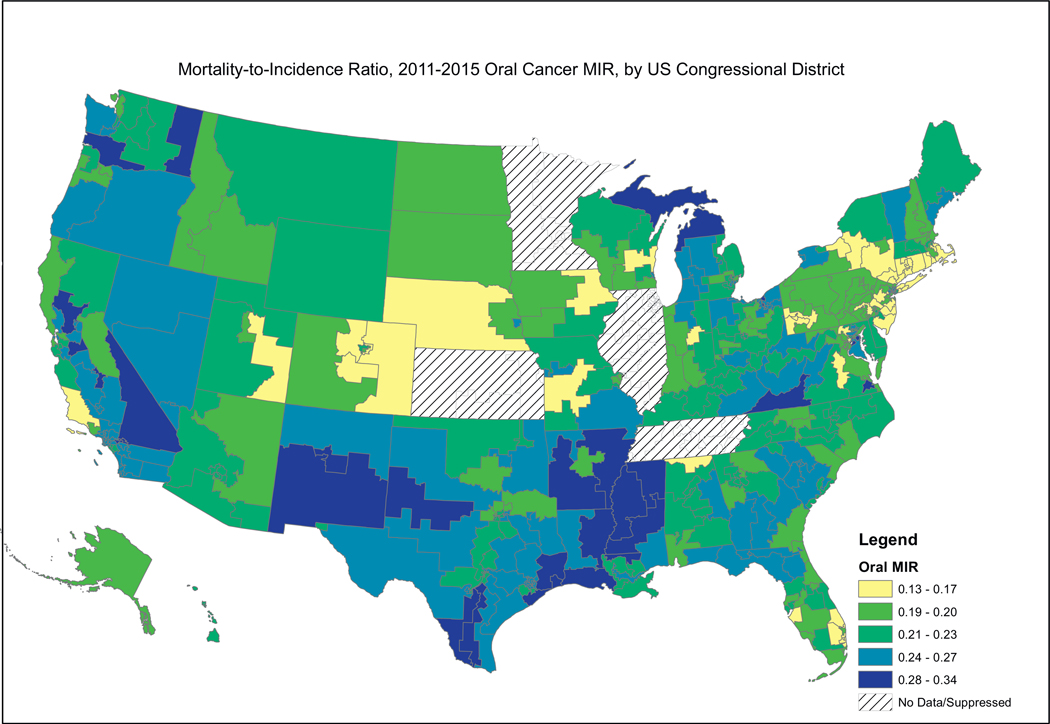
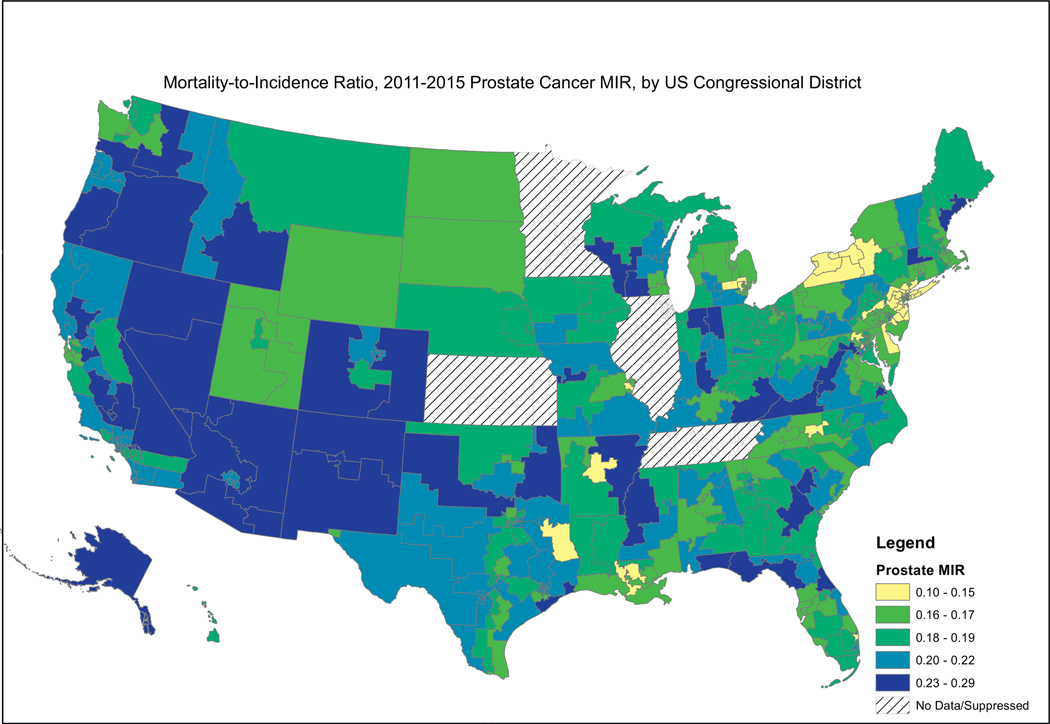
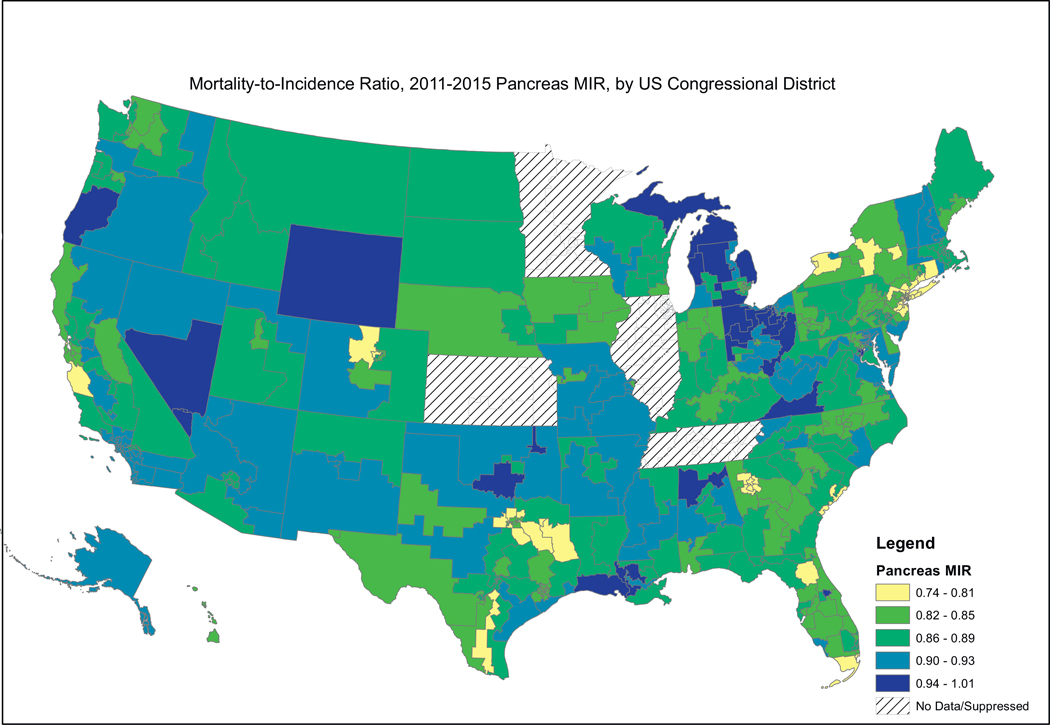
We then mapped these MIR values by congressional district for the entire U.S. A color-coded classification method called “natural breaks” was used to distinguish districts with similar values. This method categorizes MIR values according to the data’s inherent natural groupings (e.g., minimizes within-group and maximizes between-group differences for each cancer type). Because the data distribution and subsequent groupings differ across cancer types, the maps for each cancer type should be interpreted independently and not compared to each other. The method decreases the likelihood of falsely grouping dissimilar districts together by empirically determining the best-fitting groupings. All of the maps use the same color scheme. US congressional districts with the lowest MIRs are depicted in yellow. Those with the next lowest MIRs are depicted in light green. Those congressional districts with intermediate (i.e. around the median) MIRs are shown in dark green. Those congressional districts with the 2nd to the highest MIRs are depicted by light blue, while those with the highest MIRs are depicted by dark blue. Areas of the country with no data or suppressed data (including all of Illinois, Kansas, and Minnesota) are indicated by crosshatching. All maps were developed using ArcGIS® 10.1 software.
We also examined the MIRs by U.S. Census Divisions (n = 9, nested within 4 regions), Medicaid expansion status, and sociodemographic composition. Medicaid expansion status was obtained from the Kaiser Family Foundation and is indicative of the expansion status at the time of this analysis (Kaiser Family Foundation, 2019). We obtained congressional district-level sociodemographic data (% of residents living in rural areas, % non-Hispanic Black, and % Hispanic) from the U.S. Census Bureau (US Census Bureau, 2019). We examined race-specific MIRs overall for cancer types where <33% of congressional districts’ data were suppressed due to too few cases or deaths (i.e., <16 cases/deaths within a congressional district). We performed Analysis of Variance (ANOVA) to examine mean MIRs by Census Division, calculated t-tests to examine mean MIR by race and by Medicaid expansion status, and calculated Pearson’s correlation coefficients to examine the association between MIR and sociodemographic characteristics. We also performed a post-hoc analysis using Tukey’s test to examine which mean MIRs by census division were significantly different than one another. All analyses were performed in SAS® 9.4. Data from the CDC are suppressed when small numbers could lead to unstable estimation of incidence or mortality rates, which occurred for some race-specific rates. Thus, race-specific analyses were performed only for cancer types in which the data were suppressed for <33% of congressional districts.
3. Results
Fig. 1 presents the MIR for all cancers combined. Maps revealed that congressional districts in the South and Midwest, particularly the East South Central Census Division including MS, AL, and KY, had higher MIR values (where dark and light blue indicate worst survival) for all cancer types combined, indicating that individuals in these districts died at a higher rate given a cancer diagnosis than those for the country as a whole. Districts within CT, NY, NJ, CA, NV, and the upper Midwest had the lowest MIR values (where yellow to light green indicate best survival); i.e., had better survival given cancer diagnosis. Those areas that have the highest MIRs tend to be in the South and Appalachia and a band west of the Rocky Mountains.
Fig. 1.
Depiction of the Mortality-to-Incidence Ratio by US Congressional District for All Cancers Combined
Fig. 2, showing female breast cancer MIRs, reveals a similar pattern, where the higher MIRs are concentrated in the South, including the Mississippi Valley, Appalachia, and the southern portion west of the Rocky Mountains. Fig. 3, showing cervical cancer MIRs, reveals high MIRs in the South and Appalachia, Southern Missouri, Western New York, Arizona, Northern California and Western Oregon. Fig. 4, depicting colorectal cancer MIRs, shows a more scattered pattern, with the worst (dark blue) MIRs in Western Oregon, Southern Nevada, New Mexico, Eastern Oklahoma, North Central South Carolina, Eastern Maryland, Southeastern Michigan, Eastern Arkansas, Eastern Virginia and Southeastern Texas. Fig. 5 shows that the highest esophageal cancer MIRs are located in areas not previously observed, within a band extending from Northeastern North Carolina through the Great Lakes, the Western Rockies, Northeastern California, Wyoming and South Dakota. Fig. 6, depicting MIRs for lung cancer, also reveals the lowest rates on the East Coast and high rates in Wyoming, Nevada, Southeastern California, Western Oregon, Southern New Mexico, Oklahoma Northern Michigan, Alabama and the Gulf Coast. Fig. 7, depicting oral cancer, shows a pattern similar to less virulent cancers, with the highest MIRs in the South and Appalachia; but high rates also are seen in the Western Rockies, New Mexico, and portions of Southern California and the Pacific Northwest. Fig 8, depicting pancreatic cancer, shows pockets of high MIRs in the West, South, Appalachia and Michigan and Ohio. Fig 9 shows that prostate cancer MIRs tend to be higher in the West in general; although there is considerable variability in rates across the country, with high MIRs in parts of the South, Appalachia, Maine, and parts of the Midwest.
Fig. 2.
Depiction of the Mortality-to-Incidence Ratio by US Congressional District for Breast Cancer
Fig. 3.
Depiction of the Mortality-to-Incidence Ratio by US Congressional District for Cervical Cancer
Fig. 4.
Depiction of the Mortality-to-Incidence Ratio by US Congressional District for Cervical Cancer
Fig. 5.
Depiction of the Mortality-to-Incidence Ratio by US Congressional District for Cervical Cancer
Fig. 6.
Depiction of the Mortality-to-Incidence Ratio by US Congressional District for Cervical Cancer
Fig. 7.
Depiction of the Mortality-to-Incidence Ratio by US Congressional District for Cervical Cancer
Fig. 8.
Depiction of the Mortality-to-Incidence Ratio by US Congressional District for Cervical Cancer
Fig. 9.
Depiction of the Mortality-to-Incidence Ratio by US Congressional District for Cervical Cancer
Table 1, showing the mean MIR by U.S. Census Division, parallels the data presented in Figs. 1–9 within each congressional district. Specifically, districts within New England and the Middle Atlantic states had fairly consistently lower MIRs for all cancer types combined and for all of the individual cancer sites, including the most deadly among these cancers. Post-hoc analysis shows that the East South Central Division had significantly higher MIRs than six of the other division, with the highest magnitude difference being with the New England congressional districts. Similar patterns were seen for cervical and lung cancers. For colorectal and prostate cancers MIRs tended to be elevated in the Mountain Census Division relative to other Divisions. Female breast cancer and oral cancer MIRs were higher in congressional districts in the West South Central Division compared to other Divisions. For pancreas cancer, there was less variability in MIRs across Census Divisions, though the Middle Atlantic Division had lower MIRs than other Divisions.
Table 1.
Mean mortality-to-incidence ratio by U.S. Census Division.
| Northeast | Midwest | South | West | |||||||
|---|---|---|---|---|---|---|---|---|---|---|
| New England Mean (SD) (n=21 districts) | Middle Atlantic Mean (SD) (n=57 districts) | East nNorth cCentral Mean (SD) (n=65 districts)a | West nNorth cCentral Mean (SD) (n=29 districts)a | South Atlantic Mean (SD) (n=85 Districts) | East sSouth cCentral Mean (SD) (n=26 districts) | West sSouth cCentral Mean (SD) (n=51 districts) | Mountain Mean (SD) (n=31 districts) | Pacific Mean (SD) (n=71 districts) | P-value | |
| Overall | 0.34 (0.02) | 0.33 (0.02) | 0.38 (0.02) | 0.37 (0.03) | 0.37 (0.03) | 0.40 (0.02) | 0.39 (0.03) | 0.36 (0.04) | 0.36 (0.02) | <0.001 |
| Breast (female) | 0.14 (0.01) | 0.16 (0.02) | 0.17 (0.02) | 0.16 (0.02) | 0.17 (0.02) | 0.18 (0.02) | 0.18 (0.02) | 0.17 (0.02) | 0.16 (0.02) | <0.001 |
| Cervix | 0.25 (0.05) | 0.30 (0.04) | 0.30 (0.05) | 0.30 (0.06) | 0.31 (0.04) | 0.35 (0.06) | 0.32 (0.05) | 0.30 (0.05) | 0.30 (0.05) | <0.001 |
| Colorectal | 0.34 (0.03) | 0.35 (0.02) | 0.38 (0.02) | 0.36 (0.02) | 0.37 (0.03) | 0.38 (0.03) | 0.38 (0.02) | 0.39 (0.03) | 0.37 (0.02) | <0.001 |
| Esophagus | 0.83 (0.06) | 0.86 (0.09) | 0.94 (0.06) | 0.92 (0.09) | 0.87 (0.07) | 0.88 (0.08) | 0.86 (0.08) | 0.92 (0.07) | 0.90 (0.07) | <0.001 |
| Lung | 0.66 (0.04) | 0.67 (0.04) | 0.74 (0.03) | 0.72 (0.02) | 0.72 (0.03) | 0.76 (0.03) | 0.74 (0.03) | 0.73 (0.05) | 0.74 (0.04) | <0.001 |
| Oral | 0.19 (0.03) | 0.19 (0.03) | 0.22 (0.03) | 0.20 (0.03) | 0.21 (0.03) | 0.23 (0.04) | 0.24 (0.03) | 0.21 (0.03) | 0.24 (0.03) | <0.001 |
| Pancreas | 0.87 (0.05) | 0.82 (0.03) | 0.90 (0.05) | 0.87 (0.04) | 0.86 (0.04) | 0.89 (0.04) | 0.87 (0.05) | 0.88 (0.04) | 0.88 (0.04) | <0.001 |
| Prostate | 0.18 (0.02) | 0.15 (0.02) | 0.19 (0.03) | 0.18 (0.02) | 0.18 (0.03) | 0.18 (0.03) | 0.19 (0.03) | 0.21 (0.03) | 0.20 (0.03) | <0.001 |
East north central = 47 districts and west north central = 25 districts for cancer-specific MIRs due to data suppression.
Looking at simple racial comparisons (Table 2) we found that MIRs were higher for Black [female] breast cancers [0.23 Black vs. 0.16 White; p < .001 based on independent t-test]. However, we found that Black individuals had lower MIRs for all cancer types combined [0.41 Black vs. 0.43 White; p < .001] and for lung cancer [0.73 Black vs. 0.85 White; p < .001]. All other cancer sites had ≥33% data suppressed (esophagus, cervix, prostate or pancreas) or there was no significant difference by race (colorectal cancer). We performed a post-hoc analysis to examine racial differences in MIRs in the South Census Region, comprised of the South Atlantic, East South Central, and West South Central Divisions, where data are more complete for most cancers across racial groups (i.e. where there are higher proportions of Black residents). We found that MIRs were higher among Black residents than White residents for breast, cervical, prostate, and oral cancers; MIRs were marginally higher among White residents for all cancers combined as well as colorectal and lung cancers. Further, there was no significant difference in esophagus or pancreas cancer MIRs between Black and White residents in the South Census Region.
Table 2.
Mean mortality-to-incidence ratio by race.
| White Mean (SD) | Black Mean (SD) | P-valuea | |
|---|---|---|---|
| Breast (female) | 0.16 (0.02) | 0.23 (0.04) | <0.001 |
| Cervix | b | b | b |
| Colorectal | 0.43 (0.04) | 0.44 (0.08) | 0.40 |
| Esophagus | b | b | b |
| Lung | 0.85 (0.08) | 0.73 (0.10) | <0.001 |
| Oral | b | b | b |
| Pancreas | b | b | b |
| Prostate | b | b | b |
Independent t-test.
Not reported due to at least 33% of districts with suppressed data.
Table 3 compares MIRs in states that have not expanded Medicaid versus those that have. In general, MIRs are lower in states that expanded Medicaid, consistent with our previous investigation (Choi et al., 2015). However, cancers of the esophagus and pancreas, the two most deadly cancers of those that we considered, have MIRs that are higher in Medicaid expansion states than in non-expansion states. There were no differences for oral or prostate cancer.
Table 3.
Mean mortality-to-incidence ratio by Medicaid expansion status.
| Districts in expansion states (n = 291 districts) Mean (SD) | Districts in non-expansion states (n = 144 districts) Mean (SD) | P-value | |
|---|---|---|---|
| All | 0.36 (0.03) | 0.38 (0.03) | <0.001 |
| Colorectala | 0.37 (0.03) | 0.38 (0.03) | 0.002 |
| Esophagusa | 0.89 (0.08) | 0.86 (0.08) | <0.001 |
| Cervicala | 0.30 (0.05) | 0.32 (0.05) | 0.001 |
| Breast (female)a | 0.17 (0.02) | 0.18 (0.02) | <0.001 |
| Lunga | 0.72 (0.05) | 0.73 (0.05) | 0.003 |
| Orala | 0.22 (0.04) | 0.22 (0.03) | 0.14 |
| Pancreasa | 0.87 (0.05)b | 0.86 (0.05) | 0.05 |
| Prostatea | 0.18 (0.03)c | 0.19 (0.03)d | 0.28 |
Includes 265 expansion state districts and 140 non-expansion districts due to data suppression.
Based on analysis of variance.
Includes 247 and 261 expansion state districts for white and black, respectively and 140 non-expansion districts for both black and white MIRs due to data suppression.
Includes 247 and 231 expansion state districts for white and black, respectively and 140 and 133 non-expansion districts for white and black, respectively, due to data suppression.
Table 4 provides the correlation coefficients between district-level MIRs and the percent rural, percent non-Hispanic Black, and percent Hispanic. A moderate, statistically significant correlation between the MIR for all cancer types combined and rurality was observed (r = 0.47). For individual cancer types, the highest and lowest correlation for rurality was for lung cancer (0.31) and oral cancer (0.04), respectively. We also observed a positive, significant correlation between the MIR for all cancer types combined and percent non-Hispanic Black residents in the district. The correlations with percent non-Hispanic Black were highest for cervical and breast cancer. Correlations with percent Hispanic residents in the district were highly variable (i.e., with no consistent patterns observed).
Table 4.
Pearson correlation coefficients between mortality-to-incidence ratio and rural and racial/ethnic composition.
| % Rural | % Non-Hispanic Black | % Hispanic | |
|---|---|---|---|
| All | 0.47*** | 0.15** | −0.08 |
| Breast (female)a | 0.17** | 0.36*** | 0.14** |
| Cervicala | 0.10 | 0.30*** | −0.02 |
| Colorectala | 0.23*** | 0.21*** | −0.002 |
| Esophagusa | 0.22*** | −0.14* | −0.15** |
| Lunga | 0.31*** | 0.009 | 0.04 |
| Orala | 0.04 | 0.21*** | 0.25*** |
| Pancreasa | 0.28*** | −0.13* | −0.08 |
| Prostatea | 0.16** | −0.06 | 0.18*** |
Includes 405 congressional districts due to data suppression.
p < .05.
p < .01.
p < .001.
4. Discussion
The availability of cancer incidence and mortality data by U.S congressional district allowed us to examine MIRs stratified by this policy-relevant geopolitical unit for the first time. Generally speaking, there were striking differences in MIRs across the country, with higher MIRs in the South and in other pockets such as Appalachia and the region just west of the Rocky Mountains, not including most of the West Coast. These data provide important information for policy makers about opportunities to further examine the determinants of these mortality (relative to incidence) differentials and to explore potential interventions to reduce cancer burden in areas with high relative mortality, given the underlying incidence of disease.
While we cannot infer causality from these analysis, we note that the strongest correlation identified in our study was between the % of the congressional district that lives in a rural area and MIR. Recent studies have shown that rural populations have both higher mortality and incidence rates compared to their urban counterparts (Blake et al., 2017; Henley et al., 2017; Zahnd et al., 2018). So, high MIRs are particularly concerning given that these populations often start out with higher incidence. Further, additional studies have shown that higher mortality rates cluster in the South, which has a large population of rural minorities (Mokdad et al., 2017; Zahnd et al., 2017). Results of these descriptive analyses are consistent with those we have seen previously; i.e., elevated county- and state-level MIRs in the South and in more rural areas (Adams et al., 2015a, 2015b; Babatunde et al., 2016; Hebert et al., 2009; Odahowski et al., 2018; Wagner et al., 2012). In addition to the high cancer burden, rural areas have low access to cancer screening and cancer specialists (Aboagye et al., 2014; Eberth et al., 2018). Congressional district-level maps may help inform public policies and related funding to improve access to early cancer detection, with concomitant downstaging of disease (i.e., detection earlier in disease course), and timely treatment in vulnerable populations. For some cancers such as colorectal (Xirasagar et al., 2015) and oral (Gupta et al., 1999), screening allows for removal of precancerous lesions. With ratios of 50 to 200 precancerous lesions for every cancer detected these screening modalities are powerful methods of primary prevention. Further research also can provide additional important information to help identify areas of greatest need for expansion of health care services including for different kinds of cancer screening and related programming (e.g., recruitment of providers for the National Breast and Cervical Cancer Early Detection Program).
Results based on Medicaid expansion also are consistent with what we have observed previously with respect to availability of services and probability of dying of a particular cancer (S. A. Adams et al., 2016; Choi et al., 2015). Based on that prior work, we know that disparities in cancer screening already disfavor states with high cancer rates (Adams et al., 2016; Choi et al., 2015). These disparities in states that have refused Medicaid expansion threaten to widen unless significant efforts are mounted to ensure their residents obtain preventive health care and, subsequently, high-quality cancer treatment. Primary prevention, including via screening modalities such as colonoscopy, is important because it will lower overall burden of disease by reducing the total number of incident cases. Reducing incidence, as opposed to downstaging (detecting earlier in disease course), will have little influence on the MIR. Of course, this is complicated by the fact that some cancers, such as prostate, tend to be indolent – with the consequence that early detection would result in lead-time bias.
The MIR is dependent on factors that influence the probability of dying once individuals have a cancer, including poor access to and receipt of appropriate and timely cancer treatment. Because the MIR is dependent on incidence it is influenced by factors that allow for detecting the cancer earlier in the disease course and increase effectiveness of care including, but not exclusively, due to downstaging. Experience from Massachusetts, which instituted the Massachusetts Healthcare Reform Law in 2006 shows a significant decrease in mortality among vascular surgery patients (Eslami et al., 2018). This kind of specialist care also could improve survivorship among cancer patients. Indeed, we have seen similar results for surgical care for cancer after Medicaid expansion, with specific improvements in disparities. (Xiao et al., 2018) Besides specialist care, there are indications that insurance expansion also will improve community cancer care (Angier et al., 2017). Effects observed further upstream in terms of improved cancer screening and concomitant downstaging of disease may improve the MIR if fewer patients are diagnosed at later stages of disease when prognosis is generally poor (Gan et al., 2019; Soni et al., 2018; Zerhouni et al., 2019). States rejecting Medicaid expansion tend to suffer from both lower-quality/less-intensive screening and less specialist care (Zerhouni et al., 2019).
Results showing a positive correlation between the MIR and percent of Black residents in the district underline the importance of race as a possible social determinant of cancer survival. Although we cannot infer a causal association due to the ecologic nature of the data, our findings lay the groundwork for future research on the association between race, place, and health outcomes using more rigorous methods. We and others have documented striking racial disparities in cancer rates that especially disproportionately burden Black residents in the South (Adams et al., 2006, 2009, 2012; Alberg et al., 2006; Babatunde et al., 2016; Brandt et al., 2006; Cavicchia et al., 2012; Daguise et al., 2006; Drake et al., 2006; Esnaola and Ford, 2012; Hebert et al., 2006a, 2006b, 2009; Peres et al., 2017; Samson et al., 2016; Smith et al., 2008; Tong et al., 2015; Wagner et al., 2012; Yen et al., 2006). Looking at the pattern of MIRs nationally, however, we observed departures from the pattern observed in the South. Most striking was that there were an inverse correlations between % Non-Hispanic Black population composition and MIRs for the two most fatal of all cancer sites – esophagus and pancreas.
Future work should focus on differences in grade and stage of disease by race across different geographic regions, especially in light of the observation that Blacks often present with more virulent disease (Krok-Schoen et al., 2016; Laryea et al., 2014; Siegel et al., 2018; Tammana and Laiyemo, 2014; Wagner et al., 2012) including esophageal and pancreatic cancers.(Cronin et al., 2018; Gold and Goldin, 1998; Lowenfels and Maisonneuve, 2002). Further, as additional years of post-Affordable Care Act data accumulate to minimize the occurrence of unstable rate estimates/data suppression, the dynamic of race and Medicaid expansion status should be explored further, In the meantime, however, we should remain mindful of work by Zerhouni et al highlighting the relevance of Medicaid expansion in helping to reduce overall cancer disparities (Zerhouni et al., 2019).
As with other work based on MIRs (Adams et al., 2015a, 2015b; Babatunde et al., 2016; Choi et al., 2015; Hebert et al., 2009; Odahowski et al., 2018; Sunkara and Hebert, 2016a, 2016b; Wagner et al., 2012), these finding can help guide dissemination and implementation research focused on cancer prevention and control (Wheeler and Basch, 2017). Many of these cancers have known modifiable risk factors and there are evidence-based interventions that can be applied in many populations. Future work also could include targeting the cancer care continuum ranging from age- and other factor-appropriate screening to, especially, post-diagnosis care. It also is true that not all such interventions are tested for use in rural and minority populations (Wheeler and Davis, 2017); so, that issue needs to be addressed irrespective of our specific findings.
It is worth noting that other investigations have compared the MIR to 1-surival functions and found the MIR to have variable accuracy with the survival function, dependent upon cancer type (Ellis et al., 2019). We do not dispute that modeling survival data is the most accurate method available to ascertain true, absolute survival rates; however, we must point out that the data needed for survival calculations is not publicly available for our entire nation. All US cancer registries report to either SEER or the National Program of Cancer Registries (NPCR). SEER makes survival variables publicly available for all its cancer cases; however, NPCR does not have the capacity to do this. As SEER covers only about a third of the cancer population in the newest, most expansive version (Duggan et al., 2016), we are not able to run survival models on the vast majority of cancer cases. Hence, the MIR has enhanced utility as it is the only methodology practically available to compare cancer mortality accounting for cancer incidence. By virtue of the limitations listed by others, the MIR should not be taken as an absolute measure of survival; however, it provides a useful statistic to make geographic and demographic comparisons as we have done here.
This study is not without limitations. First, for all analyses, there were no data for three Midwestern states, which includes 30 congressional districts (7% of all districts in the U.S.). Additionally, due to limited availability of race-specific data for individual cancer types due to data suppression, we were unable to fully explore racial differences by congressional district across the United States. It also should be noted that racial comparisons do not generalize nationwide, as racial/ethnic subgroups are not uniformly distributed across states or districts. Further, as with any spatial analysis, we must be cognizant of the modifiable areal unit problem and zoning effects, where MIR values may vary dependent upon where the boundaries are drawn (Wong, 2009). This problem is particularly salient with congressional districts whose boundaries are not derived independently or objectively. Despites these weakness, this study has several strengths. It is the first to examine MIR by congressional district, as previous studies had examined mortality rates alone (Hao et al., 2006; Siegel et al., 2015). Second, this paper displays policy-relevant maps, which can be helpful tools to inform the public and policymakers alike (Bell et al., 2006). Finally, although more work needs to be done to verify its relationship with 1-survival (Cordero-Morales et al., 2016; Ellis et al., 2019), the MIR has been shown to be a good proxy where it is cumbersome, difficult, expensive or impossible to compute survival (J.R. Hebert et al., 2009; Odahowski et al., 2018; Sunkara and Hebert, 2015, 2016a, 2016b). Although some work has been done to examine the relationship between MIR values and 1-survival (Odahowski et al., 2018), research should explore the relationship between MIR and 1-survival for various cancer types.
In summary, our results confirmed previous findings regarding rurality, showing that populations with larger rural constituencies had higher MIRs than their counterparts. These results also confirm what we demonstrated earlier regarding higher MIRs in states without Medicaid expansion (Adams et al., 2016; Choi et al., 2015). Moreover, lack of health insurance is a major underlying and modifiable risk factor. While studies have shown the advantages of Medicaid expansion for a variety of health outcomes, expansion alone will not ensure full and high-quality coverage for all residents, particularly given the prevalence of high-deductible and “junk insurance” plans (Mazurenko et al., 2019; Zhao et al., 2019;Zheng et al., 2019a, 2019b). That is, states that have rejected Medicaid expansion start out from a worse position in terms of cancer mortality given incidence. It also is important to note that some results were inconsistent with other studies, especially the lack of consistently lower MIRs in Whites. Additional work is needed to examine these race-specific MIRs across regions rather than aggregated nationally. Future work should also move beyond descriptive studies toward meaningful use of the MIR to inform dissemination and implementation research and health policy efforts. As a final note, this work also highlights the need for one central cancer registry system with common data elements which are publicly available or at least available through a standardized requesting process that does not require membership fees in order to be considered.
5. Conclusions
Using newly available data based on U.S. congressional districts we found significant differences in MIRs according to region, race and Medicaid expansion. In general, Blacks have higher MIRs than Whites, rural areas have higher rates than urban and suburban districts, and congressional districts in states that have refused Medicaid expansion have higher rates than those of states that have adopted Medicaid expansion. Future work should include monitoring MIRs in relation to demographic trends and changes in health care financing and utilization.
Acknowledgments
Funding was provided by the Centers for Disease Control and Prevention under the Prevention Research Centers through Special Interest Project Cancer Prevention and Control Research Networks #3 U48 DP005000–01S2 to the University of South Carolina at Columbia (JRH, JME, WEZ, SAA, DBF) and #3 U48 DP005017–01S8 to the University of North Carolina Chapel Hill (SBW).
Publication of this supplement was supported by the Cancer Prevention and Control Network (CPCRN), University of North Carolina at Chapel Hill and the following co-funders: Case Western Reserve University, Oregon Health & Science University, University of South Carolina, University of Iowa, University of Kentucky, University of Pennsylvania and University of Washington.
References
- Aboagye JK, Kaiser HE, Hayanga AJ, 2014. Rural-urban differences in access to specialist providers of colorectal cancer care in the United States: a physician workforce issue. JAMA Surg 149 (6), 537–543. 10.1001/jamasurg.2013.5062. [DOI] [PubMed] [Google Scholar]
- Adams SA, Hebert JR, Bolick-Aldrich S, Daguise VG, Mosley CM, Modayil MV, ... Brandt HM, 2006. Breast cancer disparities in South Carolina: early detection, special programs, and descriptive epidemiology. J SC Med Assoc 102, 231–239. [PMC free article] [PubMed] [Google Scholar]
- Adams SA, Fleming A, Brandt HM, Hurley DM, Bolick-Aldrich S, Bond S, Hebert JR, 2009. Racial disparities in cervical cancer mortality in an African American and European American cohort in South Carolina. J SC Med Assoc 105 (7), 237. [PMC free article] [PubMed] [Google Scholar]
- Adams SA, Butler WM, Fulton J, Heiney SP, Williams EM, Delage AF, Hebert JR, 2012. Racial disparities in breast cancer mortality in a multiethnic cohort in the southeast. Cancer 118 (10), 2693–2699. 10.1002/cncr.26570. [DOI] [PMC free article] [PubMed] [Google Scholar]
- Adams SA, Choi SK, Eberth JM, Friedman DB, Yip MP, Tucker-Seeley RD, Hebert JR, 2015a. Is availability of mammography Services at Federally Qualified Health Centers Associated with breast Cancer mortality-to-incidence ratios? An ecological analysis. J. Women’s Health 24 (11), 916–923. 10.1089/jwh.2014.5114. [DOI] [PMC free article] [PubMed] [Google Scholar]
- Adams SA, Choi SK, Khang L, D AC, Friedman DB, Eberth JM, … Hebert JR (2015b). Decreased cancer mortality-to-incidence ratios with increased accessibility of federally qualified health centers. J. Community Health, 40(4), 633–641. doi: 10.1007/s10900-014-9978-8. [DOI] [PMC free article] [PubMed] [Google Scholar]
- Adams SA, Choi SK, Eberth JM, Brandt HM, Friedman DB, Hebert JR, 2016. Adams et al. respond to: Medicaid expansion Medicaid coverage expansion and implications for Cancer disparities. Am. J. Public Health 106 (6), e8–e9. 10.2105/ajph.2016.303231. [DOI] [PMC free article] [PubMed] [Google Scholar]
- Alberg AJ, Horner MJD, Daguise VG, Carpenter MJ, Mosley CM, Vincent B, … Hebert JR (2006). Lung and bronchus cancer disparities in South Carolina epidemiology and strategies for prevention. J SC Med Assoc, 102, 183–191. [PubMed] [Google Scholar]
- Angier H, Huguet N, Marino M, Mori M, Winters-Stone K, Shannon J, DeVoe JE, 2017. Assessing community cancer care after insurance ExpanSionS (ACCESS) study protocol. Contemporary Clinical Trials Communications 7, 136–140. 10.1016/j.conctc.2017.06.011. [DOI] [PMC free article] [PubMed] [Google Scholar]
- Babatunde OA, Adams SA, Eberth JM, Wirth MD, Choi SK, Hebert JR, 2016. Racial disparities in endometrial cancer mortality-to-incidence ratios among blacks and whites in South Carolina. Cancer Causes Control 27 (4), 503–511. 10.1007/s10552-016-0724-7. [DOI] [PubMed] [Google Scholar]
- Bell BS, Hoskins RE, Pickle LW, Wartenberg D, 2006. Current practices in spatial analysis of cancer data: mapping health statistics to inform policymakers and the public. Int. J. Health Geogr. 5, 49 10.1186/1476-072x-5-49. [DOI] [PMC free article] [PubMed] [Google Scholar]
- Blake KD, Moss JL, Gaysynsky A, Srinivasan S, Croyle RT, 2017. Making the case for investment in rural cancer control: an analysis of rural cancer incidence, mortality, and funding trends. Cancer Epidemiol. Biomarkers Prev. 26 (7), 992–997. 10.1158/1055-9965.EPI-17-0092. [DOI] [PMC free article] [PubMed] [Google Scholar]
- Brandt HM, Modayil MV, Hurley D, Pirisi-Creek LA, Johnson MG, Davis J, … Hebert JR (2006). Cervical cancer disparities in South Carolina: an update of early detection, special programs, descriptive epidemiology, and emerging directions. J SC Med Assoc, 102(6), 223–230. [PubMed] [Google Scholar]
- Cavicchia PP, Adams SA, Steck SE, Hussey JR, Liu J, Daguise VG, Hebert JR, 2012. Racial disparities in colorectal cancer incidence by type 2 diabetes mellitus status. Cancer Causes Control 24 (2), 277–285. 10.1007/s10552-012-0095-7. [DOI] [PMC free article] [PubMed] [Google Scholar]
- Choi SK, Adams SA, Eberth JM, Brandt HM, Friedman DB, Tucker-Seeley RD, Hebert JR, 2015. Medicaid coverage expansion and implications for cancer disparities. Am. J. Public Health 105 (Suppl. 5), S706–S712. 10.2105/ajph.2015.302876. [DOI] [PMC free article] [PubMed] [Google Scholar]
- Cordero-Morales A, Savitzky M, Stenning-Persivale K, Segura1 E, 2016. Conceptual considerations and methodological recommendations for the use of the mortality-to-incidence ratio in time-lagged ecological-level analysis for public health systems-oriented cancer research. Cancer 122 (3), 486–487. 10.1002/cncr.29747. [DOI] [PubMed] [Google Scholar]
- Cronin KA, Lake AJ, Scott S, Sherman RL, Noone AM, Howlader N, Jemal A, 2018. Annual report to the nation on the status of cancer, part I: national cancer statistics. Cancer 124 (13), 2785–2800. 10.1002/cncr.31551. [DOI] [PMC free article] [PubMed] [Google Scholar]
- Daguise VG, Burch JB, Horner MJD, Mosley C, Hofseth LJ, Wargovich MJ, … Hebert JR (2006). Colorectal cancer disparities in South Carolina: descriptive epidemiology, screening, special programs, and future direction. J SC Med Assoc, 102, 212–220. [PubMed] [Google Scholar]
- Drake BF, Keane TE, Mosley CM, Adams SA, Elder KT, Modayil MV, … Hebert JR (2006). Prostate cancer disparities in South Carolina: early detection, special programs, and descriptive epidemiology. J SC Med Assoc, 102, 241–249. [PubMed] [Google Scholar]
- Duggan MA, Anderson WF, Altekruse S, Penberthy L, Sherman ME, 2016. The surveillance, epidemiology, and end results (SEER) program and pathology: toward strengthening the critical relationship. Am. J. Surg. Pathol. 40 (12), e94–e102. 10.1097/pas.0000000000000749. [DOI] [PMC free article] [PubMed] [Google Scholar]
- Eberth JM, Bozorgi P, Lebron LM, Bills SE, Hazlett LJ, Carlos RC, King JC, 2018. Geographic availability of low-dose computed tomography for lung cancer screening in the United States, 2017. Prev. Chronic Dis. 15, E119 10.5888/pcd15.180241. [DOI] [PMC free article] [PubMed] [Google Scholar]
- Ellis L, Belot A, Rachet B, Coleman MP, 2019. The mortality-to-incidence ratio is not a valid proxy for cancer survival. Journal of Global Oncology (5), 1–9. 10.1200/JGO.19.00038. [DOI] [PMC free article] [PubMed] [Google Scholar]
- Eslami MH, Reitz KM, Rybin DV, Doros G, Farber A, 2018. Improved access to health care in Massachusetts after 2006 Massachusetts healthcare reform law is associated with a significant decrease in mortality among vascular surgery patients. J. Vasc. Surg. 68 (4), 1193–1202.e1191. 10.1016/j.jvs.2017.12.066. [DOI] [PMC free article] [PubMed] [Google Scholar]
- Esnaola NF, & Ford ME (2012). Racial differences and disparities in cancer care and outcomes: where’s the rub? Surg Oncol Clini North America, 21(3), 417–437, viii. doi: 10.1016/j.soc.2012.03.012. [DOI] [PMC free article] [PubMed] [Google Scholar]
- Gan T, Sinner HF, Walling SC, Chen Q, Huang B, Tucker TC, … Bhakta AS (2019). Impact of the affordable care act on colorectal cancer screening, incidence, and survival in Kentucky. J. Am. Coll. Surg, 228(4), 342–353.e341. doi: 10.1016/j.jamcollsurg.2018.12.035. [DOI] [PMC free article] [PubMed] [Google Scholar]
- Gold EB, Goldin SB, 1998. Epidemiology of and risk factors for pancreatic cancer. Surg. Oncol. Clin. N. Am. 7 (1), 67–91. [PubMed] [Google Scholar]
- Gupta PC, Hebert JR, Bhonsle RB, Murti PR, Mehta H, Mehta FS, 1999. Influence of dietary factors on oral precancerous lesions in a population-based case-control study in Kerala, India. Cancer 85 (9), 1885–1893. [DOI] [PubMed] [Google Scholar]
- Hao Y, Ward EM, Jemal A, Pickle LW, Thun MJ, 2006. U.S. congressional district cancer death rates. Int. J. Health Geogr. 5, 28 10.1186/1476-072x-5-28. [DOI] [PMC free article] [PubMed] [Google Scholar]
- Hebert JR, Adams SA, Daguise VG, Hurley D, Smith EW, Purdon C, … Reed CE (2006a). Esophageal cancer disparities in South Carolina: early detection, special programs, and descriptive epidemiology. J SC Med Assoc, 102, 201–209. [PubMed] [Google Scholar]
- Hebert JR, Elder K, Ureda JR, 2006b. Meeting the challenges of cancer prevention and control in South Carolina: focus on seven cancer sites, engaging partners. J SC Med Assoc 102, 177–182. [PubMed] [Google Scholar]
- Hebert JR, Daguise VG, Hurley DM, Wilkerson RC, Mosley C, Adams SA, Bolick-Aldrich S, 2009. Mapping cancer mortality-to-incidence ratios to illustrate racial and gender disparities in a high-risk population. Cancer 115 (11), 2539–2552. [DOI] [PMC free article] [PubMed] [Google Scholar]
- Henley SJ, Anderson RN, Thomas CC, Massetti GM, Peaker B, Richardson LC, 2017. Invasive cancer incidence, 2004–2013, and deaths, 2006–2015, in nonmetropolitan and metropolitan counties - United States. Morbidity and Mortality Weekly Report. Surveillance Summaries 66 (14), 1–13. 10.15585/mmwr.ss6614a1. [DOI] [PMC free article] [PubMed] [Google Scholar]
- Number of persons by race and Hispanic ethnicity for SEER participants (2010. census data). Retrieved from. https://seer.cancer.gov/registries/data.html.
- Kaiser Family Foundation, 2019. Status of State Medicaid Expansion Decisions: Interactive Map. Retrieved from. https://www.kff.org/medicaid/issue-brief/status-of-state-medicaid-expansion-decisions-interactive-map/.
- Krok-Schoen JL, Fisher JL, Baltic RD, Paskett ED, 2016. White-black differences in cancer incidence, stage at diagnosis, and survival among adults aged 85 years and older in the United States. Cancer Epidemiol. Biomarkers Prev. 25 (11), 1517–1523. [DOI] [PMC free article] [PubMed] [Google Scholar]
- Laryea JA, Siegel E, Klimberg S, 2014. Racial disparity in colorectal cancer: the role of equal treatment. Dis. Colon rectum 57 (3), 295–302. 10.1097/DCR.0000000000000056. [DOI] [PubMed] [Google Scholar]
- Lowenfels AB, Maisonneuve P, 2002. Epidemiologic and etiologic factors of pancreatic cancer. Hematol. Oncol. Clin. North Am. 16 (1), 1–16. [DOI] [PubMed] [Google Scholar]
- Mazurenko O, Buntin MJB, Menachemi N, 2019. High-deductible health plans and prevention. Annu. Rev. Public Health 40, 411–421. 10.1146/annurev-publhealth-040218-044225. [DOI] [PubMed] [Google Scholar]
- Mokdad AH, Dwyer-Lindgren L, Fitzmaurice C, Stubbs RW, Bertozzi-Villa A, Morozoff C, Murray CJ, 2017. Trends and patterns of disparities in Cancer mortality among US counties, 1980–2014. JAMA 317 (4), 388–406. 10.1001/jama.2016.20324. [DOI] [PMC free article] [PubMed] [Google Scholar]
- Odahowski CL, Hebert JR, Eberth JM, 2018. Regional variation in lung and bronchus cancer survival in the US using mortality-to-incidence ratios. Spatial Spatiotemporal Epidemiol 26, 107–112. 10.1016/j.sste.2018.06.004. [DOI] [PubMed] [Google Scholar]
- Peres LC, Bandera EV, Qin B, Guertin KA, Shivappa N, Hebert JR, Schildkraut JM, 2017. Dietary inflammatory index and risk of epithelial ovarian cancer in African American women. Int. J. Cancer 140 (3), 535–543. 10.1002/ijc.30467. [DOI] [PMC free article] [PubMed] [Google Scholar]
- Samson ME, Adams SA, Orekoya O, Hebert JR, 2016. Understanding the Association of Type 2 diabetes mellitus in breast cancer among African American and European American populations in South Carolina. J. Racial Ethn. Health Disparities 3 (3), 546–564. 10.1007/s40615-015-0173-0. [DOI] [PMC free article] [PubMed] [Google Scholar]
- Siegel RL, Sahar L, Portier KM, Ward EM, Jemal A, 2015. Cancer death rates in US congressional districts. CA Cancer J. Clin. 65 (5), 339–344. 10.3322/caac.21292. [DOI] [PubMed] [Google Scholar]
- Siegel RL, Miller KD, Jemal A, 2018. Cancer statistics, 2018. CA Cancer J. Clin. 68 (1), 7–30. 10.3322/caac.21442. [DOI] [PubMed] [Google Scholar]
- Smith ER, Adams SA, Prabhu-Das I, Bottai M, Fulton J, Hebert JR, 2008. Breast cancer survival among economically disadvantaged women: the influences of delayed diagnosis and treatment on mortality. Cancer Epidemiol. Biomark. Prev. 17 (10), 2882–2890. [DOI] [PMC free article] [PubMed] [Google Scholar]
- Soni A, Simon K, Cawley J, Sabik L, 2018. Effect of Medicaid expansions of 2014 on overall and early-stage cancer diagnoses. Am. J. Public Health 108 (2), 216–218. 10.2105/AJPH.2017.304166. [DOI] [PMC free article] [PubMed] [Google Scholar]
- Sunkara V, Hebert JR, 2015. The colorectal cancer mortality-to-incidence ratio as an indicator of global cancer screening and care. Cancer 121 (10), 1563–1569. 10.1002/cncr.29228. [DOI] [PMC free article] [PubMed] [Google Scholar]
- Sunkara V, Hebert JR, 2016a. The application of the mortality-to-incidence ratio for the evaluation of cancer care disparities globally. Cancer 122 (3), 487–488. 10.1002/cncr.29746. [DOI] [PubMed] [Google Scholar]
- Sunkara V, Hebert JR, 2016b. The colorectal cancer mortality-to-incidence ratio as a potential cancer surveillance measure in Asia. Asian Pac. J. Cancer Prev. 17 (9), 4323–4326. [PubMed] [Google Scholar]
- Tammana VS, Laiyemo AO, 2014. Colorectal cancer disparities: issues, controversies and solutions. World J. Gastroenterol. 20 (4), 869–876. 10.3748/wjg.v20.i4.869. [DOI] [PMC free article] [PubMed] [Google Scholar]
- Tong EK, Fagan P, Cooper L, Canto M, Carroll W, Foster-Bey J, Chu K, 2015. Working to eliminate cancer health disparities from tobacco: a review of the National Cancer Institute’s community networks program. Nicotine Tob. Res. 17 (8), 908–923. 10.1093/ntr/ntv069. [DOI] [PMC free article] [PubMed] [Google Scholar]
- US Census Bureau, 2019. American fact finder. Retrieved from. https://factfinder.census.gov/faces/nav/jsf/pages/searchresults.xhtml?refresh=t.
- Wagner SE, Hurley DM, Hebert JR, McNamara C, Bayakly AR, Vena JE, 2012. Cancer mortality-to-incidence ratios in Georgia: describing racial cancer disparities and potential geographic determinants. Cancer 118 (16), 4032–4045. 10.1002/cncr.26728. [DOI] [PMC free article] [PubMed] [Google Scholar]
- Wheeler SB, Basch E, 2017. Translating cancer surveillance data into effective public health interventions. JAMA 317 (4), 365–367. 10.1001/jama.2016.20326. [DOI] [PubMed] [Google Scholar]
- Wheeler SB, Davis MM, 2017. “Taking the bull by the horns”: four principles to align public health, primary care, and community efforts to improve rural cancer control. J. Rural. Health 33 (4), 345–349. 10.1111/jrh.12263. [DOI] [PMC free article] [PubMed] [Google Scholar]
- Wong D, 2009. The modified areal unit problem In: Fotheringham AS, Rogerson P (Eds.), The SAGE Handbook of Spatial Analysis. Sage, Los Angeles, pp. 105–123. [Google Scholar]
- Xiao D, Zheng C, Jindal M, Johnson LB, DeLeire T, Shara N, Al-Refaie WB, 2018. Medicaid expansion and disparity reduction in surgical cancer care at highquality hospitals. J. Am. Coll. Surg. 226 (1), 22–29. 10.1016/j.jamcollsurg.2017.09.012. [DOI] [PMC free article] [PubMed] [Google Scholar]
- Xirasagar S, Li Y-T, Hurley TG, Tsia MH, Hardin JW, Hurley DM, … de Groen PC (2015). Colorectal cancer prevention by an optimized colonoscopy protocol in routine practice Int. J. Cancer, 136(6), E731–742. doi: 10.1002/ijc29228. [DOI] [PMC free article] [PubMed] [Google Scholar]
- Yen KL, Horner MJD, Reed SG, Daguise VG, Johnson MG, Day TA, …. Hebert JR (2006). Head and neck cancer disparities in South Carolina: descriptive epidemiology, early detection, and special programs. J SC Med Assoc, 102, 192–200. [PubMed] [Google Scholar]
- Zahnd WE, Jenkins WD, Mueller-Luckey GS, 2017. Cancer mortality in the Mississippi Delta region: descriptive epidemiology and needed future research and interventions. J. Health Care Poor Underserved 28 (1), 315–328. 10.1353/hpu.2017.0025. [DOI] [PubMed] [Google Scholar]
- Zahnd WE, James AS, Jenkins WD, Izadi SR, Fogleman AJ, Steward DE, … Brard L (2018). Rural-urban differences in cancer incidence and trends in the United States. Cancer Epidemiol. Biomarkers Prev, 27(11), 1265–1274. doi: 10.1158/1055-9965.EPI-17-0430. [DOI] [PMC free article] [PubMed] [Google Scholar]
- Zerhouni YA, Trinh QD, Lipsitz S, Goldberg J, Irani J, Bleday R, Melnitchouk N, 2019. Effect of Medicaid expansion on colorectal cancer screening rates. Dis. Colon rectum 62 (1), 97–103. 10.1097/DCR.0000000000001260. [DOI] [PubMed] [Google Scholar]
- Zhao J, Zheng Z, Han X, Davidoff AJ, Banegas MP, Rai A, Yabroff KR, 2019. Cancer history, health insurance coverage, and cost-related medication nonadherence and medication cost-coping strategies in the United States. Value Health 22 (7), 762–767. 10.1016/j.jval.2019.01.015. [DOI] [PubMed] [Google Scholar]
- Zheng Z, Jemal A, Banegas MP, Han X, Yabroff KR, 2019a. High-deductible health plans and cancer survivorship: what is the association with access to care and hospital emergency department use? Journal of Oncology Practice Jop1800699. 10.1200/jop.18.00699. [DOI] [PubMed] [Google Scholar]
- Zheng Z, Jemal A, Han X, Guy GP Jr., Li C, Davidoff AJ, Yabroff KR, 2019b. Medical financial hardship among cancer survivors in the United States. Cancer 125 (10), 1737–1747. 10.1002/cncr.31913. [DOI] [PubMed] [Google Scholar]


