

Abstract
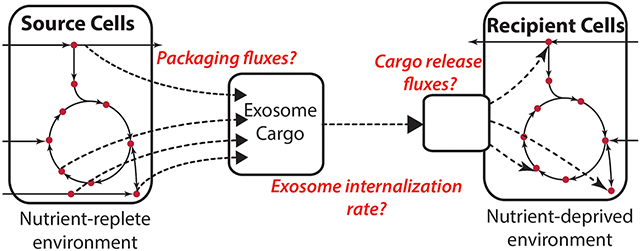
Dissecting the pleiotropic roles of tumor micro-environment (TME) on cancer progression has been brought to the foreground of research on cancer pathology. Extracellular vesicles such as exosomes, transport proteins, lipids, and nucleic acids, to mediate intercellular communication between TME components and have emerged as candidates for anti-cancer therapy. We previously reported that cancer-associated fibroblast (CAF) derived exosomes (CDEs) contain metabolites in their cargo that are utilized by cancer cells for central carbon metabolism and promote cancer growth. However, the metabolic fluxes involved in donor cells towards packaging of metabolites in extracellular vesicles and exosomes-mediated metabolite flux upregulation in recipient cells are still not known. Here, we have developed a novel empirical and computational technique, exosome-mediated metabolic flux analysis (Exo-MFA) to quantify flow of cargo from source cells to recipient cells via vesicular transport. Our algorithm, which based on 13C metabolic flux analysis, successfully predicts packaging fluxes to metabolite cargo in CAFs, dynamic changes in rate of exosome internalization by cancer cells and flux of cargo release over time. We find that cancer cells internalize exosomes rapidly leading to depletion of extracellular exosomes within 24 hours. However, metabolite cargo significantly alters intracellular metabolism over the course of 24 hours by regulating glycolysis pathway fluxes via lactate supply. Furthermore, it can supply up to 35% of the TCA cycle fluxes by providing TCA intermediates and glutamine. Our algorithm will help gain insight into (i) metabolic interactions in multicellular systems (ii) biogenesis of extracellular vesicles and their differential packaging of cargo under changing environments, and (iii) regulation of cancer cell metabolism by its microenvironment.
Keywords: Tumor microenvironment, Exosomes, Intercellular metabolic flux analysis, Exo-MFA, 13C-metabolic flux analysis, Cancer metabolism
Graphical Abstract
1. INTRODUCTION
The tumor microenvironment (TME) is a complex milieu of several types of cells, blood vessels and extracellular matrix proteins in which cancerous cells thrive. Fibroblasts, immune cells, endothelial cells and pericytes and are collectively known as stroma and constitute the TME. These cells become reactive and develop characteristics that support and even enhance tumor progression and metastasis due to proximity and constant interaction with cancer cells (Chu et al., 2007; Valencia et al., 2014). Tumor development is thus being looked at in a new light, one in which TME plays a pleiotropic role in tumor progression and metastasis. Cancer-associated fibroblasts (CAFs), the most abundant constituent of TME, have been implicated in promoting tumor growth, conferring resistance to immune response by secreting soluble factors (Feig et al., 2013; Rupp et al., 2015), aiding tumor cells in acquiring resistance to therapeutic agents (Chen et al., 2015). Stromal cells also provide carbon sources like free fatty acids and amino acids to meet bioenergetic demands of cancer cells (Yang et al., 2016; Salimian et al., 2014; Sanità et al., 2014). Given the multiple modes of support provided by stromal cells, the TME needs to be investigated with the same vigor and focus as afforded to cancer cells. More importantly, knowledge of seemingly indispensable intercellular interactions within the TME has presented new avenues for therapy in cancers that form solid tumors (Ghesquière et al., 2014; Hansen et al., 2016). However, to aid such therapeutic discoveries, we should learn to assess complex multicellular systems with a level of granularity that is currently overlooked.
Researchers have revealed that microvesicles secreted by cells are an important apparatus of transporting vital biological cargo between stromal and tumor cells that can support tumor progression (D’Souza-Schorey and Clancy, 2012; Penfornis et al., 2016). Exosomes are microvesicles that are 30-100 nm in diameter and transport proteins, nucleic acids including miRNA intercellularly. Exosomes secreted by cancer cells condition the extracellular environment and stromal cells in close proximity to aid proliferation and metastasis (Costa-Silva et al., 2015). Recently, our group showed that CAFs secrete exosomes to regulate the metabolism of recipient cancer cells. This metabolic regulation takes place in two ways; (i) miRNA-mediated inhibition of mitochondrial oxidative metabolism and (ii) nutritional supplementation via de novo “off-the-shelf” metabolites (Zhao et al., 2016). 13C tracer experiments provided compelling evidence that exosomes transport free metabolites that are directly incorporated into cancer cells’ central carbon metabolite pools. Quantitatively assessing the contribution of metabolite cargo to cancer cell metabolism will be the first step for dissecting the pleiotropic effects of CAF-secreted exosomes (CDEs) on tumor growth. This will help achieve a mechanistic understanding of exosome-mediated rescue of nutrient-deprived cancer cells to identify suitable therapeutic targets.
In the current study, we have designed a novel paradigm, exosome-mediated metabolic flux analysis (Exo-MFA), to predict fluxes involved in metabolite trafficking from CAFs to cancer cells. Exo-MFA integrates a novel experimental protocol using 13C-labeled substrates with an enhanced metabolic flux analysis to provide insight into metabolic crosstalk within the TME. Stable-isotope tracing techniques have emerged as a powerful empirical tool to provide insight into nutrient utilization and metabolic pathway activities by measuring isotopic enrichment of intracellular metabolites (Yang et al., 2014; Bennett et al., 2008; Hosios et al., 2016; Jiang et al., 2016; Lewis et al., 2014; Zamboni et al., 2009; Caneba et al., 2012; Bellance et al., 2012). A range of 13C, 15N and 2H labeled substrates have been employed to study altered metabolism affecting cancer pathology. However, due to the presence of branches and cycles in metabolic networks, manually analyzing isotope labeling data can only provide relative changes in limited number of metabolic pathways. Fortunately, computational flux analysis techniques such as 13-C metabolic flux analysis, (13C-MFA) have been developed that can estimate intracellular fluxes based on the reaction stoichiometry of metabolic networks, carbon atom transitions and extracellular fluxes within complex mammalian systems (Bordbar et al., 2014; Huang et al., 2014; Quek et al., 2009; Weitzel et al., 2013; Young, 2014). Exo-MFA utilizes the fundamentals of the 13C-MFA algorithm and tracer experiments, traditionally used for single cell systems that only exchange metabolites with their media, to provide an enhanced platform to analyze metabolite fluxes in multicellular systems.
Herein, we study the effects of metabolite cargo of CAF-derived exosomes (CDEs) on pancreatic ductal adenocarcinoma (PDAC) cells under nutrient-deprived conditions. We successfully employ Exo-MFA to estimate the packaging fluxes in CAFs that constitute the metabolite cargo of exosomes. Furthermore, Exo-MFA predicts the rate of exosome internalization by PDAC cells within physically reasonable ranges. Finally, Exo-MFA estimates contribution of exosomal cargo to intracellular metabolites in PDAC cells, proving that metabolite cargo significantly alters their intracellular fluxes and supports TCA cycle fluxes. We observe that the effect of metabolite cargo diminishes within 24 hours due to depletion of exosomes in the media, but our results strongly indicate that the metabolites supplied by CDEs can support PDAC metabolism during the initial stages of nutrient deprivation.
2. METHODS
2.1. Cell culture
MiaPaCa-2 cells were cultured in DMEM (high glucose) medium with 10% FBS, 1% penicillin-streptomycin. CAF19 cells were cultured in DMEM (high glucose) medium with 15% FBS, 1% penicillin-streptomycin. For labeled exosomes collection, CAF19 cells were cultured in RPMI medium with uniformly 13C labeled glucose, glutamine, phenylalanine (Cambridge isotope laboratories). RPMI deprived media were constructed from medium of cat no. R9010 (USBiologicals). For all experiments with nutrient-deprivation condition, MiaPaCa-2, were cultured in RPMI reconstructed from R9010 medium. MiaPaCa-2 cells in deprivation conditions were cultured in 6-well plates with seeding density of 200,000 cells per well.
2.2. Protein assays
Protein amount for CAF19, MiaPaCa-2 and exosomes are measured per the Bicinchoninic Acid (BCA) Protein Assay protocol. In brief, protein reagent (200 μl) was added to a 96-well assay plate and mix with samples or standards (10 μl), and then incubated at 37°C for 30 min. The absorbance was read on a spectrophotometer at 562 nm.
2.3. Metabolic assays
Glucose assay:
Glucose assays were performed according to the instructions of the Wako Glucose kit. In brief, a 250 μl of reconstituted Wako glucose reagent was added to a 96-well assay plate followed by adding 2 μl sample in each well. The plate was incubated at 37°C for 5 min with vortex. The change in absorbance, which indicates the amount of glucose present, was measured at 505 nm and 600 nm by using a spectrophotometer (SpectraMax M5; Molecular Devices).
Lactate assay:
Lactate secretion was measured using the Trinity Lactate Kit. Media samples were diluted 1:10 in PBS, and lactate reagent was reconstructed and added to the diluted samples in a 96-well assay plate. The plate was incubated for 1 h at 37°C, protecting from light. Afterwards the change in absorbance was read on a spectrophotometer at 540 nm.
Amino acid measurements:
Ultra-high-performance liquid chromatography was used to assess amino acid uptake and secretion using Waters Acquity UPLC device. Briefly, media samples were deproteinized, and MassTrak Reagent was added to the samples, along with Borate Buffer/NaOH. Samples were then heated and analyzed using the Waters ACQUITY UPLC system. Eluents were prepared according to Waters’ protocol. MassTrak AAA eluent A concentrate was diluted 1:10 in milliQwater, and MassTrak AAA eluent B was inputted in undiluted form. Flow rate of eluents was 0.4 ml/min, and UV detection was at 260 nm.
Viability assay:
Cells viability was measured by Cell counting kit-8. Cells were cultured on 96-well plate in the indicated conditions. Viability assay solution was added to the plate for incubation of 2 h and absorbance was measured at 450 nm.
2.4. Isotope labeling experiments and GC-MS analysis
Intra-exosomal metabolites extraction:
The exosomes pellet was extracted by adding 75 μl of cold methanol; 150μl of cold water with norvaline was added, which dissolved exosomes completely. 20μl of the liquid was reserved for protein assay. Then 150 μl of cold chloroform was added into the tubes and vortexed at 4°C for 30 min, centrifuged at 7,300 rpm for 10 min at 4°C. The aqueous layer was collected for intra-exosomal metabolite analysis.
Intracellular metabolites extraction:
Cancer cells were seeded in 6-well plates overnight, and replaced with medium containing 13C labeled CDEs. After 3, 6, 12, 24 hours, medium were aspirated, and cells were washed with cold PBS once and quenched with 400 μl of cold methanol. Same volume of water containing 1 μg of norvaline was added, and cells were scraped into Eppendorf tubes. 800 μl of chloroform was added into the tubes, and vortexed at 4°C for 30 min, centrifuged at 7,300 rpm for 10 min at 4°C. The aqueous layer was collected for metabolite analysis. Parallel wells were used for normalization.
Derivatization:
Aqueous samples were dried and dissolved in 30 μl of 2% methoxyamine hydrochloride in pyridine (Pierce), and sonicated for 10 mins. Afterwards, samples were kept in 37°C for 2 hours. Samples were kept for another 1 hour at 55°C after addition of 45 μl of MBTSTFA+1% TBDMCS (Pierce). Chloroform samples were dried and dissolved in 75 μl Methyl-8 Reagent (Pierce), and incubate at 60 °C for 1 hour. Samples were transferred into vials containing 150 μl of insert (Thermo Fish Scientific).
GC-MS measurements:
GC-MS analysis was performed using an Agilent 6890 GC equipped with a 30-m Rtx-5 capillary column for metabolites samples or 30 m DB-35 MS capillary column for fatty acids samples, connected to an Agilent 5975B MS. For metabolites samples, the following heating cycle was used for the GC oven: 100°C for three minutes, followed by a temperature increase of 5°C/min to 300°C for a total run time of 48 min. For fatty acids samples, the following heating cycle was used for the GC oven: 100°C for 5 minutes increased to 200 °C at 15° min−1, then to 250 °C at 5° min−1 and finally to 300 °C at 15° min−1. Data was acquired in scan mode. The abundance of relative metabolites was calculated from the integrated signal of all potentially labeled ions for each metabolite fragment.
2.5. Exosome isolation and exosome-supplemented media construction
Exosomes were isolated as per the protocol described in our previous study (Zhao et al., 2016). Briefly, 25ml of spent medium from parallel flasks of CAF cultures were collected in 50ml centrifuge tubes. The collected medium was centrifuged in 2000 × g for 30 min to remove debris. The supernatant containing the cell-free culture media was transferred to a new tube without disturbing the pellet. Required volume of cell-free culture media was then transferred to a new tube and 0.5 volumes of the Total Exosomes Isolation (for cell culture media) reagent was added. The culture media/reagent mixture was homogenized well by vortexing. Incubate samples at 2°C to 8°C overnight. These samples were centrifuged at 10,000 × g for 1 hr at 2°C to 8°C. following which the supernatant was aspirated and discarded. Exosomes were contained in the pellet at the bottom of the tube. To estimate the exosomal protein content of exosomal yield from CAF19 cells, at least four tubes containing exosome pellets were prepared and analyzed for exosomes protein measurement using the BCA kit. The averaged exosome protein amount extracted per mL of spent medium was calculated from the data of the four tubes. The dried exosome pellets were suspended in appropriate volume of medium without glutamine and phenylalanine along with exosome-depleted FBS to construct medium with exosome concentration of 200 μg/ml.
2.6. Exosome-mediated metabolic flux analysis (Exo-MFA)
Exo-MFA is designed for quantifying intracellular fluxes and transport of metabolites via exosomes from ‘source cells’ (herein, CAFs from PDAC patients) to ‘recipient cells’ (pancreatic cancer cell-lines). The paradigm described herein focuses and integrates the two important processes that occur in the system; (i) packaging of metabolite cargo into exosomes and secretion of exosomes within source cells and (ii) internalization of exosomes and release of cargo within recipient cells. To the best of our knowledge, Exo-MFA is the only algorithm that quantifies ‘cargo packaging fluxes’ in source cells along with ‘cargo release fluxes’ in the recipient cells that describe metabolite trafficking between two types of cells. Source CAFs are cultured in media containing stable 13C isotope-labeled tracer substrates in order to obtain exosomes with 13C-labeled cargo. The 13C-labeled exosomes are then introduced into nutrient-deprived cancer cell media which release their labeled cargo into cancer cells. Exo-MFA describes a 13C-MFA problem that includes packaging fluxes describing the generation of exosomes and utilizes data from (i) tracer experiments within CAFs and exosomes, (ii) extracellular fluxes of CAFs and (iii) growth rate measurements. Solving the 13C-MFA problem provides us with both intracellular fluxes of CAFs and packaging fluxes of CAF metabolites into exosomes.
In the case of cancer cells, we focus on the initial stages of exosome internalization under nutrient deprivation in cancer cells where the assumption of metabolic or isotopic steady-state does not hold. Exo-MFA considers the transient nature and utilizes data from time-series isotope-labeled exosome experiments, measurements of extracellular fluxes and composition of exosome metabolite cargo to estimate intracellular fluxes in cancer cells that internalize exosomes from the media. Exo-MFA for recipient cancer cells is set up as a time-series 13C-MFA problem and solved for measurements sampled at 3, 6, 12 and 24 hours.
2.6.1. Modeling packaging fluxes in source cells
In order to obtain sufficient information for estimating metabolite packaging fluxes into exosome cargo, the rate of exosome secretion along with extracellular fluxes are empirically determined. If each CAF is assumed to produce exosomes at a constant rate of r (mg exosome/mg protein/h), the total exosomes secreted at the end of a tracer experiment is described by the ODE in Equation (2), with the knowledge that exponential growth rate of CAFs is μ (hr−1) and seeding density of CAFs is X0 (cells):
| (2) |
Integrating Equation (2) will give the expression for total number of exosomes produced as given by Equation (3)
| (3) |
Assuming that there are no exosomes in fresh media at the beginning of the experiment, the constant of integration can be evaluated at t=0 and therefore, r can be estimated from Equation (4) once total amount of exosomes produced at the end of the experiment is measured.
| (3b) |
Furthermore, composition for ith metabolite, Pi (μmol/mg exosome), within the exosome cargo can be determined by measuring abundance of metabolites in isolated exosomes:
| (4) |
However, measurements for all metabolites that are packaged in cargo are not practical to obtain empirically. For this purpose, Exo-MFA has the ability to predict the packaging fluxes for set of metabolites not measured via targeted GC-MS analysis. This is achieved by introducing Pi as unknown parameter for metabolites that are postulated to contribute to the cargo but not measured a priori. Furthermore, even for metabolites that are measured, contribution of the same metabolite from cytosolic and mitochondrial compartments to exosome cargo cannot be inferred from Equation (4). Exo-MFA also includes isotopomer balances in exosomes in addition to intracellular isotopomer balances described in the 13C-MFA formulation in Appendix A.
Mass balance for intracellular metabolites that are packaged into exosomes within CAFs is described under the steady state assumption by Equations (5–6), where Ci is the intracellular concentration of metabolite i; Si is the stoichiometric vector corresponding to metabolite i and the parameter introduced to represent exosome packaging flux is . For metabolites that exist in multiple compartments, mass balances in Equations (6a–b) are defined for each subcompartment the same way as they are for metabolites in single compartments (Equations (5a)), however the balance for exosome packaging flux is modified as in Equation (6c) to include contribution from both compartments.
| (5a) |
| (5b) |
| (6a) |
| (6b) |
| (6c) |
Further, the isotopomer balance for metabolites which are measured in CAFs and exosomes via GC-MS is described in a generalized form in Equation (7). The isotopomer distribution of metabolite i in the exosome is a combination of isotopomer distributions derived from multiple compartments that is proportional to the packaging fluxes originating from each compartment.
| (7) |
Here, M1C and M2C are set of metabolites that exist in single compartment or two compartments, respectively; , refer to packaging fluxes of ith metabolite from the single compartment, cytosolic compartment or mitochondrial compartment, respectively; are isotopomer distribution vectors (IDVs) of ith metabolite existing in the cytosol, mitochondria or exosome. Equations (5–7) are included in the Exo-MFA algorithm along with Equations (A3, A6–8) to describe the 13C-MFA mass balance and isotopomer balance constraints. The objective function for Exo-MFA in Equation (8) is modified from the 13C-MFA objective function (Equation A8a) to consider the residuals of additional measurements in source cells and exosomes, i.e., exosome secretion rate, metabolite levels in exosomes and mass isotopologue distributions (MID) in exosomes.
| (8) |
Here, ’s are the covariance matrices of MID measurements in source cells and exosomes, measured metabolite compositions from Equation (4); rmeas, σr are exosome production rate estimated from Equation (3) and its standard deviation, respectively; M is the transformation matrix to convert isotopomer distribution vectors (IDV) to MID; and are intracellular MIDs that are measured and estimated by the model, respectively; and are intra-exosomal MIDs that are measured and estimated by the model, respectively; Pmeas and P are intra-exosomal metabolite levels that are meas measured and estimated by the model, respectively.
2.6.2. Modeling cargo release in recipient cells
Exo-MFA modifies the metabolic model for cancer cells to include exosome internalization and release of metabolite cargo that contributes to the endogenous metabolite pools. The rate of internalization is considered to be u(t) (mg exosome/mg protein/h). Internalization is assumed to be a time-dependent due to dependence on extracellular concentration of exosomes and the transient nature of the nutrient-deprived cancer cells. The content of exosomes, however, is assumed to be consistent throughout the process of packaging, transport and internalization. Release of cargo into cancer cells is slightly more complex than packaging, since (i) not all metabolites are utilized in the same way, and (ii) intracellular metabolic fluxes are not at steady-state. For this purpose, the cargo is categorized according to their utilization, (i) central carbon metabolites that are incorporated directly into central carbon metabolism (CCM), (ii) essential amino acids that are incorporated only into biomass. The mass balance for these metabolites are formulated in Equations (9–12). Cargo release fluxes are proportional to rate of internalization u(t) and the intra-exosomal composition Pi, therefore the flux term becomes u(t)Pi (μmol/mg protein/h). Equations (9,11) describe the mass balance of metabolite i derived from exosome cargo and Si is the stoichiometric vector corresponding to that metabolite describing the inracellular reactions it is involved in. Equations (10,12) represent the isotopomer balance equations as described by the Isotopomer Mapping Matrix algorithm (Schmidt et al., 1997), but with a small modification that includes the term u(t)Piyi,exo that represents the influx of isotopomers of metabolites derived from exosome cargo.
| (9) |
| (10) |
| (11) |
| (12) |
Where MCCM, MEAA are sets representing central carbon metabolites and essential amino acids, respectively within exosome cargo. Ci is the total intracellular concentration of metabolite i. Biomass production flux is represented by ρ (1/h) and stoichiometric contribution to biomass is given by Sbio (nmol/cell). ρ is estimated from growth rate measurement on cancer cells treated with exosomes. Furthermore, Equations (9–12) describe rate of change in intracellular pool sizes which are assumed to be rapid, this allows us to make a pseudo-steady state assumption for every time point at which recipient cells are sampled for analysis. Therefore, Equations (9–12) are equated to zero, following which they are included in the Exo-MFA algorithm along with the 13C-MFA intracellular model described in Appendix A. The objective function of Exo-MFA in recipient cells represented by Equation (13), is modified to include residuals of metabolite levels in exosomes and MID in exosomes.
| (13) |
and are intracellular MIDs of recipient cells that are measured and estimated by the model, respectively; and P are the same as described in Section 2.6.1.
2.7. Estimating extracellular fluxes
Extracellular fluxes for CAFs are estimated assuming exponential growth and a constant uptake rate over the course of the experiment. Equations (14) are integrated and fit to measurements of concentration of respective metabolites in fresh and spent media to estimate the flux vi.
| (14a) |
| (14b) |
Estimating extracellular fluxes for cancer cells cultured that have not reached metabolic steady-state is performed by fitting concentration curves of extracellular metabolites to measurements. The uptake and secretion rate changes were assumed to be either constant over time or linear with respect to time for model simplicity. Mass balance equations for extracellular metabolites were derived analytically and integrated for a set of unknown parameters as in Equations (14–16)
| (15) |
| (16) |
Here, X0 is the cell seeding density in each well. For each extracellular metabolite vi(t) was assumed to be either constant on linear function of time, and the parameters were estimated by fitting Equation (16) to extracellular concentrations measured at 0, 3, 6, 12 and 24 hours of culture. The vi(t) function that provided the best fit was chosen. The parameter estimates and confidence intervals were achieved using the Microsoft Excel® Solver.
2.8. Statistical tests for fluxes estimated by Exo-MFA
Globally optimal solutions from the Exo-MFA algorithm were obtained by solving the problem using at least 100 randomly generated initial guesses. Converged solutions were selected based on their performance of the χ2 goodness-of-fit test. The degree of freedom was estimated as the difference between number of redundant measurements (extracellular fluxes, intracellular MIDs, exosome MIDs, intra-exosomal metabolite levels and growth rate) and free parameters in the flux model. To estimate 95% confidence intervals, the Monte-Carlo simulation approach was utilized; measurements were perturbed by normally distributed errors to generate at least 100 samples and the Exo-MFA optimization problem for each condition was solved for the newly sampled measurements. For each estimated flux, the distribution obtained was used to estimate mean, standard deviation and subsequently the bounds for 95% confidence interval.
3. RESULTS AND DISCUSSION
3.1. CDEs rescue proliferation of nutrient-deprived PDAC cells and enhance tumor progression by providing free metabolites as cargo
PDAC cells have high energetic demands for proliferation and metastasis and they are dependent on amino acids, especially glutamine for survival and growth. However, within the microenvironment, vasculature is deformed, leaky and unstructured. It cannot reach every part of a rapidly proliferating solid tumor, thereby creating nutrient-deficient pockets within the tumor. Despite facing such antagonistic environments cancer cells can grow, largely due to the support received from surrounding stromal cells in the TME (Figure 1A). Recently, our group discovered that the TME that supplies fuel to meet the high metabolic demands of cancer cells under nutrient-stressed conditions via exosomes. We showed that that exosomes secreted by CAFs, are internalized by cancer cells, significantly inhibiting mitochondrial oxidative phosphorylation in cancer cells, leading to increased glycolysis and glutamine-dependent reductive carboxylation. More importantly, CDEs could rescue the viability of prostate and pancreatic cancer cells that were cultured in media deprived of glutamine, lysine, leucine, phenylalanine and pyruvate (Zhao et al., 2016). To demonstrate the metabolic effect of CDEs in pancreatic cancer, we cultured PDAC cell line, MiaPaCa-2, in media that is deprived of glutamine and phenylalanine to compare their proliferation in the presence or absence of CDEs. Notably, CDEs can completely rescue viability when cancer cells are deprived of glutamine and phenylalanine within 24 hours (Figure 1B). As we had hypothesized earlier, the rescue by CDEs is, in part, due to free metabolites in the exosome cargo that are instantaneously available for replenishing intracellular pools in tumor cells. Although, the transport of metabolite cargo had been shown conclusively by us, the results were only indicative of the phenomenon. To provide a quantified insight on metabolite flow via exosome cargo that originates in CAFs and ends in cancer cell metabolism, we have designed an experimental and computational workflow known as Exosome-mediated metabolic flux analysis (Exo-MFA) (Figure 1C). This approach is based on 13-carbon stable-isotope tracing experiments and metabolic flux analysis (13C-MFA) fundamentals that have been enhanced to include all three elements of CDE-induced metabolic rescue: (i) intracellular CAF metabolism and metabolite packaging, (ii) intra-exosomal content and (ii) intracellular PDAC metabolism and cargo release.
Figure 1: Exosomes derived from tumor microenvironment rescue growth in nutrient-deprived PDAC cells.
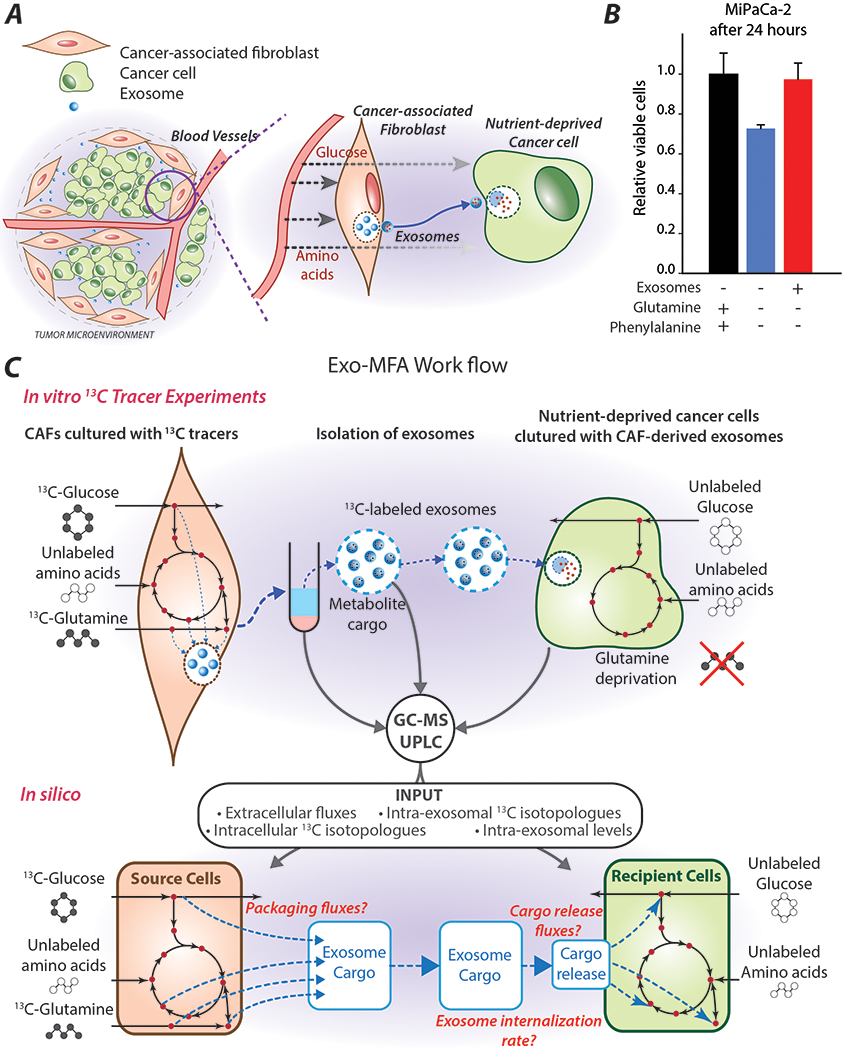
(A) Simplified graphic of the tumor microenvironment that shows, where exosomes act as one of the channels of communication between cancer-associated fibroblasts and tumor cells.
(B) Relative viability of PDAC cells (MiaPaCa-2) cultured in complete media or media deprived of glutamine and phenylalanine in the presence or absence of CAF-derived exosomes. Data are reported as mean ± SEM, (n≥3) from a batch representative of repeated experiments.
(C) Schematic for the workflow of Exo-MFA describing the in vitro 13C tracer experiments from which CAFs, exosomes and PDAC cells are analyzed using GC-MS and UPLC systems to obtain measurements for in silico simulations of transport of metabolite cargo between cells via exosomes. Exo-MFA simulations provide estimates of intracellular fluxes, packaging fluxes in source cells, rate of uptake of exosomes and cargo release fluxes.
CAFs are cultured with 13-carbon tracers to enrich metabolic intermediates with 13C isotopomers within both CAFs and exosome cargo. Exosomes that are secreted into the media are isolated and collected for analysis or introduced to nutrient-deprived cancer cells. Cancer cells are cultured in nutrient-deprived media in the presence of “labeled” exosomes to observe labeling of cancer metabolites from the cargo released by CDEs. Measurement of 13C isotopologue distribution within intracellular metabolites in CAF and PDAC cells, and intra-exosomal cargo is performed using a GC-MS (Methods, Section 2.4). Metabolite concentrations in spent media of CAF and PDAC cells are measured using UPLC to estimate extracellular fluxes (Methods, Sections 2.3, 2.7). The Exo-MFA algorithm utilizes these experimentally obtained measurements in a novel way to perform flux analysis across source cells (CAFs), packaging and release of exosomal cargo, and the recipient cells (cancer cells) to provide a seamless picture of metabolite flow between different types of cells via extracellular vesicles, i.e. exosomes (Figure 1C). The model for source cells includes packaging fluxes that constitute exosomal cargo, wherein mass balance and isotopomer balance are defined for intracellular compartments of CAFs and exosomes simultaneously. Extracellular measurements from spent CAF media, intracellular measurements of isotopologue distributions in CAFs and intra-exosomal measurements of metabolite concentration and isotopologue distributions are used to fit the parameters in the source cell model. Exo-MFA can also predict intra-exosomal abundances of metabolites for which measurements have not been made, but are introduced to the model as free parameters. For the recipient cells, Exo-MFA utilizes information from the best solution for source cells to define the labeled tracer input to recipient cells. This input is combined with extracellular measurements of spent media and intracellular isotopologue distributions made at multiple time points is used to estimate intracellular fluxes and cargo release fluxes within recipient cells. Therefore, Exo-MFA provides an end-to-end quantification of flow of metabolites from CAFs to cancer cells via exosomes.
3.2. Stable-isotope labeling experiments reveals packaging of intracellular CAF metabolites into exosome cargo
In order to dissect the role of metabolite trafficking via exosomes from the other TME interactions, we devised a novel in vitro experimental procedure that was described in (Zhao et al., 2016). Our objective in this study was to trace the flow of extracellular nutrients in the form of stable-isotope labeled tracers, [U-13C6]-Glucose and [U-13C5]-Glutamine within central carbon intermediates of CAFs and their subsequent incorporation into CDEs (Figures 1C, 2A). CAFs were cultured in medium with the labeled tracers for 72 hours to allow for sufficient production of exosomes and enrichment of glycolytic and TCA cycle intermediates along with de novo synthesized amino acids. CDEs enriched with labeled metabolites were isolated from the spent media of CAFs and their cargo was analyzed using GC-MS and UPLC systems (Figure 2A). On comparing the mass isotopologue distributions (MIDs) of CAFs and CDEs, we observed that several metabolites such as serine, glycine, lactate, and α-ketoglutarate have similar MIDs, strongly corroborating our hypothesis that cargo in exosomes is derived from intracellular CAFs metabolites. Most MIDs in CAFs and exosomes are comparable, however some show noticeable differences, especially in their unlabeled (M0) isotopologue mass fractions (Figure 2B). TCA intermediates and amino acids like citrate, α-ketoglutarate, succinate, malate, serine and glycine have higher mass fractions of M0 isotopologues in CDEs as compared to CAFs. This may be due to the dilution from unlabeled exosomes secreted by CAFs before intracellular isotopic enrichment reached saturated levels at steady-state. Glutamine is an exception to these observations, as exosomes are more enriched in M5 glutamine than CAFs. This could be due to completely labeled glutamine in the media and a high turnover of glutamine. Exosomes secreted before isotopic steady-state contained more labeled glutamine which was later diluted slightly by unlabeled glutamine synthesized from glutamate. Furthermore, several of these metabolites exist in multiple compartments in CAFs, which are homogenized during extraction and hence we measure a “weighted-average” of their isotopologue distributions proportional to their respective compartmental pool sizes. However, their incorporation into exosomes may not necessarily follow the same weighted-average further contributing to the difference between CAFs and CDEs. Exo-MFA can take both these assumptions into consideration to allow for fitting intracellular and intraexosomal MIDs. Thus, it provides the selective contribution of separate metabolite compartments to exosomal cargo. These results collectively show that exosome cargo is not limited to a subset of metabolites, but consists of metabolites from major metabolic pathways existing in separated intracellular compartments.
Figure 2: 13C-labeled tracer experiments in CAFs to produce 13C-labeled cargo in exosomes.
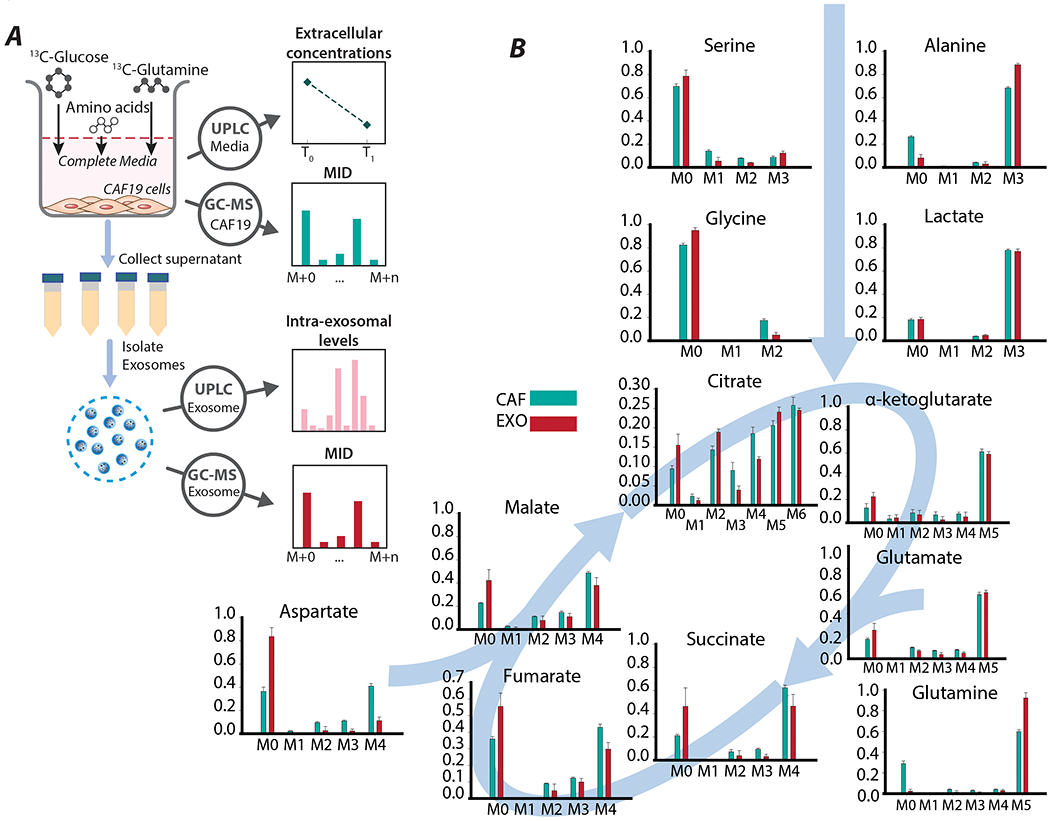
(A) Schematic of stable-isotope labeling experiments on CAFs. CAFs are cultured in [U-13C6]-glucose and [U-13C5]-glutamine to obtain exosomes with labeled metabolites. Labeled exosomes secreted by the CAFs (CDEs) are isolated from the media and and analyzed to measure mass isotopologue distributions and intra-exosomal metabolite levels. Spent media is used to measure extracellular metabolite concentrations using UPLC.
(B) Mass isotopologue distributions of major central carbon metabolites in CAFs and CDEs. Data are reported as mean ± SEM, (n≥4 for exosomes, n≥6 for CAFs) from a batch representative of repeated experiments.
3.3. Intracellular and exosome packaging fluxes can be predicted using Exo-MFA
CAFs were cultured in complete media with [U-13C6]-glucose and [U-13C5]-glutamine for 72 hours before isolating the secreted exosomes. The tracers used were selected to enrich a broad spectrum of metabolites within the central carbon metabolic network considered to be the focal point in this study for understanding packaging of exosome cargo. The metabolic model consisted of the major reactions from glycolysis, TCA cycle, anaplerosis, amino acid synthesis and biomass synthesis pathways (Appendix B). The Exo-MFA model was designed to include packaging fluxes which describe the flux of metabolites into exosome cargo, as previously discussed in Section 3.2. Metabolites in the model exist in two intracellular compartments i.e. the cytosol and mitochondria, and a third compartment for exosomes. Metabolite shuttles between cytosol and mitochondria were considered reversible but packaging fluxes were irreversible. Since the relative contribution of metabolites from either of the intracellular compartments to exosomes was not known a priori, independent packaging fluxes for cargo metabolites originating from each compartment are included in the model. The reason for including cytosolic and mitochondrial contribution to exosome packaging is due to the presence of mitochondrial metabolites discovered in the exosomes. Although, intact mitochondria are in the micrometer size range and would be too large for packaging into exosomes, our investigation showed mitochondrial fragments could be absorbed by exosomes. We found via quantitative PCR that mitochondrial DNA exists within isolated exosomes suggesting that mitochondrial fragments could be present in them (data not shown). Furthermore, as seen in Figure 2B, there is a noticeable dilution of metabolites found in CDEs due to the initial period of culturing where CAFs do not reach isotopic steady-state. Since the exosomes are collected at the end of the experiment, i.e. an aggregate of exosomes secreted over the course of the experiment, they show lower enrichments as compared to CAFs sampled at 72 hours. Exo-MFA takes into consideration the dilution effects and assumes an additional dilution flux. The caveat here is that dilution of labeled TCA metabolites occurs gradually as the metabolite pools reach isotopic steady state, but for simplicity of the model and lack of intermediate sampling, we assume that majority of the dilution is by unlabeled isotopomers. In the case of glutamine, “dilution” of exosomal glutamine is by uniformly labeled glutamine since that is present in the media which is then slowly diluted by unlabeled glutamine produced endogenously (Figure 2B). Furthermore, the metabolism of CAFs was expected to fulfill its biosynthetic demands along with exosome cargo for which the biomass flux was fit to the measured growth rate of CAFs. The model for the source cells, CAFs, presented herein contains 41 reactions (17 reversible) and a biosynthetic flux along with packaging fluxes for 8 cargo metabolites.
The optimization problem for Exo-MFA satisfies mass balance and isotopomer balances across all compartments while minimizing deviation between measurements and estimates of 9 intracellular and 7 intraexosomal mass isotopologue distributions, the biomass flux, 7 intra-exosomal metabolite abundances and exosome secretion rate, with a degree of freedom of 21. Intra-exosomal level for lactate was kept as an unknown parameter to be predicted. The intracellular fluxes were obtained by minimizing variance-weighted sum of square of residuals (SSR) converged to a feasible solution (Table 1, Figure 3A) with SSR = 30.2, which was within the acceptable range of SSR for χ2(23) = [10.3 35.5], at 95% confidence level. Packaging fluxes for amino acids glutamine, glycine, alanine, glutamate and TCA intermediates citrate, α-ketoglutarate and malate were fit according to the measured exosome secretion rate and their intraexosomal levels (Figure 3B). The model could predict the intraexosomal level of lactate within the same order of magnitude but it was overestimated (Figure 3C). The packaging flux for citrate was assumed to be derived from both the cytosolic and mitochondrial compartments and Exo-MFA estimated that cytosolic pool contributed to 32% and the mitochondrial pool contributed 68%.
Table 1:
Intracellular and cargo packaging fluxes in CAF cells cultured with [U-13C6]-glucose and [U-13C5]-glutamine for 72 hours. Values reported are absolute intracellular fluxes with the units μmol/mg protein/h. Negative fluxes represent net flux in the reverse direction of the corresponding reaction described under the Reaction column. SSR values are reported in the table and all fall within the range of acceptable values satisfying χ2(23) = [11.7, 38.1] at 95% confidence level. Abbreviations for reaction names and metabolites are given in Appendix B.
| Name | Reaction | Flux | SSR = 30.2 [11.7 38.1] |
|---|---|---|---|
| GLUT | Glc_x => Glc_c | 1.3357 | [1.3357, 1.3357] |
| GLYC | Glc_c => PG3 + Pyr_c | 1.3355 | [1.3355, 1.3355] |
| GLYC | PG3 => Pyr_c | 1.3529 | [1.3506, 1.3567] |
| PST | PG3 => Ser_c (net) | −0.0174 | [−0.0212, −0.0150] |
| Ser_c => PG3 (exch) | 0.0235 | [0.0191, 0.0311] | |
| SERT | Ser_c => Ser_x (net) | −0.0266 | [−0.0304, −0.0242] |
| Ser_x => Ser_c (exch) | 0.0268 | [0.0153, 0.0465] | |
| SHMT | Ser_c => Gly_c + MEETHF (net) | 0.0038 | [0.0037, 0.0039] |
| Gly_c + MEETHF => Ser_c (exch) | 0.4333 | [0.4226, 0.4510] | |
| GLYS | CO2 + MEETHF => Gly_c | 0.0035 | [0.0034, 0.0036] |
| ALAT | Pyr_m => Ala_c (net) | 0.2451 | [0.2417, 0.2493] |
| ALATR | Ala_c => Ala_x (exch) | 0.2364 | [0.2330, 0.2407] |
| LDH | Pyr_c => Lac_c (net) | 2.3643 | [2.3477, 2.3750] |
| Lac_c => Pyr_c (exch) | 33815.53 | [0, 3139706.3112] | |
| LACT | Lac_c => Lac_x (net) | 2.293 | [2.2860, 2.3026] |
| Lac_x => Lac_c (exch) | 0.6809 | [0.6640, 0.6999] | |
| PYRT | Pyr_c => Pyr_m | 0.3242 | [0.3122, 0.3434] |
| PDH | Pyr_m => AcCoA_m + CO2 | 0.3722 | [0.3587, 0.3936] |
| CS | AcCoA_m + OAC_m => Cit_m | 0.3722 | [0.3587, 0.3936] |
| IDH (m) | Cit_m => CO2 + aKG_m | 0.3722 | [0.3586, 0.3935] |
| OGDH | aKG_m => CO2 + Suc_m | 0.6097 | [0.5952, 0.6339] |
| SDH | Suc_m => Fum_m (net) | 0.6097 | [0.5952, 0.6339] |
| Fum_m => Suc_m (exch) | 0.0012 | [0, 0.0045] | |
| FH | Fum_m => Mal_m (net) | 0.6097 | [0.5952, 0.6339] |
| Mal_m => Fum_m (exch) | 0.0011 | [0, 0.0102] | |
| MDH | Mal_m => OAC_m (net) | 0.2237 | [0.2107, 0.2439] |
| OAC_m => Mal_m (exch) | 3.3857 | [3.3315, 3.4612] | |
| GLNT | Gln_x => Gln_c | 0.4168 | [0.4167, 0.4168] |
| GLS | Gln_c => Glu_m (net) | 0.405 | [0.4032, 0.4067] |
| Glu_m => Gln_c (exch) | 0.7442 | [0.7295, 0.7531] | |
| GLUTR | Glu_m => Glu_x (net) | 0.1565 | [0.1520, 0.1595] |
| Glu_x => Glu_m (exch) | 0.1361 | [0.1307, 0.1411] | |
| GDH | Glu_m => aKG_m (net) | 0.2411 | [0.2380, 0.2461] |
| aKG_m => Glu_m (exch) | 1.6663 | [1.5237, 1.9138] | |
| aKGT | aKG_m => aKG_c (net) | 0.0035 | [0.0035, 0.0036] |
| aKG_c => aKG_m (exch) | 8.294 | [8.2782, 8.3076] | |
| IDH (c) | CO2 + aKG_c => Cit_c | 0.0035 | [0.0035, 0.0036] |
| ACLY | Cit_c => AcCoA_c + OAC_c | 0.0035 | [0.0034, 0.0035] |
| MDH (c) | OAC_c => Mal_c (net) | 0.0035 | [0.0034, 0.0035] |
| Mal_c => OAC_c (exch) | 94.1199 | [91.7648, 96.0681] | |
| MALT | Mal_c => Mal_m (net) | −0.386 | [−0.3959, −0.3786] |
| Mal_m => Mal_c (exch) | 0.449 | [0.4340, 0.4637] | |
| FH (c) | Fum_c => Mal_c (net) | 0 | [0.0000, 0.0000] |
| Mal_c => Fum_c (exch) | 1.4231 | [1.4153, 1.4290] | |
| ME | Mal_c => CO2 + Pyr_m | 0.3895 | [0.3821, 0.3994] |
| ASPT | Asp_x => Asp_c (net) | 0.0569 | [0.0525, 0.0606] |
| Asp_c => Asp_x (exch) | 0.0013 | [0, 0.0067] | |
| AST | Asp_c => OAC_m (net) | 0.0522 | [0.0479, 0.0560] |
| OAC_m => Asp_c (exch) | 0.3136 | [0.2734, 0.3536] | |
| PC | CO2 + Pyr_m => OAC_m | 0.0963 | [0.0909, 0.1029] |
| BIOM | > bio | 0.0125 | [0.0123, 0.0126] |
| EXO | Gly => exo | 0.0018 | [0.0012, 0.0021] |
| EXO | Cit => exo | 0.0001 | [0.0001, 0.0001] |
| EXO | Ala => exo | 0.0013 | [0.0010, 0.0014] |
| EXO | Glu => exo | 0.0027 | [0.0020, 0.0030] |
| EXO | aKG => exo | 0.0001 | [0.0000, 0.0001] |
| EXO | Mal => exo | 0 | [0.0000, 0.0000] |
| EXO | Gln => exo | 0.0295 | [0.0210, 0.0345] |
| EXO | Lac => exo | 0.0713 | [0.0547, 0.0795] |
Figure 3: Exo-MFA predicts intracellular and exosomal packaging fluxes in CAFs.
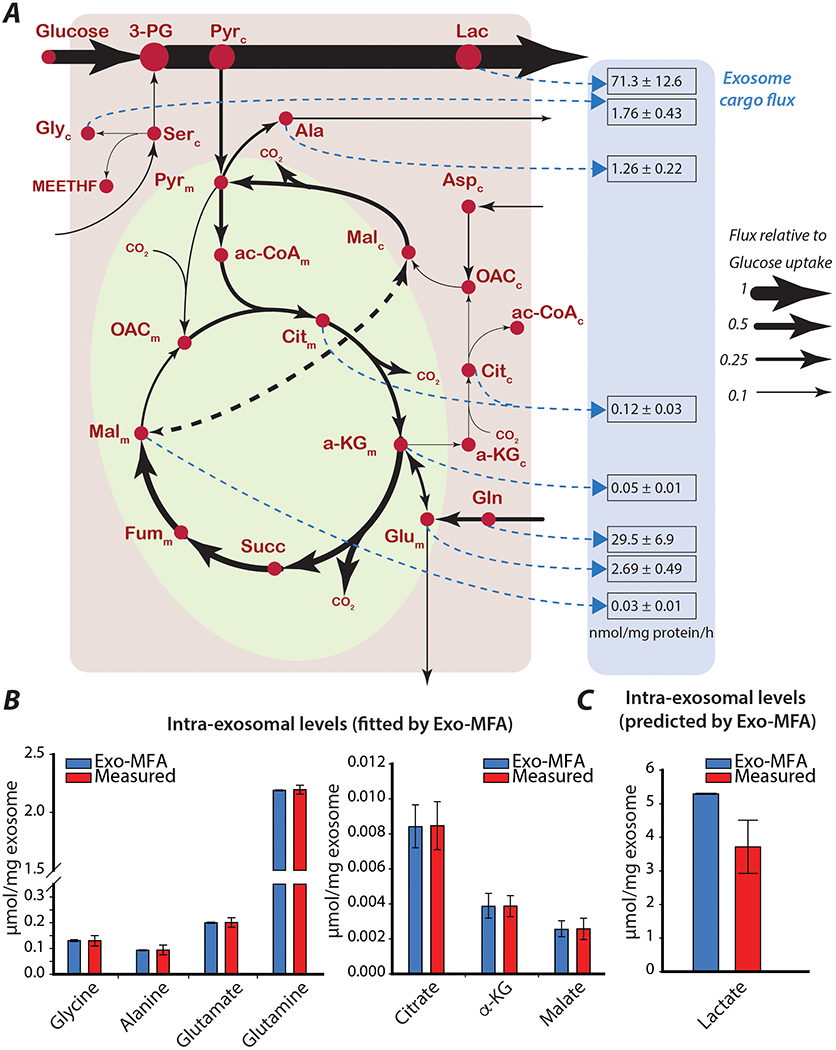
(A) Intracellular fluxes (solid black lines) and exosome packaging fluxes (dashed blue lines) in source cells (cancer-associated fibroblasts). Exosome packaging fluxes are reported as mean ± standard deviation (from Monte-Carlo simulations), and have the units [nmol/mg protein/h]. Thickness of lines are proportional to fluxes normalized to the glucose uptake rate. Metabolites with subscripts indicate which compartment they belong to (c: cytosol, m: mitochondria).
(B) Comparison of measured and estimated intraexosomal levels for metabolites whose measurements are used for fitting model estimates in the Exo-MFA algorithm.
(C) Comparison of measured and estimated intraexosomal level of lactate that is an unkown parameter predicted by Exo-MFA algorithm.
Measured data are presented as mean ± SEM (n≥3) from a representative batch of repeated experiments. Model estimates are obtained from best fit solutions. Error bars represent the upper and lower bounds of 95% confidence intervals.
The Exo-MFA algorithm is flexible in terms of measurements provided for intra-exosomal levels, i.e., not all metabolites need to be measured to be able to successfully predict packaging fluxes. However, to minimize the number of free parameters in the model and maintain narrow confidence intervals, it is necessary for sufficient measurements to be provided. Ideally, measurement for all the intra-exosomal metabolites considered in the model will provide the best solution. Our results demonstrate the potential of the Exo-MFA algorithm as an analytical tool with predictive potential. Successful implementation of the algorithm on the source cells then provides the necessary information such as isotopomer distribution and concentration of metabolites in exosome cargo, which is required to estimate intracellular and cargo release fluxes in the recipient cancer cells.
3.4. Stable-isotope labeling experiments prove that exosomes release cargo metabolites to replenish and rescue nutrient-deprived cancer cells
Metabolites present in exosome cargo are in their active form, therefore, the impact of exosome uptake on metabolism should be instantaneous and only be limited by the rate of incorporation of exosomes into the cells and release of cargo. Mechanisms of exosome internalization have not been extensively studied, thus, there is no consensus on a singular mechanism that governs the process of internalization. Potentially, multiple mechanisms of exosome internalization are active and dependent upon environmental and inherent factors of the recipient cells (Feng et al., 2010; Zhang et al., 2015). The factor relevant to the scope of this study is that exosome internalization rate has been shown to be proportional to their extracellular concentration but they reach an asymptotic value at a high concentration (Christianson et al., 2013). To trace the path of cargo released by CDEs into intracellular pools, we transferred cancer cells into media deprived of glutamine and phenylalanine and introduced labeled CDEs at a concentration of 200 μg/mL. This deprivation condition was chosen because it had the most detrimental effect on cancer cells’ proliferation that could be completely rescued by the addition of exosomes as compared to other deprivation conditions (data not shown). The rescue of cancer cell proliferation is potentially mediated via two separate mechanisms, (i) instantaneous replenishment of central carbon intermediates and amino acid precursors for proliferation and (ii) upregulation of reductive carboxylation via miRNA mediated inhibition of OXPHOS. Both these processes occur at different timescales since metabolic adaptations are within the order of minutes and much faster than miRNA inhibition which are in the order of hours as discussed in (Zhao et al., 2016). To focus on the rapid rescue of nutrient-deprived cancer cell proliferation via exosome cargo we sampled cancer cells at 3, 6, 12 and 24 hours (Figure 4A). Since the effect of CDEs on cancer cells is fast and cells may not reach metabolic steady-state within the timeframe of our experiments, we decided that sampling at multiple time points would allow us to capture the dynamic behavior of nutrient-deprivation and rescue by CDEs.
Figure 4: 13C-labeled tracer experiments in PDAC to detect cargo-derived metabolites in the tumor cells.
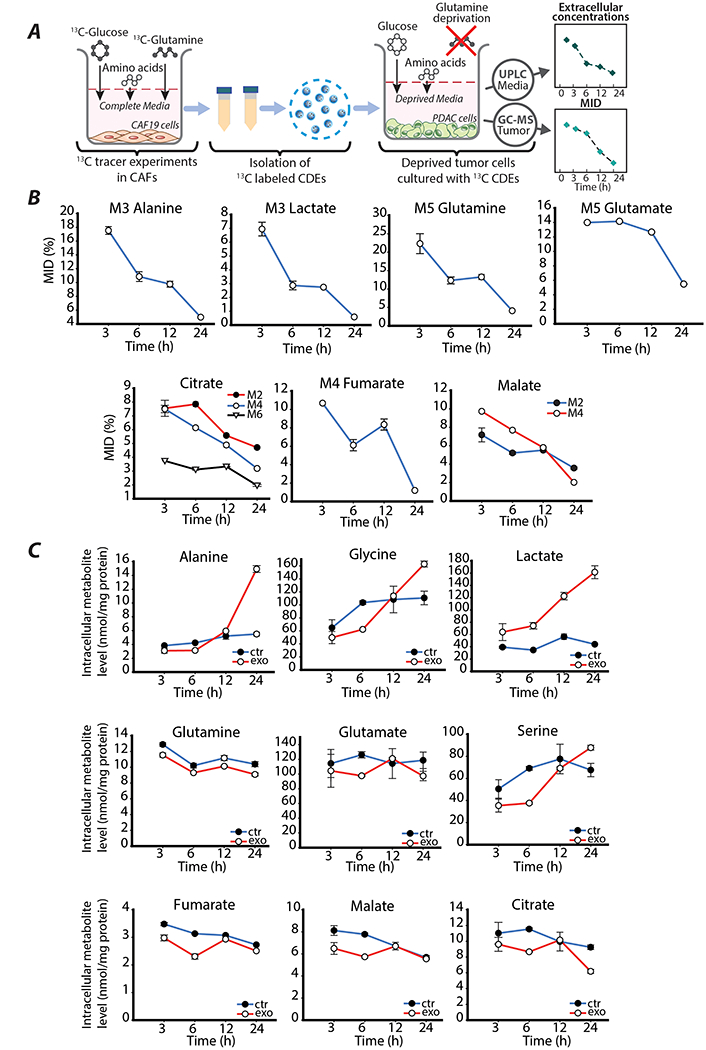
(A) Schematic of 13C-tracer labeling experiments using labeled CDEs. PDAC cells are cultured in glutamine and phenylalanine deprived media along with CDEs. Cells are sampled at 3, 6, 12 and 24 hours to analyzed using GC-MS to measure intracellular mass isotologue distributions and metabolite concentrations. Spent media is sampled at 3, 6, 12 and 24 hours to measure extracellular metabolite concentrations using UPLC.
(B) Dynamic measurements of mass isotopologue distribution (MID, %) of amino acids and TCA intermediates in nutrient-deprived PDAC cells treated with exosomes containing labeled metabolites. Data are reported as mean ± SEM, (n≥3) from a batch representative of repeated experiments.
(C) Dynamic intracellular levels of central carbon metabolites of nutrient-deprived PDAC cells cultured with or without exosomes. Data are reported as mean ± SEM, (n≥3) from a batch representative of repeated experiments.
After supplementing cancer cell media with labeled CDEs, the incorporation of 13C metabolite cargo into the cells occurred as soon as 3 hours as observed in Figure 4B. However, the fractions of heavy isotopologues of amino acids alanine and glutamine, and glycolytic product lactate declined rapidly and almost depleted by 24 hours. This strongly indicates, that either the nutrient-deprived cancer cells internalize CDEs rapidly until they are depleted in the media or rates of internalization reach very low steady-state values compared to the turnover of these metabolites. TCA cycle intermediates also show diminishing enrichments, but at a lower rate compared to amino acids due to the recycling of 13-C by multiple turns of the TCA cycle. Interestingly, comparing the total 13C-enrichment of glutamate in exosome-treated cancer cells, which is approximately 20% (Figure 4B) with enrichment of glutamate in CDEs (Figure 2B), which is 68% we can estimate that the direct contribution of glutamate from exosomes can be up to 30%. This indicates a significant contribution of exosome-derived metabolites to intracellular PDAC pools. However, estimating exosomal contribution using ratio of enrichment is inaccurate due to the multiple sources of 13C-metabolites in CDEs and recycling of 13C within the TCA cycle. Therefore, quantification of exosomal metabolite contribution is performed with the help of Exo-MFA detailed in the following sections. Nonetheless, the empirical data provide compelling evidence that metabolites from CDEs are incorporated into central carbon metabolism of cancer cells but are utilized rapidly. Furthermore, differences in intracellular levels amino acids and central carbon metabolites between control and CDE-treated cancer cells shows that metabolite cargo also has a strong effect on the metabolic fluxes (Figure 4C). Amino acids associated with the glycolysis pathway along with lactate showed a steady increase between 6 and 24 hours in cancer cells treated with exosomes as opposed to control conditions where concentrations stagnate by 24 hours. However, amino acids associated with TCA cycle (glutamate, glutamine) and TCA cycle metabolites (citrate, fumarate, malate) are cyclic, where initially they decrease between 3 and 6 hours, increase between 6 and 12 hours and fall again after 12 hours in cancer cells with CDEs but monotonically decrease in cells without CDEs. The reason for this non-monotonic trend may be due to a combination of factors affecting the cancer cell metabolism. Initially, cancer cells are adapting to their nutrient-stressed environment as indicated by the decrease between 3 and 6 hours, followed by a slight increase due to rescue via incorporation of metabolite cargo, and finally a decrease that could be attributed to either depletion of exosomes in the media or the initiation of exosome mediated inhibition of the mitochondrial oxidative metabolism described in (Zhao et al., 2016). Collectively, these data support our hypothesis that metabolite cargo has impactful albeit short-lived effect on cancer cell metabolism. Furthermore, the disparity in effect of CDEs on glycolytic pathways and TCA cycle is seen in the early stages of CDE internalization, and this disparity is perpetuated when regulatory effects of exosome cargo reach steady-state.
3.5. Exo-MFA predicts exosome uptake and cargo release fluxes in nutrient-deprived cancer cells that internalize CDEs
Cancer cells adapt to nutrient-deprived conditions by altering their metabolism to adapt to available carbon sources to maintain proliferation and other essential cellular functions. In this scenario, PDAC cell line MiaPaCa-2, previously in complete media are cultured in media deprived of glutamine and phenylalanine (control condition) and supplemented with CDEs (exosome-treated condition). PDAC cells adapt to nutrient-deprivation but their viability is decreased by 30% within the first 24 hours (Figure 1B), however the viability can be completely rescued by adding CDEs to the media. Our tracer experiments showed that free metabolites were incorporated into intracellular metabolite pools of PDAC cells, however the isotopic enrichment decreased over the course of the experiment. The Exo-MFA algorithm was employed to prove our hypothesis that exosome cargo can alter intracellular fluxes and the isotopic enrichment is not just the result of a short-lived tracer injection. Predictions of intracellular and cargo release fluxes were made at all the sampled time points to quantify cargo contribution and record dynamic changes in the metabolism (Figure 5A, Table 2). Exo-MFA predicted that the total flux from release of exosome cargo decreases almost linearly from 2.94 μmol/mg protein/h at 3 hours to 2.59 μmol/mg protein/h and 1.92 μmol/mg protein/h at 6 and 12 hours, respectively (Table 2). This was expected, since the availability of exosomes in the media is limited and internalization rates of exosomes have been shown to depend on exosome concentrations as discussed in Section 3.4. The most striking result from the Exo-MFA flux predictions was that TCA cycle fluxes changed significantly over the course of 12 hours; average TCA flux at 3 hours is 3.03 μmol/mg protein/h, which initially increases to 3.59 μmol/mg protein/h at 6 hours and finally decreases to 1.97 μmol/mg protein/h at 12 hours. Furthermore, to better understand the contribution of exosome derived exosomes to intracellular metabolism, we define the Exosomal Influx Contribution (EIC) and Metabolite Influx Contribution. The EIC can be defined as the fraction of exosomal cargo-derived flux entering a closed loop pathway (such as the TCA cycle) within the total flux entering that pathway. Conversely, MIC is defined for fluxes not derived from exosomes.
| (17) |
| (18) |
Figure 5: Exo-MFA predicts intracellular and cargo release flux in PDAC cells internalizing labeled CDEs.
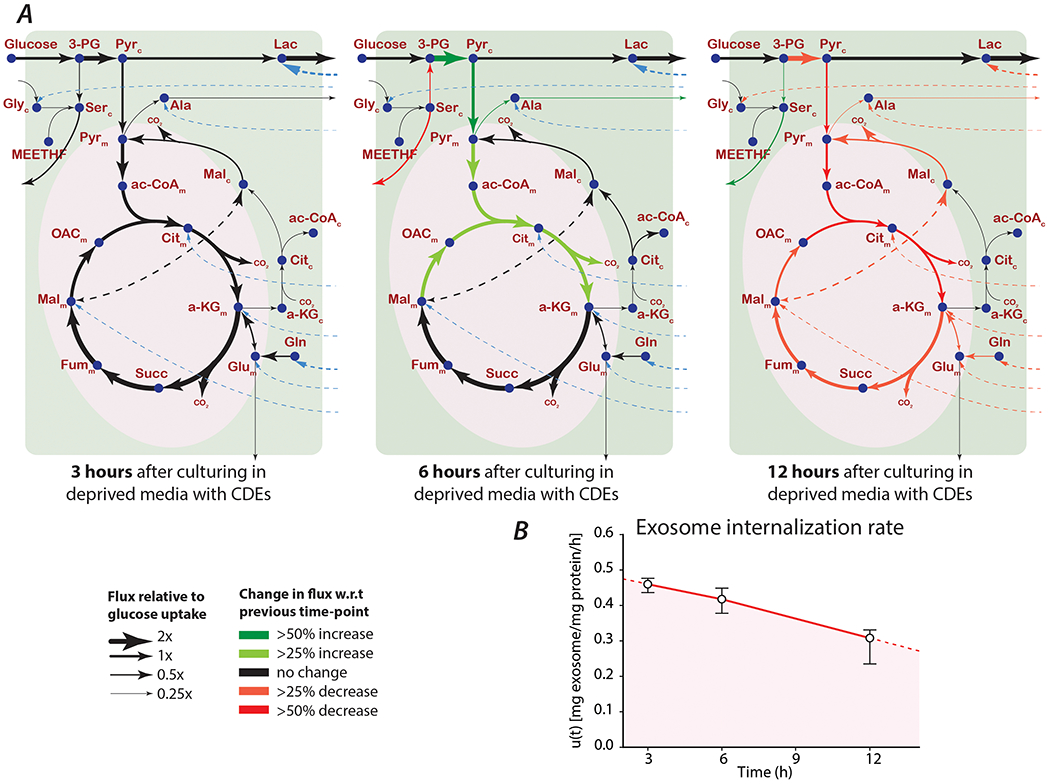
(A) Intracellular (solid black lines) and cargo release fluxes (dashed blue lines) in MiaPaCa-2 cells cultured in media deprived of glutamine and phenylalanine, but supplemented with 13C-labeled CDEs. Thickness of lines for each time point are proportional to their respective intracellular fluxes normalized to glucose uptake rate. Colored arrows indicate change in a flux with respect to the previous time-point.
(B) Rate of exosome internalization predicted by Exo-MFA. Data reported are obtained from best fit solutions. Error bars represent the upper and lower bounds of 95% confidence intervals.
Table 2:
Intracellular and cargo release fluxes in PDAC cells treated with 13C-labeled CDEs, sampled at 3,6 and 12 hours. Values reported are absolute intracellular fluxes at each time-point with the units μmol/mg protein/h. Negative fluxes represent net flux in the reverse direction of the corresponding reaction described under the Reaction column. SSR values are reported in the table and all fall within the range of acceptable values satisfying χ2(41) = [25.2, 60.6] at 95% confidence level.
| Reaction | T = 3h | SSR = 45.6 | T = 6h | SSR = 45.6 | T = 12h | SSR = 45.6 |
|---|---|---|---|---|---|---|
| Glc_x => Glc_c | 2.086 | [1.9611, 2.2812] | 2.3734 | [2.2514, 2.6397] | 2.086 | [1.9439, 2.7693] |
| Glc_c => PG3 + Pyr_c | 2.086 | [1.9611, 2.2809] | 2.3734 | [2.2514, 2.6394] | 2.0859 | [1.9436, 2.7693] |
| PG3 => Pyr_c | 1.42 | [1.3386, 1.5526] | 2.4659 | [2.2010, 2.6734] | 1.6909 | [1.4629, 2.1164] |
| PG3 => Ser_c (net) | 0.666 | [0.5790, 0.7715] | −0.0925 | [−0.2876, 0.3040] | 0.395 | [0.1377, 0.9959] |
| Ser_c => PG3 (exch) | 16.8468 | [16.7658, 16.9851] | 0.1565 | [0.0343, 0.2032] | 2.5477 | [2.4874, 2.5932] |
| Ser_c => Ser_x (net) | 1.0716 | [0.9837, 1.1741] | 0.305 | [0.1135, 0.7027] | 0.7784 | [0.5218, 1.3762] |
| Ser_x => Ser_c (exch) | 0.0057 | [0.0021, 0.0083] | 0.0181 | [0.0119, 0.0226] | 1.5056 | [1.4420, 1.5451] |
| Gly_x => Gly_c (net) | 0.3552 | [0.3516, 0.3552] | 0.3525 | [0.3507, 0.3558] | 0.3526 | [0.3493, 0.3573] |
| Gly_c => Gly_x (exch) | 0 | [0.0000, 14.9000] | 0.0225 | [0.0000, 0.0000] | 0 | [0.0000, 8.9400] |
| Ser_c => Gly_c + MEETHF | 0.0003 | [−0.0030, 0.0042] | 0.0003 | [−0.0146, 0.0191] | 0.0003 | [−0.0083, 0.0116] |
| CO2 + MEETHF => Gly_c | 0 | [−0.0030, 0.0039] | 0 | [−0.0149, 0.0191] | 0 | [−0.0086, 0.0116] |
| CO2 + Gly_c => Ser_c | 0.41 | [0.4014, 0.4151] | 0.4019 | [0.3737, 0.4384] | 0.3877 | [0.3680, 0.4077] |
| Pyr_m => Ala_c | 0.1734 | [0.1335, 0.1964] | 0.4296 | [0.1603, 0.6335] | 0.3056 | [−0.0182, 0.6055] |
| Ala_c => Ala_x | 0.2149 | [0.1702, 0.2381] | 0.4643 | [0.1943, 0.6681] | 0.3286 | [0.0018, 0.6276] |
| Pyr_c => Lac_c (net) | 1.8577 | [1.7963, 1.9605] | 2.2242 | [2.1346, 2.3202] | 2.5316 | [2.4522, 2.8325] |
| Lac_c => Pyr_c (exch) | 1.6518 | [1.1658, 2.2579] | 25.9784 | [10.8526, 18.7776] | 254.1638 | [0.0000, 11.9200] |
| Lac_c => Lac_x (net) | 3.5885 | [3.5739, 3.6192] | 3.7204 | [3.6514, 3.7715] | 3.6444 | [3.5709, 3.7751] |
| Lac_x => Lac_c (exch) | 15.5648 | [13.1057, 17.6678] | 28.1592 | [10.9315, 12.5699] | 23.3133 | [5.0779, 7.7057] |
| Pyr_c => Pyr_m | 1.6482 | [1.5118, 1.8649] | 2.615 | [2.3715, 2.9389] | 1.2451 | [1.0290, 1.9787] |
| Pyr_m => AcCoA_m + CO2 | 2.5691 | [2.4543, 2.7604] | 3.1751 | [3.0268, 3.4499] | 1.666 | [1.4674, 2.2857] |
| AcCoA_m + OAC_m => Cit_m | 2.5691 | [2.4543, 2.7604] | 3.1751 | [3.0268, 3.4499] | 1.666 | [1.4674, 2.2857] |
| Cit_m => CO2 + aKG_m | 2.5729 | [2.4585, 2.7642] | 3.1789 | [3.0310, 3.4532] | 1.6687 | [1.4703, 2.2874] |
| aKG_m => CO2 + Suc_m | 3.6591 | [3.5802, 3.7950] | 4.1611 | [4.0668, 4.3630] | 2.3889 | [2.2290, 2.8495] |
| Suc_m => Fum_m (net) | 3.6591 | [3.5802, 3.7950] | 4.1611 | [4.0668, 4.3630] | 2.3889 | [2.2290, 2.8495] |
| Fum_m => Suc_m (exch) | 0.939 | [0.9313, 0.9450] | 7.5454 | [7.5311, 7.5531] | 1.9576 | [1.9474, 1.9620] |
| Fum_m => Mal_m (net) | 3.6591 | [3.5802, 3.7950] | 4.1611 | [4.0668, 4.3630] | 2.3889 | [2.2290, 2.8495] |
| Mal_m => Fum_m (exch) | 0.9363 | [0.9271, 0.9423] | 23.9471 | [23.8635, 24.0191] | 5.277 | [5.2505, 5.2934] |
| Mal_m => OAC_m (net) | 2.5691 | [2.4543, 2.7604] | 3.1751 | [3.0268, 3.4499] | 1.666 | [1.4674, 2.2857] |
| OAC_m => Mal_m (exch) | 0.8183 | [0.8123, 0.8270] | 8.739 | [8.7296, 8.7487] | 0 | [0.0000, 8.9400] |
| Gln_c => Glu_m (net) | 1.0066 | [0.9542, 1.0430] | 0.9135 | [0.8261, 0.9822] | 0.673 | [0.5126, 0.7238] |
| Glu_m => Gln_c (exch) | 7.1893 | [6.2377, 7.9319] | 12.0978 | [7.6830, 16.0053] | 3.266 | [1.4250, 4.3577] |
| Glu_m => Glu_x (net) | 0.0098 | [0.0095, 0.0098] | 0.0097 | [0.0095, 0.0098] | 0.0097 | [0.0092, 0.0098] |
| Glu_x => Glu_m (exch) | 4.7653 | [4.3952, 4.9689] | 5.1728 | [4.1854, 5.8485] | 5.3709 | [3.6490, 5.9013] |
| Glu_m => aKG_m (net) | 1.0871 | [1.0284, 1.1258] | 0.9832 | [0.8886, 1.0591] | 0.7217 | [0.5465, 0.7775] |
| aKG_m => Glu_m (exch) | 2619 | [0.0000, 2.9800] | 44.0377 | [0.0000, 0.0000] | 21.4624 | [0.0000, 14.9000] |
| aKG_m => aKG_c (net) | 0.0027 | [0.0027, 0.0027] | 0.0027 | [0.0027, 0.0027] | 0.0027 | [0.0027, 0.0027] |
| aKG_c => aKG_m (exch) | 12.3423 | [12.2654, 12.3953] | 1.5888 | [1.5857, 1.5928] | 178.5361 | [176.0787, 180.5242] |
| CO2 + aKG_c => Cit_c | 0.0027 | [0.0027, 0.0027] | 0.0027 | [0.0027, 0.0027] | 0.0027 | [0.0027, 0.0027] |
| Cit_c => AcCoA_c + Mal_c | 0.0027 | [0.0027, 0.0027] | 0.0027 | [0.0027, 0.0027] | 0.0027 | [0.0027, 0.0027] |
| Mal_c => CO2 + Pyr_m | 1.0943 | [1.0350, 1.1330] | 0.9897 | [0.8943, 1.0662] | 0.7264 | [0.5501, 0.7825] |
| Mal_c => Mal_m (net) | −1.0916 | [−1.1303, −1.0323] | −0.987 | [−1.0636, −0.8916] | −0.7237 | [−0.7799, −0.5474] |
| Mal_m => Mal_c (exch) | 7.0304 | [6.9535, 7.0775] | 17.7872 | [17.7003, 17.8720] | 2.7855 | [2.6212, 2.8444] |
| bio | 0.0095 | [0.0092, 0.0095] | 0.0095 | [0.0092, 0.0098] | 0.0095 | [0.0092, 0.0098] |
| Lac_exo => Lac_c | 1.7308 | [1.6470, 1.7892] | 1.4961 | [1.3809, 1.5871] | 1.1127 | [0.8684, 1.1929] |
| Gln_exo => Gln_c | 1.0096 | [0.9572, 1.0460] | 0.9165 | [0.8290, 0.9855] | 0.676 | [0.5158, 0.7268] |
| Gly_exo => Gly_c | 0.0599 | [0.0566, 0.0620] | 0.0544 | [0.0492, 0.0584] | 0.04 | [0.0307, 0.0432] |
| Cit_exo => Cit_m | 0.0039 | [0.0036, 0.0042] | 0.0038 | [0.0033, 0.0042] | 0.0027 | [0.0021, 0.0030] |
| Ala_exo => Ala_c | 0.0471 | [0.0405, 0.0492] | 0.0404 | [0.0352, 0.0447] | 0.0287 | [0.0218, 0.0316] |
| Glu_exo => Glu_m | 0.0939 | [0.0873, 0.0963] | 0.0832 | [0.0757, 0.0903] | 0.0621 | [0.0471, 0.0668] |
| aKG_exo => aKG_m | 0.0018 | [0.0018, 0.0018] | 0.0016 | [0.0015, 0.0018] | 0.0012 | [0.0009, 0.0012] |
| Mal_exo => Mal_m | 0.0012 | [0.0012, 0.0012] | 0.0011 | [0.0009, 0.0012] | 0.0008 | [0.0006, 0.0009] |
Where, vEXO is the sum of fluxes from exosomal cargo of TCA metabolites, and vPDH is the net flux of pyruvate flux into TCA cycle. vTCA(in) represents the net total influx of all metabolites into the TCA cycle. We see that the exosomal contribution, i.e. EIC to TCA is 30% while the MIC of pyruvate to TCA is 70%. At 6 hours, this balance shifts towards pyruvate when MIC increases to 28%. There is also an increase in absolute TCA fluxes at 12 hours is due to a temporary increase in glucose contribution to the TCA represented by the pyruvate dehydrogenase flux that changes from 2.56 μmol/mg protein/h to 3.17 μmol/mg protein/h between the 3 and 6-hour time-points (Figure 5A, Table 2). However, both the pyruvate flux to TCA and the cargo release fluxes decreased significantly by 12 hours, cumulatively leading to reduced TCA cycle fluxes but interestingly the EIC increases to 30% signaling the reliance of TCA cycle on exosomal cargo. Presumably, the changes in TCA cycle fluxes are linked with high lactate levels and lactate efflux in PDAC cells. As seen in Figure 4C, intracellular lactate concentrations increased significantly in presence of CDEs, however the lactate secretion rate did not change commensurately. This would suggest that there is a gain in lactate production rates, which can either come from intracellular pyruvate via lactate dehydrogenase (LDH) or from the metabolite cargo of CDEs. Initially, when the cargo release fluxes are high, pyruvate is diverted to the TCA cycle (Figure 5A, 6 hours). However, when exosomes become limited and cargo fluxes drop, pyruvate is redirected to produce lactate. There are several reasons for cancer cells maintaining high lactate concentrations, lactate levels have been shown to be correlated with resistance to radiotherapy, metastasis and poor patient prognosis (Doherty and Cleveland, 2013; Hirschhaeuser et al., 2011). However, diagnosing the cause for high lactate levels in this scenario are beyond the scope of this study. Interestingly, the non-monotonic trend of TCA fluxes mimics the trend observed in intracellular concentrations of TCA intermediates (Figure 4C). Although, the EIC estimated by Exo-MFA is a novel quantification that reflects the rate of exosomal concentration, the significance of exosomal contribution can also be explained through a simple volumetric comparison. Exosome volume is estimated based on density reported in studies characterizing exosomes (Graner et al., 2009; Street et al., 2012) and total amount of exosomes added to a well of cancer cells in a 6-well plate. We find that 400 μg of exosomes could volumetrically contribute up to 330 nL compared to 720 nL of cytosolic volume of an average of 300,000 cancer cells in a well. This indicates that exosomes and its cargo can contribute significantly to cancer cells.
Exo-MFA was also able to predict the rates of exosome internalization, which can be challenging to determine empirically (Figure 5B). It is important to note that rate of internalization is not the same as exosome uptake, because the process of releasing metabolite cargo goes through several steps. Hence, the rate of internalization is a representative rate for that is determined by a rate-limiting step in the process. Like the cargo release fluxes, exosome internalization expectedly decreased over the course of the experiment almost linearly. It is interesting to note that upon extrapolating and integrating the curve describing the internalization rate, we can calculate the total amount of exosomes internalized by PDAC cells till the rate drops to zero. This value is estimated is approximately 464 μg exosomes per well of PDAC cells, which is slightly higher than the amount of exosomes used in the experiment, i.e. 400 μg. Collectively, predictions from the Exo-MFA on recipient PDAC cells suggest that metabolite cargo from CDEs contribute to approximately one-third of the TCA cycle fluxes and can also markedly influence fluxes in both the glycolysis and TCA cycle pathways. Therefore, metabolite cargo of CDEs is responsible, at least in part, for the rescue of cancer cell proliferation and maintenance of their metabolic fluxes by providing intracellular lactate and TCA cycle intermediates.
4. CONCLUSION
The field of cancer metabolism has progressed significantly over the past decade with respect to technological advancements and the scale of systems being studied (DeBerardinis and Chandel, 2016). Stable-labeled isotope tracer techniques have improved and become more accessible, while computational tools for analyzing empirical data have progressed commensurately. The role of TME has been deemed to be of utmost importance in tumor survival, growth and metastasis. Only recently, our group revealed that CAF-secreted extracellular vesicles were mediators of metabolic regulation by carrying free metabolites (Zhao et al., 2016), thus discovering new cargo carried by secreted vesicles. To address the gap in techniques that provide analytical insight into multicellular metabolic interactions we have introduced the Exo-MFA algorithm, a platform that integrates experimental and computational stable-isotope tracer techniques as an improvement over the current 13C-MFA. We successfully demonstrate the potential of the Exo-MFA algorithm by predicting (i) intracellular fluxes and packaging of metabolite cargo in CAFs, (ii) exosome internalization rates in PDAC cells and (iii) cargo release fluxes and their contribution to intracellular PDAC metabolites. Cargo in extracellular vesicles have emerged as indicators of cellular environments and biomarkers for disease pathology (Nawaz et al., 2014; Verma et al., 2015; Zöller, 2013). Therefore, knowledge about the biogenesis of vesicles and packaging of cargo has been sought after to help uncover mechanisms of cellular communication. Currently, most of the attention in the field of secretory vesicles has been devoted to characterizing cargo that confers intercellular communication via signaling pathways, i.e. proteins, miRNA, RNA and DNA (Abels and Breakefield, 2016; Colombo et al., 2014). Exo-MFA sets a stage for investigating exosomes with differential metabolite cargo under various conditions, thereby setting a new precedent in our understanding of biogenesis of extracellular vesicles.
The experimental protocols described herein use tracers that are already widely used and the Exo-MFA algorithm is flexible to accommodate system-specific inputs and assumptions. Exo-MFA is applicable to systems where microvesicle transport is involved, but is also a step forward in developing 13C-MFA techniques for in vitro co-culture systems. It could potentially be applied to studying multicellular systems where metabolic cross-talk between cell populations occurs via conditioned media.
It is to be noted that in study presented here we cultured CAFs under labeled tracer conditions for one passage. However, complete labeling may require cultures with labeled tracer for multiple passages. Thus, generating and isolating enough labeled CDEs for performing experiments require large number of patient-derived CAFs that are cultured in 13C-labeled media for long durations. Furthermore, the design of our in vitro study may not reflect the long-term effects of CDEs on PDAC metabolism expected in vivo. We would require several-fold more CDEs than what we used in the current study. PDAC cells internalize exosomes rapidly, leading to low isotopic enrichments within 24 hours. To test whether replenishing exosomes in the extracellular media could affect isotopic enrichments, we cultured two batches of PDAC cells under nutrient-deprivation with 13C-labeled CDEs. Both batches of PDAC cells were supplied CDEs at the beginning of deprivation condition, but only one out of the two batches were replenished with CDEs 12 hours after deprivation. The cells were sampled at 6, 12 and 24 hours and their isotopic enrichments were measured (Figure 6). Expectedly, we observed that isotopic enrichments of most metabolites increased at the 24-hour time-point in PDAC cells that were supplemented with CDEs at 12 hours. These results strongly suggest that effect of metabolite cargo on PDAC metabolism can be sustained over longer period by maintaining a steady supply of exosomes. This experimental design could then mimic the in vivo interactions more closely.
Figure 6.
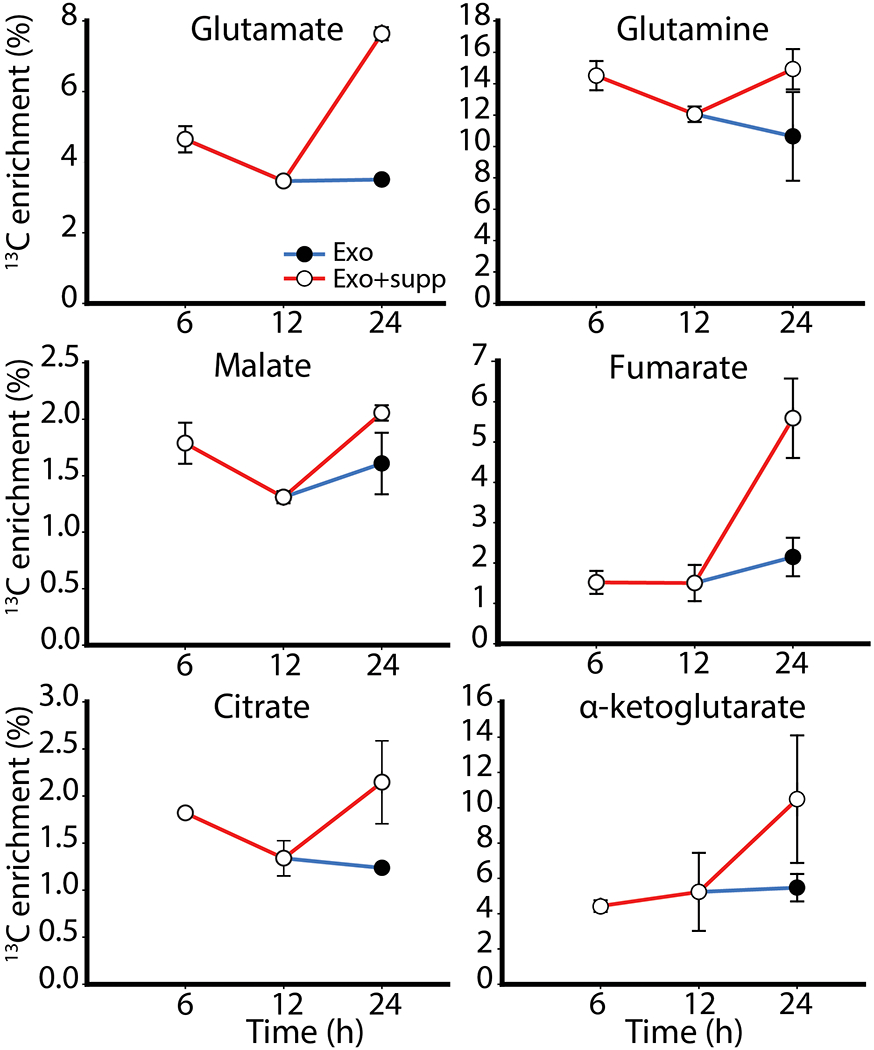
Fractional enrichment of 13C-labeled metabolites in PDAC cells treated with CDEs under nutrient deprivation. Two timelines were established to ascertain utilization of exosomes; both batches of cells were given CDEs at the beginning of the experiment, but one batch was supplemented with additional CDEs at 12h (Exo+supp).
With advances in technological and scientific aspects in the field of secretory vesicles and tumor microenvironment, we envision that Exo-MFA can be improved to become a powerful tool for investigating role of metabolic interactions between TME components. In the future, measuring the uptake kinetics of exosomes by analyzing spent media of cancer cells and predicting internalization rates with Exo-MFA may help reveal the true mechanism of exosome uptake by cells. Furthermore, if multiple mechanisms of uptake exist then we may be able to identify extracellular conditions that regulate them with the Exo-MFA platform. In addition to free metabolite cargo, there is a significant amount of protein and lipids present in exosomes which could also contribute to cancer cell metabolism to a large extent. Such metabolic contributions should be considered in the future, for improving the experimental and modeling paradigm of Exo-MFA. Additionally, algorithmic improvements like implementing the EMU technique (Antoniewicz et al., 2007) may further improve computational efficiency and enable development of dynamic Exo-MFA that can be applied to more complex metabolic models that consider multifold cell-specific functions and thermodynamic constraints (Avila-Elchiver et al., 2012; Nagrath et al., 2010, 2007; Wang et al., 2012). Despite the caveats, Exo-MFA has the potential to improve our understanding of tumor development in the context of the TME and advance the field of cancer metabolism.
APPENDIX A. Formulation of 13C-MFA used in Exo-MFA
Flux analysis was performed using a MATLAB-based software developed within our lab using the KNITRO® (Artelys, Paris, France) optimization toolbox. 13-carbon atom transitions were modeled according to the Atom Mapping Matrix (AMM) and Isotopomer Mapping Matrix (IMM) method (Schmidt et al., 1997; Wiechert et al., 1997; Wiechert and de Graaf, 1997; Zupke and Stephanopoulos, 1994). Reversible reactions were modeled as two irreversible forward and reverse fluxes (vfwd,vrev) and transformed into net and exchange fluxes (vnet,vxch).
| (A1) |
| (A2) |
Mass balance of intracellular metabolites is applied assuming pseudo steady-state because most intracellular metabolites have a high turnover rate of intracellular pools. The stoichiometric matrix S, is created according to metabolic reactions considered and the equation for mass balance for metabolites can be represented as Equation (A3).
| (A3) |
Intracellular fluxes are replaced by free flux parameters, u, by choosing a suitable null basis for the stoichiometric matrix (Equations A4–A5). This takes advantage of the linear dependence between fluxes to reduce the number of unknown parameters.
| (A4) |
| (A5) |
Since exchange fluxes are unbounded, they are transformed to normalized exchange fluxes according to Equation (A6) so that they can be bound between [0,1].
| (A6) |
β is a constant chosen within the order of magnitude of glucose uptake flux. Since we normalize all net fluxes with respect to glucose uptake we choose a value of β = 2. AMMs and IMMs are used to generate carbon atom balances for each reactant-product in every reaction in the metabolic network. In addition to the flux variables v, isotopomer distribution vectors (IDVs, represented by vector y) are used to describe mass isotopomer fractions of intracellular metabolites.
| (A7) |
The isotopomer mass balances derived using IMMs are non-linear since the rate of production of isotopomers is proportional to the flux and mass isotopomers of precursor metabolites. The mass balance of a metabolite B will therefore being produced in a reaction A → B + C is give by Equation (A8).
| (A8) |
Assuming measurements are made after isotopic steady-state is reached, the general form of the isotopomer mass balance equations for metabolite i, over all N reactions can be represented as
| (A9) |
To solve the flux distribution in metabolic network, an optimization problem can be defined to minimize deviation between measured MIDs and simulated IDVs that satisfies all constraints described by Equations (A3,A4,A5,A8,A9). Deviation is defined as the variance-weighted sum of square of residual errors and the optimization problem is defined as following.
| (A10a) |
| (A10b) |
| (A10c) |
| (A10d) |
Here is the covariance matrix of MID measurements, σ is standard deviation of measured extracellular fluxes and M is the transformation matrix to convert IDVs to MIDs. We convert the IDV to respective mass isotopologue distributions (MIDs) to compute error between model and measurements from GC-MS. Solving the optimization problem described by Equations (A10) to satisfactory convergence will result in a solution with intracellular fluxes that satisfy all the physical constraints and empirical measurements.
APPENDIX B. Metabolic reaction model for CAF19 (source cells) and PDAC (recipient cells) with the respective carbon atom transitions
Metabolic reactions that are included in the model for CAFs are described in Table B1. In addition to these reactions, the model contains exosome cargo packaging fluxes for lactate, glutamine, glutamate, glycine, alanine, α-ketoglutarate, citrate and malate. The model for PDAC cells is modified to exclude pyruvate carboxylase (PC), aspartate transaminase (AST) and aspartate transporter (ASPT) reactions. Further, instead of packaging fluxes, the PDAC model contains cargo release fluxes for the same metabolite cargo described for CAFs. Biomass equation was derived from cellular compositions provided in (Sheikh et al., 2005) and the biomass flux was fit to the respective growth rates.
Metabolites:
3-PG, 3-phosphoglycerate; AcCoA_c, cytosolic Acetyl-Coenzyme A; AcCoA_m, mitochondrial Acetyl-Coenzyme A; aKG_m, mitochondrial α-ketoglutarate; Ala_c, alanine; Ala_x, extracellular alanine; Asp_c, aspartate; Asp_x, extracellular aspartate; Cit_c, cytosolic citratre; Cit_m, mitochondrial citratre; CO2, carbon dioxide; Fum_c, cytosolic fumarate; Fum_m, mitochondrial fumarate; Glc_c, glucose; Glc_x, extracellular glucose; Gln_c, glutamine; Gln_x, extracellular glutamine; GLS, glutaminase; Glu_m, glutamate; Glu_x, extracellular glutamate; Gly_c, glycine; Gly_x, extracellular glycine; Lac_c, lactate; Lac_x, extracellular lactate; Mal_c, cytosolic malate; Mal_m, mitochondrial malate; MEETHF, methylene tetrahydrofuran; OAC_c, cytosolic oxaloacetate; OAC_m, mitochondrial oxaloacetate; Pyr_c, cytosolic pyruvate; Pyr_m, mitochondrial pyruvate; Ser_c, serine; Ser_x, extracellular serine; Suc_m, succinate.
Enzymes:
ACLY, ATP-citrate lyase; AST, aspartate transaminase; CS, citrate synthase; IDH (c), cytosolic isocitrate dehydrogenase; IDH (m), mitochondrial isocitrate dehydrogenase; LDH, lactate dehydrogenase; MDH, malate dehydrogenase; ME, malic enzyme; PDH, pyruvate dehydrogenase; PST, serine transaminase; PC, pyruvate carboxylase; SHMT, serine hydroxymethyl transferase; SDH, succinate dehydrogenase.
Transporters:
GLUT, glucose transport; SERT, serine transport; GLYT, glycine transport; ALATR, alanine transport; MCT, lactate transport; PYRT, pyruvate transport; GLUTR, glutamate transport; aKGT, alpha-KG transport; MALT, malate transport; LACE, lactate exosome flux; GLNE, glutamine exosome flux; GLYE, glycine exosome fluxe; CITE, citrate exosome flux; ALAE, alanine exosome flux; GLUE, glutamate exosome flux; aKGE, alpha-KG exosome flux; MALE, malate exosome flux.
Table B1:
Reactions in metabolic network for CAFs.
| Name | Reaction | Atom transition |
|---|---|---|
| GLUT | Glc_x ⇒ Glc_c | abcdef>abcdef |
| GLYC | Glc_c ⇒ 3-PG + Pyr_c | abcdef>abc+fed |
| GLYC | 3-PG ⇒ Pyr_c | abc>abc |
| PST | 3-PG ⇔ Ser_c | abc>abc |
| SERT | Ser_c ⇔ Ser_x | abc>abc |
| SHMT | Ser_c ⇔ Gly_c + MEETHF | abc>ab+c |
| GLYS | MEETHF + CO2 ⇒ Gly_c | a+b>ab |
| LDH | Pyr_c ⇔ Lac_c | abc>abc |
| MCT | Lac_c ⇔ Lac_x | abc>abc |
| ALAT | Pyr_m ⇒ Ala_c | abc>abc |
| ALATR | Ala_c ⇒ Ala_x | abc>abc |
| PYRT | Pyr_c ⇒ Pyr_m | abc>abc |
| PDH | Pyr_m ⇒ AcCoA_m + CO2 | abc>bc+a |
| CS | AcCoA_m + OAC_m ⇒ Cit_m | ab+cdef>fedbac |
| IDH (m) | Cit_m ⇒ aKG_m + CO2 | abcdef>abcde+f |
| OGDH | aKG_m ⇒ 0.5*Suc_m + 0.5*Suc_m + CO2 | abcde>bcde+edcb+a |
| SDH | 0.5*Suc_m + 0.5*Suc_m ⇔ 0.5*Fum_m + 0.5*Fum_m | abcd+dcba>abcd+dcba |
| FH | 0.5*Fum_m + 0.5*Fum_m ⇔ Mal_m | abcd+dcba>abcd |
| MDH | Mal_m ⇔ OAC_m | abcd>abcd |
| GLNT | Gln_x ⇒ Gln_c | abcde>abcde |
| GLS | Gln_c ⇔ Glu_m | abcde>abcde |
| GLUTR | Glu_m ⇔ Glu_x | abcde>abcde |
| GDH | Glu_m ⇔ aKG_m | abcde>abcde |
| aKGT | aKG_m ⇔ aKG_c | abcde>abcde |
| IDH (c) | aKG_c + CO2 ⇒ Cit_c | abcde+f>abcdef |
| ACLY | Cit_c ⇒ OAC_c + AcCoA_c | abcdef>fcba+ed |
| ASPT | Asp_x ⇔ Asp_c | abcd>abcd |
| AST | Asp_c ⇔ OAC_m | abcd>abcd |
| MDH (c) | OAC_c ⇔ Mal_c | abcd>abcd |
| ME | Mal_c ⇒ Pyr_m + CO2 | abcd>abc,d |
| PC | Pyr_m + CO2 ⇒ OAC_m | abc+d>abcd |
| MALT | Mal_c ⇔ Mal_m | abcd>abcd |
| FH (c) | 0.5*Fum_c + 0.5*Fum_c ⇔ Mal_c | abcd+dcba>abcd |
| BIOM | 0.6*Ala_c + 0.37*Asp_c + 0.322*Gln_c + 0.386*Glu_m + 0.55*Gly_c + 0.43*Ser_c + 0.0265*MEETHF + 0.28*AcCoA_c + 0.0097*Glc_c ⇒ bio |
Footnotes
“The authors disclose no potential conflicts of interest.”
REFERENCE
- Abels ER, Breakefield XO, 2016. Introduction to Extracellular Vesicles: Biogenesis, RNA Cargo Selection, Content, Release, and Uptake. Cell. Mol. Neurobiol 36, 301–312. doi: 10.1007/s10571-016-0366-z [DOI] [PMC free article] [PubMed] [Google Scholar]
- Antoniewicz MR, Kelleher JK, Stephanopoulos G, 2007. Elementary Metabolite Units (EMU): a novel framework for modeling isotopic distributions. Metab. Eng 9, 68–86. doi: 10.1016/j.ymben.2006.09.001 [DOI] [PMC free article] [PubMed] [Google Scholar]
- Avila-Elchiver M, Nagrath D, Yarmush ML, 2012. Optimality and thermodynamics determine the evolution of transcriptional regulatory networks. Mol. Biosyst 8, 511–530. doi: 10.1039/c1mb05177f [DOI] [PMC free article] [PubMed] [Google Scholar]
- Bellance N, Pabst L, Allen G, Rossignol R, Nagrath D, 2012. Oncosecretomics coupled to bioenergetics identifies α-amino adipic acid, isoleucine and GABA as potential biomarkers of cancer: Differential expression of c-Myc, Oct1 and KLF4 coordinates metabolic changes. Biochim. Biophys. Acta 1817, 2060–2071. doi: 10.1016/j.bbabio.2012.07.004 [DOI] [PubMed] [Google Scholar]
- Bennett BD, Yuan J, Kimball EH, Rabinowitz JD, 2008. Absolute quantitation of intracellular metabolite concentrations by an isotope ratio-based approach. Nat. Protoc 3, 1299–1311. doi: 10.1038/nprot.2008.107 [DOI] [PMC free article] [PubMed] [Google Scholar]
- Bordbar A, Monk JM, King ZA, Palsson BO, 2014. Constraint-based models predict metabolic and associated cellular functions. Nat. Rev. Genet 15, 107–120. doi: 10.1038/nrg3643 [DOI] [PubMed] [Google Scholar]
- Caneba CA, Bellance N, Yang L, Pabst L, Nagrath D, 2012. Pyruvate uptake is increased in highly invasive ovarian cancer cells under anoikis conditions for anaplerosis, mitochondrial function, and migration. Am. J. Physiol. - Endocrinol. Metab 303, E1036–E1052. doi: 10.1152/ajpendo.00151.2012 [DOI] [PubMed] [Google Scholar]
- Chen F, Zhuang X, Lin L, Yu P, Wang Y, Shi Y, Hu G, Sun Y, 2015. New horizons in tumor microenvironment biology: challenges and opportunities. BMC Med. 13, 45. doi: 10.1186/s12916-015-0278-7 [DOI] [PMC free article] [PubMed] [Google Scholar]
- Christianson HC, Svensson KJ, Kuppevelt TH van, Li J-P, Belting M, 2013. Cancer cell exosomes depend on cell-surface heparan sulfate proteoglycans for their internalization and functional activity. Proc. Natl. Acad. Sci 110, 17380–17385. doi: 10.1073/pnas.1304266110 [DOI] [PMC free article] [PubMed] [Google Scholar]
- Chu GC, Kimmelman AC, Hezel AF, DePinho RA, 2007. Stromal biology of pancreatic cancer. J. Cell. Biochem 101, 887–907. doi: 10.1002/jcb.21209 [DOI] [PubMed] [Google Scholar]
- Colombo M, Raposo G, Théry C, 2014. Biogenesis, Secretion, and Intercellular Interactions of Exosomes and Other Extracellular Vesicles. Annu. Rev. Cell Dev. Biol 30, 255–289. doi: 10.1146/annurev-cellbio-101512-122326 [DOI] [PubMed] [Google Scholar]
- Costa-Silva B, Aiello NM, Ocean AJ, Singh S, Zhang H, Thakur BK, Becker A, Hoshino A, Mark MT, Molina H, Xiang J, Zhang T, Theilen T-M, García-Santos G, Williams C, Ararso Y, Huang Y, Rodrigues G, Shen T-L, Labori KJ, Lothe IMB, Kure EH, Hernandez J, Doussot A, Ebbesen SH, Grandgenett PM, Hollingsworth MA, Jain M, Mallya K, Batra SK, Jarnagin WR, Schwartz RE, Matei I, Peinado H, Stanger BZ, Bromberg J, Lyden D, 2015. Pancreatic cancer exosomes initiate pre-metastatic niche formation in the liver. Nat. Cell Biol 17, 816–826. doi: 10.1038/ncb3169 [DOI] [PMC free article] [PubMed] [Google Scholar]
- DeBerardinis RJ, Chandel NS, 2016. Fundamentals of cancer metabolism. Sci. Adv 2. doi: 10.1126/sciadv.1600200 [DOI] [PMC free article] [PubMed] [Google Scholar]
- Doherty JR, Cleveland JL, 2013. Targeting lactate metabolism for cancer therapeutics. J. Clin. Invest 123, 3685–3692. doi: 10.1172/JCI69741 [DOI] [PMC free article] [PubMed] [Google Scholar]
- D’Souza-Schorey C, Clancy JW, 2012. Tumor-derived microvesicles: shedding light on novel microenvironment modulators and prospective cancer biomarkers. Genes Dev. 26, 1287–1299. doi: 10.1101/gad.192351.112 [DOI] [PMC free article] [PubMed] [Google Scholar]
- Feig C, Jones JO, Kraman M, Wells RJB, Deonarine A, Chan DS, Connell CM, Roberts EW, Zhao Q, Caballero OL, Teichmann SA, Janowitz T, Jodrell DI, Tuveson DA, Fearon DT, 2013. Targeting CXCL12 from FAP-expressing carcinoma-associated fibroblasts synergizes with anti–PD-L1 immunotherapy in pancreatic cancer. Proc. Natl. Acad. Sci 110, 20212–20217. doi: 10.1073/pnas.1320318110 [DOI] [PMC free article] [PubMed] [Google Scholar]
- Feng D, Zhao W-L, Ye Y-Y, Bai X-C, Liu R-Q, Chang L-F, Zhou Q, Sui S-F, 2010. Cellular Internalization of Exosomes Occurs Through Phagocytosis. Traffic 11, 675–687. doi: 10.1111/j.1600-0854.2010.01041.x [DOI] [PubMed] [Google Scholar]
- Ghesquière B, Wong BW, Kuchnio A, Carmeliet P, 2014. Metabolism of stromal and immune cells in health and disease. Nature 511, 167–176. doi: 10.1038/nature13312 [DOI] [PubMed] [Google Scholar]
- Hansen JM, Coleman RL, Sood AK, 2016. Targeting the tumour microenvironment in ovarian cancer. Eur. J. Cancer 56, 131–143. doi: 10.1016/j.ejca.2015.12.016 [DOI] [PMC free article] [PubMed] [Google Scholar]
- Hirschhaeuser F, Sattler UGA, Mueller-Klieser W, 2011. Lactate: A Metabolic Key Player in Cancer. Cancer Res. 71, 6921–6925. doi: 10.1158/0008-5472.CAN-11-1457 [DOI] [PubMed] [Google Scholar]
- Hosios AM, Hecht VC, Danai LV, Johnson MO, Rathmell JC, Steinhauser ML, Manalis SR, Vander Heiden MG, 2016. Amino Acids Rather than Glucose Account for the Majority of Cell Mass in Proliferating Mammalian Cells. Dev. Cell 36, 540–549. doi: 10.1016/j.devcel.2016.02.012 [DOI] [PMC free article] [PubMed] [Google Scholar]
- Huang L, Kim D, Liu X, Myers CR, Locasale JW, 2014. Estimating Relative Changes of Metabolic Fluxes. PLOS Comput Biol 10, e1003958. doi: 10.1371/journal.pcbi.1003958 [DOI] [PMC free article] [PubMed] [Google Scholar]
- Jiang L, Shestov AA, Swain P, Yang C, Parker SJ, Wang QA, Terada LS, Adams ND, McCabe MT, Pietrak B, Schmidt S, Metallo CM, Dranka BP, Schwartz B, DeBerardinis RJ, 2016. Reductive carboxylation supports redox homeostasis during anchorage-independent growth. Nature 532, 255–258. doi: 10.1038/nature17393 [DOI] [PMC free article] [PubMed] [Google Scholar]
- Lewis CA, Parker SJ, Fiske BP, McCloskey D, Gui DY, Green CR, Vokes NI, Feist AM, Vander Heiden MG, Metallo CM, 2014. Tracing Compartmentalized NADPH Metabolism in the Cytosol and Mitochondria of Mammalian Cells. Mol. Cell 55, 253–263. doi: 10.1016/j.molcel.2014.05.008 [DOI] [PMC free article] [PubMed] [Google Scholar]
- Nagrath D, Avila-Elchiver M, Berthiaume F, Tilles AW, Messac A, Yarmush ML, 2010. Soft constraints-based multiobjective framework for flux balance analysis. Metab. Eng 12, 429–445. doi: 10.1016/j.ymben.2010.05.003 [DOI] [PMC free article] [PubMed] [Google Scholar]
- Nagrath D, Avila-Elchiver M, Berthiaume F, Tilles AW, Messac A, Yarmush ML, 2007. Integrated Energy and Flux Balance Based Multiobjective Framework for Large-Scale Metabolic Networks. Ann. Biomed. Eng 35, 863–885. doi: 10.1007/s10439-007-9283-0 [DOI] [PubMed] [Google Scholar]
- Nawaz M, Camussi G, Valadi H, Nazarenko I, Ekström K, Wang X, Principe S, Shah N, Ashraf NM, Fatima F, Neder L, Kislinger T, 2014. The emerging role of extracellular vesicles as biomarkers for urogenital cancers. Nat. Rev. Urol 11, 688–701. doi: 10.1038/nrurol.2014.301 [DOI] [PubMed] [Google Scholar]
- Penfornis P, Vallabhaneni KC, Whitt J, Pochampally R, 2016. Extracellular vesicles as carriers of microRNA, proteins and lipids in tumor microenvironment. Int. J. Cancer 138, 14–21. doi: 10.1002/ijc.29417 [DOI] [PMC free article] [PubMed] [Google Scholar]
- Quek L-E, Wittmann C, Nielsen LK, Krömer JO, 2009. OpenFLUX: efficient modelling software for 13C-based metabolic flux analysis. Microb. Cell Factories 8, 25. doi: 10.1186/1475-2859-8-25 [DOI] [PMC free article] [PubMed] [Google Scholar]
- Rupp C, Scherzer M, Rudisch A, Unger C, Haslinger C, Schweifer N, Artaker M, Nivarthi H, Moriggl R, Hengstschläger M, Kerjaschki D, Sommergruber W, Dolznig H, Garin-Chesa P, 2015. IGFBP7, a novel tumor stroma marker, with growth-promoting effects in colon cancer through a paracrine tumor-stroma interaction. Oncogene 34, 815–825. doi: 10.1038/onc.2014.18 [DOI] [PubMed] [Google Scholar]
- Salimian B, Caneba C, Nowicka A, Nabiyar AW, Liu X, Chen K, Klopp A, Nagrath D, 2014. Nitric oxide mediates metabolic coupling of omentum-derived adipose to ovarian and endometrial cancer cells. Cancer Res. canres 13372014. doi: 10.1158/0008-5472.CAN-14-1337 [DOI] [PubMed] [Google Scholar]
- Sanità P, Capulli M, Teti A, Galatioto GP, Vicentini C, Chiarugi P, Bologna M, Angelucci A, 2014. Tumor-stroma metabolic relationship based on lactate shuttle can sustain prostate cancer progression. BMC Cancer 14, 154. doi: 10.1186/1471-2407-14-154 [DOI] [PMC free article] [PubMed] [Google Scholar]
- Schmidt K, Carlsen M, Nielsen J, Villadsen J, 1997. Modeling isotopomer distributions in biochemical networks using isotopomer mapping matrices. Biotechnol. Bioeng 55, 831–840. doi: [DOI] [PubMed] [Google Scholar]
- Sheikh K, Förster J, Nielsen LK, 2005. Modeling Hybridoma Cell Metabolism Using a Generic Genome-Scale Metabolic Model of Mus musculus. Biotechnol. Prog 21, 112–121. doi: 10.1021/bp0498138 [DOI] [PubMed] [Google Scholar]
- Valencia T, Kim JY, Abu-Baker S, Moscat-Pardos J, Ahn CS, Reina-Campos M, Duran A, Castilla EA, Metallo CM, Diaz-Meco MT, Moscat J, 2014. Metabolic Reprogramming of Stromal Fibroblasts through p62-mTORC1 Signaling Promotes Inflammation and Tumorigenesis. Cancer Cell 26, 121–135. doi: 10.1016/j.ccr.2014.05.004 [DOI] [PMC free article] [PubMed] [Google Scholar]
- Verma M, Lam TK, Hebert E, Divi RL, 2015. Extracellular vesicles: potential applications in cancer diagnosis, prognosis, and epidemiology. BMC Clin. Pathol 15. doi: 10.1186/s12907-015-0005-5 [DOI] [PMC free article] [PubMed] [Google Scholar]
- Wang Y, Eddy JA, Price ND, 2012. Reconstruction of genome-scale metabolic models for 126 human tissues using mCADRE. BMC Syst. Biol 6, 153. doi: 10.1186/1752-0509-6-153 [DOI] [PMC free article] [PubMed] [Google Scholar]
- Weitzel M, Nöh K, Dalman T, Niedenführ S, Stute B, Wiechert W, 2013. 13CFLUX2—high-performance software suite for 13C-metabolic flux analysis. Bioinformatics 29, 143–145. doi: 10.1093/bioinformatics/bts646 [DOI] [PMC free article] [PubMed] [Google Scholar]
- Wiechert W, de Graaf AA, 1997. Bidirectional reaction steps in metabolic networks: I. Modeling and simulation of carbon isotope labeling experiments. Biotechnol. Bioeng 55, 101–117. doi: [DOI] [PubMed] [Google Scholar]
- Wiechert W, Siefke C, de Graaf AA, Marx A, 1997. Bidirectional reaction steps in metabolic networks: II. Flux estimation and statistical analysis. Biotechnol. Bioeng 55, 118–135. doi: [DOI] [PubMed] [Google Scholar]
- Yang L, Achreja A, Yeung T-L, Mangala LS, Jiang D, Han C, Baddour J, Marini JC, Ni J, Nakahara R, Wahlig S, Chiba L, Kim SH, Morse J, Pradeep S, Nagaraja AS, Haemmerle M, Kyunghee N, Derichsweiler M, Plackemeier T, Mercado-Uribe I, Lopez-Berestein G, Moss T, Ram PT, Liu J, Lu X, Mok SC, Sood AK, Nagrath D, 2016. Targeting Stromal Glutamine Synthetase in Tumors Disrupts Tumor Microenvironment-Regulated Cancer Cell Growth. Cell Metab. 24, 685–700. doi: 10.1016/j.cmet.2016.10.011 [DOI] [PMC free article] [PubMed] [Google Scholar]
- Yang L, Moss T, Mangala LS, Marini J, Zhao H, Wahlig S, Armaiz‐Pena G, Jiang D, Achreja A, Win J, Roopaimoole R, Rodriguez‐Aguayo C, Mercado‐Uribe I, Lopez‐Berestein G, Liu J, Tsukamoto T, Sood AK, Ram PT, Nagrath D, 2014. Metabolic shifts toward glutamine regulate tumor growth, invasion and bioenergetics in ovarian cancer. Mol. Syst. Biol 10. doi: 10.1002/msb.20134892 [DOI] [PMC free article] [PubMed] [Google Scholar]
- Young JD, 2014. INCA: a computational platform for isotopically non-stationary metabolic flux analysis. Bioinformatics 30, 1333–1335. doi: 10.1093/bioinformatics/btu015 [DOI] [PMC free article] [PubMed] [Google Scholar]
- Zamboni N, Fendt S-M, Rühl M, Sauer U, 2009. 13C-based metabolic flux analysis. Nat. Protoc 4, 878–892. doi: 10.1038/nprot.2009.58 [DOI] [PubMed] [Google Scholar]
- Zhang J, Li S, Li L, Li M, Guo C, Yao J, Mi S, 2015. Exosome and Exosomal MicroRNA: Trafficking, Sorting, and Function. Genomics Proteomics Bioinformatics 13, 17–24. doi: 10.1016/j.gpb.2015.02.001 [DOI] [PMC free article] [PubMed] [Google Scholar]
- Zhao H, Yang L, Baddour J, Achreja A, Bernard V, Moss T, Marini J, Tudawe T, Seviour EG, San Lucas FA, Alvarez H, Gupta S, Maiti SN, Cooper L, Peehl D, Ram PT, Maitra A, Nagrath D, 2016. Tumor microenvironment derived exosomes pleiotropically modulate cancer cell metabolism. eLife 5. doi: 10.7554/eLife.10250 [DOI] [PMC free article] [PubMed] [Google Scholar]
- Zöller M, 2013. Pancreatic cancer diagnosis by free and exosomal miRNA. World J. Gastrointest. Pathophysiol 4, 74–90. doi: 10.4291/wjgp.v4.i4.74 [DOI] [PMC free article] [PubMed] [Google Scholar]
- Zupke C, Stephanopoulos G, 1994. Modeling of Isotope Distributions and Intracellular Fluxes in Metabolic Networks Using Atom Mapping Matrices. Biotechnol. Prog 10, 489–498. doi: 10.1021/bp00029a006 [DOI] [Google Scholar]