Abstract
Purpose
To synthesize the literature on diagnostic test accuracy of chest radiography, CT, and US for the diagnosis of coronavirus disease 2019 (COVID-19) in patients suspected of having COVID-19 in a hospital setting and evaluate the extent of suboptimal reporting and risk of bias.
Materials and Methods
A systematic search was performed (April 26, 2020) in EMBASE, PubMed, and Cochrane to identify chest radiographic, CT, or US studies in adult patients suspected of having COVID-19, using reverse-transcription polymerase chain reaction test or clinical consensus as the standard of reference. Two × two contingency tables were reconstructed, and test sensitivity, specificity, positive predictive values, and negative predictive values were recalculated. Reporting quality was evaluated by adherence to the Standards for Reporting of Diagnostic Accuracy Studies (STARD), and risk of bias was evaluated by adherence to the Quality Assessment of Diagnostic Accuracy Studies-2 (QUADAS-2).
Results
Thirteen studies were eligible (CT = 12; chest radiography = 1; US = 0). Recalculated CT sensitivity and specificity ranged between 0.57 and 0.97, and 0.37 and 0.94, respectively, and positive predictive values and negative predictive values ranged between 0.59 and 0.92 and 0.57 and 0.96, respectively. On average, studies complied with only 35% of the STARD-guideline items. No study scored low risk of bias for all QUADAS-2 domains (patient selection, index test, reference test, and flow and timing). High risk of bias in more than one domain was scored in 10 of 13 studies (77%).
Conclusion
Reported CT test accuracy for COVID-19 diagnosis varies substantially. The validity and generalizability of these findings is complicated by poor adherence to reporting guidelines and high risk of bias, which are most likely due to the need for urgent publication of findings in the first months of the COVID-19 pandemic.
Supplemental material is available for this article.
© RSNA, 2020
Summary
Diagnostic test accuracy imaging studies published in the first months of the COVID-19 pandemic show substantial variation in reported diagnostic accuracy and poor adherence to reporting guidelines and contain substantial risk of bias.
Key Points
■ Recalculated CT sensitivity and specificity ranges in suspected COVID-19 in diagnostic test accuracy studies were 0.57–0.97 and 0.37–0.94, respectively. For positive and negative predictive values, these ranges were 0.59–0.92 and 0.57–0.96, respectively. The calculated disease prevalence range was 0.29–0.85.
■ Adherence to reporting guidelines (STARD) was low, with on average only 35% (12/34) of items reported.
■ High risk of bias was identified in 10 of 13 studies (77%), and high applicability concerns were found in eight of 13 studies (62%) in more than one QUADAS-2 domain, generating limited information for generalizability to clinical practice.
Introduction
By May 11, 2020, there were 4 006 257 confirmed coronavirus disease 2019 (COVID-19) cases and 278 892 deaths globally, of which there were 88 891 cases and 4531 deaths in the last 24 hours, respectively (1). For efficient triage of patients suspected of having COVID-19, rapid diagnosis is desirable. Especially in the first months of the pandemic, when prompt clinical action was required, theoretical knowledge and clinical experience was limited. In addition, at the time of this writing, due to the shortage of prospective studies and trials, evidence-based guidelines for the management of patients with (suspected) COVID-19 are lacking. This has, among others, resulted in divergent opinions and recommendations for COVID-19 diagnosis, the latter mainly based on expert opinions and early publications (2–5).
Real-time reverse-transcription polymerase chain reaction (RT-PCR) is generally accepted as the reference test for COVID-19 diagnosis (6). Owing to its modest sensitivity (7,8), limited availability, and relative time-consuming analysis, complementary and/or replacement tests have been proposed, in particular CT imaging.
The value of CT as a screening instrument to rule out COVID-19 infection, or as a diagnostic tool for the confirmation of COVID-19, is reflected by its test characteristics such as sensitivity, specificity, and predictive values. Rather than being fixed values, these parameters strongly depend on patient characteristics (selection of patients and disease prevalence or pretest probability), imaging technique, and characteristics of the doctors interpreting these images (eg, clinical experience and subjective thresholds for decision making). Reported diagnostic accuracy may therefore vary substantially between studies and is prone to selected reporting, affecting the generalizability of published results. Furthermore, several types of bias such as incorporation bias and verification bias may be introduced which may result in the overestimation of diagnostic performance.
Since the outbreak of the virus, over 11 000 articles on COVID-19 have been published (9). Authors and journals need to be commended for their efforts of generating scientific evidence in the midst of a pandemic and making these results available, often open access, in an expedited fashion. However, the time pressure and limited time for peer review may affect the quality of the published studies and increase the risk of bias and incomplete reporting.
The purpose of this systematic review was twofold: (a) to systematically search and synthesize the literature on diagnostic test accuracy of chest radiography, CT, and US in patients suspected of having COVID-19 in a hospital setting and (b) to evaluate the quality of reporting and risk of bias in studies reporting on diagnostic imaging tests in the acute setting of the COVID-19 pandemic.
Materials and Methods
The protocol of this systematic review and meta-analysis was prospectively published and registered online (PROSPERO, registration number CRD42020177432). This study was conducted according to the preferred reporting items for systematic reviews and meta-analyses diagnostic test accuracy guidelines (10–12).
Eligibility Criteria
We included articles meeting the following criteria: (a) adults with suspected COVID-19 pneumonia presenting in a hospital setting, including emergency departments; (b) patients undergoing chest imaging including US, chest radiography, and/or CT for diagnosis of COVID-19 infection; (c) COVID-19 diagnosis confirmed or ruled out by reference test (ie, RT-PCR or clinical consensus). We included articles reporting on diagnostic test accuracy measures including sensitivity, specificity, positive predictive value (PPV) and negative predictive value (NPV), and/or area under the receiver operating characteristic curve analysis. Parameters beyond test accuracy were beyond the scope of this study. A second aim of this study was to assess risk of bias and quality and completeness of reporting and their potential implications for patient care and treatment decisions.
Search
The online libraries of PubMed, EMBASE, and Cochrane were systematically searched on March 30 and updated on April 26, 2020, using synonyms for COVID-19, chest radiography, CT, US, and imaging (Appendix E1 [supplement]). No limitations were applied to the search strategy. The online version of the journal Radiology: Cardiothoracic Imaging was separately searched for relevant studies, as this journal is not yet indexed by MEDLINE (PubMed) or EMBASE. Preprint articles were not included.
Study Selection
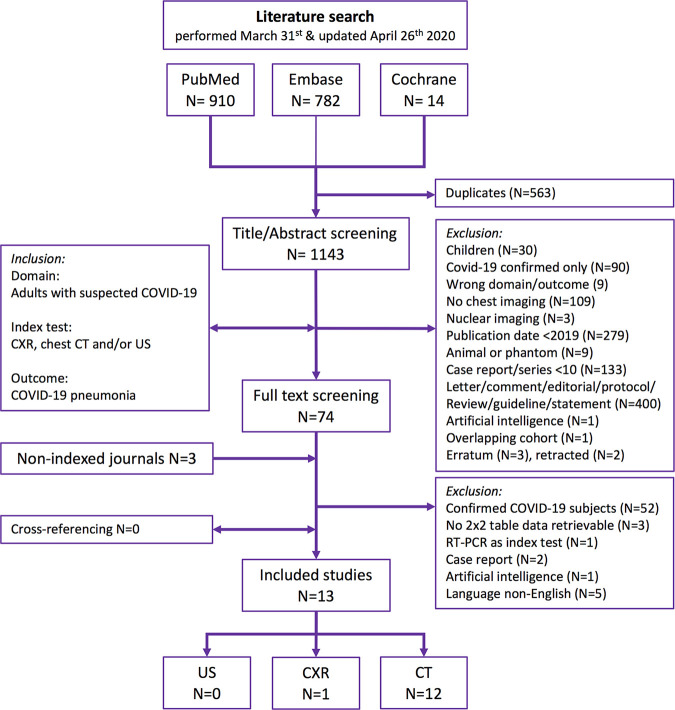
Titles and abstracts were screened based on predefined criteria by two reviewers (D.S. and R.W.v.H.) independently (Fig 1). Duplicate articles were excluded manually. Discordant judgments were resolved in a consensus meeting. Full-text screening for inclusion in the systematic review was performed by two reviewers (D.S. and R.W.v.H.) independently. Discrepancies were resolved by a third reviewer (A.F.v.d.H.). We excluded studies (a) including only patients with confirmed COVID-19 diagnosis, (b) including only children, (c) focusing only on artificial intelligence algorithms, (d) focusing on animals, (e) in a non-English language, (f) that did not allow for reconstruction of a (partial) 2 × 2 contingency table, and (g) that were case reports (n < 10), reviews, conference proceedings, and letters. Cross-referencing was performed. Considering the urgent nature, corresponding authors were not contacted to retrieve missing (outcome) data. A list of excluded studies is presented in Appendix E2 (supplement).
Figure 1:
A flowchart of the systematic search results in the PubMed, EMBASE, and Cochrane databases with predefined selection criteria. Radiology: Cardiothoracic Imaging was screened for eligible articles as this novel journal is not yet indexed by MEDLINE. CXR = chest radiography.
Data Extraction and Critical Appraisal
We extracted data on study design, study subject identification (number of subjects identified, number excluded, and final number included), participant demographics, symptoms, laboratory findings, and imaging features. Detailed information on index test and reference test protocols including definitions and the threshold for a positive test, time-interval analysis methods, and test results was extracted. For test results, the number of positive and negative index tests and reference tests as well as the true-positive (index test and reference test positive), false-positive (index test positive and reference test negative), true-negative (index test and reference test negative), and false-negative (index test negative and reference test positive) counts were extracted.
For each study, data were extracted by two researchers individually and cross-checked by a third researcher (D.S., R.W.v.H., and A.F.v.d.H.), except for results on index test and reference test, which were obtained by three researchers individually. Discordances were resolved by consensus.
For each study, we assessed whether the author reported the purpose of imaging (screening, risk assessment, diagnosis, prognosis, staging, monitoring, or surveillance) and role of the imaging test (replacement, triage, add-on, parallel, or combined testing) (13).
Risk of bias and applicability were evaluated using the Quality Assessment of Diagnostic Accuracy Studies (QUADAS)-2 tool (36) based on 14 signaling questions including four risk-of-bias domains (patient selection, index test, reference test, and flow and timing) and three applicability concern domains (patient selection, index test, and reference test) (Appendix E3 [supplement]). Applicability concerns the degree to which included patients and study setting (domain patient selection), the type of index test used, its conduct and interpretation (domain index test), and the target condition as defined by the standard of reference (domain reference standard) match the review question. Blinding for the index test result was considered not relevant in the assessment of reference test (RT-PCR) risk of bias, because this quantitative semiautomated method is unlikely to be affected. Risk of bias regarding applicability with regard to the target condition (COVID-19) was by default scored as low concern with RT-PCR as the reference test. Types of potential bias were assessed according to classifications as previously published by Whiting et al including bias on verification, incorporation, imperfect reference standard, spectrum, review, disease progression, and treatment paradox (14,15).
Reporting quality was rated according to the Standards for Reporting of Diagnostic Accuracy Studies (STARD) 2015 statement checklist (16). We evaluated all items on the checklist with the exception of (a) adverse events from performing the index test or reference standard, because this risk is considered negligible; (b) registration number of studies with a retrospective design, because we sympathize with the lack of retrospective study registration in this pandemic; (c) handling of missing data on the index test and reference standard for retrospective studies; and (d) rationale for choosing the reference standard when RT-PCR was used, because a polymerase chain reaction (PCR) is the unquestioned reference standard for the detection of a viral pneumonia. For those four items, we added “not applicable” to the scoring system. All QUADAS-2 and STARD items (Appendix E3 [supplement]) were rated by two individual readers and cross-checked by a third reader in case of discordance (D.S., R.W.v.H., and A.F.v.d.H.). For each study, overall risk of bias and applicability were evaluated according to the grading of recommendations, assessment, development, and evaluations (GRADE)-21 framework (13,17). On the basis of the GRADE framework, certainty of evidence for the totality of the diagnostic test accuracy studies was summarized based on concerns regarding study design, risk of bias, indirectness and applicability, imprecision in diagnostic accuracy measure estimates (wide confidence intervals), inconsistency (large differences in estimates), and publication bias (13,17,18).
Data Analysis
Studies were categorized as “diagnostic test accuracy” (DTA) studies if measures of diagnostic accuracy were reported (at least test sensitivity or specificity); studies not reporting diagnostic accuracy measures were categorized as “non-DTA.” Diagnostic test results were presented (a) as reported by authors and (b) as recalculated based on 2 × 2 frequency statistics as retrieved by our raters. The following diagnostic accuracy measures were recalculated based on 2 × 2 tables: sensitivity, specificity, PPV, NPV, accuracy, pretest probability, and positive and negative posttest probability (19). As an additional analysis, a predefined test interval of 3 days (ie, RT-PCR ≤ 3 days after chest imaging) was set as the cutoff for an appropriate time interval between the index test and reference test to limit the probability of interim infection or cross-transmission between admitted patients. Depending on data availability, test accuracy results were recalculated restricted to this time interval. In the case that a study would only contain a subgroup of study participants relevant to the review, 2 × 2 data would be extracted for these patients only. QUADAS-2 results (counts for low risk, high risk, or unclear) were presented as overall, per domain, and per study. Adherence to STARD was analyzed by the number and percentage of STARD items reported and summarized by calculating the proportion of reported items to the total number of applicable STARD items. STARD in nature is designed for DTA studies, but non-DTA studies providing test results were also included in this review. Therefore, QUADAS-2 and STARD subgroup analyses were performed for DTA studies.
No formal analysis on small-study effects was performed. Categorical data were presented as number (frequency), and continuous data were presented as mean ± standard deviation or median (interquartile range) based on data distribution. Analysis was done using IBM SPSS Statistics version 25 and Microsoft Excel for Mac version 16. Statistical significance was set at a level of P < .05 (assuming two-tailed tests).
Results
Search and Inclusion
Our search yielded a total of 1706 articles (Fig 1). Thirteen studies on patients with suspected COVID-19 infection and available diagnostic accuracy data on chest CT and/or chest radiography performance as the index test and RT-PCR or clinical consensus as the reference test were included (8,20–32). No studies were found on chest US performance for COVID-19 diagnosis. No overlapping study populations were identified for the included studies.
Studies and Subjects
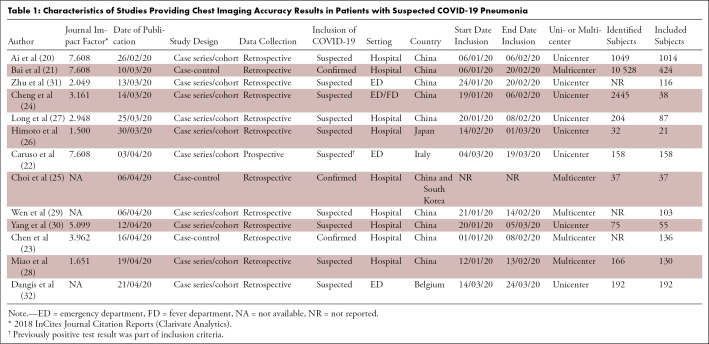
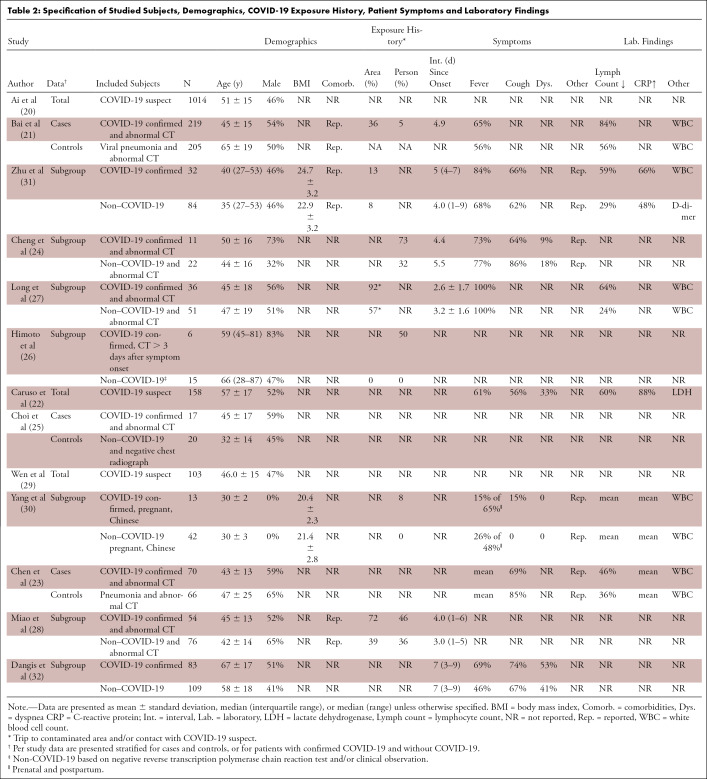
Ten studies (20–23,25–29,32) were categorized as DTA and three (24,30,31) as non-DTA (Table 1). The study design was cross-sectional in 77% (10/13) and was case-control in 23% (3/13; all DTA), and only 8% (1/13) of studies was designed prospectively. Information on patient comorbidities was reported in 23% (3/13) of studies (Table 2). Information on time between symptom onset and clinical presentation was described in 46% (6/13) of studies. No study reported the number or percentage of asymptomatic patients. Severity of disease in subjects with confirmed COVID-19 was reported in 23% (3/13) of studies (21,30,31) and an alternative diagnosis in subjects with rejected COVID-19 diagnosis was reported in 15% (2/13) of studies (21,32). Seven studies reported on the proportion of individuals with symptoms (mainly fever, cough, and/or dyspnea) and laboratory results (mainly lymphocyte count, white blood cell count, and C-reactive protein level).
Table 1:
Characteristics of Studies Providing Chest Imaging Accuracy Results in Patients with Suspected COVID-19 Pneumonia
Table 2:
Specification of Studied Subjects, Demographics, COVID-19 Exposure History, Patient Symptoms and Laboratory Findings
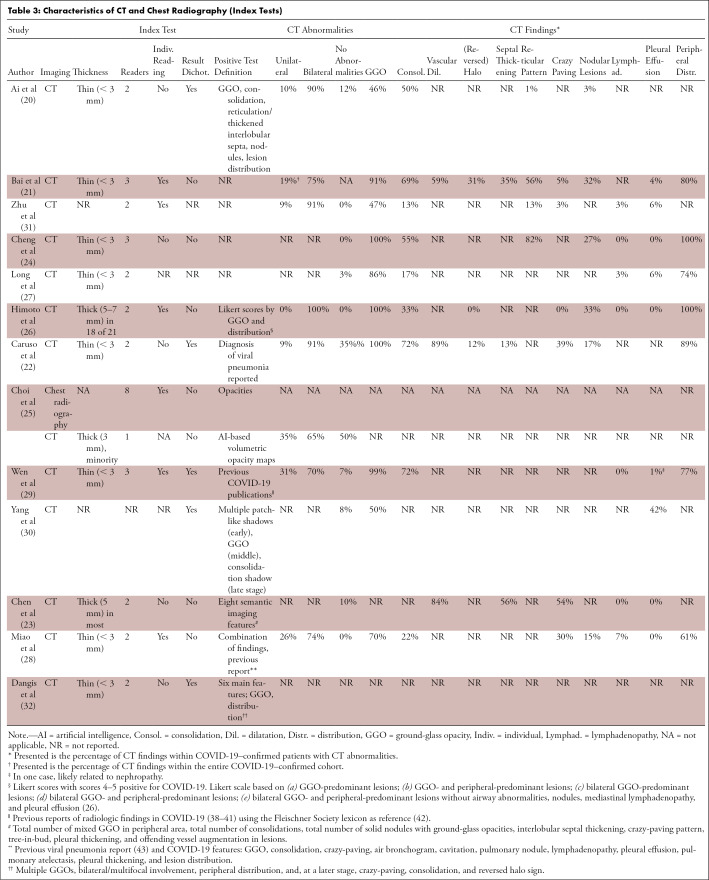
A definition of a positive index test result was provided in 69% (9/13) of studies (Table 3). Three studies (23,25,26) evaluated thick-slice (3–5 mm) CT in that subset of patients and two (30,31) did not report slice thickness. Five studies dichotomized CT index test results into positive and negative, and a threshold was reported in 40% (4/10) of DTA studies (25,26,28,32). One study combined baseline and follow-up test results within subjects in the same primary test accuracy analysis (25).
Table 3:
Characteristics of CT and Chest Radiography (Index Tests)
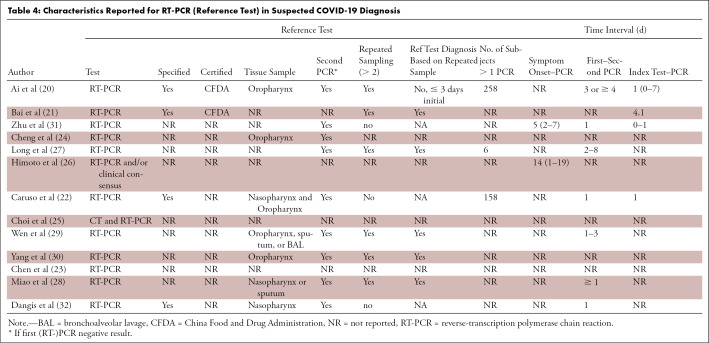
A double PCR swab (nasopharynx and oropharynx) was taken in 8% (1/13) of studies; 46% (6/13) of studies took a single swab; and 46% (6/13) did not report on the sampling method for RT-PCR (Table 4). Repeated RT-PCR sampling was performed in 48% (6/13) of studies (20,21,27–30) and was not reported in 31% (4/13) of studies (23–26). Time from symptom onset to test and time between the index and reference test was reported in two and four studies, respectively.
Table 4:
Characteristics Reported for RT-PCR (Reference Test) in Suspected COVID-19 Diagnosis
Diagnostic Test Accuracy
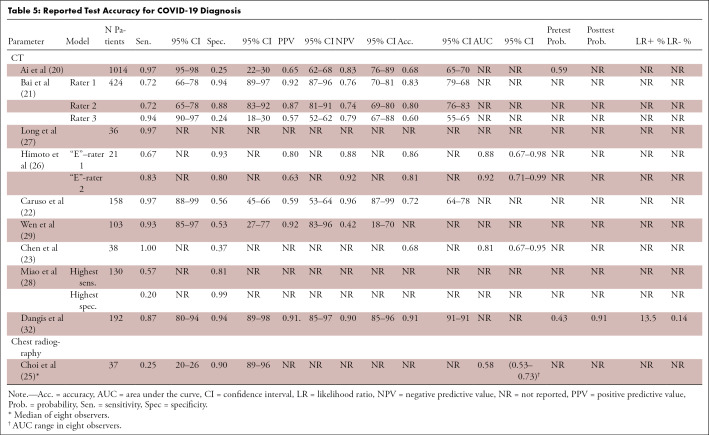
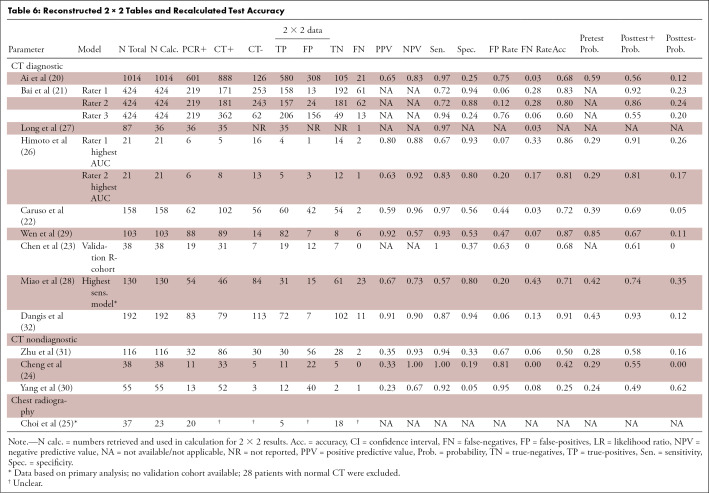
Disease prevalence (pretest probability) was reported in 20% (2/10) of DTA studies, and measures of precision were given in 80% (8/10) of studies (Table 5). On the basis of the reconstructed 2 × 2 tables, ranges of CT performance in the 10 DTA studies were as follows: sensitivity 0.57–0.97, specificity 0.37–0.94, PPV 0.59–0.92, and NPV 0.57–0.96. For non-DTA studies, this was 0.92–0.94, 0.05–0.33, 0.23–0.35, and 0.67–0.93, respectively. An additional analysis of CT performance for a CT-to-RT-PCR time interval ≤ 3 days was abandoned as only one small cohort provided data for the preset time interval (27). One chest radiography study reported a sensitivity and specificity of 0.25 and 0.90, respectively, with an area under the receiver operating characteristic curve of 0.58. We were unable to reliably reconstruct the 2 × 2 contingency table for this study.
Table 5:
Reported Test Accuracy for COVID-19 Diagnosis
Meta-Analysis
Pooling diagnostic test accuracy results and performing a meta-analysis were considered not justified given the study heterogeneity and QUADAS-2 and STARD results (Table 6).
Table 6:
Reconstructed 2 × 2 Tables and Recalculated Test Accuracy
Risk of Bias
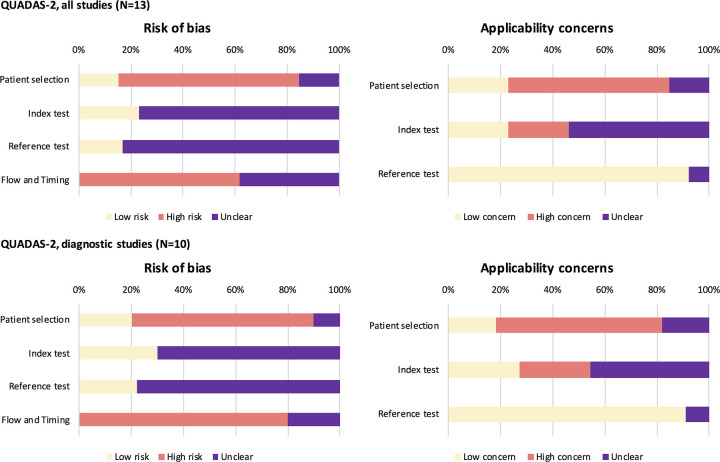
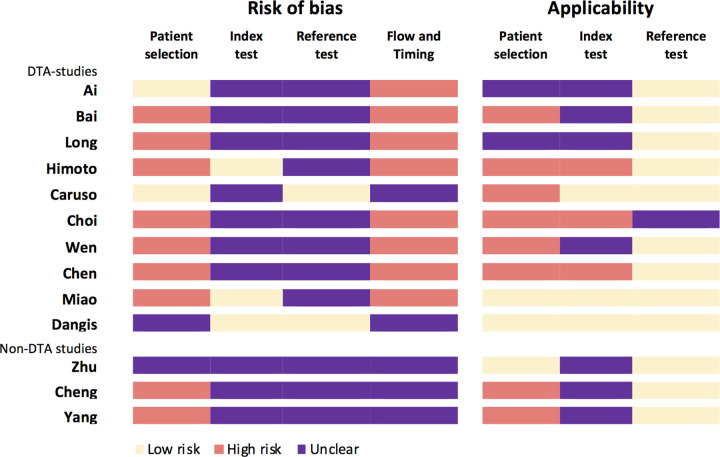
The purpose of imaging, that is, diagnosis of patients with suspected COVID-19 infection was clearly described in 54% (7/13) of studies (20,22,23,26–29). Two studies clearly described the role of imaging as replacement (23) and parallel/combined (32). Overall, QUADAS-2–based signaling questions (Appendix E3 [supplement]) were scored as low risk or concern in 38% (69/182), unclear in 43% (78/182), and high risk or concern in 19% (35/182) of studies. Risk of bias was scored low risk in 17% (24/143), unclear in 48% (68/143) and high risk in 36% (51/143) of questions. Risk of bias was highest for patient selection and flow and timing (Fig 2). Bias for the index and reference test was unknown for most studies. Not one study scored low risk of bias for all four QUADAS-2 domains, and three studies scored no high risk in any domain (Fig 3). High risk in at least one domain was scored in 77% (10/13) of studies, and high risk in at least two domains was scored in 54% (7/13) of studies.
Figure 2:
Quality Assessment of Diagnostic Accuracy Studies-2 (QUADAS-2) results per domain. QUADAS-2: results for all studies (upper part) and for diagnostic test accuracy studies (lower part) present per domain.
Figure 3:
Quality Assessment of Diagnostic Accuracy Studies-2 (QUADAS-2) results per study. QUADAS-2: results for risk of bias and applicability presented as scored per study.
Applicability
Applicability of studies was scored low concern in 38% (15/39), unclear in 26% (10/13), and high concern in 28% (11/13). Applicability concern was highest for patient selection, scored unclear in 15% (2/13) and high risk in 62% (8/13) of studies, respectively, followed by concern regarding index test applicability, scored unclear and high concern in 54% (7/13) and 23% (3/13) of studies, respectively (Fig 3). Two studies (15%) scored low concerns for applicability for all domains, and three studies (20%) scored only low or unclear concerns. High concern for applicability in at least one domain was scored in eight studies (62%), and high concern for applicability in at least two domains was scored in two studies (15%).
Quality of Reporting
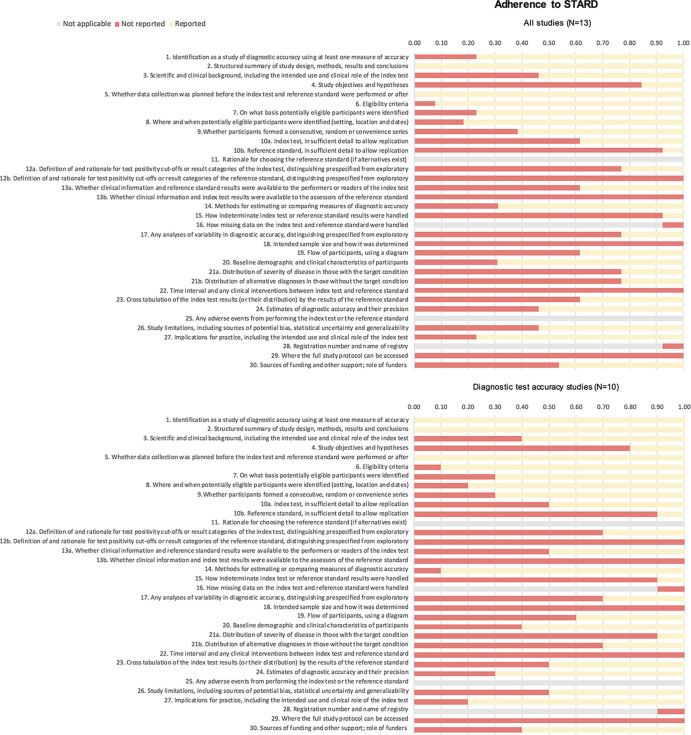
The mean percentage of reported STARD items was 35% (12/34) for all studies (Fig 4; total STARD items = 34); for DTA studies, this was a mean of 41% (14/34) and for non-DTA, this was 26% (9/34). The mean proportion (to applicable items) of STARD adherence for all studies was 43% (range, 27%–60%), which was 47% (33%–60%) for DTA studies and 30% (27%–33%) for non-DTA studies (Fig 5).
Figure 4:
Adherence to Standards for Reporting of Diagnostic Accuracy Studies (STARD). Presented are the proportions of (non)reported items for each study according to the STARD guidelines; presented for all studies (top) and diagnostic test accuracy studies (bottom). The different STARD items concern the following sections in the reports: title or abstract (1), abstract (1,2), introduction (3), methods (4–18), results (19–25), discussion (26,27), and other (28–30).
Figure 5:
Standards for Reporting of Diagnostic Accuracy Studies (STARD) adherence per study. Graphical display of reported (green) and not reported (red) STARD items per study. The reported proportion is calculated by dividing the reported items by the total of reported and not reported items (not applicable items [gray] are not taken into account in this analysis) to applicable items. Upper 10 studies concern diagnostic test accuracy studies (in bold), and bottom three concern nondiagnostic test accuracy studies. The individual STARD items (presented as 1–30) are listed in Figure 4.
The most unreported STARD included all items on the reference test, test positivity cutoffs of the reference test and index test, information on time interval and clinical intervention (eg, antiviral treatment) between index test and reference test, handling of indeterminate test results, intended sample size, study objectives, and hypothesis and severity of disease (Fig 4; Appendix E4 [supplement]). STARD items most often reported included identification of the diagnostic accuracy study, structured abstract, data collection prospective/retrospective, eligibility criteria, and methods for comparing measures of diagnostic accuracy (Appendix E4 [supplement]).
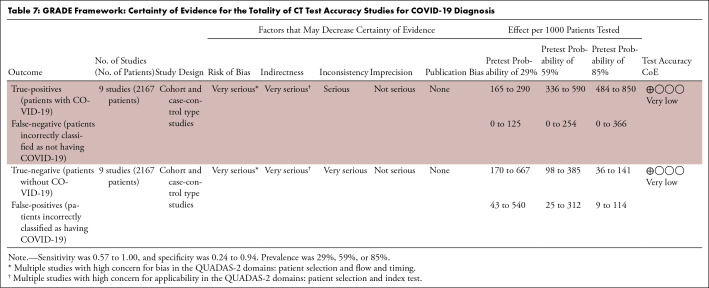
GRADE Framework
On the basis of the GRADE framework, the certainty of evidence for the totality of CT test accuracy studies for COVID-19 diagnosis was rated very low for both sensitivity and specificity estimates (Table 7). The certainty of evidence for chest radiography was not evaluated within GRADE as only one study was identified.
Table 7:
GRADE Framework: Certainty of Evidence for the Totality of CT Test Accuracy Studies for COVID-19 Diagnosis
Discussion
Despite the vivid discussion on the use of imaging to screen and diagnose patients with suspected COVID-19 infection, only few studies addressed and reported diagnostic test accuracy of chest imaging. Reported diagnostic test accuracy of CT for diagnosis of suspected COVID-19 infection in individuals varies substantially, with ranges of 0.57–0.97 for sensitivity and 0.37–0.94 for specificity and recalculated PPV of 0.59–0.92 and NPV of 0.57–0.96, with a very poor level of evidence. The latter is not surprising, as these studies were conducted, written, and published in an extraordinary point in time, under time pressure and rather stressful conditions. However, poor adherence to reporting guidelines and substantial risk of bias may have substantial implications for the daily care of individuals suspected of having COVID-19 and the health care system (33).
The performance of a diagnostic test is subject to its setting: Tests may perform perfectly in a certain setting and achieve suboptimal results when applied in a different setting. For example, in clinical practice, PPV and NPV (the probability of diagnosing the disease with a positive test result and ruling out the disease with a negative test result, respectively) are the most important measures when estimating the risk of presence or absence of disease in patients with suspected infection. The predictive values, however, directly depend on disease prevalence (34). When studies only include patients with confirmed COVID-19, they will not include information on true-negative cases and are therefore prone to low thresholds for test positivity, thereby inflating test sensitivity. An example of such a case is the recently published meta-analysis on CT DTA studies for COVID-19 diagnosis (35), as the vast majority of subjects were patients with confirmed COVID-19. Hereby, the accuracy for discrimination between the diseased and nondiseased remains unknown. Other important sources of test variation include patient demographics, the severity of disease, index and reference test execution, and (predefined or chosen) thresholds but also those related to initial study design and risk of bias. QUADAS-2 and STARD are efficient and clear tools for authors and readers of diagnostic accuracy studies to evaluate the reported study setting and judge the bias, applicability, and expected test performance (16,36).
Complete reporting is needed to allow for the assessment of sources of variation and potential bias and judge reported and expected test performance. Bias in patient selection may result in overestimation of diagnostic accuracy. High pretest probability and strict selection of patients with severe disease or high risk (COVID-19 exposure history) will typically result in spectrum bias with increased (or overestimated) test sensitivity. In this review, the majority of studies did not report on more demographics than age and sex, and no information on socioeconomic status was provided. Study subjects were typically patients presenting at the emergency department/hospital with fever and/or exposure history to COVID-19 (area or person) and with unknown severity of disease or the distribution of alternative diagnoses. Concerns with regard to generalizability rise with the inclusion of patients with very high suspicion and/or exposure history (29), a previous positive test (not further specified) (22), or the use of patients with another type of viral pneumonia as the control group (21,23); with the exclusion of patients with noninfectious lung disease (28), nonpregnant, or non-Chinese subjects (30); if CT was performed within 3 days after symptom onset (26); or CT findings were normal (21,23–25,27,28).
Six studies excluded patients with normal chest CT findings (or included abnormal CT only) (21,23–25,27,28) and/or did not perform RT-PCR in patients with suspected infection without CT abnormalities (106 of 204 excluded participants) (27). This selection may result in the overestimation of test performance. Test sensitivity and specificity may also be overestimated with an arbitrary choice of test threshold. As CT and chest radiography are multilevel tests, a definition of positive (or negative) test is required, but this was lacking in 69% (9/13) of included studies. One study defined a positive test cutoff when three of eight readers scored chest radiograph “positive” (25). For most, if not all, studies it was unclear how indeterminate results were handled. Higher sensitivity and (possibly) lower specificity may also be driven by verification bias (14,15,37). An example of partial verification bias occurred in the study in which RT-PCR was performed in patients with abnormal CT findings only (27). Differential verification bias may have occurred if the use of different (more invasive) swab specimens (eg, nasopharynx versus bronchoalveolar lavage) (28,29) or different reference test analysis methods or PCR kits (20,21) were driven by CT findings, although this is unclear. In addition, various rates of RT-PCR sensitivity have been reported, suggesting a potential imperfect standard of reference (7,8). Bias may be introduced if RT-PCR sensitivity is in fact lower, resulting in misdiagnosis and underestimation of index test performance.
Proper reporting of the reference test method and analysis is therefore required. However, studies typically did not provide information on the type of RT-PCR test kit, specification, or certification and/or whether single or multiple swabs were taken. In these cases, it was unclear whether study subjects received the same reference test. Since information on RT-PCR was insufficient, generalizability cannot be assessed. In addition, no report was made on treatment or other clinical intervention between index test and RT-PCR, thus the potential treatment paradox is unclear. Disease progression bias may potentially have been introduced considering the relatively large reported time intervals (up to 8 days) between CT and RT-PCR. Especially in early COVID-19, most patients with suspected COVID-19 were admitted to fever clinic departments and cross-infection may have occurred within this time interval. No study reported on blinding for the index test result, although with (semi)automated analyses, this may be considered irrelevant. Access to RT-PCR results when reading the index test will, however, induce unacceptable review bias and overestimate test performance. Blinding for RT-PCR results was unclear in four DTA studies (22,24,25,27). Other general concerns for generalizability of the index test not yet assessed include the use of thick-slice CT (23,25,26). CT performance also highly depends on readers’ experience and rater reproducibility, although results on intrarater (32) or interrater (26,32) performance were rather scarce.
Our systematic review had several limitations. We attempted to identify all published articles by including a nonindexed journal, although more DTA studies may be reported in other nonindexed journals that we are unfamiliar with. Only a small number of studies were eligible for inclusion. Five non-English articles were excluded for language restrictions given the short time frame and urgency of this review, although likely similar bias and study weakness would have been encountered. A meta-analysis was not performed due to the low reporting quality. In the setting of prompt diagnosis, we sought to provide additional diagnostic test results for patients who underwent CT and RT-PCR tests within the predefined time interval of 3 days. Only one study allowed for recalculation of CT performance within the predefined time interval (27). Interpretation of the QUADAS-2 and STARD items is subjective; for this, multiple readers assessed the items individually.
To conclude, certainty of evidence was rated very low for both sensitivity and specificity estimates of CT for COVID-19 diagnosis in patients with clinical suspicion. Reported test accuracy of CT for diagnosis of COVID-19 infection varies substantially, from rather poor to excellent. Validity and generalizability of these findings is complicated by poor adherence to reporting guidelines and high risk of bias, which are most likely due to the need for urgent publication of findings in the first months of the COVID-19 pandemic.
APPENDIX
Disclosures of Conflicts of Interest: D.S. disclosed no relevant relationships. R.W.v.H. disclosed no relevant relationships. A.F.v.d.H. disclosed no relevant relationships. P.A.d.J. disclosed no relevant relationships. H.M.V. disclosed no relevant relationships.
Abbreviations:
- COVID-19
- coronavirus disease 2019
- DTA
- diagnostic test accuracy
- GRADE
- grading of recommendations, assessment, development and evaluations
- NPV
- negative predictive value
- PCR
- polymerase chain reaction
- PPV
- positive predictive value
- QUADAS
- Quality Assessment of Diagnostic Accuracy Studies
- RT-PCR
- reverse-transcription polymerase chain reaction
- STARD
- Standards for Reporting of Diagnostic Accuracy Studies
References
- 1.World Health Organization . Coronavirus disease (COVID-19). Situation Report - 112. https://who.int/docs/default-source/coronaviruse/situation-reports/20200511-covid-19-sitrep-112.pdf?sfvrsn = 813f2669_2. Accessed May 11, 2020.
- 2.Kanne JP, Little BP, Chung JH, Elicker BM, Ketai LH. Essentials for Radiologists on COVID-19: An Update-Radiology Scientific Expert Panel. Radiology 2020;296(2):E113–E114. [DOI] [PMC free article] [PubMed] [Google Scholar]
- 3.Nair A, Rodrigues JCL, Hare S, et al. A British Society of Thoracic Imaging statement: considerations in designing local imaging diagnostic algorithms for the COVID-19 pandemic. Clin Radiol 2020;75(5):329–334. [DOI] [PMC free article] [PubMed] [Google Scholar]
- 4.Rubin GD, Ryerson CJ, Haramati LB, et al. The Role of Chest Imaging in Patient Management during the COVID-19 Pandemic: A Multinational Consensus Statement from the Fleischner Society. Radiology 2020;296(1):172–180. [DOI] [PMC free article] [PubMed] [Google Scholar]
- 5.Simpson S, Kay FU, Abbara S, et al. Radiological Society of North America Expert Consensus Statement on Reporting Chest CT Findings Related to COVID-19. Endorsed by the Society of Thoracic Radiology, the American College of Radiology, and RSNA - Secondary Publication. J Thorac Imaging 2020;35(4):219–227. [DOI] [PMC free article] [PubMed] [Google Scholar]
- 6.Huang C, Wang Y, Li X, et al. Clinical features of patients infected with 2019 novel coronavirus in Wuhan, China. Lancet 2020;395(10223):497–506 [Published correction appears in Lancet 2020;395(10223):496.]. [DOI] [PMC free article] [PubMed] [Google Scholar]
- 7.Wang W, Xu Y, Gao R, et al. Detection of SARS-CoV-2 in Different Types of Clinical Specimens. JAMA 2020;323(18):1843–1844. [DOI] [PMC free article] [PubMed] [Google Scholar]
- 8.Li Y, Yao L, Li J, et al. Stability issues of RT-PCR testing of SARS-CoV-2 for hospitalized patients clinically diagnosed with COVID-19. J Med Virol 2020;92(7):903–908. [DOI] [PMC free article] [PubMed] [Google Scholar]
- 9.Chen Q, Allot A, Lu Z. Keep up with the latest coronavirus research. Nature 2020;579(7798):193. [DOI] [PubMed] [Google Scholar]
- 10.Liberati A, Altman DG, Tetzlaff J, et al. The PRISMA statement for reporting systematic reviews and meta-analyses of studies that evaluate healthcare interventions: explanation and elaboration. BMJ 2009;339(jul21 1):b2700. [DOI] [PMC free article] [PubMed] [Google Scholar]
- 11.McInnes MDF, Moher D, Thombs BD, et al. Preferred Reporting Items for a Systematic Review and Meta-analysis of Diagnostic Test Accuracy Studies: The PRISMA-DTA Statement. JAMA 2018;319(4):388–396. [DOI] [PubMed] [Google Scholar]
- 12.McGrath TA, Alabousi M, Skidmore B, et al. Recommendations for reporting of systematic reviews and meta-analyses of diagnostic test accuracy: a systematic review. Syst Rev 2017;6(1):194. [DOI] [PMC free article] [PubMed] [Google Scholar]
- 13.Schünemann HJ, Mustafa RA, Brozek J, et al. GRADE guidelines: 21 part 1. Study design, risk of bias, and indirectness in rating the certainty across a body of evidence for test accuracy. J Clin Epidemiol 2020;122:129–141. [DOI] [PubMed] [Google Scholar]
- 14.Whiting P, Rutjes AW, Reitsma JB, Glas AS, Bossuyt PM, Kleijnen J. Sources of variation and bias in studies of diagnostic accuracy: a systematic review. Ann Intern Med 2004;140(3):189–202. [DOI] [PubMed] [Google Scholar]
- 15.Whiting PF, Rutjes AW, Westwood ME, Mallett S; QUADAS-2 Steering Group . A systematic review classifies sources of bias and variation in diagnostic test accuracy studies. J Clin Epidemiol 2013;66(10):1093–1104. [DOI] [PubMed] [Google Scholar]
- 16.Cohen JF, Korevaar DA, Altman DG, et al. STARD 2015 guidelines for reporting diagnostic accuracy studies: explanation and elaboration. BMJ Open 2016;6(11):e012799. [DOI] [PMC free article] [PubMed] [Google Scholar]
- 17.Schünemann HJ, Mustafa RA, Brozek J, et al. GRADE guidelines: 21 part 2. Test accuracy: inconsistency, imprecision, publication bias, and other domains for rating the certainty of evidence and presenting it in evidence profiles and summary of findings tables. J Clin Epidemiol 2020;122:142–152. [DOI] [PubMed] [Google Scholar]
- 18.Siemieniuk R, Guyatt GH. What is GRADE? BMJ Best Practice. https://bestpractice.bmj.com/info/toolkit/learn-ebm/what-is-grade/. Accessed May 15, 2020.
- 19.Linnet K, Bossuyt PM, Moons KG, Reitsma JB. Quantifying the accuracy of a diagnostic test or marker. Clin Chem 2012;58(9):1292–1301. [DOI] [PubMed] [Google Scholar]
- 20.Ai T, Yang Z, Hou H, et al. Correlation of Chest CT and RT-PCR Testing for Coronavirus Disease 2019 (COVID-19) in China: A Report of 1014 Cases. Radiology 2020;296(2):E32–E40. [DOI] [PMC free article] [PubMed] [Google Scholar]
- 21.Bai HX, Hsieh B, Xiong Z, et al. Performance of Radiologists in Differentiating COVID-19 from Non-COVID-19 Viral Pneumonia at Chest CT. Radiology 2020;296(2):E46–E54. [DOI] [PMC free article] [PubMed] [Google Scholar]
- 22.Caruso D, Zerunian M, Polici M, et al. Chest CT Features of COVID-19 in Rome, Italy. Radiology 2020;296(2):E79–E85. [DOI] [PMC free article] [PubMed] [Google Scholar]
- 23.Chen X, Tang Y, Mo Y, et al. A diagnostic model for coronavirus disease 2019 (COVID-19) based on radiological semantic and clinical features: a multi-center study. Eur Radiol 2020. 10.1007/s00330-020-06829-2. Published online April 16, 2020. [DOI] [PMC free article] [PubMed] [Google Scholar]
- 24.Cheng Z, Lu Y, Cao Q, et al. Clinical Features and Chest CT Manifestations of Coronavirus Disease 2019 (COVID-19) in a Single-Center Study in Shanghai, China. AJR Am J Roentgenol 2020;215(1):121–126. [DOI] [PubMed] [Google Scholar]
- 25.Choi H, Qi X, Yoon SH, et al. Extension of Coronavirus Disease 2019 (COVID-19) on Chest CT and Implications for Chest Radiograph Interpretation. Radiol Cardiothorac Imaging 2020;2(2):e200107. [DOI] [PMC free article] [PubMed] [Google Scholar]
- 26.Himoto Y, Sakata A, Kirita M, et al. Diagnostic performance of chest CT to differentiate COVID-19 pneumonia in non-high-epidemic area in Japan. Jpn J Radiol 2020;38(5):400–406. [DOI] [PMC free article] [PubMed] [Google Scholar]
- 27.Long C, Xu H, Shen Q, et al. Diagnosis of the Coronavirus disease (COVID-19): rRT-PCR or CT? Eur J Radiol 2020;126:108961. [DOI] [PMC free article] [PubMed] [Google Scholar]
- 28.Miao C, Jin M, Miao L, et al. Early chest computed tomography to diagnose COVID-19 from suspected patients: A multicenter retrospective study. Am J Emerg Med 2020. 10.1016/j.ajem.2020.04.051. Published online April 19, 2020. [DOI] [PMC free article] [PubMed] [Google Scholar]
- 29.Wen Z, Chi Y, Zhang L, et al. Coronavirus Disease 2019: Initial Detection on Chest CT in a Retrospective Multicenter Study of 103 Chinese Subjects. Radiol Cardiothorac Imaging 2020;2(2):e200092. [DOI] [PMC free article] [PubMed] [Google Scholar]
- 30.Yang H, Sun G, Tang F, et al. Clinical features and outcomes of pregnant women suspected of coronavirus disease 2019. J Infect 2020;81(1):e40–e44. [DOI] [PMC free article] [PubMed] [Google Scholar]
- 31.Zhu W, Xie K, Lu H, Xu L, Zhou S, Fang S. Initial clinical features of suspected coronavirus disease 2019 in two emergency departments outside of Hubei, China. J Med Virol 2020. 10.1002/jmv.25763. Published online March 13, 2020. [DOI] [PMC free article] [PubMed] [Google Scholar]
- 32.Dangis A, Gieraerts C, De Bruecker Y, et al. Accuracy and reproducibility of low-dose submillisievert chest CT for the diagnosis of COVID-19. Radiol Cardiothorac Imaging 2020;2(2):e200196. [DOI] [PMC free article] [PubMed] [Google Scholar]
- 33.Glasziou PP, Sanders S, Hoffmann T. Waste in covid-19 research. BMJ 2020;369:m1847. [DOI] [PubMed] [Google Scholar]
- 34.Eng J, Bluemke DA. Imaging Publications in the COVID-19 Pandemic: Applying New Research Results to Clinical Practice. Radiology 2020. 10.1148/radiol.2020201724. Published online April 23, 2020. [DOI] [PMC free article] [PubMed] [Google Scholar]
- 35.Kim H, Hong H, Yoon SH. Diagnostic Performance of CT and Reverse Transcriptase-Polymerase Chain Reaction for Coronavirus Disease 2019: A Meta-Analysis. Radiology 2020201343. [DOI] [PMC free article] [PubMed] [Google Scholar]
- 36.Whiting PF, Rutjes AW, Westwood ME, et al. QUADAS-2: a revised tool for the quality assessment of diagnostic accuracy studies. Ann Intern Med 2011;155(8):529–536. [DOI] [PubMed] [Google Scholar]
- 37.Kohn MA, Carpenter CR, Newman TB. Understanding the direction of bias in studies of diagnostic test accuracy. Acad Emerg Med 2013;20(11):1194–1206. [DOI] [PubMed] [Google Scholar]
- 38.Chung M, Bernheim A, Mei X, et al. CT Imaging Features of 2019 Novel Coronavirus (2019-nCoV). Radiology 2020;295(1):202–207. [DOI] [PMC free article] [PubMed] [Google Scholar]
- 39.Lee KS. Pneumonia Associated with 2019 Novel Coronavirus: Can Computed Tomographic Findings Help Predict the Prognosis of the Disease? Korean J Radiol 2020;21(3):257–258. [DOI] [PMC free article] [PubMed] [Google Scholar]
- 40.Lei J, Li J, Li X, Qi X. CT Imaging of the 2019 Novel Coronavirus (2019-nCoV) Pneumonia. Radiology 2020;295(1):18. [DOI] [PMC free article] [PubMed] [Google Scholar]
- 41.Lin X, Gong Z, Xiao Z, Xiong J, Fan B, Liu J. Novel Coronavirus Pneumonia Outbreak in 2019: Computed Tomographic Findings in Two Cases. Korean J Radiol 2020;21(3):365–368. [DOI] [PMC free article] [PubMed] [Google Scholar]
- 42.Hansell DM, Bankier AA, MacMahon H, McLoud TC, Müller NL, Remy J. Fleischner Society: glossary of terms for thoracic imaging. Radiology 2008;246(3):697–722. [DOI] [PubMed] [Google Scholar]
- 43.Kim EA, Lee KS, Primack SL, et al. Viral pneumonias in adults: radiologic and pathologic findings. RadioGraphics 2002;22(Spec No):S137–S149. [DOI] [PubMed] [Google Scholar]
Associated Data
This section collects any data citations, data availability statements, or supplementary materials included in this article.


![Standards for Reporting of Diagnostic Accuracy Studies (STARD) adherence per study. Graphical display of reported (green) and not reported (red) STARD items per study. The reported proportion is calculated by dividing the reported items by the total of reported and not reported items (not applicable items [gray] are not taken into account in this analysis) to applicable items. Upper 10 studies concern diagnostic test accuracy studies (in bold), and bottom three concern nondiagnostic test accuracy studies. The individual STARD items (presented as 1–30) are listed in Figure 4.](https://cdn.ncbi.nlm.nih.gov/pmc/blobs/4d8e/7977726/8aa6292b6afc/ryct.2020200342.fig5.jpg)
