

SUMMARY
G-protein coupled receptors (GPCRs) are known to possess two different conformations, active and inactive, and spontaneously alternate between the two in the absence of ligands. Here, we analyzed the agonist-independent GPCR activity for its possible role in receptor-instructed axonal projection. We generated transgenic mice expressing activity mutants of the β2-adrenergic receptor, a well-characterized GPCR with the highest homology to odorant receptors (ORs). We found that mutants with altered agonist-independent activity changed the transcription levels of axon targeting molecules, e.g., Neuropilin-1 and Plexin-A1, but not of glomerular segregation molecules, e.g., Kirrel2 and Kirrel3, thus, causing shifts in glomerular locations along the anterior-posterior (A-P) axis. Knockout and in vitro experiments demonstrated that Gs, but not Golf, is responsible for mediating the agonist-independent GPCR activity. We conclude that the equilibrium of conformational transitions set by each OR is the major determinant of expression levels of A-P targeting molecules.
INTRODUCTION
In the mouse olfactory system, various odorants are detected by approximately 1,000 types of odorant receptors (ORs) expressed in the olfactory epithelium (OE) (Buck and Axel, 1991). It is well established that each olfactory sensory neuron (OSN) expresses only one functional OR gene in a mono-allelic manner (Chess et al., 1994; Serizawa et al., 2000; Serizawa et al., 2003). Furthermore, OSNs expressing the same type of OR converge their axons to a specific set of glomeruli at stereotyped locations in the olfactory bulb (OB) (Feinstein et al., 2004; Mombaerts et al., 1996; Wang et al., 1998). Based on these two principles, “one neuron- one OR” and “one glomerulus-one OR” rules, odor information received in the OE is represented as a topographic map of activated glomeruli in the OB (Mori and Sakano, 2011). During development, the glomerular map is formed by the combination of OR-independent and -dependent processes. The dorsal-ventral (D-V) arrangement of glomeruli is OR-independent and is regulated by the anatomical location of OSNs within the OE (Vassar et al., 1994; Ressler et al., 1994; Miyamichi et al., 2005; Takeuchi et al., 2010). In contrast, anterior-posterior (A-P) targeting is instructed by expressed OR proteins using cAMP as a second messenger (Chesler et al., 2007; Imai et al., 2006; Imai et al., 2009).
We have previously reported that both global targeting along the A-P axis and local sorting of OSN axons for glomerular segregation are regulated by OR-derived cAMP (Imai and Sakano, 2008). In the OB, A-P targeting molecules such as Neuropilin-1 (Nrp1) and Plexin-A1 (PlxnA1) are detected on axon termini of OSNs, forming a complementary gradient in a glomerular map (Imai et al., 2006; Imai et al., 2009). OR-derived cAMP signals also regulate the expression of glomerular segregation molecules (e.g., Kirrel2 and Kirrel3) for olfactory map refinement (Serizawa et al., 2006). Unlike A-P targeting molecules, glomerular segregation molecules are regulated in a neuronal activity-dependent manner and show mosaic distribution in the glomerular map. How is it, then, that A-P targeting and glomerular segregation are differentially regulated by the expressed ORs although both are under the control of OR-derived cAMP? What is the source of cAMP signals, and how are the signals generated? These important questions had never been formally addressed.
GPCRs including ORs are known to possess two different conformation states, active and inactive. Agonists stabilize the molecule in an active form, whereas inverse agonists stabilize it in an inactive form (Bond and Ijzerman, 2006; Kobilka and Deupi, 2007). In the absence of agonists and inverse agonists, GPCRs produce a baseline level of cAMP by spontaneously flipping between active and inactive conformations. For different OR species, variable but specific levels of constitutive activities have been reported (Kato et al., 2008; Reisert, 2010). In humans, a number of examples of endocrine diseases are known where the agonist-independent receptor activity is elevated by mutations in GPCRs (Vassart and Costagliola, 2011). However, the agonist-independent activity had long been considered to be noise created by GPCRs, and its functional role was not fully appreciated. Here, we study the possible role of agonist-independent GPCR activity in the receptor-instructed axonal projection.
RESULTS
Signaling Natures for OR-Instructed Axonal Projection
In the canonical signal transduction pathway, ORs couple to a heterotrimeric G protein, Golf, converting GDP to GTP (Imai and Sakano, 2008). The GTP-bound Golf, then, stimulates adenylyl cyclase type III (ACIII), leading to the cAMP production. In the knockout (KO) mouse deficient for ACIII, Nrp1 and Kirrel2 expression was down-regulated (Col et al., 2007) whereas PlxnA1 and Kirrel3 expression was up-regulated (Figures 1A, S1A and S1C). Interestingly, expression levels of glomerular segregation molecules (e.g., Kirrel2 and Kirrel3) were affected by unilateral naris occlusion. In the occluded naris, Kirrel2 was down-regulated and Kirrel3 up-regulated, while transcription of A-P targeting genes, Nrp1 and PlxnA1, was not affected (Figures 1A, S1A and S1C). These results indicate that stimulus-driven activity contributes to the local sorting of OSN axons for glomerular segregation, but does not affect global targeting along the A-P axis.
Figure 1. OR-dependent expression of axon targeting and glomerular segregation molecules.

(A) ACIII-knockout (KO) mice were analyzed for the expression of Nrp1, PlxnA1, Kirrel2, and Kirrel3 genes by quantitative RT-PCR at P14 (left). In the naris occlusion experiment, one nostril was surgically occluded at P5, and expression of Nrp1, PlxnA1, Kirrel2, and Kirrel3 genes in the OE was analyzed by quantitative RT-PCR at P14 (right). The contralateral non-occluded OE was analyzed as a control (open). * p<0.01, ** p<0.001 (Student’s t-test). n.s., not significant. Error bars indicate SD (n=3). See also Figure S1A.
(B) Effects of odorant signals on the expression of glomerular segregation molecules. The transgenic MOR29B-YFP mice were housed in the presence or absence of vanillin for 10 days (P21-P31). Glomerular locations for MOR29B and MOR28 were determined by immunostaining of OB sections with anti-GFP and anti-MOR28 antibodies, respectively. Adjacent sections were immunostained with anti-Kirrel2 antibodies. For comparison between animals, ~300 glomeruli including those for MOR28 and MOR29B were measured and rank ordered for Kirrel2 immunoreactivity. Four mice were analyzed for each group, and results from representative animals are shown. Median intensities=50. OB sections were also analyzed with anti-Nrp1 antibodies in the same way as described above for Kirrel2. On the right, glomerular ranks (%) are compared for Kirrel2 and Nrp1 expression in the presence or absence of vanillin. The ratio of Kirrel2 signals, MOR29B/MOR28, was significantly increased in the vanillin-rich condition (=3.63) compared to the control (=1.84) (n=4 mice for each group, * p<0.01, Student’s t-test). n.s., not significant. Error bars indicates SEM.
(C) Targeting and sorting of MOR10-expressing axons in the Kir2.1-overexpressing mouse (Kir2.1 OEx). Kir2.1 OEx was analyzed for the expression of Nrp1 and Kirrel2 genes by quantitative RT-PCR at P3. Relative expression levels are shown in left panel. Error bars indicate SD (n=3). Whole mount views of the lateral aspect of the olfactory bulbs (OBs) visualized by the fluorescence of EYFP are shown in the middle. In the Kir2.1 OEx, MOR10 glomeruli are scattered and more diffused. However, glomerular locations along the A-P axis are unaffected (summarized on the right). Mice were analyzed at P14. A, anterior; P, posterior. Error bars indicate SD (n=8). See also Figure S1B.
We examined if odorous stimuli can change the expression profile of A-P targeting and glomerular segregation molecules (Figure 1B), using the BAC transgenic mouse in which the MOR29B gene is tagged with IRES-gapEYFP. The transgenic mice were housed in the presence of vanillin, a ligand for MOR29B (Tsuboi et al., 2011), for 10 days. In control mice not exposed to vanillin, MOR29B glomeruli ranked 30th percentile from the lowest Kirrel2-staining intensity among ~300 glomeruli analyzed. In contrast, when the mice were exposed to vanillin, the ranking went up to 60th percentile from the lowest. Ranking did not change for the control OR, MOR28, in the same animal. Interestingly, Nrp1 expression was not affected by vanillin exposure in the MOR29B-positive OSNs. These results indicate that the expression of glomerular segregation molecules is regulated by ligand-induced signals, whereas the expression of A-P targeting molecules is likely to be driven by ligand-independent activity.
It has been reported that overexpression of the inward rectifying potassium channel, Kir2.1, hyperpolarizes neurons and thus, completely inhibits the generation of action potentials (Johns et al., 1999). In the Kir2.1-overexpressing mouse (Yu et al., 2004), Kirrel2 was down-regulated but Nrp1 expression was not affected (Figures 1C and S1B). We analyzed the glomerular formation in the Kir2.1 mutant mouse. The glomerular structure became more diffuse than normal, but A-P targeting was unaffected (Figure 1C). The Kir2.1 experiments reveal that neuronal firing is not responsible for OR-instructed A-P targeting. Then, what kind of activity regulates A-P targeting?
Receptor Mutants for Agonist-Independent Activity
It has been reported that GPCRs spontaneously alternate between two different conformational states, the active and inactive, thereby generating unique levels of cAMP in the absence of agonists and inverse agonists (Bond and Ijzerman, 2006; Kobilka and Deupi, 2007; Reisert, 2010) (Figure 2A). We hypothesized that the agonist-independent OR activity may participate in the regulation of A-P targeting of OSN axons. In order to examine this possibility, we attempted to generate the activity mutants of GPCRs. The initial experiment with ORs was not successful due to the challenges of achieving adequate membrane expression in the heterologous system. In addition, due to the vast diversity of OR family proteins and the lack of three-dimensional structural information, prediction and screening of activity mutants were difficult for OR molecules. In contrast, β2-adrenergic receptor (β2-AR), a GPCR with the highest sequence homology to ORs, is easier to express in transfected cells, and shares many functional similarities with ORs: When expressed in OSNs with the OR gene promoter, β2-AR maintains the one neuron-one receptor rule, couples with the α subunit of Gs or Golf , and substitutes ORs for receptor-instructed axonal projection (Feinstein et al., 2004). Furthermore, β2-AR has advantages of being well-characterized for distinct receptor functions. Based on mutational studies, the key amino acid residues in the β2-AR that are required for G-protein coupling, ligand binding and the generation of agonist-independent activity are well-characterized (Ballesteros et al., 2001; O’Dowd et al., 1988; Savarese and Fraser, 1992). Recently, the three-dimensional structures of β2-AR in its active state and in a complex with a stimulatory G protein have been determined (Rasmussen et al., 2011a; Rasmussen et al., 2011b) (Figure 2A, left). As a result of these favourable features, we selected β2-AR for the transgenic analysis of the agonist-independent GPCR activity in axonal projection of OSNs.
Figure 2. Activity mutants of β2-AR.
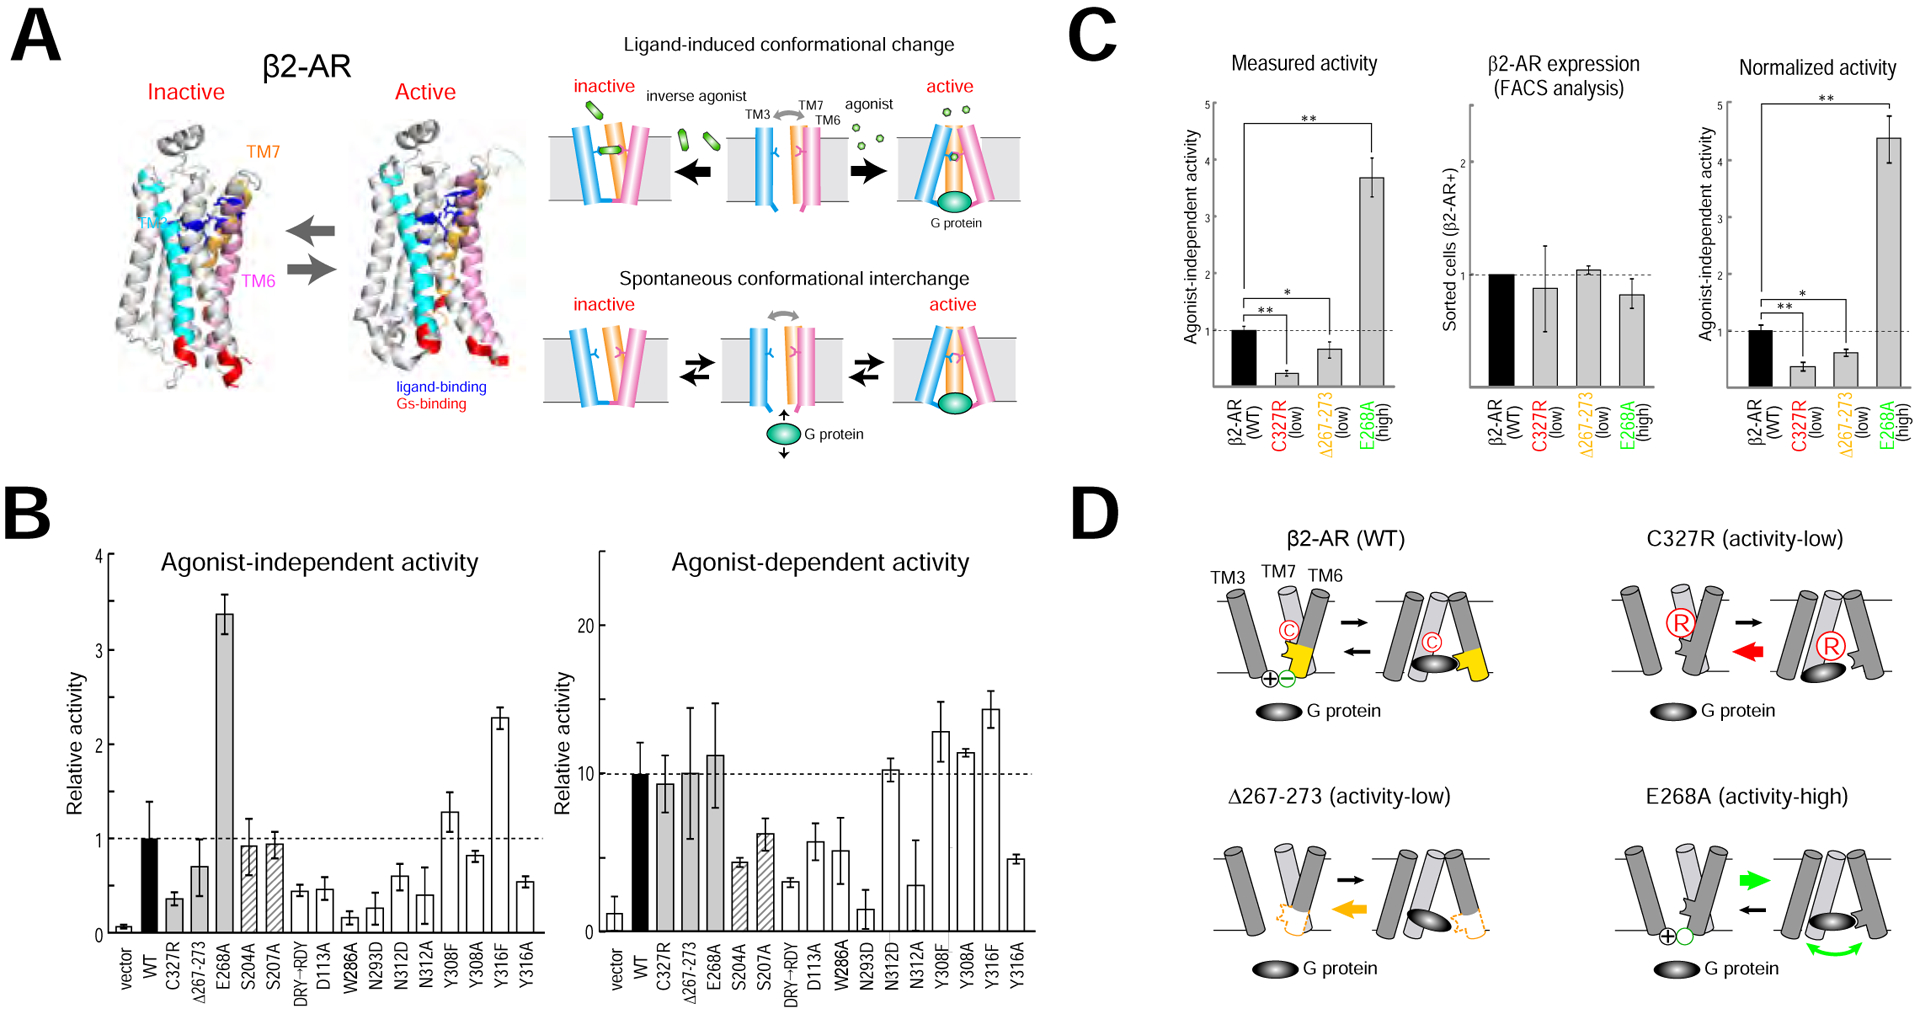
(A) Conformational changes of β2-AR. G-protein-coupled receptors (GPCRs) are known to possess two different conformations, active and inactive (left, modified from Rasmussen et al., 2011a). Agonists lock the receptor structure in an active form, whereas inverse agonists stabilize the receptor in an inactive form (upper right). In the absence of ligands, GPCRs spontaneously interchange between the two conformations, active and inactive, generating agonist-independent baseline activity (lower right).
(B) Activity mutants of β2-AR. To generate mutants, amino acid residues in the ligand-binding domain or in the cytoplasmic domain were changed or deleted by site-directed mutagenesis. These mutants were analyzed for both agonist-independent activity (left) and agonist-dependent activity (right) by the luciferase assay. Among the β2-AR mutations analyzed, some affected only one of the two activities, either agonist-dependent activity (shaded) or agonist-independent activity (gray). The wild-type β2-AR was analyzed as a standard (black). Vector alone was analyzed as a control. Relative activities are shown in bar graphs after the normalization to the wild-type (WT) baseline activity (= 1). Error bars indicate SD (n=8).
(C) Normalization of activities. Measured agonist-independent activities (left) were normalized to the membrane expression levels of β2-AR (right). N-terminal FLAG-tagged β2-ARs were expressed by the CMV promoter, and transfected cells were immunostained with anti-FLAG antibody. Membrane expression of β2-ARs in HEK293 cells was quantified by FACS analysis (middle). The agonist-independent activity of wild-type (WT) β2-AR was used as a standard. * p<0.01, ** p<0.001 (Student’s t-test). Error bars indicate SD (n=8). See also Figure S2C.
(D) Schematic diagrams of activity generation by mutant β2-ARs. The C327R (red) contains a mutation at residue 327, replacing cysteine with arginine and making the entry tract for G protein narrower. The Δ267–273 (orange) exhibits decreased agonist-independent activity due to the deletion of key residues that constitute the G-protein entry gate. The E268A (green) generates increased agonist-independent activity. The residue change from glutamic acid to alanine at position 268 removes the negative charge at the bottom of β2-AR, and loss of the ionic interaction with arginine at 131 makes the G-protein entry gate much looser.
In addition to β2-AR mutations previously described (Ballesteros et al., 2001; O’Dowd et al., 1988; Savarese and Fraser, 1992), we introduced new mutations in the ligand-binding extracellular domain and G-protein-interacting transmembrane region. For these β2-AR mutants, we measured agonist-independent and agonist-dependent activities in the transfected HEK293 cell lines, where cAMP was quantified using a CRE-luc reporter assay (Saito et al., 2009; Tsuboi et al., 2011) (Figure 2B). For the wild-type (WT) β2-AR, the level of agonist-independent activity was one order-of-magnitude lower than that of agonist-dependent activity. Among the β2-AR mutations analyzed, some affected both agonist-independent and agonist-dependent activities, while others affected only one of the two activities. We predict that mutations affecting G-protein activation, e.g., DRY motif mutations, would alter both agonist-dependent and -independent activities, whereas those altering ligand interactions would change agonist-dependent activity. Mutations that affect equilibrium of conformational transitions should alter the agonist-independent receptor activity.
For further transgenic studies, we selected three β2-AR mutants from the collection, which significantly altered agonist-independent receptor activity but not the agonist-dependent activity (Figure 2C). The C327R contains a mutation at residue 327, replacing cysteine with arginine. Based on the three-dimensional structural analysis (Rasmussen et al., 2011a, 2011b), we predict that this change makes entry tract for G protein narrower, thus lowering the agonist-independent activity to one-third that of the WT (Figure 2D, upper right). The Δ267–273 exhibits decreased agonist-independent activity due to the deletion of key residues that constitute the G-protein entry gate (Figure 2D, lower left). In contrast, the E268A has increased agonist-independent activity more than threefold that of WT. This mutation, changing the residue from glutamic acid to alanine at position 268, removes the negative charge at the bottom of β2-AR. Loss of the ionic interaction with arginine at 131 breaks a lock on the entry gate for the G protein, making it looser (Figure 2D, lower right). This likely increases the frequency of turnover of G-protein coupling to β2-AR, generating a higher level of agonist-independent activity. It is important to make certain that activity alterations are not due to changes in membrane expression of mutant protein. To confirm, we immunostained transfected HEK293 cells with antibodies against FLAG, an N-terminal epitope tag, and found that mutant receptors were detected on the cell surface at levels comparable to that of WT (Figure S2C). Membrane expression of β2-ARs was quantified by fluorescence-activated cell sorting (FACS) analysis. Measured agonist-independent activities were normalized to the surface expression levels for further studies.
Transgenic Analyses of β2-AR Mutants
We then generated transgenic mice expressing the mutant or WT β2-AR using an OR gene promoter. This was performed by replacing the MOR23 coding sequence with that of β2-AR in the MOR23 minigene cassette (Figure S2A). We first checked β2-AR expression in OSNs of the transgenic mice. OE sections were isolated and stained with antibodies against β2-AR. Both the WT and mutant β2-ARs reacted equally to the β2-AR antibodies with no notable differences in their staining levels (Figure S2B left). The level of mutant protein expression quantified by FACS was not affected by the mutations in the transgenic mice (Figure S2B, right).
We next studied the glomerular locations in the OB for the mutant β2-ARs tagged with fluorescent proteins, EYFP (Figure 3A). At least four independent transgenic mouse lines were generated for each β2-AR mutant. OSNs expressing the WT β2-AR tagged with ECFP generated a glomerulus halfway along the A-P axis of the OB (Figure 3A, left), and formed synapses with mitral-cell dendrites (Figure S2D). To compare glomerular locations of mutant β2-ARs with that of the WT within the same animal, we crossed one of the WT β2-AR transgenic lines with each mutant line. The activity-low mutant, C327R (30% of WT), generated glomeruli (red) anterior to that of the WT (white). The shift was minor for another activity-low mutant, Δ267–273 (75% of WT) (Figure 3A, middle). In contrast, the activity-high mutation, E268A (350% of WT), caused a posterior shift of glomeruli (green) (Figure 3A, right). This finding shows a good correlation between the agonist-independent activities of β2-ARs and their corresponding glomerular locations along the A-P axis (Figures 3B and 3C).
Figure 3. Agonist-independent activity regulates A-P positioning of glomeruli.

(A) Location of glomeruli for the wild-type (WT) and mutant β2-ARs. Activity-low mutants, C327R and Δ267–273 (red and yellow), exhibited anterior shifts of glomeruli (two middle panels), whereas the activity-high mutant, E268A (green), exhibited a posterior shift (right). The WT β2-AR glomerulus (white) was used as a positional control within the same animal. Location of glomeruli in the medial OB was determined by CFP (WT) or YFP (mutants) fluorescence, respectively. Enlarged photos are shown in bottom. Schematic diagrams are on top. Scale bars are 500 μm. Mice were analyzed at P14.
(B) Agonist-independent activities for mutant β2-ARs. Activities were measured for the WT and mutant β2-ARs using the luciferase assay (left). Relative activities are shown in a bar graph using the WT activity as a standard (= 1). Vector alone was analyzed as a control. * p<0.01, ** p<0.001 (Student’s t-test). Error bars represent SD (n=8).
(C)Glomerular locations are summarized for the WT and mutant β2-ARs along the A-P axis on the medial surface of the OB (right). n = 12 for each strains. * p<0.01, ** p<0.001 (Student’s t-test). Error bars represent SD. See also Figure S2.
We also examined the expression levels of A-P targeting molecules in the β2-AR glomeruli by immunostaining and performing qPCR of FACS sorted OSNs. As shown in Figure 4A, Nrp1 expression in β2-AR expressing OSNs was increased by the activity-high mutation, E268A, but lowered by the activity-low mutations, C327R and Δ267–273. In contrast, PlxnA1 expression was down-regulated by E268A, but up-regulated by C327R and Δ267–273. It is notable that expression levels of glomerular segregation molecules, e.g., Kirrel2 and Kirrel3, were not affected at all by these mutations (Figure 4B). Above observations, together with the result of naris occlusion (Figures 1A, right and S1A, middle), suggest that A-P targeting molecules and glomerular segregation molecules are separately regulated by two distinct OR-derived signals.
Figure 4. Agonist-independent activity regulates the expression of A-P targeting molecules.

(A) Immunostaining of OB sections. A-P targeting molecules were affected by agonist-independent activity mutations. β2-AR-positive glomeruli were identified with anti-GFP antibodies. Adjacent sections were stained with anti-Nrp1 and anti-PlxnA1 antibodies. The C327R (activity-low) mutation lowered Nrp1 expression but increased PlxnA1. In contrast, Nrp1 was up-regulated and PlxnA1 was down-regulated by the E268A (activity-high) mutation. Relative expression levels of protein and mRNA are normalized to the wild-type (WT) and compared in bar graphs. Correlations between the A-P projection molecules and agonist-independent activities are shown on the right. Mice were analyzed at P14. * p<0.01, ** p<0.001 (Student’s t-test). Error bars represent SD (n=8).
(B) Glomerular segregation molecules were not affected by the agonist-independent activity mutations. β2-AR glomeruli were detected with anti-GFP antibodies. Adjacent OB sections were stained with anti-Kirrel2 and anti-Kirrel3 antibodies. Mice were analyzed at P14. Error bars represent SD (n=8).
To examine whether the correlation between the agonist-independent activities and glomerular locations holds true for natural ORs, we performed the following experiments. We dissected the mouse OB into three sections; anterior, middle and posterior. Thirty OR genes were cloned, transfected into HEK293 cells, and analyzed for their activities without ligands by the luciferase assay (Figure 5A). To facilitate cell surface expression of OR molecules, we co-transfected a chaperone protein gene RTP1S into HEK cells (Saito et al., 2004). The activity ranged from 0.37 ± 0.12 for MOR215–1 to 5.33 ± 0.35 for MOR 259–11 using the MOR-EG activity as a standard (=1). ORs cloned from the anterior OB produced relatively lower levels of agonist-independent activities (0.67 ± 0.21, mean ± SEM, n=8), and those from the posterior OB generated higher levels (2.34 ± 1.34, mean ± SEM, n=8). For natural ORs, the promoter activities, protein stabilities and membrane transport could be potential factors affecting total cAMP signal levels. We, therefore, measured cell-surface expression of MOR215–1, MOR37b, EG, MOR103–1, MOR256–17 and MOR259–11 by immunostaining and FACS analysis. At least among these ORs, differences were within 15% (Figure S3B), although greater differences were found for some other ORs in a separate experiment (Figure S4D). In any case, the agonist-independent receptor activity is the major determinant of expression levels of A-P targeting molecules.
Figure 5. Agonist-independent activities of various ORs.

(A) Thirty OR genes were cloned from three OB sections from mice at P14, anterior (green), middle (gray) and posterior (red), and transfected to HEK293 cells. Agonist-independent activities were measured by the luciferase assay. Relative activities are plotted (bottom). The agonist-independent activity of MOR-EG was used as a standard. Green and red squares represent the means ± SEM for the anterior and posterior ORs, respectively. Glomerular locations for some ORs are shown in a schematic diagram of the medial OB (top). (Mann-Whitney U test=186.00; p=0.05). See also Figure S3.
(B) Agonist-independent OR activities and expression levels of A-P targeting molecules. Two knock-in mouse strains were analyzed: One is MOR215–1-EGFP and the other is MOR103–1→MOR215–1-ECFP, in which the coding sequence of MOR215–1 was replaced with that of MOR103–1. To measure agonist-independent activities in vitro using the luciferase assay, MOR215–1 and MOR103–1 were expressed in HEK293 cells under the CMV promoter. In the in vivo experiment, the same MOR215–1 promoter was used for both MOR215–1 and MOR103–1 expression to maintain the same levels of transcription. Expression levels (immunostaining) of Nrp1 and PlxnA1 and agonist-independent OR activities are compared between MOR215–1 and MOR103–1→MOR215–1 (upper right). Coronal OB sections were immunostained with anti-GFP antibodies to detect glomeruli for the knock-in OR alleles. Adjacent sections were immunostained with anti-Nrp1 or anti-PlxnA1 antibodies (bottom). Glomerular locations of MOR215–1-EGFP and MOR103–1→MOR215–1-ECFP are shown in a diagram (upper left). Mice were analyzed at P14. ** p<0.001 (Student’s t-test). Error bars represent SD (n=8). i, an internal ribosome entry site (IRES).
To confirm the link of OR activity/axon guidance molecule/glomerular location, we generated knock-in mice, in which the coding sequence of MOR215–1 had been replaced with that of MOR103–1 to maintain the same levels of transcription. In Figure 5B, levels of A-P projection molecules, glomerular locations, and agonist-independent activities were compared between MOR215–1 and MOR103–1 expressed by the same MOR215–1 promoter in vivo and the CMV promoter in vitro. Anterior MOR215–1 with the lower agonist-independent activity demonstrated Nrp1low/PlexnA1high expression, whereas posterior MOR103–1 with the higher activity showed Nrp1high/PlexnA1low expression.
Differential Usage of Gs and Golf in OSNs
Our results demonstrated that OR-instructed A-P targeting and glomerular segregation are differentially regulated by two distinct OR-derived cAMP signals. How are these two types of regulation separately controlled during development? To address this question, we studied the onset of expression for various genes involved in axon guidance and signal transduction in OSNs. OE sections from different developmental stages were analyzed by in situ hybridization using GAP43 and OMP probes as immature and mature OSN markers, respectively (Figures S5C and S5D). At embryonic day (E) 13.5, immature OSNs start to appear, and mature OSNs are found at E17.5. At E13.5, hybridization signals were detected for A-P targeting molecules (e.g., Nrp1), but not for glomerular segregation molecules (e.g., Kirrel2). Kirrel2 expression became prominent only at the late stage of embryonic development. We also analyzed the onset of Gs, Golf, phosphodiesterases (PDEs) and other signal transduction molecules. Hybridization signals were detected for Gs at E13.5. In contrast, Golf and PDE genes were expressed at E17.5, but not at E13.5, indicating that Golf and PDEs are not required for the expression of A-P targeting molecules. High PDE expression in mature OSNs may help to detect precise temporal changes of OR-derived cAMP signals by erasing the noise-level activity.
Gs and Golf are structurally similar sharing 88% amino acid identity. Both mediate OR signals and activate ACIII in OSNs, however, their functional differences in the cellular context are not fully recognized. What could be the reason that Gs and Golf are differentially expressed in OSNs during development? We examined the biochemical properties of Gs and Golf in mediating OR signals. Interactions of GPCR and G proteins are often studied using GPCR::Gα fusion proteins, because it ensures 1:1 stoichiometry of GPCR-Gα interactions and minimizes the interactions with endogenously expressed G proteins (Milligan, 2000). We generated Gs and Golf fusion proteins for MOR29B, MOR106–1, and MOR223–1, whose agonists have been established (Saito et al., 2009; Tsuboi et al., 2011 and unpublished results). Both agonist-independent and -dependent cAMP signals were measured by the dual luciferase assay, using β2-AR as a control (Figures 6 and S4). We detected much higher agonist-independent activities with Gs than with Golf, while ligand response properties were similar between Gs and Golf. As a result, the ratio of maximum stimulus response to the agonist-independent activity was higher with the fusion protein of Golf than that of Gs. It is notable that expression levels of OR::Gs and OR::Golf proteins were comparable in this experiment. Similar results were also obtained with co-expressed OR molecules and G proteins (Figure S4B). We conclude that Gs mediates agonist-independent activity more efficiently than does Golf.
Figure 6. Luciferase assay of GPCR activities in vitro.

(A) Agonist-independent activities of β2-AR and ORs. Agonist-independent OR activity was measured in the transfected HEK293 cells using the dual luciferase assay (see Experimental Procedures for detail). β2-AR was analyzed as a positive control. To ensure the OR-Gα coupling, coding sequences of OR and Gα were fused with a flexible linker sequence. Data are mean ± SEM (n = 3 for each).
(B) Agonist-dependent activities of β2-AR and ORs. OR activity induced by ligand stimulation was measured in the transfected HEK293 cells using the dual luciferase assay. For β2-AR and three OR species (MOR29B, MOR106–1, and MOR223–1), higher agonist-independent activities were detected with Gs (red) than with Golf (blue), although ligand response properties were comparable between them. The ratio of maximum fold response to agonist-independent activity, i.e., maximum response/ agonist-independent activity, was higher with the fusion protein of Golf than that of Gs. Data are mean ± SEM (n = 3 for each). See also Figure S4.
Our observations are consistent with the earlier biochemical characterization that Golf possesses lower GDP affinity and is more rapidly deactivated by their high GTPase activity (Liu et al., 2001; Seifert et al., 1998). In regulating axonal projection of OSNs, Gs-mediated activity may be useful for ORs whose cognate ligands are not available during embryonic development. Variable levels of agonist-independent baseline-level activity can be detected with Gs for different ORs in HEK293 cells (Figure S4D).
Knockout Analyses of Gs and Golf
To further study the differential functions of Gs and Golf, we performed loss of function experiments by using mutant mice. Conventional Gs-KO dies before E10.5, precluding studies of early olfactory development (Yu et al., 1998). We generated the dorsal OE-specific conditional knockout (CKO) for Gs using the omacs-cre driver (Kobayakawa et al., 2007) and floxed-gnas mouse lines (Chen et al., 2005). In order to study differential requirements of G proteins, we analyzed G-protein KO mice for the expression of A-P targeting (e.g., Nrp1) and glomerular segregation molecules (e.g., Kirrel2). It has been reported that Golf is essential for generating odor-evoked neuronal activity, but dispensable for regulating OSN projection in neonatal mice (Belluscio et al., 1998). Consistent with this earlier study, Nrp1 expression was not affected in the Golf-KO (Figures 7A and S5A). In the neonatal Gs-CKO, however, Nrp1 expression was diminished in the dorsal OB. In contrast, Kirrel2 expression was abolished in the Golf-KO, but was not affected in the Gs-CKO.
Figure 7. Differential effects of Gs-CKO and Golf-KO on OSN projection.

(A) Quantification of Nrp1 and Kirrel2 in the OB of G-protein KO mice. Horizontal sections of the OB were immunostained with antibodies against Nrp1, OMP, and Kirrel2 (left). Staining intensities were quantified using Scion Image (Scion Corp., see Experimental Procedures for detail) and normalized to the wild-type (WT) level as a standard. The number of OMP-positive mature OSNs was reduced in the Gs-CKO/Golf-KO. Mice were analyzed at P0. Expression of Nrp1 and Kirrel2 were also analyzed specifically for rat I7 (rI7) glomeruli in the KO mice. Basically the same results were obtained as with the entire OB section. * p<0.01, ** p<0.001 (Student’s t-test). Error bars represent SD (n=4). See also Figure S5.
(B) Glomerular formation and location in the KO mice. CFP-tagged rat I7 (rI7) glomeruli were analyzed at P0. Horizontal OB sections (top) were stained with anti-CFP antibodies (green), and counterstained with DAPI (blue). Dotted lines mark the border of OBs. Medial views of the OB at P3 are shown (bottom). In the double KO, rI7 axons remain in the anterior OB, failing to form glomerular structure (n=6). A, anterior; P, posterior; D, dorsal; V, ventral; L, lateral; M, medial.
(C) Canonical and non-canonical signal transduction pathways for OR-derived activities. In immature OSNs (left), each OR species generates a unique level of agonist-independent activity, which is converted to the cAMP signals with the aid of Gs and ACIII. The level of cAMP signals determines expression levels of A-P targeting molecules, e.g., Nrp1 and PlxnA1, using the cAMP-activated PKA pathway. In mature OSNs (right), the stimulus-driven OR signals open ion channels, generating neuronal activity that regulate expression levels of glomerular segregation molecules, e.g., Kirrel2 and Kirrel3. Temporal changes of OR-derived cAMP signals are converted to unique firing patterns with the aid of phosphodiesterases (PDEs).
Due to the variability of Nrp1 expression with different ORs, we focused our analyses on OSNs expressing the CFP-tagged OR transgene, rat I7 (rI7)-CFP, expressed with the dorsal-zone-specific MOR23 promoter (Imai et al., 2006). As shown in Figure S5B, Nrp1 immunoreactivity was prominent in rI7-CFP expressing OSNs in both WT and Golf-KO mice, but was greatly reduced in the Gs-CKO at postnatal day (P) 0. In the Gs-CKO /Golf-KO double mutant, Nrp1 expression was completely abolished in all dorsal-zone axons (Figure S5A). Thus, Gs is required for normal Nrp1 expression while Golf is compensatory in some OSN populations. We examined axonal projection and glomerular formation for rI7-CFP (Figure 7B). In the Gs-CKO mice, rI7-CFP-expressing OSNs mistargeted to the anterior OB, often forming diffused clusters of glomeruli, indicating that Gs mediates the baseline activity necessary for the regulation of A-P targeting molecules. In contrast, Golf-KO produced a similar projection profile to that of the WT at the neonatal stage. This is probably because Gs compensates the Golf function, at least in part, in the Golf-KO. Supporting this idea, in the Gs-CKO /Golf-KO double mutant, most rI7-positive axons remain in the anterior OB, failing to form glomerular structures (Figure 7B). This phenotype is quite similar to that found with the DRY-motif mutant of rI7, which blocks both Gs- and Golf-mediated signals (Imai et al., 2006). Taken together, our results demonstrate that Gs plays a major role in regulating A-P targeting in immature OSNs, followed by the role of Golf for glomerular segregation in mature OSNs.
DISCUSSION
The olfactory map is established by a combination of genetically determined global targeting and activity-dependent local sorting of OSN axons during development (Chen and Flanagan, 2006; Imai and Sakano, 2008). Activity-dependent refinement, which follows initial targeting, plays an important role in many other sensory systems (Feldheim and O’Leary, 2010; Luo and Flanagan, 2007). In the mouse olfactory system, coarse map topography is established by the combination of an OR-dependent and independent processes: The A-P targeting is instructed by OR-derived cAMP, whereas the D-V targeting is regulated by the anatomical locations of OSNs within the OE. These processes are genetically programmed and independent from the neuronal activity (Sakano, 2010). After OSN axons reach the OB, further refinement occurs in an activity-dependent manner through fasciculation of axon termini and glomerular segregation (Serizawa et al., 2006).
Our present study revealed that A-P targeting and glomerular segregation are separately regulated by distinct signals that both rely on OR-derived cAMP as a second messenger. These two types of OR signals are transduced at different stages of olfactory development (Figure 7C). Furthermore, the differences between the two types of regulation may also be due to the subcellular localization of ORs, namely, cilia in mature OSNs vs. axon termini in immature OSNs. Although spatial and temporal insulation of the two distinct OR signals may explain the differential regulation of A-P targeting and glomerular segregation molecules, the major basis for the difference in distribution of the two types of molecules in the map, graded vs. mosaic, is a result of the distinct sources of their cAMP signals. Our present study demonstrates that the equilibrium of conformational transition of GPCRs without ligands determines the steady-state levels of cAMP in immature OSNs, which ultimately determine the expression levels of A-P targeting molecules. In contrast, expression of glomerular segregation molecules is regulated by the stimulus-driven neuronal activity in mature OSNs (Figure 7C). Amounts of stimuli appear to be the major determinants of the expression levels of glomerular segregation molecules. OR-specific rate-limiting factors of cAMP production are different between the agonist-independent and -dependent processes. Thus, it is conceivable that rank orders of ORs become different for the agonist-independent and -dependent processes of cAMP production.
Using dissociated OSN cells, intrinsic neuronal activity has been detected in the absence of odorous ligand (Reisert, 2010). In the visual system, spontaneous firing waves in the retina play a crucial role in shaping the neuronal map during the critical period in the first 1–2 postnatal weeks (Feller, 2002; McLaughlin et al., 2003; Penn et al., 1998). Therefore, it has been thought that the intrinsic neuronal activity in the olfactory system may play roles in the olfactory map formation (Connelly et al., 2013; Reisert, 2010). Although such activity may be involved in the regulation of glomerular segregation, it is unlikely that the intrinsic neuronal activity influences the A-P targeting. This is because the expression of A-P targeting molecules is not affected by naris occlusion or by Kir2.1 overexpression. Some ORs may generate high-enough baseline activities that activate the canonical signal transduction pathway. However, the activity-high mutant, E268A, did not affect the expression of glomerular segregation molecules at all (Figure 4B). Thus, it is unlikely that the agonist-independent OR activity is the source of the intrinsic neuronal activity. The intrinsic OSN activity appears to be generated by the canonical signaling pathway using Golf and CNG channels and probably requires promiscuous activation of the ligand-interaction site in ORs. It has been assumed that endogenous ligands in the amniotic fluid may influence the olfactory map formation in fetus (Coppola and O’Connell, 1989). Since our present study demonstrates that A-P targeting is not influenced by OR ligands (Figure 1B), it is unlikely that the intrinsic ligands in the amniotic fluid affect the A-P targeting.
Gs and Golf are structurally similar, sharing high amino acid identity. Furthermore, both mediate OR signals and activate ACIII in OSNs. However, their functional differences in the cellular context have not been fully recognized. In the present study, we found that Gs detects GPCR baseline activity more efficiently, generating higher cAMP than Golf, although dose-response properties are similar (Figures 6 and S4). How can Gs and Golf selectively transduce agonist-independent and -dependent activities, respectively? In immature OSNs, CNG channels are not yet expressed and OR baseline activities are transduced by Gs to produce cAMP that leads to PKA activation. Steady-state levels of cAMP determine the transcription levels of A-P targeting molecules via PKA. In mature OSNs, stimulus-driven or ligand-induced OR activities are transduced by Golf, resulting in a high-level of cAMP that activates CNG channels. It has been reported that Golf processes a higher turnover rate of GTP to GDP compared with Gs (Liu et al., 2001; Seifert et al., 1998). These characteristics of Golf are well-adapted to precisely detect temporal changes of cAMP signals in mature OSNs. Temporal regulation of G-protein expression, Gs in immature and Golf in mature OSNs, is important to separate two olfactory siganaling pathways, non-canonical and canonical, during development (Figure 7C).
Agonist-independent activity had long been regarded as baseline noise created by GPCRs, and its biological role was not fully appreciated. However, recent studies of crystal structures and molecular dynamics have revealed the inner workings of various GPCRs (Nygaard et al., 2013; Rasmussen et al., 2011a; Rasmussen et al., 2011b; Rosenbaum et al., 2009): The extracellular cavity determines ligand specificity, whereas the intracellular cavity determines G protein selectivity and levels of GPCR baseline activities. The olfactory system makes use of the extensive functionality of the largest family of GPCRs: The variability in the extracellular cavity of ORs contributes to the recognition of a vast diversity of odor ligands, and the diversity in the intracellular loops contributes to the generation of variable but specific levels of OR baseline activities.
After 22 years since the discovery of the OR-gene (Buck and Axel, 1991), it is now clear what defines the identity of OSNs in OR-instructed axonal projection. Our present studies have revealed that the equilibrium of conformational transitions set by each OR is what determines the transcription levels of A-P targeting molecules in OSNs.
EXPERIMENTAL PROCEDURES
Mutant Mice
ACIII-KO mouse, MOR10-tagging mouse and Kir2.1-overexpressing mouse are described previously (Takeuchi et al., 2010; Wong et al., 2000; Yu et al., 2004). To generate a MOR23 minigene construct, a 10.1kb SacI fragment containing the MOR23 gene from a BAC clone of C57BL/6 mouse (RP23–306I18) was subcloned into pBluescript II SK(+). The 930bp coding sequence of MOR23 was replaced with that of β2-AR. The SacII fragment containing IRES-gapECFP or IRES-gapEYFP was inserted downstream of β2-AR. Transgene sequences were excised by BssHII digestion, separated from the vector DNA by sucrose gradient centrifugation, and then microinjected into the pronuclei of C57BL/6 embryos.
OMACS-Cre knock-in (Kobayakawa et al., 2007) and Gs floxed (Chen et al., 2005) mice were previously reported. Golf-KO (Belluscio et al., 1998) was kindly provided by R. Axel. Genotypes of mice used in this study are as follows: wild-type, Golfwt/wt/Gsflox/flox/OMACSwt/wt/rI7-CFP+; Golf-KO, Golf−/−/Gsflox/flox/OMACSwt/wt/rI7-CFP+; Gs-CKO, Golfwt/wt/Gsflox/flox/OMACSCre/wt or Cre/Cre/rI7-CFP+; Golf-KO/Gs-CKO, Golf−/−/Gsflox/flox/OMACSCre/wt or Cre/Cre/rI7-CFP+. Genotypes were determined by PCR.
All animal experiments were approved by the Animal Care Committee in the University of Tokyo.
Quantitative RT-PCR
Quantitative PCR was performed as described previously (Takeuchi et al., 2010). Expression levels of Nrp1, PlexinA1, Kirrel2 and Kirrel3 were normalized to that of NCAM. Primer sets were designed by Universal Probe Library (Roche) and Nihon Gene Research Laboratories. Primer sequences are in the Supplementary Information.
Luciferase Assay
For the measurement of receptor activities, a luciferase assay was performed as described (Saito et al., 2004; Saito et al., 2009; Tsuboi et al., 2011). Details are in the Supplementary Information. All experiments were performed in triplicates and data represent mean ± SEM. Experiments were performed at least 3 times, each with triplicate samples. We used Excel 2010 (Microsoft) and Prism 5 (GraphPad) softwares for statistical analyses and curve fitting. We used three parameter Hill equations for curve fittings.
OR Gene Cloning
OR coding sequences were PCR-amplified from genomic DNA or OE cDNA of C57BL/6 mice and cloned into pME18S-F-R expression vector containing N-terminal FLAG and rhodopsin tags. OR expression was driven by the SRα promoter (Tsuboi et al., 2011). The sequence of N-terminal tag was MDYKDDDDKEFMNGTEGPNFYLE. For the expression of ORs, thirty class II OR genes (Zhang et al., 2004) were chosen, introduced into pME18S-F-R, and transfected into HEK293 cells. OR nomenclatures were based on Zhang and Firestein (Zhang and Firestein, 2002). Gs and Golf sequences were PCR-amplified from OE cDNA. To generate OR:: Gs and OR:: Golf, a flexible linker sequence, GGAGGA, was inserted into the junction of OR and G-protein coding sequences.
Odorant Exposure
MOR29B-YFP transgenic mice (Tsuboi et al., 2011) (hemizygotes in pure C57BL/6 background) were kept in normal cages (26 × 40 × 18 cm) with wood shavings until P21. In the vanillin-rich cages, 20g solid powder of vanillin (Wako) was placed in the bedding of each mouse cage. Mice were housed in the control or vanillin-rich cages from P21 to P31. Littermates were analyzed in the control experiments.
Experimental procedures for generation of coding swap mutant mice, histochemistry, fluorescent signals, luciferase assay, quantification of cAMP, quantification of cell surface ORs, naris occlusion and immunocytochemistry are in the Supplemental Information.
Supplementary Material
HIGHLIGHTS.
Agonist-independent GPCR activity regulates A-P targeting of OSN axons
Receptor mutants with altered baseline activity caused shifts in glomerular locations
A stimulatory G protein (Gs), but not Golf, mediates the OR baseline activity
This is the first demonstration of in vivo function of GPCR noise during development
ACKNOWLEDGEMENTS
We thank R. Axel for Golf-KO mice; R. and K. Kobayakawa’s for Omacs-cre mice; S. Suzuki and A. Miyajima for FACS analysis; A. Katsuyama for technical assistance; J.-P. Changeux, L. Luo, O. Nureki and H. Kato for insightful discussion; and J. Ngai, L. Buck and our laboratory members for valuable comments. Supported by the PRESTO program of Japan Science and Technology Corporation (T.I.), Toray Science Foundation (H.S.), Sumitomo Foundation (T.I.), Nakajima Foundation (T.I.), Mitsubishi Foundation (H.S. and T.I.), Japan Foundation for Applied Enzymology (T.I., H.T., H.N. and H.S.), grants in aid from the Ministry of Education, Culture, Sports, Science and Technology (MEXT) of Japan (T.I., H.N., H.T., and H.S.), and a Specially Promoted Research Grant from MEXT of Japan (H.S.).
REFERENCES
- Ballesteros JA, Jensen AD, Liapakis G, Rasmussen SG, Shi L, Gether U, and Javitch JA (2001). Activation of the β2-adrenergic receptor involves disruption of an ionic lock between the cytoplasmic ends of transmembrane segments 3 and 6. J. Biol. Chem 276, 29171–29177. [DOI] [PubMed] [Google Scholar]
- Belluscio L, Gold GH, Nemes A, and Axel R (1998). Mice deficient in Golf are anosmic. Neuron 20, 69–81. [DOI] [PubMed] [Google Scholar]
- Bond RA, and Ijzerman AP (2006). Recent developments in constitutive receptor activity and inverse agonism, and their potential for GPCR drug discovery. Trends Pharmacol. Sci 27, 92–96. [DOI] [PubMed] [Google Scholar]
- Buck L, and Axel R (1991). A novel multigene family may encode odorant receptors: a molecular basis for odor recognition. Cell 65, 175–187. [DOI] [PubMed] [Google Scholar]
- Chen M, Gavrilova O, Liu J, Xie T, Deng C, Nguyen AT, Nackers LM, Lorenzo J, Shen L, and Weinstein LS (2005). Alternative Gnas gene products have opposite effects on glucose and lipid metabolism. Proc. Natl. Acad. Sci. U S A 102, 7386–7391. [DOI] [PMC free article] [PubMed] [Google Scholar]
- Chen Y, and Flanagan JG (2006). Follow your nose: axon pathfinding in olfactory map formation. Cell 127, 881–884. [DOI] [PubMed] [Google Scholar]
- Chesler AT, Zou DJ, Le Pichon CE, Peterlin ZA, Matthews GA, Pei X, Miller MC, and Firestein S (2007). A G protein/cAMP signal cascade is required for axonal convergence into olfactory glomeruli. Proc. Natl. Acad. Sci. U S A 104, 1039–1044. [DOI] [PMC free article] [PubMed] [Google Scholar]
- Chess A, Simon I, Cedar H, and Axel R (1994). Allelic inactivation regulates olfactory receptor gene expression. Cell 78, 823–834. [DOI] [PubMed] [Google Scholar]
- Col JA, Matsuo T, Storm DR, and Rodriguez I (2007). Adenylyl cyclase-dependent axonal targeting in the olfactory system. Development 134, 2481–2489. [DOI] [PubMed] [Google Scholar]
- Connelly T, Savigner A, Ma M (2013). Spontaneous and sensory-evoked activity in mouse olfactory sensory neurons with defined odorant receptors. J. Neurophysiol 110 (1), 55–62. [DOI] [PMC free article] [PubMed] [Google Scholar]
- Coppola DM, and O’Connell RJ (1989). Stimulus access to olfactory and vomeronasal receptors in utero. Neurosci. Lett 106, 241–248. [DOI] [PubMed] [Google Scholar]
- Feinstein P, Bozza T, Rodriguez I, Vassalli A, and Mombaerts P (2004). Axon guidance of mouse olfactory sensory neurons by odorant receptors and the β2 adrenergic receptor. Cell 117, 833–846. [DOI] [PubMed] [Google Scholar]
- Feldheim DA, and O’Leary DD (2010). Visual map development: bidirectional signaling, bifunctional guidance molecules, and competition. Cold Spring Harb. Perspect. Biol 2, a001768. [DOI] [PMC free article] [PubMed] [Google Scholar]
- Feller MB (2002). The role of nAChR-mediated spontaneous retinal activity in visual system development. J. Neurobiol 53, 556–567. [DOI] [PubMed] [Google Scholar]
- Imai T, and Sakano H (2008). Odorant receptor-mediated signaling in the mouse. Curr. Opin. Neurobiol 18, 251–260. [DOI] [PubMed] [Google Scholar]
- Imai T, Suzuki M, and Sakano H (2006). Odorant receptor-derived cAMP signals direct axonal targeting. Science 314, 657–661. [DOI] [PubMed] [Google Scholar]
- Imai T, Yamazaki T, Kobayakawa R, Kobayakawa K, Abe T, Suzuki M, and Sakano H (2009). Pre-target axon sorting establishes the neural map topography. Science 325, 585–590. [DOI] [PubMed] [Google Scholar]
- Johns DC, Marx R, Mains RE, O’Rourke B, and Marban E (1999). Inducible genetic suppression of neuronal excitability. J. Neurosci 19, 1691–1697. [DOI] [PMC free article] [PubMed] [Google Scholar]
- Kato A, Katada S, and Touhara K (2008). Amino acids involved in conformational dynamics and G protein coupling of an odorant receptor: targeting gain-of-function mutation. J. Neurochem 107, 1261–1270. [DOI] [PubMed] [Google Scholar]
- Kobayakawa K, Kobayakawa R, Matsumoto H, Oka Y, Imai T, Ikawa M, Okabe M, Ikeda T, Itohara S, Kikusui T, Mori K, and Sakano H (2007). Innate versus learned odour processing in the mouse olfactory bulb. Nature 450, 503–508. [DOI] [PubMed] [Google Scholar]
- Kobilka BK, and Deupi X (2007). Conformational complexity of G-protein-coupled receptors. Trends Pharmacol. Sci 28, 397–406. [DOI] [PubMed] [Google Scholar]
- Liu HY, Wenzel-Seifert K, and Seifert R (2001). The olfactory G protein G(alphaolf) possesses a lower GDP-affinity and deactivates more rapidly than G(salphashort): consequences for receptor-coupling and adenylyl cyclase activation. J. Neurochem 78, 325–338. [DOI] [PubMed] [Google Scholar]
- Luo L, and Flanagan JG (2007). Development of continuous and discrete neural maps. Neuron 56, 284–300. [DOI] [PubMed] [Google Scholar]
- McLaughlin T, Torborg CL, Feller MB, O’Leary DD (2003). Retinotopic map refinement requires spontaneous retinal waves during a brief critical period of development. Neuron 40, 1147–1160. [DOI] [PubMed] [Google Scholar]
- Milligan G (2000). Insights into ligand pharmacology using receptor-G-protein fusion proteins. Trends Pharmacol. Sci 21, 24–28. [DOI] [PubMed] [Google Scholar]
- Miyamichi K, Serizawa S, Kimura HM, and Sakano H (2005). Continuous and overlapping expression domains of odorant receptor genes in the olfactory epithelium determine the dorsal/ventral positioning of glomeruli in the olfactory bulb. J. Neurosci 25, 3586–3592. [DOI] [PMC free article] [PubMed] [Google Scholar]
- Mombaerts P, Wang F, Dulac C, Chao SK, Nemes A, Mendelsohn M, Edmondson J, and Axel R (1996). Visualizing an olfactory sensory map. Cell 87, 675–686. [DOI] [PubMed] [Google Scholar]
- Mori K, and Sakano H (2011). How is the olfactory map formed and interpreted in the mammalian brain? Annu. Rev. Neurosci 34, 467–499. [DOI] [PubMed] [Google Scholar]
- Nakatani H, Serizawa S, Nakajima M, Imai T, and Sakano H (2003). Developmental elimination of ectopic projection sites for the transgenic OR gene that has lost zone specificity in the olfactory epithelium. Eur. J. Neurosci 18, 2425–2432. [DOI] [PubMed] [Google Scholar]
- Nygaard R, Zou Y, Dror RO, Mildorf TJ, Arlow DH, Manglik A, Pan AC, Liu CW, Fung JJ, Bokoch MP, Thian FS, Kobilka TS, Shaw DE, Mueller L, Prosser RS, and Kobilka BK, (2013). The dynamic process of β2-adrenergic receptor activation. Cell 152, 532–542. [DOI] [PMC free article] [PubMed] [Google Scholar]
- O’Dowd BF, Hnatowich M, Regan JW, Leader WM, Caron MG, and Lefkowitz RJ (1988). Site-directed mutagenesis of the cytoplasmic domains of the human β2-adrenergic receptor. Localization of regions involved in G protein-receptor coupling. J. Biol. Chem 263, 15985–15992. [PubMed] [Google Scholar]
- Penn AA, Riquelme PA, Feller MB, Shatz CJ (1998). Competition in retinogeniculate patterning driven by spontaneous activity. Science 279, 2108–2112. [DOI] [PubMed] [Google Scholar]
- Rasmussen SG, Choi HJ, Fung JJ, Pardon E, Casarosa P, Chae PS, Devree BT, Rosenbaum DM, Thian FS, Kobilka TS, Schnapp A, Konetzki I, Sunahara RK, Gellman SH, Pautsch A, Steyaert J, Weis WI, and Kobilka BK (2011a). Structure of a nanobody-stabilized active state of the β2 adrenoceptor. Nature 469, 175–180. [DOI] [PMC free article] [PubMed] [Google Scholar]
- Rasmussen SG, DeVree BT, Zou Y, Kruse AC, Chung KY, Kobilka TS, Thian FS, Chae PS, Pardon E, Calinski D, Mathiesen JM, Shah ST, Lyons JA, Caffrey M, Gellman SH, Steyaert J, Skiniotis G, Weis WI, Sunahara RK, and Kobilka BK (2011b). Crystal structure of the β2 adrenergic receptor-Gs protein complex. Nature 477, 549–555. [DOI] [PMC free article] [PubMed] [Google Scholar]
- Reisert J (2010). Origin of basal activity in mammalian olfactory receptor neurons. J. Gen. Physiol 136, 529–540. [DOI] [PMC free article] [PubMed] [Google Scholar]
- Ressler KJ, Sullivan SL, and Buck LB (1994). Information coding in the olfactory system: evidence for a stereotyped and highly organized epitope map in the olfactory bulb. Cell 79, 1245–1255. [DOI] [PubMed] [Google Scholar]
- Rosenbaum DM, Rasmussen SG, and Kobilka BK (2009). The structure and function of G-protein-coupled receptors. Nature 459, 356–363. [DOI] [PMC free article] [PubMed] [Google Scholar]
- Saito H, Kubota M, Roberts RW, Chi Q, and Matsunami H (2004). RTP family members induce functional expression of mammalian odorant receptors. Cell 119, 679–691. [DOI] [PubMed] [Google Scholar]
- Saito H, Chi Q, Zhuang H, Matsunami H, and Mainland JD (2009). Odor coding by a Mammalian receptor repertoire. Sci. Signal 2, ra9. [DOI] [PMC free article] [PubMed] [Google Scholar]
- Sakano H (2010). Neural map formation in the mouse olfactory system. Neuron 67, 530–542. [DOI] [PubMed] [Google Scholar]
- Savarese TM, and Fraser CM (1992). In vitro mutagenesis and the search for structure-function relationships among G protein-coupled receptors. Biochem. J 283 (Pt 1), 1–19. [DOI] [PMC free article] [PubMed] [Google Scholar]
- Seifert R, Wenzel-Seifert K, Lee TW, Gether U, Sanders-Bush E, and Kobilka BK (1998). Different effects of Gsα splice variants on β2-adrenoreceptor-mediated signaling. The β2-adrenoreceptor coupled to the long splice variant of Gsα has properties of a constitutively active receptor. J. Biol. Chem 273, 5109–5116. [PubMed] [Google Scholar]
- Serizawa S, Ishii T, Nakatani H, Tsuboi A, Nagawa F, Asano M, Sudo K, Sakagami J, Sakano H, Ijiri T, Matsuda Y, Suzuki M, Yamamori T, Iwakura Y, Sakano H (2000). Mutually exclusive expression of odorant receptor transgenes. Nat. Neurosci 3, 687–693. [DOI] [PubMed] [Google Scholar]
- Serizawa S, Miyamichi K, Nakatani H, Suzuki M, Saito M, Yoshihara Y, and Sakano H (2003). Negative feedback regulation ensures the one receptor-one olfactory neuron rule in mouse. Science 302, 2088–2094. [DOI] [PubMed] [Google Scholar]
- Serizawa S, Miyamichi K, Takeuchi H, Yamagishi Y, Suzuki M, and Sakano H (2006). A neuronal identity code for the odorant receptor-specific and activity-dependent axon sorting. Cell 127, 1057–1069. [DOI] [PubMed] [Google Scholar]
- Takeuchi H, Inokuchi K, Aoki M, Suto F, Tsuboi A, Matsuda I, Suzuki M, Aiba A, Serizawa S, Yoshihara Y, Fujisawa H, and Sakano H (2010). Sequential arrival and graded secretion of Sema3F by olfactory neuron axons specify map topography at the bulb. Cell 141, 1056–1067. [DOI] [PubMed] [Google Scholar]
- Tsuboi A, Imai T, Kato HK, Matsumoto H, Igarashi KM, Suzuki M, Mori K, and Sakano H (2011). Two highly homologous mouse odorant receptors encoded by tandemly-linked MOR29A and MOR29B genes respond differently to phenyl ethers. Eur J. Neurosci 33, 205–213. [DOI] [PubMed] [Google Scholar]
- Vassar R, Chao SK, Sitcheran R, Nunez JM, Vosshall LB, and Axel R (1994). Topographic organization of sensory projections to the olfactory bulb. Cell 79, 981–991. [DOI] [PubMed] [Google Scholar]
- Vassart G, and Costagliola S (2011). G protein-coupled receptors: mutations and endocrine diseases. Nat. Rev. Endocrinol 7, 362–372. [DOI] [PubMed] [Google Scholar]
- Wang F, Nemes A, Mendelsohn M, and Axel R (1998). Odorant receptors govern the formation of a precise topographic map. Cell 93, 47–60. [DOI] [PubMed] [Google Scholar]
- Wong ST, Trinh K, Hacker B, Chan GC, Lowe G, Gaggar A, Xia Z, Gold GH, and Storm DR (2000). Disruption of the type III adenylyl cyclase gene leads to peripheral and behavioral anosmia in transgenic mice. Neuron 27, 487–497. [DOI] [PubMed] [Google Scholar]
- Yagi T, Tokunaga T, Furuta Y, Nada S, Yoshida M, Tsukada T, Saga Y, Takeda N, Ikawa Y, and Aizawa S (1993). A novel ES cell line, TT2, with high germline-differentiating potency. Anal. Biochem 214, 70–76. [DOI] [PubMed] [Google Scholar]
- Yu CR, Power J, Barnea G, O’Donnell S, Brown HE, Osborne J, Axel R, and Gogos JA (2004). Spontaneous neural activity is required for the establishment and maintenance of the olfactory sensory map. Neuron 42, 553–566. [DOI] [PubMed] [Google Scholar]
- Yu S, Yu D, Lee E, Eckhaus M, Lee R, Corria Z, Accili D, Westphal H, and Weinstein LS (1998). Variable and tissue-specific hormone resistance in heterotrimeric Gs protein α-subunit (Gsα) knockout mice is due to tissue-specific imprinting of the gsα gene. Proc. Natl. Acad. Sci. U S A 95, 8715–8720. [DOI] [PMC free article] [PubMed] [Google Scholar]
- Zhang X, and Firestein S (2002). The olfactory receptor gene superfamily of the mouse. Nat. Neurosci 5, 124–133. [DOI] [PubMed] [Google Scholar]
- Zhang X, Rogers M, Tian H, Zou DJ, Liu J, Ma M, Shepherd GM, and Firestein SJ (2004). High-throughput microarray detection of olfactory receptor gene expression in the mouse. Proc. Natl. Acad. Sci. U S A 101, 14168–14173. [DOI] [PMC free article] [PubMed] [Google Scholar]
- Zhuang H, and Matsunami H (2008). Evaluating cell-surface expression and measuring activation of mammalian odorant receptors in heterologous cells. Nat. Protoc 3, 1402–1413. [DOI] [PMC free article] [PubMed] [Google Scholar]
Associated Data
This section collects any data citations, data availability statements, or supplementary materials included in this article.