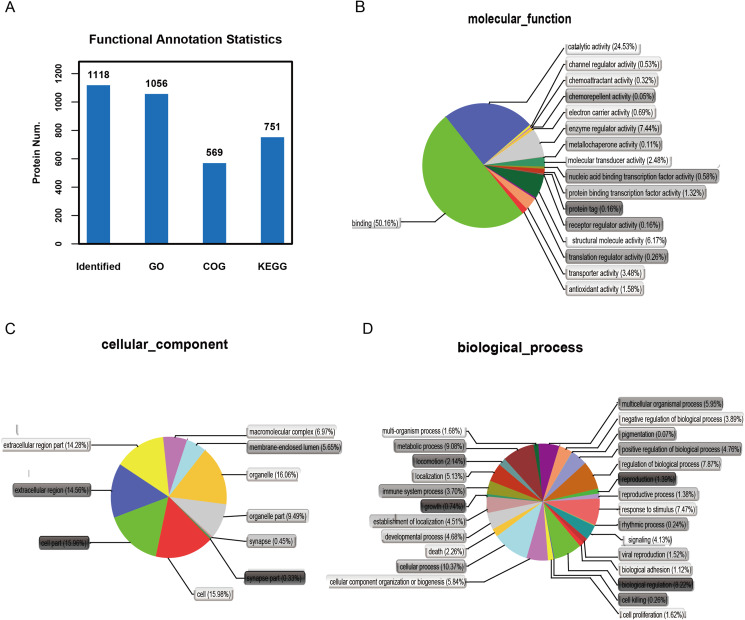
Figure 3. Functional annotation of differential proteins.
(A) Different function annotation result statistics graph. The x-coordinate represents identification or different annotation methods, and the y-coordinate represents the number of proteins corresponding to the x-coordinate. Classification of 1,056 differently expressed proteins in three groups of cervical mucus samples according to (B) biological process, (C) cellular component and (D) molecular function by GO analysis. Statistical chart of functional annotation results of different proteins GO.

