

Abstract
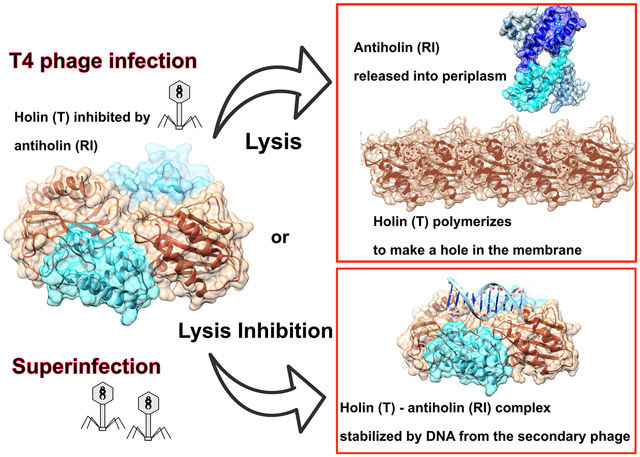
Optimal phage propagation depends on the regulation of the lysis of the infected host cell. In T4 phage infection, lysis occurs when the holin protein (T) forms lesions in the host membrane. However, the lethal function of T can be blocked by an antiholin (RI) during lysis inhibition (LIN). LIN sets if the infected cell undergoes superinfection, then the lysis is delayed until host/phage ratio becomes more favorable for the release of progeny. It has been thought that a signal derived from the superinfection is required to activate RI. Here we report structures that suggest a radically different model in which RI binds to T irrespective of superinfection, causing it to accumulate in a membrane as heterotetrameric 2RI-2T complex. Moreover, we show the complex binds non-specifically to DNA, suggesting that the gDNA from the superinfecting phage serves as the LIN signal and that stabilization of the complex by DNA binding is what defines LIN. Finally, we show that soluble domain of free RI crystallizes in a domain-swapped homotetramer, which likely works as a sink for RI molecules released from the RI-T complex to ensure efficient lysis. These results constitute the first structural basis and a new model not only for the historic LIN phenomenon but also for the temporal regulation of phage lysis in general.
Keywords: Lysis, holin, antiholin, SAR domain, domain swapping, GAF domain, LIN-lysis inhibition, phage
Graphical abstract
Introduction
There is significant interest in the use of phage-based therapeutics as treatments for multiple-drug resistant bacterial infections [1], and thus knowledge on how phage infections are controlled is important. In double-stranded DNA phages the length and fecundity of the infection cycle is determined by small membrane proteins called holins and their specific regulators, the antiholins [2]. Holins initiate lysis by permeabilizing the cytoplasmic membrane at a genetically programmed time, setting in motion a lysis pathway that results in release of the viral progeny. [3]. It has been shown that the T4 phage holin is produced from the late genes and accumulates harmlessly in the membrane until the optimal time for lysis [3]. While holins are composed primarily of transmembrane α-helices [4] the holin from the T4 phage (T), is somewhat unique among the identified holins as having substantial cytoplasmic (~ 32 residues) and periplasmic (~150 residues) domains with only a single transmembrane domain [3] It is the polymerization of these transmembrane domains that leads to the formation of lesions in the membrane which allows phage peptidoglycan-degrading enzymes into the periplasm leading to the cell lysis. While the steps of lysis are clear, precise molecular mechanism is not well understood.
To avoid premature lysis and optimize the outcome of an infection, the polymerization of the holin is tightly regulated. The periplasmic and cytoplasmic antiholins, RI and RIII regulate T4 holin function by binding to its soluble domains [5] [6] [7] [8]. RI has a signal arrest and release (SAR) domain at its N-terminus, so that it is secreted to the periplasm in a membrane-tethered form and then released from the bilayer [9]. The SAR domain has been shown to quantitatively exit the bilayer when the membrane potential collapses [10].
Lysis inhibition (LIN) is a phenomenon first discovered in the 1940’s by the Delbrück phage group [11] and linked to a superinfection [12]. A superinfection refers to a viral attack on an already infected cell. It has been suggested that a superinfection induces LIN because there are fewer hosts than phage in the media - a time when it is not advantageous to release the new progeny. While the mechanism that triggers LIN is not known, LIN occurs even when the infected bacteria contains assembled viral particles and sufficient for lysis amounts of holin and endolysin [3]. The superinfection is aborted, when 170 kb DNA and the internal capsid proteins of superinfecting phage are blocked from entering the cytoplasm by periplasmic proteins deployed by the primary phage [13]. The DNA of the superinfecting phage is trapped in the periplasm where it is degraded by nucleases [13]. It has been proposed that a signal from the superinfecting phage is detected and this leads to lysis inhibition through the stabilization of the RI antiholin protein from the primary phage [5]. RI is unstable once released from the membrane, its exposed SAR-domain recognized by periplasmic protease DegP resulting in rapid degradation of RI [9]. In this scenario, stabilization of RI in response to a superinfection leads to an increase in the content of free periplasmic RI, which would bind to the periplasmic domain of T and prevent it from making holes. However, there is very little known about the molecular basis of a superinfection, stabilization of RI, and interplay between RI and the holin T resulting in LIN.
Following on our previous work on characterizing T4 lytic proteins [6], we now report the crystal structures of the periplasmic/soluble domain of the antiholin RI (sRI) and of the complex between sRI and the periplasmic domain of the holin T (sT) to contribute to a molecular understanding of the mechanism of lysis and LIN in T4. This structural information has led to the identity of the signal for LIN. The results are discussed in terms of a new model for the T4 lysis pathway and for the mechanism of LIN.
Results
The structure of the RI antiholin periplasmic domain in free form
The periplasmic domain of the RI antiholin (residues 25 to 92, sRI) with a C-terminal His-tag was recombinantly expressed in Shuffle® E. coli cells which have been shown to facilitate disulfide bond formation and increase protein solubility. The protein was purified to greater than 95% homogeneity and crystallized. Crystals formed in the hexagonal P6222 space group with one molecule of sRI in the asymmetric unit. The crystal structure of sRI was solved by the single anomalous dispersion (SAD) method using selenomethionine-modified protein (Table 1). The structure was refined to 2.2 Å resolution, and the final model had an R factor = 28.4% and Rfree = 32.3% with good stereo chemistry.
Table 1. Crystallographic data and refinement statistics.
| Data collection | sRI | sRI-sT (Se-Met) |
sRI-sT | sRI-sTΔα0 |
|---|---|---|---|---|
| PDB ID | 6PSH | 6PSK | 6PXE | 6PX4 |
| Space group | P6222 | P6522 | P21 | R32:H |
| Cell dimensions | ||||
| a, b,c (Å) | 49.98, 49.98, 118.68 | 120.67, 120.67, 85.51 | 78.59, 82.56,81.43 | 116.546, 116.546, 223.384 |
| α,β,γ(°) | 90.0, 90.0, 120.0 | 90.0, 90.0, 120.0 | 90.0, 102.2, 90.0 | 90, 90, 120 |
| Resolution (Å) | 40.66–2.2 (2.25–2.2) | 45–2.2 (2.75–2.2) | 100–2.3 (2.34–2.3) | 46–1.65 (1.75–1.65) |
| R sym | 0.09 (0.617) | 0.156 (0.76) | 0.15 (0.765) | 0.06 (0.34) |
| Ι/σ(Ι) | 6.3 (3.4) | 16.2(3.1) | 7.6 (1.3) | 16.45 (3.38) |
| Completeness (%) | 100 (99.9) | 100 (100) | 97.4(95.4) | 97.2 (85.1) |
| Redundancy | 25.1 (19.2) | 40.8 (33.2) | 5 (4.5) | 7.29 (4.64) |
| Refinement | ||||
| Resolution (Å) | 40.66–2.2 | 44.6–2.2 | 39.8–2.3 | 33.6–1.65 |
| No. reflections | 4758 | 19136 | 44127 | 68087 |
| Rwork / Rfree | 28.4/32.3 | 21.3/24.7 | 23.2/29.3 | 19.4/22.5 |
| No. atoms | ||||
| Protein | 596 | 1772 | 7297 | 3553 |
| Solvent | 14 | 119 | 31 | 250 |
| B factors average (Å) 1 | 60 | 44 | 37 | 25 |
| R.m.s. deviations | ||||
| Bond lengths (Å) | 0.01 | 0.01 | 0.01 | 0.01 |
| Bond angles (°) | 1.3 | 0.89 | 1.03 | 0.89 |
The sRI refined structure consists of three α-helices (Figure 1A). The first two helices (H1: residues 27–44 and H2: residues 46–66) look like a single long α-helix with a slight bend. It actually has a single amino acid residue, Phe45, that is not in an α-helical conformation, which causes a bend of about 15° between H1 and H2. The H2-helix is connected to H3 (residues 72–92) through a hairpin loop which is linked to the H3-helix by a disulfide bond between Cys69 and Cys75. The structure of RI is unique, based on searches of the PDB database by the vector alignment search tool (VAST) [14]. Only two hits are identified by VAST, with low similarity scores of 3.6 and 3.7 (P values 0.0105 and 0.0139). In both cases the aligned regions correspond to isolated α-helices of larger proteins.
Figure 1. Crystal structure of sRI (PDB = 6PSH).

A Ribbon diagram of tetramer observed in the crystal of the free sRI, colored by subunit: blue - subunit A, cyan - subunit B, gray - subunit C, and light green - subunit D. H1–3 helices are marked for the subunit A in corresponding color.
The domain swapped conformation of RI when bound to sT is illustrated in the overlay of sT-bound sRI (magenta) with subunit A of free sRI, H1 −3 helices are labeled for this form in magenta.
B Two views of the surface representation of the sRI tetramer, colored by subunit same as on the panel A illustrate extensive contacts among subunits.
Although the asymmetric unit of the crystal contains a single RI subunit, the crystal lattice clearly shows that RI is a homotetramer formed by the C2 space group symmetry, where the AB pair of subunits is equivalent to the CD pair (Figure 1). The total surface area of the tetramer calculated by PDBePISA [15] is 15006.7 Å2, with a total solvent-accessible surface area buried by the tetramer formation of 8618.8 Å2 representing a significant portion of a total surface. The PDBePISA solvation free energy gain (ΔGint) upon formation of the tetramer is estimated at −87 kcal/mol, the negative value indicating a large contribution of hydrophobic interactions at the interface. The calculated free energy for the tetramer dissociation (ΔGdiss) of 13.8 kcal/mol, the positive value indicating that this tetramer is thermodynamically stable. The tetramer is maintained through three distinct interfaces (Figure 1), with the majority of contacts at the interface between subunits A and B (equivalent to C and D) and at the interface between subunits A and D (equivalent to B and C). The ΔiG values, buried area, and the list of contacts for each interface are listed in Supplementary Table 1.
For the AB (equivalent to CD) interface, sRI packs in a head-to-tail fashion, where α-helices H2 and H3 comprise the head, and H1 forms the tail (Figure 1). The tail of one subunit packs onto the head of another subunit in a groove between helices H2 and H3. The AB interface involves over fifty contacts, including 10 hydrogen bonds contributing to the interactions (S. Table 1). The AD (equivalent to CB) interface is made by the long kinked α-helices (H1-H2) of one subunit running antiparallel with the H1-H2 region of the adjacent subunit (Figure 1), with the six hydrogen bonds and two salt bridges (S. Table 1) in addition to multiple hydrophobic and van der Waals contacts. The path for dissociation of the tetrameric assembly of sRI, as predicted by PDBePISA based on the lowest free energy, starts with breaking into two dimers (AB and CD). Previously, analysis with size exclusion chromatography showed that sRI was predominantly a monomer [6] with a small fraction in a dimer state. Moreover, analytical centrifugation results also showed a monomer. However, in these studies, the highest concentration probed was 1.6 mg/ml, which is much lower than the concentration used for crystallization (10 mg/ml). Our current interpretation is that oligomeric state of sRI is concentration-dependent. It can exist as compact monomer while at low concentration and go into higher oligomeric states (dimer and tetramer) at a higher concentration.
The periplasmic domain of the T holin forms a heterotetrameric complex with the periplasmic domain of the RI antiholin
To understand how the antiholin binds and inhibits T, we solved the structure of the sRI-sT complex. We have previously shown that sT forms a complex with purified sRI [6]. The two proteins co-eluted as a complex from a size exclusion column. The complex was crystallized in the P6522 space group crystals with one sRI-sT dimer in the asymmetric unit. The initial phases were determined by SAD with the complex formed between selenomethionine-modified sRI and sT. The structure of the complex was refined using diffraction data to 2.2 Å resolution, with an R factor of 21.3, an Rfree of 24.7% and good stereochemistry. The final model of the complex covers sT residues 78–218 and sRI residues 25–95 (no density was observed for sT residues 56–77 or for 96–97 of sRI). The data collection and refinement statistics are summarized in Table 1. Although the asymmetric unit of the P6522 crystals contained a single sRI-sT complex, a heterotetramer was clearly visible in the lattice (Figure 2A). Analysis by PDBePISA [15] indicates that this heterotetramer is thermodynamically stable, with a negative solvation free energy gain (ΔGint) of −24.5 kcal/mol signifying hydrophobic interface, positive free energy for tetramer dissociation (ΔGdiss) of 13 kcal/mol, and a suggested dissociation pattern of 2(RI-T). The total surface area of the tetramer is 18878 Å2, with the area buried in all interfaces of the assembly being 5550.3 Å2, almost 30% of the total surface. The data on oligomeric state in the solution obtained by size exclusion chromatography [6] were ambiguous, with the major peak calculated at 45.6 kDa - a mass larger than a calculated mass for a dimer (29.7 kDa) but smaller than a tetramer (59.4 kDa). The conclusion was made based on the analytical centrifugation data that sRIsT complex is a dimer. However, seeing in the structure how compact the heterotetramer is and taking into account that S75 column is not optimal for resolving proteins with the size closer to 60 kDa, we believe that previously obtained data are also consistent with the compact tetrameric form of sRIsT complex in solution.
Figure 2. Crystal structure of sRI-sT complex (PDB = 6PSK, 6PXE).

A Ribbon diagram of hetero-tetramer observed in crystals of the sRI-sT complex. sRI subunits are colored in light blue, and sT - in tan.
B Surface representation of the sRI-sT complex colored by electrostatic potential, the orientation is the same as on the panel A.
C 90° rotated view of the sRI-sT complex depicted on the panel A. GAF domain homolog structure (pdb ID: 2ool) shown as green licorice ribbon is superimposed on both sT subunits for a comparison. Putative positions for the elements not covered by the crystal structure are shown as dash outlined boxes: blue for the SAR domains of RI, and red for the transmembrane (TM) helix and α0 of T.
D Elements of the structure are marked on the ribbon representation of the sRI bound form of the sT. Clipped surface view of the overlaid GAF domain homolog structure (pdb ID: 2ool) is shown in green to illustrate that LC loop of sT blocks putative GAF pocket (highlighted by purple line).
In contrast to the tetrameric structure of the free sRI, sRI engages in contact with sT as a single subunit. The transition from the tetrameric state of sRI to the monomer is accomplished by a major rearrangement of the H1-helix, highlighted by a ~19 Å movement of closest to the hinge end of H1 (Leu44) and ~ 54 Å translocation of the other end of H1 at Pro28 so that it directly packs against H2 and H3 of the same molecule. Remarkably, with this large change from the elongated to compact form, the main-chain conformational changes are restricted to a short region including Phe45 which separates H1 and H2, as described above (Figure 1A, Figure 2A). The region encompassing residues 44–49 acts as a hinge and undergoes a conversion from the α-helix in the free sRI into a loop in the sRI-sT complex. This hinge allows the dramatic movement of the H1 helix (Figure 1A) from a nearly co-linear position with H2 to becoming anti-parallel to it. In the free sRI structure, the H2-H3 helices form a groove that accommodates H1 from the other subunit, whereas in the T-bound single subunit form, this groove between H2-H3 binds the H1 helix from the same subunit so that it can form the same interactions without a second subunit. This re-arrangement is known as “domain swapping” [16].
Domain swapping occurs when higher order oligomers are made through the exchange of identical domains. Through this process the same contact interface is maintained, with large changes restricted to the transitioning hinge region. The overall impact of sRI converting from its elongated form into a compact monomer is that it can bind to sT. The H1-H2 surface of the monomer becomes the interface for binding two molecules of sT in a heterotetramer. Each sRI subunit forms both hydrogen bonds and van der Waals interactions with two sT molecules (details are listed in SupplementaryTable 2), with sRI-sT interfaces 1 and 2 providing the majority of buried surface area and contacts (PDBePISA [15]). Residues from the H1 and H2 α-helices of sRI are involved in interactions primarily with the β1-LA-β2 region and the LB loop region of the sT subunit (Figure 2A, D). 21 hydrogen bonds and five salt bridges stabilizing the 2sRI-2sT complex are listed in S. Table 3. Collectively, these extensive interactions result in the heterotetrameric complex that is very stable in solution. The heterotetramer is unlikely to be due to a crystallization artifact as the same assembly was observed in all multiple crystal forms (Table 1) and it is what we observe in the cryo-EM structure described below. Using differential scanning fluorimetry (DSF), we found that the complex shows a single transition melting curve with a Tm of approximately 55° C signifying that solution sample is all in one form of a tight cooperatively melting complex. All those observations are inconsistent with the current view that RI needs to be activated/stabilized by LIN signal in order to engage with T, and prompted us to re-examine the model.
The overall structure of the periplasmic domain of the T holin
The sT structure is comprised of a central twisted antiparallel five-stranded β-sheet formed by the β1-β5 strands, flanked by two α-helices on one side of this sheet (an N-terminal α1-helix and a C-terminal α3-helix), and loops and a short α-helix (α2) on the opposite side (Figure 2D). An intrasubunit disulfide bond links Cys175 of the β4-strand with Cys207 of the α3-helix C-terminal.
A structural similarity search of sT using both VAST [14] and DALI [17] revealed unexpected matches to several GAF domain proteins (cGMP-specific phosphodiesterases (PDEs), Anabaena adenylyl cyclases, and E. coli FhlA proteins), with structural similarity scores ranging from 10 to 12.7. GAF domains are involved in oligomerization regulated by the binding of a ligand in hundreds of regulatory proteins, as well as similar to it PAS (Per, Arnt, Sim) domain of sensory and signaling pathways. While GAF/PAS domains have been shown to interact with a diverse set of small molecule regulators, the ligands for many of these proteins remain unknown. The GAF domain closest to sT with a VAST score of 12.7 at 12.6% sequence identity (PDB: 3W1T) has no ligand bound. The closest ligated structure (PDB:1MC0, VAST score=12.6 at 11.8% sequence identity) has a cyclic GMP bound in the small molecule binding pocket between the central β-sheet and surface loops/short helix. This site maps to the sT holin structure between the central β-sheet, loops LB-α2, and LC, with the potential for loops LB-β2 and LC to rearrange and position residues Glu141, His145, Asp136, Phe159, and Tyr191 to line the pocket. However, in the sT-sRI complex structure this pocket is buried, blocked by the LC loop (Figure 2D).
The region directly following the TM-helix of T (residues 56–78) does not have well defined electron density. Although these residues are predicted to form an α-helix (α0), the electron density of this region was missing in nearly all sRI-sT complex data sets. One of the two tetramers in the asymmetric unit in crystal structure in P21 had density for amino acids 62–78 of α0. It is likely that without the transmembrane helix and the membrane to support it the α0 position is disordered. We observed well-ordered electron density beginning with Phe79 of the following α-helix (α1). The position of α0 anti-parallel to α1 (Figure 2C) was modeled based on homology to other GAF domain proteins. This placement is consistent with the membrane topology as determined by the position of the sRI N-termini in the complex structure, and the membrane embedded SAR domains.
Single particle cryo-EM of the sRI-sT complex
To verify that the sRI-sT heterotetramer exists in solution, we subjected the purified sRI-T complex to cryo-electron microscopy. although the size of a single heterotetramer was below the detection limit, we were able to pick 35,432 larger particles from the Cryo-EM grid. After 3D reconstruction a density map was generated at 9.4 A resolution. The structure of the sRIsT complex from the P21 crystal (PDB = 6PXE) was used to fit and refine into the density map. The density of the observed particles was fully accounted for by four sRIsT heterotetramers (Figure 3). The heterotetramers in the assembly observed in cryo-EM are mainly interacting through sRI H3 and cryo-EM are mainly interacting through sRI H3 α1 of sT, with the α0 regions (residues 55–77) bundling in the middle of the assembly (Figure 3). The assembly of the heterotetramers resemble the organization of the heterotetramers in the lattice of P6522 crystals, and are unlikely to be physiologically relevant. Nevertheless, these results validate the existence of the heterotetramer in solution, and perhaps indicate the propensity of α0 to self-interact.
Figure 3. Cryo-EM structure of sRI-sT heterotetramers in solution.

Crystal structure of sRIsT complex from the P21 crystal (PDB = 6PXE) with the longest residue coverage was used to fit and refine into the EM density resulting in the assembly of four sRIsT heteroteramers (colored by tetramer).
The holin-antiholin complex binds dsDNA
Our data suggest that RI-T complex is pre-formed in the infected cell and therefore the establishment of LIN under condition of a superinfecting phage would stabilize the RI-T complex as an inhibited form of T and prevent the formation of a membrane hole.
We next looked at likely candidates molecules that would stabilize the complex. Since other T4-like phages including T2 and T6 can induce LIN in T4-infections but have different internal protein molecules [19], we hypothesized that the signal molecule was the gDNA. It has been shown that DNA of the super-infecting phage is trapped and degraded in the E.coli periplasm [13]. Since the holin-antiholin complex would need to sense any degradation products of the gDNA, we reasoned that the binding to the complex would not likely be sequence-specific. To test this, we first performed pilot mobility shift assays with three nucleic acids of different length and sequences and the purified sRI-sT complex. We observed that three DNA molecules, including single stranded (ss) 70 bp, double stranded (ds) 30 bp, and ds 58 bp species, were all shifted by the sRI-sT complex in a protein concentration dependent manner to a position where Coomassie staining shows the protein band (Figure 4). In contrast, purified sRI alone did not cause these molecules to shift (data not shown). To assess the relative affinity, we determined the apparent Kd values using intrinsic fluorescence quenching. The results, summarized in Table 4, show that the sRI-sT complex binds a wide variety of nucleic acids, including double and single stranded DNA and RNA fragments, with no identifiable sequence specificity. The sRI-sT complex also binds deoxyribonucleotides, tri-, di-, and monophosphate nucleotides. Binding was driven more by the nucleoside moiety than by phosphate groups, as guanosine has a lower Kd (43 μM) than AMP (72.4 μM) or ADP (213.6 μM), and 5-phosphorylribose-1-pyrophosphate has a relatively high Kd of 225.9 μM.
Figure 4. Binding of sRI-sT complex to DNA tested by EMSA.

DNA was separated in acrylamide gel in the absence or in the presence of various amounts of sRI-sT protein complex. The first two panels are stained for DNA by gel green, and the last panel shows the same gel (for 30 bp DNA) stained with Coomassie to visualized the protein.
Table 4: RI-T complex binds dsDNA.
Apparent Kd values obtained by instristic fluorescence quenching.
| ligand | Kd(μM) |
|---|---|
| 58 bp ds DNA | 0.04 |
| 30 bp ds DNA | 0.29 |
| 21 bp ds DNA | 0.36 |
| 70 bp ss DNA | 1 |
| 20 bp RNA | 6.1 |
| dNTP mixture | 30.2 |
| dATP | 18.9 |
| AMP | 72.4 |
| ADP | 213.6 |
| guanosine | 43 |
| 5-phosphorylribose-1-pyrophosphate | 255.9 |
| phosphate | 18600 |
Discussion
The LIN phenomenon was documented in the first experiments of modern molecular genetics and has been the subject of many genetic and physiological studies [11]. Clever experiments have been devised and implemented to figure out the proteins and their functional connections, as reviewed by Abedon [20]. However, the molecular mechanism of lysis and lysis inhibition in T4 phage has remained obscure with the lack of structural information and no homology to holins and antiholins of other characterized phages [4]. The most recent model [8] proposed that the antiholin RI plays no role in normal lysis timing; instead in the absence of a superinfection, RI is synthesized, secreted to the periplasm, and then rapidly degraded. It is only when RI is stabilized by an unknown signal generated by a superinfection event that it accumulates sufficiently to bind to the periplasmic domain of the T holin and to block progression in the hole-formation pathway.
The sRI2-sT2 heterotetramer structure analysis enabled us to propose a new model with additional mechanistic insights. Our data clearly point to the formation of the heterotetrameric RI-T complex as an early step in the normal pathway for T-mediated lysis. The position of the N-proximal helix of sRI in the heterotetramer is important as it determines the position of the membrane within which the RI SAR domain is embedded (Figure 2C). This argues that newly exported membrane-tethered RI forms complexes with T. Since RI is expressed in both early and late transcriptional phases whereas T is a late protein [21], there are membrane-tethered RI molecules present before the first T molecules appear, sequestering the T holin to prevent premature lysis. From this perspective, the stability of the sRI:sT complex presents a conceptual problem: what allows T to be liberated to pursue oligomerization and hole formation? Before T begins to accumulate at the start of late gene expression, the level of membrane-tethered RI available for complex formation would be limited by the metastable integration of the SAR domains in the bilayer and its recognition by DegP in the periplasm which results in RI degradation [9]. The simple view of lysis triggering is that T, which is proteolytically stable and invariably membrane tethered, eventually titrates out the supply of RI. The accumulation of free T would then follow the familiar pathway of reaching a critical concentration, followed by formation of holin oligomers [22] that depolarize the membrane. It has been established that SAR domains exit the membrane quantitatively after depolarization [23], suggesting that it is the exit of the N-terminal SAR domain of RI from the bilayer that disrupts the RI-T complex and results in release of the T proteins from inhibition. Thus at the instant of holin triggering, many T molecules are liberated from antiholin-inhibited complexes to participate in the formation of holes in the membrane. The structure of the free sRI suggests that after simultaneous dissociation from the T holin, locally concentrated RI likely forms a domain-swapped homotetramer that would no longer be competent to bind T, making T activation irreversible. When probed by size exclusion chromatography in the solution, only small fraction of sRI shows in the oligomer state. It is likely that the tetrameric state is assumed at a higher concentration of the protein than can be maintained during gel filtration. Physiologically, high local concentration of RI would be achieved at the moment of lysis triggering, when all RI molecules are simultaneously released from the RI-T complexes. The major conformational change between the free and holin-bound forms of RI is localized to a short “hinge” region, in a similar way to other proteins like hemagglutinin and cystatin E where domain swapping is shown to regulate their function [24] [25]. In hemagglutinin, the loop-to-helix transition of the hinge region is thought to be driven by the change of solvent accessibility of this region [28]. When lysis begins, the SAR release from the membrane and dissociation of RI from T may expose the hinge region and, analogously to hemagglutinin, induce the loop-to-helix transition that causes RI to assume an elongated form prone to oligomerization.
Functionally similar participation of antiholins in lysis occur with both the canonical lambda holin and the phage 21 pinholin [27] [28]. In both cases, the antiholin is an alternate translational product of the holin gene and in both cases, the distinction between the otherwise identical proteins is that the topology of the N-terminal transmembrane domain of the antiholin is constrained by the energized membrane. Much of the holin accumulates in inhibited complexes and thus can not participate in the mass action required for lysis. However, at the instant of triggering, the antiholins are converted to the holin conformation in response to membrane depolarization and both gene products are able to participate in hole formation. The mechanism we are proposing for T4 phage is molecularly distinct but conceptually similar to these systems. In all three cases the antiholin functions to amplify holin hole-formation kinetics without allowing excess holin supply to cause premature lysis. Our model for the role of RI in the normal lysis pathway predicts that in the absence of RI, lysis timing would be accelerated. Indeed, earlier lysis was observed for the r48 LIN-defective allele of rI [21].
The T4 holin architecture is distinctly different from the other holins, which are dominated by transmembrane domains. This poses another mechanistic puzzle: how does the T holin assemble into a hole to line a membrane with a single transmembrane helix despite being constrained by a relatively large periplasmic domain? This issue is problematic to address by direct experiments: the full length, self-assembling, membrane-integrated holin constitutes a difficult subject for structural studies. Even truncated sT is prone to aggregation and not soluble on its own [6]. However, the GAF domain structure of the inhibited form of sT provides us with clues as to how hole formation may occur. GAF domains are known to oligomerize after undergoing a conformational change associated with ligand binding in a pocket on the face of the molecule opposite to the α-helices that engage in self-interactions. Ligand binding leads to change in the relative position of the α-helices, enabling oligomerization. In the sRI-sT complex the putative ligand pocket is blocked by the T holin LC loop which, both directly and through the LB-α2 region, interacts with sRI (Figure 2D). Based on the inherent GAF domain properties, it is reasonable to expect that when the complex dissociates upon lysis triggering, the LC loop may move out of the ligand binding site of T, causing a conformational change in the helix positions that will favor T oligomerization and hole formation. It is interesting to note that out of five selected mutations of T holin incapable of lysis inhibition by RI but still competent for lysis, four map to the regions contributing to blocking the GAF pocket Thr138Ala, Ser153Phe, Ser153Pro, and Ala158Ser [3]. In another study which selected for lysis-defective mutants of T holin [29], four mutants were incapable of interaction with RI, with only one mutated residue involved in direct contact to the RI interface (Phe111Ser), while the others mapped to either the LB loop (Lys137Arg) or to the α-helices (Ile88Lys and Ile213Lys).
As noted above, a long-standing issue about LIN is the identity of the signal that comes from the superinfecting virion. The observation that “ghost” phage particles emptied of the capsid contents are unable to induce LIN led to a hypothesis that the 170 kb gDNA of the superinfecting phage, ectopically localized to the periplasm, may play a role [21] [20]. The periplasm is rich in nuclease activity [30] so the 170 kb gDNA is likely to be degraded into smaller fragments very rapidly upon its ejection. A single gDNA could generate >3000 50 bp fragments upon partial nucleolytic degradation, corresponding to a periplasmic concentration of ~30 μM, which is comparable with the range of Kd values we observed for nucleic acids binding to the holin-antiholin complex. This is consistent with the observation that a single superinfecting phage can induce LIN [31]. Moreover, in any scenario where a single superinfection occurs, subsequent superinfection events are likely to happen, which would increase the DNA concentration and thus further enhance the LIN state. Here we provide direct evidence that phage DNA and its fragments can serve as the superinfection signal sensed by the holin-antiholin complex. We observed that the sRI-sT complex binds DNA in a sequence-unspecific fashion with low nanomolar to low micromolar affinities in vitro, while the free sRI shows no DNA binding. The sRI-sT complex structure does not display any obvious DNA binding domains, like helix-turn-helix, leucine zipper, and other motifs observed in DNA regulating proteins. Since it is not designed to recognize a defined DNA sequence, the holin-antiholin case is more similar to a general DNA sensing protein, like the innate immunity protein cGAS, which displays large positively charged patches on its accessible surface. Analysis of the electrostatic surface of the sRI-sT complex crystal structure identified only one positively charged patch consistent with potential DNA binding (Figure 2B). This patch is located on the face opposite to the sRI N-termini protrusion and thus would face the periplasm. All four protein chains making the sRI-sT heterotetramer contribute to this positively charged patch, suggesting that DNA binding could stabilize the RI-T heterotetrameric complex. The residues potentially interacting with DNA (Lys106, Lys218, Arg104, Asn107, Asn179, Tyr177 of T, and Lys65, Arg61, Tyr57 of RI) are reasonably conserved (Figure 5) and repeated on that surface twice because of the heterotetramer symmetry. Based on this conservation, T4-like phages infecting a wide range of Proteobacteria can be identified that are predicted to be capable of the LIN response (Figure 5).
Figure 5. Conservation level across the sequences.
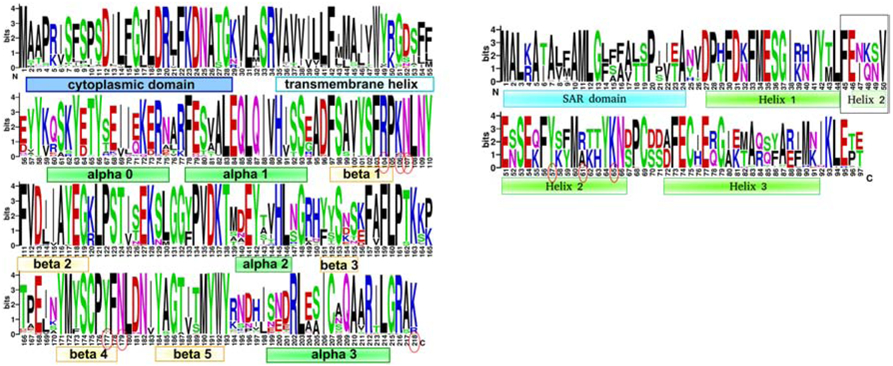
The overall height of the stack indicates the sequence conservation at that position, while the height of symbols within the stack indicates the relative frequency of each amino at that position. The secondary structure elements marked as boxes and the residues potentially interacting with DNA circled in red. A. holin T, constructed based on 100 BLAST hits from phages of Escherichia, Shigella, Yersinia, Salmonella enterica, Pseudomonas, Citrobacter, Klebsiella, and Acinetobacter. B. antiholin RI, constructed based on 47 top BLAST hits from phages of Escherichia, Shigella, Yersinia, and Salmonella enterica. Loop-to-helix conformation changing region is boxed.
The figure was created with WebLogo.
The stabilization derived from DNA binding would need to be subverted once triggering occurs; destabilization would most likely be driven by the collapse of the membrane potential once the concentration of DNA in the periplasm decreases due to continuous nucleolytic degradation. Indeed, LIN can be collapsed at any time by membrane depolarization with energy poisons [7]. Depolarization would release the SAR domains of RI from the bilayer [23] disrupting the holin-antiholin complex and rendering moot the presence of the DNA signal.
T4 LIN has been the subject of extensive genetic and physiological study for over seven decades, since the rI gene was among the first heritable genetic markers identified in phage [32]. The structural studies here, along with details of the interaction between the periplasmic domains of the holin and antiholin and the domain-swapping transition that underlies the inactivation of RI, provide a molecular basis for the function of this remarkable system. Our proposed model of lysis timing control in T4 phage is depicted in Figure 6. Moreover, we have provided biochemical evidence that T4 DNA itself is the long-sought LIN signal; to our knowledge, this is the first example of DNA acting as a physiological signal molecule. Studies aimed at testing the model, including using alternative pathways to introduce DNA into the periplasm of the T4-infected cell, are underway.
Figure 6. Model of lysis timing control in T4 phage.

Holin molecules depicted in brown, and antiholin - in light blue. Periplasmic protease DegP marked as scissors. The figure was created with Biorender.com
Methods
Crystallization of sRI and the sRI-sT complex
The periplasmic domain sRI of RI (residues 25–97) with C-terminal histidine tag was purified as reported previously [6]. Crystals were obtained at 16 °C by hanging-drop vapor diffusion in 100 mM Na citrate (pH 4.5), 1M Na acetate, 0.5% Anapoe X114 detergent and flash-frozen in the reservoir solution with 24% (w/v) ethylene glycol. The Se-Met-labeled derivative of sRI was prepared, purified and crystallized similarly.
The periplasmic domain of the T4 holin T (sT, residues 56–218) was expressed as either tagless or C-terminally histidine tagged version. For the initial crystal screening and Se-Met-labeled crystals sRI-sT complex was obtained and purified following procedures in [6]. After the phase was solved, additional crystal forms were explored using tagless sT. In these experiments a simplified procedure was used in which sRI-sT complex was formed upon co-lyzing mixture of two cultures, one expressing tagged sRI and the other the tagless sT. The complex was then purified on Ni affinity column, followed by gel filtration. Crystals of Se-Met complex were obtained at 16 °C by hanging-drop vapor diffusion by mixing 10 mg/ml protein in 20 mM phosphate, pH 8.0, and 100 mM NaCl with 1.0M ammonium sulfate, 0.1 M Bis-Tris, pH 5.5, and 1% PEG 3,350. Native complex P6522 crystals were grown in 3.2 M NaCl and 0.1M Na acetate trihydrate, pH 4.6 condition; native P21 crystals formed in 25% PEG 3,350 with 0.1M citric acid pH 3.5. Higher resolution crystals (in H32) were obtained using shorter version of sT (residues 78–218) for the sT-sRI complex formation in 0.8 M Na/K Tartrate and 0.1M TRIS-HCl pH 7.0-8.0.
Structure determination
X-ray diffraction data were collected at 100 K on beamlines 19-ID and 23-ID at APS (Argonne National Labs, Chicago, IL) at Se edge wavelength. Diffraction data were processed using HKL2000 [33]. The structure of sRI was obtained by the SAD method using a crystal of the Se-Met substituted protein and data at 2.5 A resolution. All six potential Se sites were located using SHELXD [34], their positions refined and the phase solved by SHARP [35]. Automated model building was performed using the PHENIX suite [36]. The residual 26% of the model was built manually using COOT [37] and refined with PHENIX using native crystal data with higher resolution diffraction.
sRI-sT complex structure was similarly solved by SAD with the data from Se-Met substituted protein crystal. Diffraction data was processed using HKL2000 [33]. Automated structure solution was carried out by the PHENIX AutoSol wizard resulting in preliminary model. This model of sRI-sT was re-built by PHENIX AutoBuild. The model was further manually built using COOT and refined by PHENIX Refine. Two alternative space-group data sets for sRI-sT complex crystals (P21 and R32) were integrated and scaled using the PROTEUM software suite [38], with the data subsequently truncated with Ctruncate from CCP4 [39]. The structures were solved by molecular replacement using Molrep [40]from CCP4 and sRI-sT heterodimer structure obtained from the Se-Met phasing as a search model. Subsequent model improvement and refinement was done using PHENIX Refine and COOT iterativly. Data collection and refinement statistics are provided in Table 1.
Single-particle cryo-EM imaging
Three microliters of the sRI-sT specimen (0.1 mg/ml) were applied to a C-Flat 1.2/1.3 holey carbon grid at room temperature with 100% relative humidity and vitrified using a Vitrobot Mark III (FEI). The prepared grids were imaged under an FEI Tecnai F20 transmission electron microscope operated at 200 kV. Data were recorded on a Gatan K2 Summit with electron-counting mode. A nominal magnification of 25,000x was used, yielding a pixel size of 1.5 Å. The beam intensity was adjusted to the dose rate of ~10 e−/pixel/s on the camera. A 40-frame movie stack was recorded for each picture, with 0.2 s per frame, for a total exposure time of 8 s.
Cryo-EM image processing and model building
Five hundred and eight collected image stacks were aligned and filtered based on the electron dose using Unblur [41]. The defocus value of each image stack was determined by Gctf [42]. Particles were semi-automatically picked using the Erase and Swarm tools of e2boxer.py in EMAN2 [43]. In total, 139,834 particles were picked with a box size of 144 X 144 pixels. The 2D and 3D classifications were performed using Relion [44] to get clean and homogeneous particles for the final 3D reconstruction. After the post-processing, the final refined map from 35,432 particles yielded a resolution of 9.4 Å. The particle images were downscaled by two fold in all processing procedures. Refinement using the particles without downscaling did not improve the resolution of the refined map. To build the model, the crystal structure of the sRI-sT tetramer was first fit into the EM density. In total, the EM map can accommodate four tetramers. To have a better fitting, the initial model of the four tetramers was then refined using the molecular dynamics flexible fitting (MDFF) with secondary structure restraints [45].
DNA binding
For these experiments the sRI-sT complex was purified and stored in 20 mM TRIS-HCl, pH 7.5, and 100 mM NaCl. For electrophoretic mobility shift assays (EMSA), three DNA samples were used: 0.5 ng of single stranded 60 bp, 20 ηg of 58 bp and 28 ηg of 30 bp double stranded. DNA was incubated with different amounts of protein (0–25 μg) at room temperature for 30 min in 20 mM Tris pH 7.5, 100 mM NaCl. The mixture was loaded on a pre-cast 10% non-denaturing polyacrylamide gel and the gel was run at a constant voltage (120 V) with prechilled 0.5X TBE (89 mM Tris base, 89 mM boric acid, 1 mM EDTA, pH 8.0) buffer at 4 °C. After the run was completed, the gel was stained with 1X SYBR™ green (Invitrogen) DNA stain solution for 30 min in the dark and imaged, and then stained with Coomassie blue to visualize the protein. The intrinsic fluorescence spectrum of the sRI-sT complex was recorded on a Cary Eclipse fluorescence spectrophotometer. One hundred μl of the protein at 40 μg/ml in 20 mM Tris pH 7.5, 100 mM NaCl was titrated with DNA ligands by adding 0.5–1 μl of ligand stock solution for each concentration point into the same cuvette and gently mixed by pipetting. Fluorescence spectra were recorded at 280 nM excitation wavelength. Fluorescence intensity was recorded at the peak wavelength of 320 nM for 8–12 concentration points for each tested ligand to determine apparent Kd values. The change in fluorescence did not vary over time, so the measurements were collected directly after mixing, without any additional incubation. No quenching was observed for a negative control protein (purified malate synthase from Mycobacterium tuberculosis) when mixed with these DNA ligands. The relative change in fluorescence intensity was plotted against final ligand concentration on a double reciprocal plot, with the slope recorded as a Kd value. Each titration was done twice, and average of two Kd values is given in the Table 4; the resultant Kd values differed no more than by 5% between two replicates.
Supplementary Material
Highlights.
Lysis control in T4 phage infection and in particular the phenomenon of lysis inhibition (LIN), allowing the phage to delay host cell lysis in response to superinfection captivated scientists attention for over seven decades. However, the mechanism of lytic function regulation, and the molecular basis of the superinfection signal remained obscure.
We present the crystal structure of the complex between periplasmic domains of the T4 holin T and its inhibitor antiholin RI, identifying holin as a GAF domain protein, and providing molecular details of the holin inhibition. The structure of free RI shows a unique fold, capable of undergoing a large conformational change and domain swapping which facilitates the release of the holin from the complex upon lysis triggering.
Structural information on the holin-antiholin complex led us to re-examine the existing model for LIN and propose that the superinfection acts by stabilizing the complex, pointing to genomic DNA injected into the periplasm by secondary phage as a likely stabilizing ligand. We were able to demonstrate binding of DNA to the RI-T complex by two independent methods, thus establishing DNA as a superinfection signal.
Based on the structural and biochemical evidence, we propose a novel model for the lysis pathway and regulation in T4 phages, where holin accumulates in the membrane in the form of inhibited by antiholin complexes. Lysis triggers at the time when holins titrate out the antiholins. Free holin rafts disrupt transmembrane potential, driving antiholin out of the bilayer, which leads to holin-antiholin complex dissociation, liberating all accumulated holins to polymerize into a hole. Secondary phage DNA, trapped and sheared into fragments in the periplasm, binds to holin-antiholin complexes transiently stabilizing the inhibited form of holin and delaying the lysis.
Acknowledgments:
We would like to thank Ryan Hughes for the help with constructing expression vectors, the Advanced Photon Source (APS) beamlines 19ID and 23ID at Argone National lab for the access for X-ray data collection, and Tracy Musa for reviewing and editing this manuscript. We thank the Microscopy and Imaging Center at Texas A&M University for providing instrumentation for data collection, and the Texas A&M High-Performance Research Computing Center for providing the computational resources for data processing. This work was supported by Welch Foundation grants A-0015 and A-1863, NIH grant NIGMS 27099–40. We also acknowledge Texas A&M University’s Center for Phage Technology and the Center for Structural Biology.
Abbreviations:
- LIN
lysis inhibition
- SAR
signal anchor release
- T
holin
- RI
antiholin
- VAST
vector alignment search tool
Footnotes
Accession numbers: the structures presented in this work are deposited in the PDB database under the accession numbers 6PSH, 6PSK, 6PXE and 6PX4
Declaration of Interests:
The authors declare no competing interests.
Publisher's Disclaimer: This is a PDF file of an unedited manuscript that has been accepted for publication. As a service to our customers we are providing this early version of the manuscript. The manuscript will undergo copyediting, typesetting, and review of the resulting proof before it is published in its final form. Please note that during the production process errors may be discovered which could affect the content, and all legal disclaimers that apply to the journal pertain.
References:
- [1].Kortright Kaitlyn E., Chan Benjamin K., Koff Jonathan L., Phage Therapy: A Renewed Approach to Combat Antibiotic-Resistant Bacteria, Cell Host Microbe. 25 (2) (2019) 219–232. https://doi.Org/10.1016/j.chom.2019.01.014. [DOI] [PubMed] [Google Scholar]
- [2].Y. R Cahill Jesse, Phage Lysis: Multiple Genes for Multiple Barriers, Adv Virus Res. 103 (2019) 33–70. https://doi.org/bs.aivir.2018.09.003. [DOI] [PMC free article] [PubMed] [Google Scholar]
- [3].Ramanculov E, Young R, Genetic analysis of the T4 holin: timing and topology., Gene. 265 (2001)25–36. [DOI] [PubMed] [Google Scholar]
- [4].Young R, Bacteriophage holins: deadly diversity, J. Mol. Microbiol. Biotechnol 4 (2002) 21–36. [PubMed] [Google Scholar]
- [5].Tran TAT, Struck DK, Young R, Periplasmic domains define holin-antiholin interactions in t4 lysis inhibition., J. Bacteriol 187 (2005) 6631–6640. 10.1128/JB.187.19.6631-6640.2005. [DOI] [PMC free article] [PubMed] [Google Scholar]
- [6].Moussa SH, Kuznetsov V, Tran TAT, Sacchettini JC, Young R, Protein determinants of phage T4 lysis inhibition., Protein Sci. Publ. Protein Soc 21 (2012) 571–582. 10.1002/pro.2042. [DOI] [PMC free article] [PubMed] [Google Scholar]
- [7].Ramanculov E, Young R, An ancient player unmasked: T4 rI encodes a t-specific antiholin., Mol. Microbiol 41 (2001) 575–583. [DOI] [PubMed] [Google Scholar]
- [8].Chen Y, Young R, The Last r Locus Unveiled: T4 RIII Is a Cytoplasmic Antiholin., J. Bacteriol 198 (2016) 2448–2457. 10.1128/JB.00294-16. [DOI] [PMC free article] [PubMed] [Google Scholar]
- [9].Tran TAT, Struck DK, Young R, The T4 RI antiholin has an N-terminal signal anchor release domain that targets it for degradation by DegP., J. Bacteriol 189 (2007) 7618–7625. 10.1128/JB.00854-07. [DOI] [PMC free article] [PubMed] [Google Scholar]
- [10].Sun Q, Kuty GF, Arockiasamy A, Xu M, Young R, Sacchettini JC, Regulation of a muralytic enzyme by dynamic membrane topology., Nat. Struct. Mol. Biol 16 (2009) 1192–1194. 10.1038/nsmb.1681. [DOI] [PMC free article] [PubMed] [Google Scholar]
- [11].Doermann AH, Lysis and Lysis Inhibition with Escherichia coli Bacteriophage., J. Bacteriol 55 (1948)257–276. [DOI] [PMC free article] [PubMed] [Google Scholar]
- [12].Rutberg B, Rutberg L, Role of superinfecting phage in lysis inhibition with phage T4 in Escherichia coli., J. Bacteriol 90 (1965) 891–894. [DOI] [PMC free article] [PubMed] [Google Scholar]
- [13].Anderson CW, Eigner J, Breakdown and Exclusion of Superinfecting T-Even Bacteriophage in Escherichia coli, J Virol. 8(6) (1971) 869–886. [DOI] [PMC free article] [PubMed] [Google Scholar]
- [14].Gibrat JF, Madej T, Bryant SH, Surprising similarities in structure comparison, Curr. Opin. Struct. Biol 6 (1996) 377–385. 10.1016/s0959-440x(96)80058-3. [DOI] [PubMed] [Google Scholar]
- [15].Krissinel E, Henrick K, Inference of macromolecular assemblies from crystalline state., J. Mol. Biol 372 (2007) 774–797. https://doi.Org/10.1016/j.jmb.2007.05.022. [DOI] [PubMed] [Google Scholar]
- [16].Bennett MJ, Choe S, Eisenberg D, Domain swapping: entangling alliances between proteins., Proc. Natl. Acad. Sci. U. S. A 91 (1994) 3127–3131. 10.1073/pnas.91.8.3127. [DOI] [PMC free article] [PubMed] [Google Scholar]
- [17].Holm L, Rosenström P, Dali server: conservation mapping in 3D., Nucleic Acids Res. 38 (2010) W545–W549. 10.1093/nar/gkq366. [DOI] [PMC free article] [PubMed] [Google Scholar]
- [18].Black LW, Ahmad-Zadeh C, Internal proteins of bacteriophage T4D: their characterization and relation to head structure and assembly, J Mol Biol. 57(1) (1971) 71–92. [DOI] [PubMed] [Google Scholar]
- [19].K. H Repoila F Tetart F, Bouet JY, Genomic polymorphism in the T-even bacteriophages, EMBO J. 13(17)(1994) 4181–4192. [DOI] [PMC free article] [PubMed] [Google Scholar]
- [20].Abedon ST, Look Who’s Talking: T-Even Phage Lysis Inhibition, the Granddaddy of Virus-Virus Intercellular Communication Research, Viruses. 11 (2019). 10.3390/v11100951. [DOI] [PMC free article] [PubMed] [Google Scholar]
- [21].Paddison P, Abedon ST, Dressman HK, Gailbreath K, Tracy J, Mosser E, Neitzel J, Guttman B, Kutter E, The roles of the bacteriophage T4 r genes in lysis inhibition and fine-structure genetics: a new perspective., Genetics. 148 (1998) 1539–1550. [DOI] [PMC free article] [PubMed] [Google Scholar]
- [22].White R, Chiba S, Pang T, Dewey JS, Savva CG, Holzenburg A, Pogliano K, Young R, Holin triggering in real time, Proc. Natl. Acad. Sci. U. S. A 108 (2011) 798–803. 10.1073/pnas.1011921108. [DOI] [PMC free article] [PubMed] [Google Scholar]
- [23].Xu M, Struck DK, Deaton J, Wang I-N, Young R, A signal-arrest-release sequence mediates export and control of the phage P1 endolysin., Proc. Natl. Acad. Sci. U. S. A 101 (2004) 6415–6420. 10.1073/pnas.0400957101. [DOI] [PMC free article] [PubMed] [Google Scholar]
- [24].Dall E, Hollerweger JC, Dahms SO, Cui H, Häussermann K, Brandstetter H, Structural and functional analysis of cystatin E reveals enzymologically relevant dimer and amyloid fibril states., J. Biol. Chem 293 (2018) 13151–13165. 10.1074/jbc.RA118.002154. [DOI] [PMC free article] [PubMed] [Google Scholar]
- [25].Rousseau F, Schymkowitz J, Itzhaki LS, Implications of 3D domain swapping for protein folding, misfolding and function., Adv. Exp. Med. Biol 747 (2012) 137–152. 10.1007/978-1-4614-3229-6_9. [DOI] [PubMed] [Google Scholar]
- [26].Huang Q, Korte T, Rachakonda PS, Knapp E-W, Herrmann A, Energetics of the loop-to-helix transition leading to the coiled-coil structure of influenza virus hemagglutinin HA2 subunits., Proteins. 74 (2009) 291–303. 10.1002/prot.22157. [DOI] [PubMed] [Google Scholar]
- [27].To KH, Young R, Probing the structure of the S105 hole., J. Bacteriol 196 (2014) 3683–3689. 10.1128/JB.01673-14. [DOI] [PMC free article] [PubMed] [Google Scholar]
- [28].Young R, Phage lysis: three steps, three choices, one outcome., J. Microbiol. Seoul Korea 52 (2014) 243–258. 10.1007/s12275-014-4087-z. [DOI] [PMC free article] [PubMed] [Google Scholar]
- [29].Moussa SH, Lawler JL, Young R, Genetic dissection of T4 lysis, J. Bacteriol 196 (2014) 2201–2209. [DOI] [PMC free article] [PubMed] [Google Scholar]
- [30].Masuwo Obinata DM, Intracellular localization of deoxyribonucleases in Escherichia coli, Biochim Biophys Acta. 155 (1) (1968) 98–106. [DOI] [PubMed] [Google Scholar]
- [31].Bode W, Lysis inhibition in Escherichia coli infected with bacteriophage T4., J. Virol 1 (1967) 948–955. [DOI] [PMC free article] [PubMed] [Google Scholar]
- [32].Hershey AD, Mutation of Bacteriophage with Respect to Type of Plaque, Genetics. 31(6) (1946) 620–640. [DOI] [PMC free article] [PubMed] [Google Scholar]
- [33].Otwinowski Z, Minor W, Processing of X-ray diffraction data collected in oscillation mode., Methods Enzymol. 276 (1997) 307–326. [DOI] [PubMed] [Google Scholar]
- [34].Sheldrick GM, Experimental phasing with SHELXC/D/E: combining chain tracing with density modification., Acta Crystallogr. D Biol. Crystallogr 66 (2010) 479–485. 10.1107/S0907444909038360. [DOI] [PMC free article] [PubMed] [Google Scholar]
- [35].Bricogne G, Vonrhein C, Flensburg C, Schiltz M, Paciorek W, Generation, representation and flow of phase information in structure determination: recent developments in and around SHARP 2.0., Acta Crystallogr. D Biol. Crystallogr 59 (2003) 2023–2030. 10.1107/s0907444903017694. [DOI] [PubMed] [Google Scholar]
- [36].Adams PD, Afonine PV, Bunkóczi G, Chen VB, Davis IW, Echols N, Headd JJ, Hung L-W, Kapral GJ, Grosse-Kunstleve RW, McCoy AJ, Moriarty NW, Oeffner R, Read RJ, Richardson DC, Richardson JS, Terwilliger TC, Zwart PH, PHENIX: a comprehensive Python-based system for macromolecular structure solution., Acta Crystallogr. D Biol. Crystallogr 66 (2010) 213–221. 10.1107/S0907444909052925. [DOI] [PMC free article] [PubMed] [Google Scholar]
- [37].Emsley P, Lohkamp B, Scott WG, Cowtan K, Features and development of Coot., Acta Crystallogr. D Biol. Crystallogr 66 (2010) 486–501. 10.1107/S0907444910007493. [DOI] [PMC free article] [PubMed] [Google Scholar]
- [38].B.A. Inc, PROTEUM3, 2018.
- [39].W. KS. Winn MD Ballard CC, Cowtan KD, Dodson EJ, Emsley P, Evans PR, Keegan RM, Krissinel EB, Leslie AG, McCoy A, McNicholas SJ, Murshudov GN, Pannu NS, Potterton EA, Powell HR, Read RJ, Vagin A., Overview of the CCP4 suite and current developments, Acta Crystallogr Biol Crystallogr. April 1;67(Pt 4) (2011) 235–42. 10.1107/S0907444910045749. [DOI] [PMC free article] [PubMed] [Google Scholar]
- [40].Vagin A, Teplyakov A, it MOLREP: an Automated Program for Molecular Replacement, J. Appl. Crystallogr 30 (1997) 1022–1025. 10.1107/S0021889897006766. [DOI] [Google Scholar]
- [41].G. N Grant Timothy, Measuring the optimal exposure for single particle cryo-EM using a 2.6 Å reconstruction of rotavirus VP6, ELife. 4 (2015). [DOI] [PMC free article] [PubMed] [Google Scholar]
- [42].Zhang K, Gctf: Real-time CTF determination and correction, J Struct Biol. 193(1) (2016) 1–12. [DOI] [PMC free article] [PubMed] [Google Scholar]
- [43].L. SJ Tang Guang Peng Liwei, Baldwin Philip R., Manna Deepinder S., Jiang Wen, Rees Ian, EMAN2: An extensible image processing suite for electron microscopy, J Struct Biol. 157 (1) (2007)38–46. [DOI] [PubMed] [Google Scholar]
- [44].S. SH Bai Xiao-chen Rajendra Eeson, Yang Guanghui, Shi Yigong, Sampling the conformational space of the catalytic subunit of human γ-secretase, ELife. 4 (2015). [DOI] [PMC free article] [PubMed] [Google Scholar]
- [45].S. K Trabuco Leonardo G. Villa Elizabeth, Mitra Kakoli, Frank Joachim, Flexible fitting of atomic structures into electron microscopy maps using molecular dynamics, Structure. 16 (2008) 673–683. [DOI] [PMC free article] [PubMed] [Google Scholar]
Associated Data
This section collects any data citations, data availability statements, or supplementary materials included in this article.