

Abstract
Eukaryotic promoters determine transcription start sites (TSSs), and are often enriched for transcription factor binding sites (TFBSs), which presumably play a major role in determining the location and activity of the TSS. In mammalian systems, proximal promoters are enriched for the CpG dinucleotide. The TFBSs that are enriched in proximal promoters (−200 bps to the TSS) are CCAAT, ETS, NRF1, SP1, E-Box, CRE, BoxA, and TATA. Only TATA occurs in a DNA strand dependent manner. In Drosophila, proximal promoters are AT rich and many putative TFBSs are enriched in proximal promoters. These sequences are different from those that occur in human promoters, except for TATA and E-Box, and many occur on a single strand of DNA giving directionality to the promoter. Thus, fundamental differences have arisen as promoters evolved in metazoans.
10.1. Introduction
The regulation of eukaryotic gene expression is a complex process involving many different control mechanisms, including chromatin structure and DNA sequences bound by specific proteins termed transcription factors (TFs). An important paradigm in gene expression studies is that TFs bind specific DNA sequences termed Transcription Factor Binding Sites (TFBSs) to control transcription. These TFBSs often localize near the Transcriptional Start Site (TSS) in an area termed the promoter, and specific locations elsewhere in the genome termed enhancers. These TFBSs are bound by TFs that recruit additional proteins to either activate or repress gene expression. Because TFBSs tend to be composed of defined short stretches of DNA (typically 6–12 base pairs), a simple search of the DNA sequence within a large genome therefore finds large numbers of matching sequences. A major question in current research is whether these potential binding sites are functional (for binding TFs, and for regulating transcription) and under what circumstances. The picture is further complicated by the fact the most TFBSs are defined by a consensus sequence that contains ambiguous bases. Thus, the identification of DNA sequences that are biologically relevant TFBS is challenging.
We and others have focused on identifying DNA sequences that preferentially localize in the proximal promoter as a method to find TFBSs that are likely to be biologically important [1–6] and to help understand what characterizes and defines eukaryotic promoters. This strategy has been facilitated by methods that identify the TSS by determining the 5-CAP site of mRNA [7]. A complication in identifying the TSS for a given gene is that RNA Polymerase II (RNAP) does not always initiate mRNA synthesis from a unique nucleotide. Many tissue specific transcripts have a unique TSS; however, housekeeping genes, which often contain a CpG island in the promoter region, typically have a more variable TSS with mRNA synthesis starting over a 50–100 bp range [8]. Another complication is that mechanisms of both promoter definition and gene expression regulation are far from uniform across all eukaryotes. Even within the narrow region of the proximal promoter, we see major differences in the TFBSs used by different organisms, even within the same clade.
This book chapter will compare the promoter architecture of Human and Drosophila promoters and then discuss in detail the DNA sequences that preferentially localize in human proximal promoters. The analyses suggest that human promoters are embedded in CpG rich regions while Drosophila promotes are in A and T rich regions.
10.2. General Similarities Between Drosophila and Human Dinucleotide Content
We will first consider the simple sequence content of promoter (and non promoter) sequence. Comparing the dinucleotide frequency of the Drosophila and human genomes shows general similarity (Fig. 10.1a). For example, the AA/TT dinucleotide is the most abundant in each genome. The dinucleotide content is not completely explained by base content, presumably due to the differential expansion of simple repeat sequences. The most notable difference between these two genomes is that the human genome is depleted for the CpG dinucleotide. However, in the human, but not the Drosophila genome, the CpGs often occur in clusters (Fig. 10.1b), and these clusters are frequently, but not always, found in and around the proximal promoters of genes. This clustering of CpGs in mammals was noticed 25 years ago and these clusters were termed “CpG islands” that often occur in the promoters of “housekeeping” genes [9, 10]. In fact, all CpG islands may be associated with a TSS. An explanation for the depletion of the CpG dinucleotide in mammalian genomes follows from the observation that, in mammals, CpG dinucleotides that are not in CpG islands are methylated in early development. It is thought that the CpGs in CpG islands are not methylated during the wave of methlyation that occurs during early development because they are bound by TFs expressed at this time in development which includes primarily essential genes involved in housekeeping functions of the cell and not tissue specific genes that will become activated later in development [11]. Elsewhere in the genome, where CpGs are rare (including the promoters of tissue specific genes) the CpGs are not bound because the tissue specific TFs that bind them are not expressed. These unbound CpGs are methylated because they are accessible to the CpG methylation machinery. Mutation of methylated CpGs is due to their chemical property in which the methyl cytosine spontaneously deaminates to thymine, which in effect depletes CpG containing sequences throughout the genome except in CpG islands where the methylation levels are low. This solves a vexing problem of selecting against TFBSs that arise by mutation throughout the genome: natural selection does not need to select against these spontaneous arising TFBSs, because chemistry selects against these sites. For these reasons, when we examine DNA sequences that localize in mammalian promoters, we divide them into two classes, those with a CpG dinucleotide and those without a CpG dinucleotide. When thinking about CpG containing sequences, we need to keep in mind that they may be methylated, which may enhance or diminish the DNA binding of any protein that binds the sequence. CpG methylations in the promoters are generally transcriptionally repressive as occurs with X-chromosome inactivation and imprinting [11]. CpG methylation both recruits repressive complexes [11] and prevents the DNA binding of many transcription factors (TFs) [12]. In some cancers, methylation of tumor suppressor gene promoters is associated with gene repression [13]. Contrary to that, however, genomic analyses have identified low CpG promoters that are both methylated and transcriptionally active [14, 15], but the mechanism underlying the activation of methylated promoters remains unclear.
Fig. 10.1.
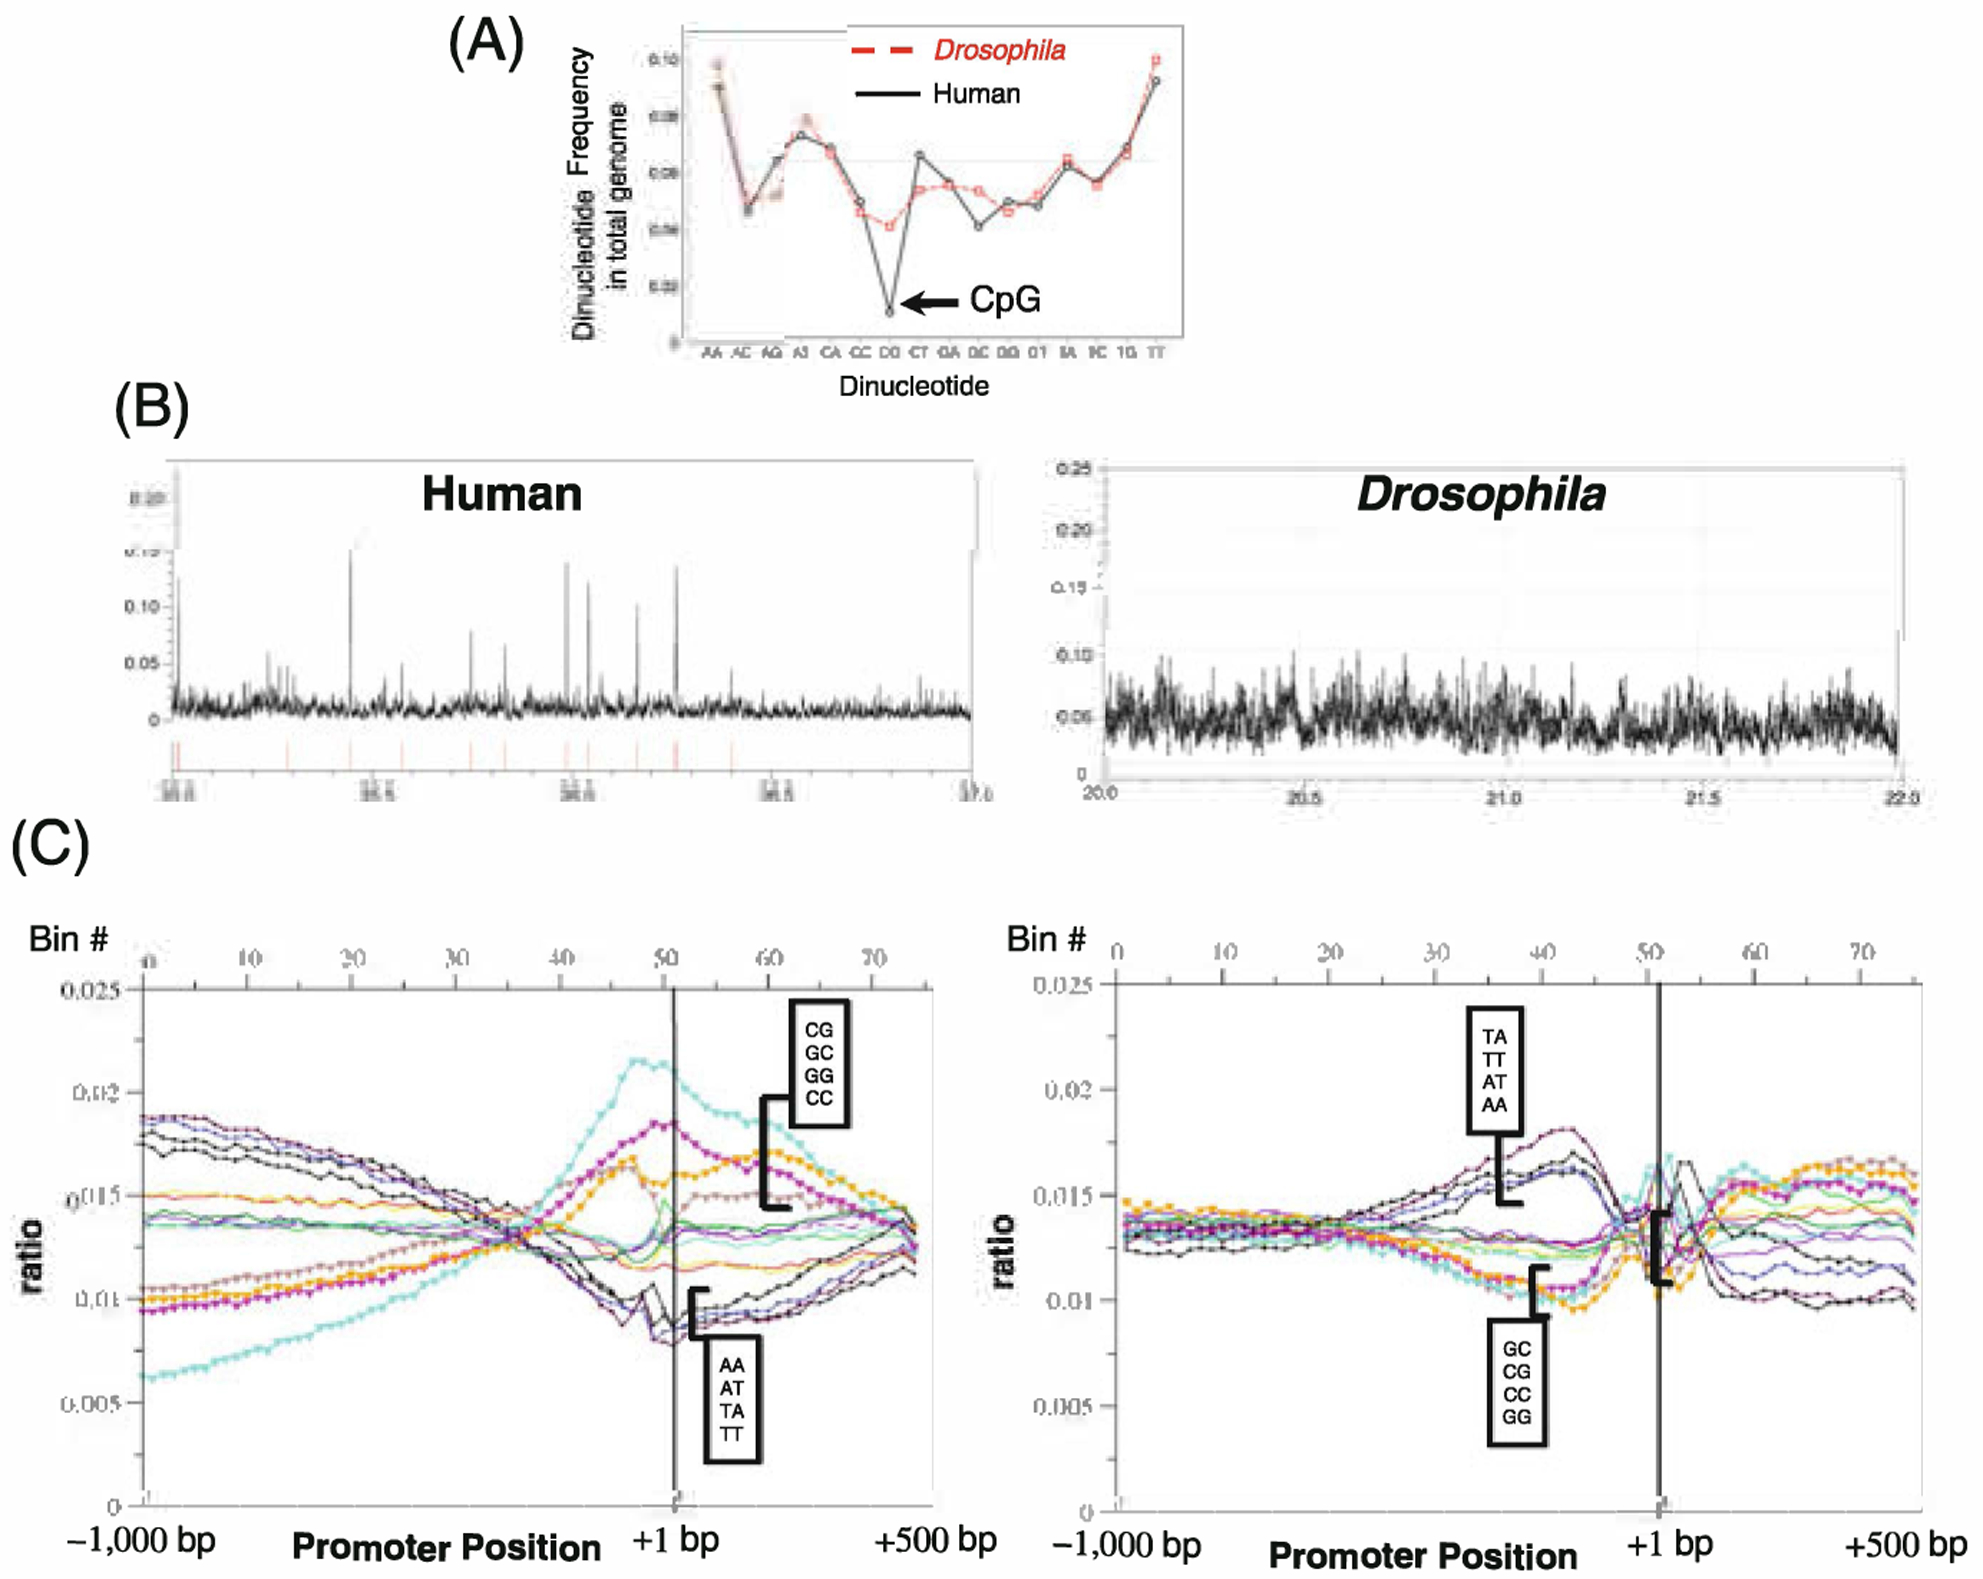
a Dinucleotide frequency in the entire Human and Drosophila genome. b CpG density across 2 MB of the Human and Drosophila genome. Observe that in the human genome, CpGs on average are rarer than in Drosophila but they do occur in clusters called CpG islands which is not observed in Drosophila. The red dashes in the human trace are CpG islands as defined on the UCSC genome browser. c Dinucleotide density across promoters from −1,000 to +500 bps for Drosophila and humans using a 20 bp window. The CA dinucleotide peak that occurs exactly at the TSS in both Human and Drosophila promoters is not observed because we are using a 20 bp window for this calculation. Note that in Drosophila promoters, the dinucleotides containing T & A are enriched just upstream of the TSS while in human promoters, the dinucleotides containing C & G are enriched at the TSS
10.3. Drosophila and Humans Have Different Promoter Architecture
Figure 10.1c presents the dinucleotide frequencies from −1,000 to +500 bps for Drosophila and human promoters. For each species we aligned promoter sequences to the TSS and determined the distribution of DNA sequences throughout the promoter region. When we examine the distribution of dinucleotides, we observe that Drosophila promoters are enriched for the 4 dinucleotides AA, TT, AT, & TA which are over 50% more abundant at −200 bps than at −1,000 bps. Human promoters, in contrast, are enriched for the four dinucleotides CG, GC, GG, & CC, with the CpG dinucleotide being over three times more abundant at −200 bps compared to −1,000 bps. This fundamental difference in promoter architecture has far reaching consequences for the mechanisms of regulated gene expression in these two species, primarily because the CpG rich proximal promoters observed in human tend to be nucleosome binding site in vitro, but not in vivo, as will be discussed later. In addition, as we shall see, the stereotypic spatial arrangements of TFBSs are also different in Drosophila and human (with the notable exception of the E-Box (CANNTG) and TATA sequences), as are their spatial arrangements relative to both the TSS and each other.
10.4. DNA 8-Mers that Localize in Human Promoters
When we examine the distribution of 8-mers in human promoters, we observe that some sequences are preferentially localized near the TSS [2]. Our assumption is that these sequences may be TFBSs. An important issue to understand with this approach is that we can only identify abundant TFBSs: if a TFBS occurs in a limited number of promoters, we will not be able to identify it using this approach of examining all promoters because the signal may be too far diminished relative to the genomic background. Figure 10.2a shows the distribution of CGGAAGTG, an ETS motif that is the most preferentially localized DNA sequence in human promoters. When we count the occurrence of 8-mers in promoters, we have chosen to use a 20 bp window or bin in this counting process for the following reasons. On average, in 13,010 promoters over a range from −1,000 to +500 bps, one would expect that each 8-mer would occur ((13,000 × 1,493)/65,536) = ∼300 times. 1,493 is the number of 8-mers in 1,500 bp of DNA, 13,010 is the number of promoters we have examined, and 65,536 is the number of possible 8-mers. In each 20 bp bin, on average, each 8-mer would occur 4 times. To increase the statistical power of our calculations, we add the occurrences of an 8-mer together with the occurrences of its complementary sequence. This essentially doubles the number of occurrences of an 8-mer making it easier to evaluate the distribution across the promoter region for any non-random distribution properties. This raises a problem for this type of calculation; do we count the palindromic sequences (there are 256 palindromic 8-mers) as a single occurrence or as two occurrences, one on each strand? It should be appreciated that palindromic sequences have the property that they are identical on each strand of DNA, allowing a TF to bind to either strand, which essentially doubles their concentration compared to non-palindromic sequences that need to be recognized by a TF on only one strand of DNA. Figure 10.2b presents a measure of the non-random distribution for all 8-mers where we combine an 8-mer and its complement, resulting in 32,896 8-mers (32,640 non-palindromic 8-mers and 256 palindromic 8-mers). Previously, we used “clustering factor” as the name for this non-random distribution of an 8-mer in the promoter region [2, 3]. Now, we prefer the name Localization Factor (LF) because it more accurately captures what we are measuring. To determine if a DNA sequence localized, the mean and standard deviation (σ) were determined based on its abundance in each of the 75 bins (each 20 bp). Those bin values that were ≥ 2 SD above the mean were considered to be part of the cluster and a new mean and standard deviation (σ′) were calculated excluding these bin values. A localization factor (LF) was then calculated based on this corrected mean and standard deviation,
Fig. 10.2.
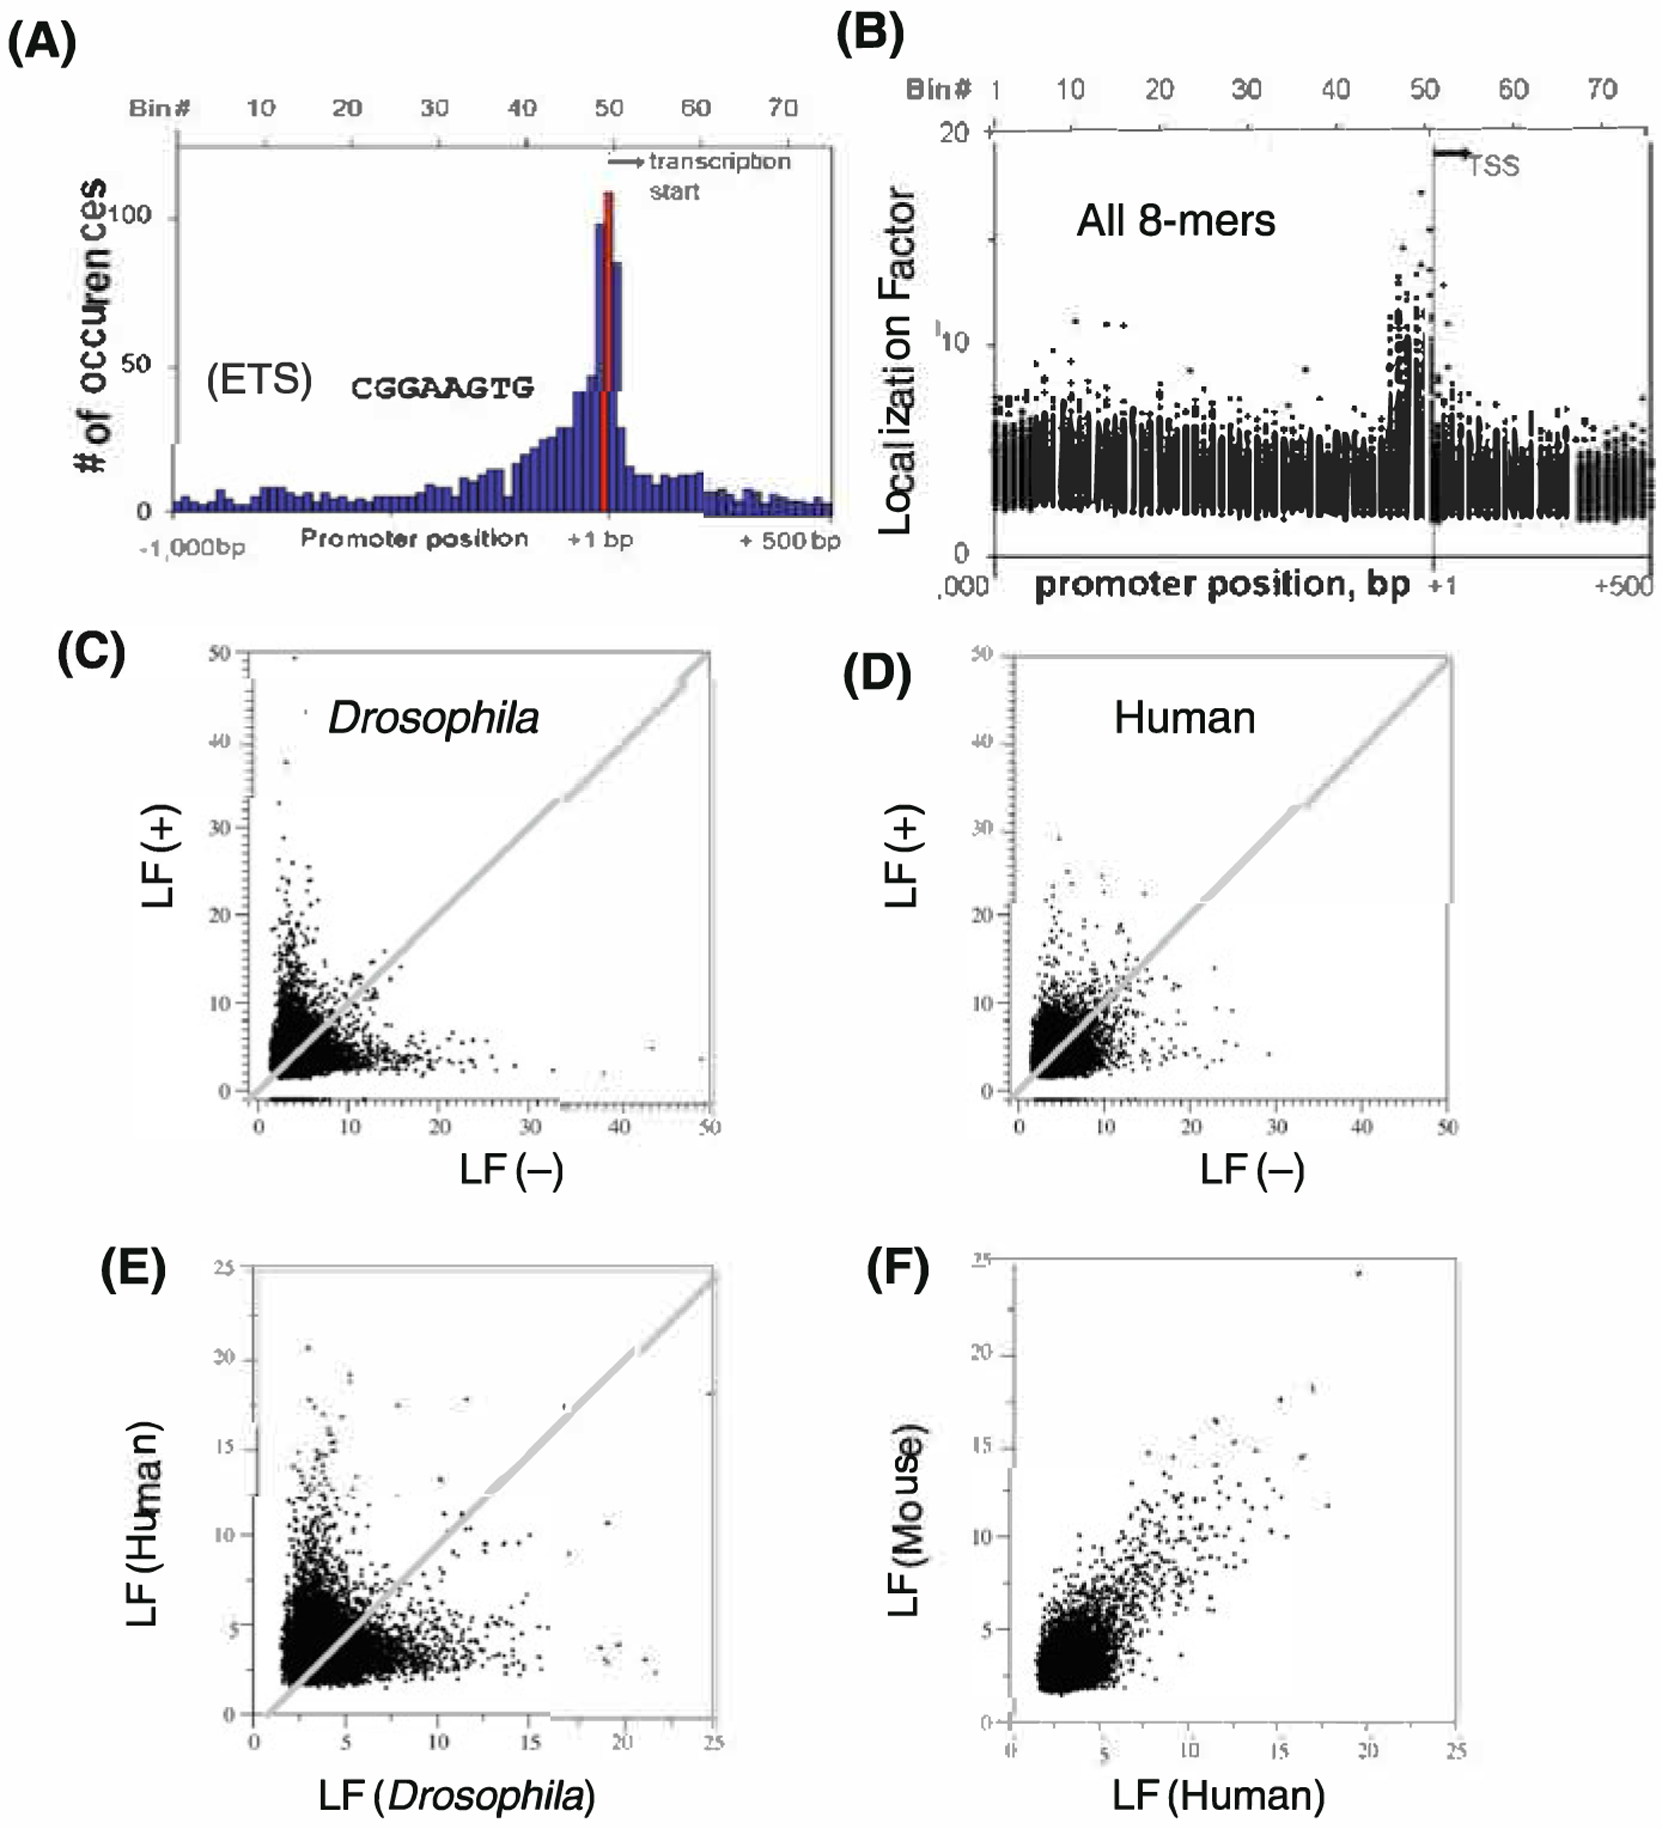
a The most preferentially localized 8-mer in human promoters is CGGAAGTG, an ETS sequence. The number of occurrences of the CGGAAGTG sequence and its complement is counted in 13,010 promoters aligned to the TSS using 20 bp windows (bins) from −1,000 to +500 bps. From this distribution, a measure of non-random distribution or preferential localization termed Localization Factor (LF) is calculated. b Localization of all 8-mers in promoters region. For each 8-mer and its complement, a measure of non-random distribution is calculated and plotted in the most abundant window. Note that most of the preferentially localized 8-mers occur just upstream of the TSS. c Localization of 8-mers that occur on one strand compared to the opposite strand in 10,914 Drosophila promoters [3]. Here, many sequences are off the diagonal indicating that these sequences occur preferentially on one strand and not the other strand. d Localization in human promoters of 8-mers that occur on one strand compared to the opposite strand. Note that most sequences are on the diagonal indicating that these sequences occur on either DNA strand. e Localization of 8-mers in human compared to Drosophila promoters. The sequences off the diagonal indicate that different sequences localize in promoters in these two species. f Localization of 8-mers in human compared to mouse promoters (20,328 promoters). Most sequences are near the diagonal indicating that the same sequences localize in the promoters of these two species
We have plotted this Localization Factor in the bin where the DNA sequence is the most abundant. In Fig. 10.2b, we observe that most of the 8-mers with high LF localize just upstream of the TSS, with some localizing just downstream of the TSS.
10.5. Comparing DNA 8-Mers that Localize in Human, Mouse, and Drosophila Promoters
The next several panels compare the 8-mers that localize in Drosophila, human, and mouse promoters (Fig. 10.2c–f). In Drosophila promoters, we also observe that some sequences preferentially localize in the proximal promoters. A startling difference between human and Drosophila promoters is revealed when one examines the DNA strand dependence of the localization of 8-mers in the proximal promoter. We calculated the distribution of all 65,536 8-mers and plotted the localization factor of an 8-mer vs. its complement. In Drosophila promoters, many 8-mers localize on one strand of DNA but not on the other strand, which imparts directional information to the promoter (Fig. 10.2c). In human promoters (Fig. 10.2d), the strand dependence of the localization factor of an 8-mer is much less strong (the exceptions are TATA sequences) suggesting that preferentially localized DNA sequences do not contain information that imparts direction information. When we examine the sequences that are preferentially localized in Drosophila and human promoters, there is little overlap (Fig. 10.2e) indicating that the DNA sequences that regulate promoter function are different between these two species, a result we found surprising having been taught that Drosophila is a good model organism to learn about humans, an assumption that is true for many aspects of biology but apparently not for understanding promoter sequences. In contrast, we observe that similar sequences are preferentially localized in human and mouse promoters, suggesting similar promoter architecture between these two species (Fig. 10.2f).
Additional differences between human and Drosophila promoters are identified when we examine the localization of discontinuous 8-mers that contain two 4-mers separated by an insert with the aim of identifying either dimeric motifs or wide TFBSs that are preferentially localized in promoters (Fig. 10.3). We examined insert length of 1–60 base pairs. In human promoters, we only identify sequences that localize and have a short insert length. Examination of these sequences shows they are primarily versions of the continuous 8-mers that localize in promoters. The exceptions are combinations of ETS:ETS and ETS:CRE sequences we will discuss later in this chapter. In Drosophila, we identify pairs of 4-mers that are separated by 20–30 bps that localize in promoters. These pairs of sequences are combinations of TATA and INR sequences identified previously [3] and additional sequences that we are currently studying. The general conclusion from this analysis is that human proximal promoters are comprised of continuous sequences with no fixed positioning information among different sequences in the promoters. In contrast, Drosophila promoters have strand specific sequences that are often uniquely positioned relative to other sequences in the promoter.
Fig. 10. 3.
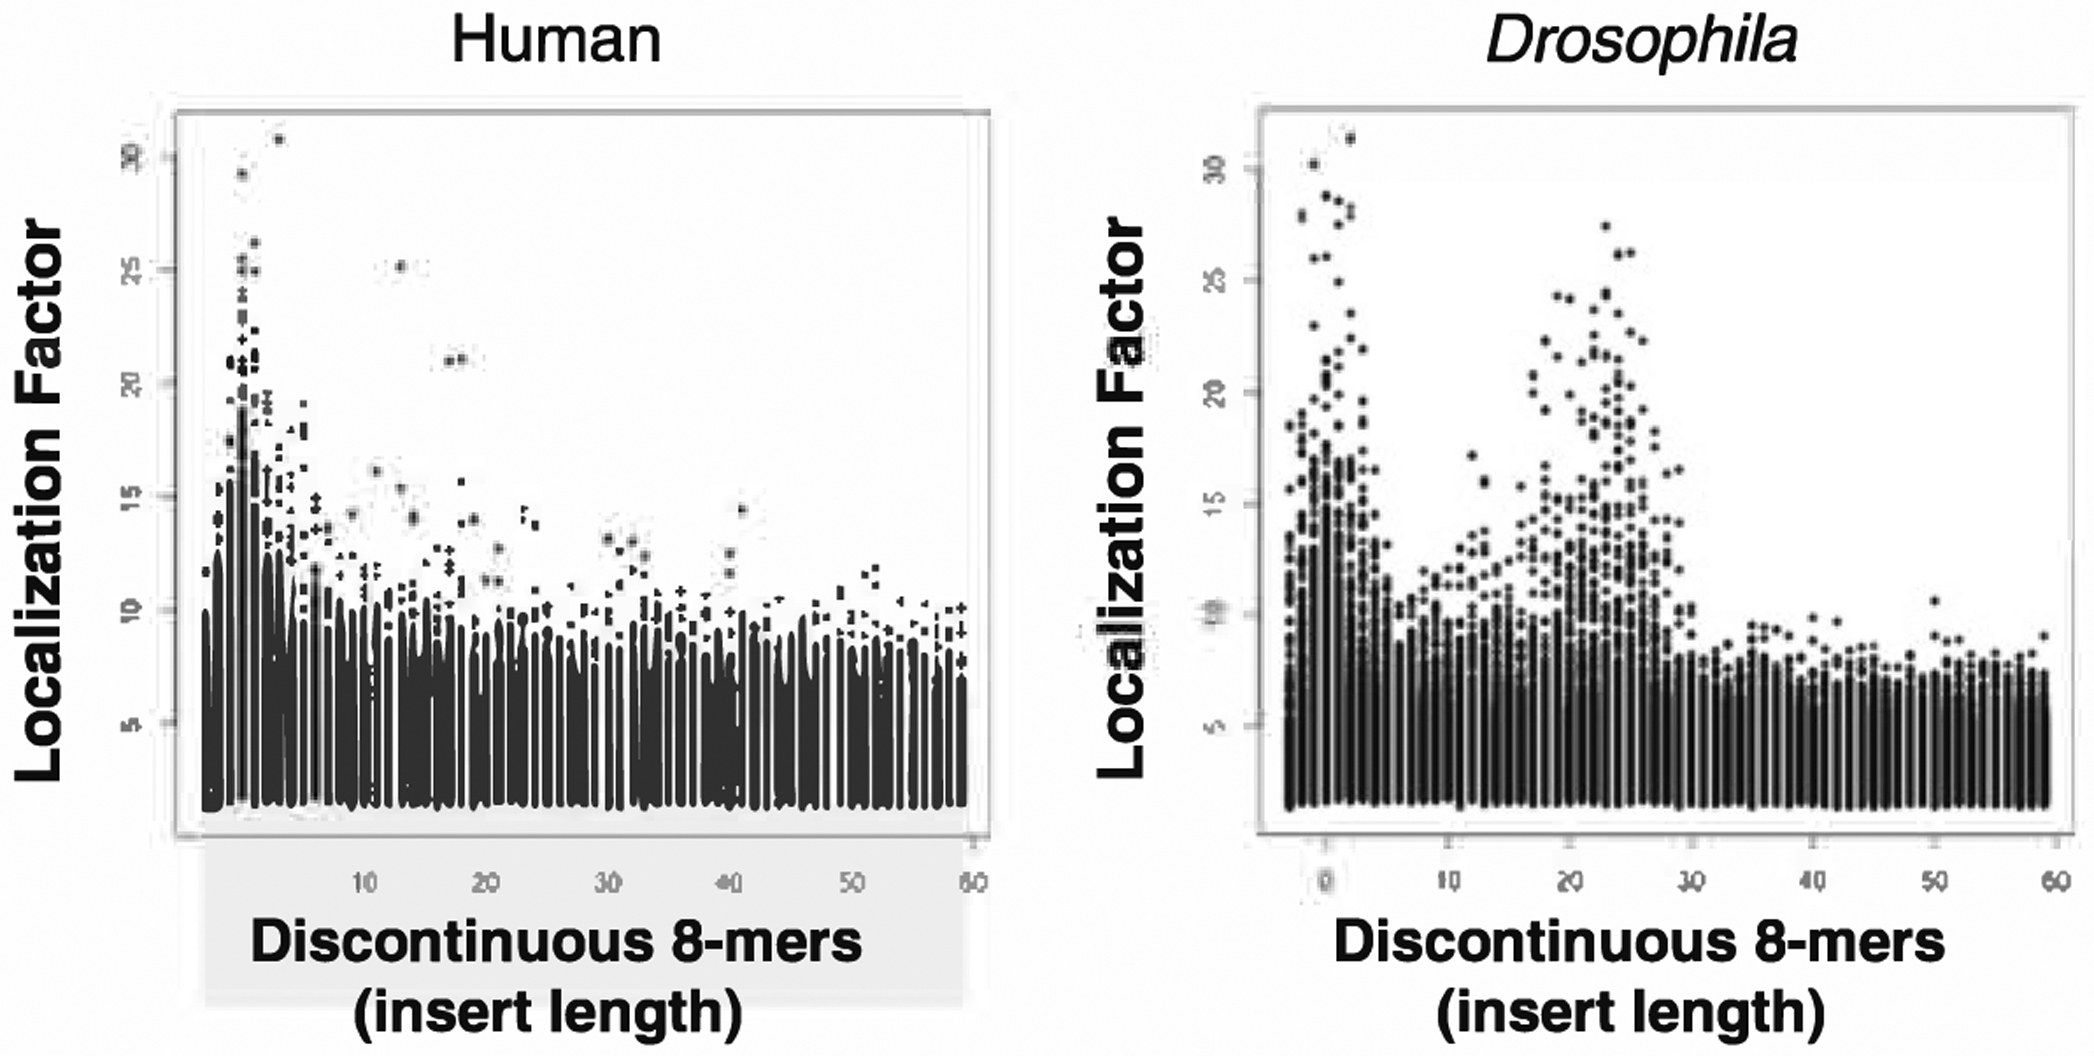
Localization factor for 8-mers composed of two 4-mers separated by a variable insert length between the two 4-mers. Note the difference between Drosophila and human promoters. Individual pairs of 4-mers that localize in proximal promoters are noted
These differences in human and Drosophila promoter organization suggest that these two species use different mechanisms to regulate gene expression. First, the different frequency and distribution of mononucleotides and dinucleotides in promoters correlates with nucleosome positioning or occupancy. Drosophila promoters are A&T rich with a peak of A&T dinucleotides between −200 bp and the TSS (Fig. 10.1), a region that experimentally is known to be nucleosome free, particularly for active genes [16]. A similar correlation is observed in the yeast genome where the promoter regions between −200 and the TSS are A&T rich and devoid of nucleosomes [17]. This model of promoter organization in Drosophila has an appealing simplicity. The promoter region is accessible and is bound by multiple TFs that bind TFBSs that occur on a single strand of DNA and are uniquely positioned relative to each other. In contrast, in humans, there are usually CpG islands at promoters. These CpG island sequences experimentally bind nucleosomes because of their C&G content [18] but are devoid of nucleosomes because they are instead bound by TFs. The competition between TFs and nucleosomes is evident at inducible promoters where the induction of DNA hypersentitive sites is observed. Going forward, we are particularly interested in experimentally examining how CpG methylation can shift the equilibrium between TF binding and nucleosome binding. This scheme of a competition would allow for a DNA regulatory sequence to be repressed by nucleosome binding and activated by the displacement of the nucleosome and the binding of TFs. Additionally, the same sequences that are TFBSs are also nucleosome binding sites [19]. This switch mechanism theoretically allows more control over gene expression.
The dramatic difference in promoter organization between Drosophila and human indicates that the TFBSs that delineate promoters and that control expression of coordinately regulated genes have changed over evolutionary time. For example, between Drosophila and humans, the ribosomal proteins are conserved but the TFBS that regulate their expression are different [20]. It is hard to image how this could happen if one imagines that evolution is an incremental process with selection acting on each mutation. This idea of gradual change in genome structure does not explain the global change in ribosomal promoter structure that is observed. An alternative image is that, episodically, transposable elements ravage the genome, inserting during meiosis into active genes, these would include the housekeeping genes that are active during this time. The transposable elements could degrade over time with only the relevant TFBS remaining resulting in a dramatic increase in the number of a particular TFBS (those found in the transposable elements) in proximal promoters. This process of the housekeeping genes being ravaged by transposable element insertions could repeat itself over time resulting in the evolution of CpG islands. This image of promoter evolution could explain how TFs that are conserved in both Drosophila and humans have dramatically different occurrences in proximal promoters. This idea of promoter evolution is supported by the observation that some mammalian TFBS are derived from repetitive elements [20]. Some other mechanisms are reviewed recently [21].
10.6. 8-Mers that Preferentially Localize in Human Proximal Promoters
Previously, we have taken the 150 most localizing sequences in human promoters and grouped them into 8 related sequences (Table 10.1) [2]. These DNA sequences are all known TFBSs. We have now updated this grouping of TFBS as we have gained more insight and have included this table of 150 8-mers that localize in promoters because we expect that even closer examination will reveal that the groups we have generated are overly simplistic. Both CpG and non-CpG sequences localize in proximal promoters. This process of grouping different sequences is fraught with complications. If two 8-mers are different by a single base pair, do we conclude that they are variants of the same TFBS or are they different TFBSs? We do not know the answer to this question. We have taken the approach of grouping sequences together that may be related, but further understanding is likely to result in a refinement of these groupings. The number of 8-mers in each TFBS group is variable. The TFBS with the most 8-mers is CCAAT, while the Box-A TFBS is observed in only one 8-mer. Given the fact that we are only examining 8-mers sequences, two extreme possibilities could explain the large number of 8-mers within the CCAAT group. The first possibility is that the multiple 8-mers containing CCAAT could represent a single TFBS consensus that is 8 or more bps long and each base pair is significant but variable. The second possibility is that the CCAAT TFBS is 5 bps long and the remaining 3 bases in the 8-mer represent unconstrained surrounding sequences. When we align the 31 8-mers placed into the CCAAT group, we observe an invariant 5 bp central core, surrounded by variant but constrained sequences, giving rise to a 9 bps consensus sequence. Several of the TFBS groups appear very consistent, e.g. CCAAT and ETS while others appear more varied, e.g. SP1 and NRF1 [2].
Table 10.1.
Grouping of DNA 8-mer sequences that localize in human promoters. 150 DNA sequences are grouped into related sequences and arranged by their peak position relative to the TSS. From the left the table contains: the most abundant bin, the number of times the sequence occurs in the distribution, the 8-mer sequence, and finally the probability (P) that the cluster occurs by chance. The end of the table contains consensus sequences. Here the leftmost numbers are the bins defining the peak, followed by the localization factor (LF), the consensus sequence, and finally the number of occurrences of the sequence in the bins that comprise the peak. Exclamation point(!) denotes sequences that are at least threefold more abundant in the maximum bin on the DNA strand presented in the table than on the opposite strand. IUPAC letters used to represent degenerate bases are: R (G,A), W (A,T), Y (T,C), K (G,T), V (G, C, A), D (G,A,T), N (A,T,G,C)
| CCAAT | CRE | ||||||||||
| 47 | 690 | CAATGGGA | 11.3 | 50 | 484 | TGACGTCA | 18.4 | YY1 | |||
| 47 | 601 | CAATCAGC | 13.1 | 49 | 282 | ATGACGTC | 8.5 | 51 | 1018 | CAAAATGG | 9.8 |
| 46 | 708 | CAATCAGA | 14.4 | 50 | 503 | CTGACGTC | 9.3 | 51 | 1048 | AAAATGGC | 16.8 |
| 45 | 310 | CCAATCGG | 8.1 | 48 | 635 | GTGACGTC | 13.5 | 51 | 436 | AAATGGCG | 23.4 |
| 46 | 871 | CCAATCCC | 8.0 | 50 | 313 | GTGACGCA | 7.4 | 51 | 414 | AATGGCGG | 12.9 |
| 48 | 620 | CCAATCAC | 11.7 | 49 | 345 | AGTGACGT | 9.4 | ||||
| 47 | 1061 | CCAATCAG | 23.6 | 49 | 294 | CGTGACGC | 8.0 | ATG/K07AK | |||
| 47 | 306 | CCAATCGC | 13.3 | 49 | 280 | CGTGACGT | 10.2 | 52 | 960! | CCAAGATG | 7.5 |
| 47 | 770 | CCAATGGG | 31.1 | 48 | 379 | GGTGACGT | 7.1 | 50 | 617! | GCAAGATG | 13.7 |
| 47 | 896 | GCCAATCA | 22.5 | 50 | 264 | TGTGACGT | 11.4 | 51 | 543 | GCGCCATG | 9.3 |
| 46 | 361 | GCCAATAG | 9.2 | 49 | 241 | ACGTGACG | 10.3 | 53 | 688! | GCACCATG | 9. 9 |
| 48 | 357 | GCCAATCG | 12.4 | 49 | 472 | ACGTGACC | 8.4 | 52 | 1152 | CAGCCATG | 11.1 |
| 46 | 578 | GCCAATGA | 17.0 | ETS:CRE | 53 | 1005 | CACCATGG | 8.6 | |||
| 47 | 775 | GCCAATGG | 26.8 | 49 | 345 | AGTGACGT | 9.4 | 52 | 426 | CGCCATGC | 9.0 |
| 46 | 553 | GCCAATCC | 9.7 | 49 | 332 | AAGTGACG | 23.9 | 52 | 931 | CGCCATGG | 9.4 |
| 47 | 537 | TCCAATCA | 7.0 | 50 | 769 | GAAGTGAC | 10.4 | 52 | 1081! | CAAGATGG | 39.6 |
| 47 | 220 | ACCAATCG | 14.7 | 49 | 1324 | GGAAGTGA | 16.2 | 52 | 1202! | AAGATGGC | 36.9 |
| 47 | 469 | ACCAATGG | 17.8 | 52 | 881! | AGATGGCG | 40.2 | ||||
| 46 | 583 | AC CAATCA | 17.4 | ||||||||
| 47 | 384 | GACCAATG | 9.8 | TATA | 51 | 654 | ACATGGCG | 13.5 | |||
| 47 | 400 | GACCAATC | 19.2 | 49 | 486 | CCTATAAA | 9.3 | 52 | 1026! | GATGGCGG | 27.2 |
| 47 | 893 | AGCCAATC | 19.3 | 49 | 571 | GCTATAAA | 7.1 | 52 | 920 | CATGGCGG | 18.4 |
| 46 | 748 | AGCCAATG | 13.8 | 49 | 496 | CTATAAAG | 10.1 | 54 | 291 | CATGGCGT | 11.1 |
| 47 | 680 | GGCCAATG | 11.7 | 49 | 809 | TTATAAAG | 10.9 | 51 | 583 | ATGGCGCC | 23.6 |
| 48 | 658 | GGCCAATC | 24.0 | 49 | 861! | TATAAAAG | 11.4 | 51 | 1125! | ATGGCGGC | 27.7 |
| 47 | 547 | GAGCCAAT | 10.2 | 49 | 417 | TATATAAG | 9.7 | 52 | 619 | ATGGCGGG | 8.2 |
| 47 | 324 | GGACCAAT | 8.8 | 49 | 542! | TATAAAGG | 28.0 | 52 | 468! | ATGGCGGA | 16.0 |
| 47 | 483 | GGGCCAAT | 12.4 | 49 | 860! | ATAAAAGG | 17.1 | 52 | 966 | ATGGCTGC | 15.8 |
| 48 | 509 | CGGCCAAT | 10.9 | 49 | 630 | TAAAAGGC | 9.9 | ||||
| 47 | 1039 | CAGCCAAT | 31.4 | Protein coding? | |||||||
| 47 | 774 | TCAGCCAA | 10.5 | NRF-1 | 54 | 791! | CCAGGTAA | 7.1 | |||
| 47 | 1036 | GCAGCCAA | 7.0 | 50 | 1240 | TGCGCCTG | 11.9 | 56 | 307! | CGCAGGTA | 8.2 |
| 50 | 2300 | GCGCCTGC | 12.3 | 51 | 443 | CGCAGTCT | 8.1 | ||||
| SP1 | 50 | 1767 | CGCCTGCG | 11.6 | 55 | 1638! | GGTGAGTG | 7.6 | |||
| 48 | 1332 | GCCACGCC | 15.7 | 50 | 2154 | GCCTGCGC | 7.8 | 53 | 848! | TGGTGAGT | 7.9 |
| 48 | 8136 | GCCCCGCC | 25.2 | 48 | 1205 | GCGTGCGC | 7.4 | 52 | 1414 | GAGAGCTG | 7.4 |
| 48 | 3078 | CGCCCCTC | 7.3 | 50 | 1041 | CCTGCGCA | 12.9 | 53 | 3887! | CTGCTGCT | 9.1 |
| 48 | 5248 | CGCCCCGC | 13.7 | 50 | 903 | ACTGCGCC | 8.0 | 53 | 3570! | TGCTGCTG | 8.0 |
| 48 | 3141 | CGCCCCCT | 7.4 | 50 | 572 | TGCGCATG | 8.5 | ||||
| 48 | 7055 | CCGCCCCC | 18.1 | 49 | 386 | CGCGCATG | 11.1 | ||||
| 47 | 2106 | CCGCCCAC | 8.1 | 50 | 1179 | GCGCATGC | 18.5 | Consensus sequences | |||
| 48 | 5783 | CCGCCTCC | 7.0 | 50 | 463 | CGCATGCG | 15.5 | SP1 | |||
| 47 | 5204 | CCGCCCCG | 16.6 | 44–50 | 8.8 | CCCCGCCC | 3424 | ||||
| 48 | 3688 | CCGCCCCT | 12.6 | EST | 44–50 | 8.3 | GCCCCGCC | 2687 | |||
| 48 | 10767 | CCCGCCCC | 28.3 | 49 | 1546 | AGGAAGTG | 7.6 | 44–50 | 8.7 | CCCGCCCC | 2257 |
| 48 | 1170 | ACGCCCCC | 15.4 | 49 | 923 | GGAAGTGC | 11.9 | CCAAT | |||
| 48 | 829 | ACGCCCCG | 7.9 | 50 | 1892 | GGAAGTGG | 7.5 | ||||
| 48 | 1639 | CACGCCCC | 13.9 | 49 | 284 | CGGAAGTA | 23.1 | 42–49 | 10.0 | RRCCAATSR | 1170 |
| 48 | 2890 | CCCGCCCT | 8.9 | 50 | 484 | CGGAAGCA | 13.8 | ETS | |||
| 47 | 2334 | CCCGCCCA | 10.8 | 50 | 426 | CGGAAGTC | 24.8 | 44–51 | 13.1 | VCCGGAARY | 1031 |
| 48 | 2462 | TCCGCCCC | 8.4 | 51 | 402 | CGGAAGTT | 8.0 | 48–51 | 11.6 | RGCGGAAGY | 260 |
| 48 | 4767 | CCCGCCTC | 18.8 | 50 | 991 | CGGAAGTG | 29.5 | TATA | |||
| 48 | 3366 | CTCCGCCC | 11.8 | 51 | 356 | CGGAAATG | 7.8 | 48–49! | 7.7 | TATAAAD | 472 |
| 48 | 11029 | CCCCGCCC | 31.3 | 49 | 567 | CGGAAGCT | 8.4 | 48–49! | 2.4 | TATATAD | 349 |
| 48 | 3190 | CCCCGCCT | 12.5 | 50 | 824 | CGGAAGCG | 19.2 | 48–50! | 5.5 | TATAAGD | 217 |
| 49 | 918 | TTCCGCCC | 17.8 | 49 | 1150 | CCGGAAGC | 20.9 | Box A | |||
| 48 | 2673 | GCTCCGCC | 7.2 | 50 | 1030 | CCGGAAGT | 31.9 | 43–51 | 8.2 | TCTCGCGA | 211 |
| 49 | 1213 | CTTCCGCC | 7.9 | 51 | 459 | CCGGAAAC | 13.1 | NIRF-1 | |||
| 48 | 4947 | GGCCCCGC | 7.1 | 50 | 600 | ACCGGAAG | 40.6 | ||||
| 47 | 5139 | CCTCCCTC | 8.1 | 50 | 1096 | GCCGGAAG | 23.2 | 46–51 | 7.4 | CGCCTGCG | 512 |
| 48 | 7985 | CCCCTCCC | 7.4 | 49 | 1224 | CCCGGAAG | 20.1 | 46–50 | 5.8 | CGCGTGCG | 220 |
| 51 | 603 | ACCCGGAA | 7.8 | 46–51 | 9.0 | CGCATGCG | 186 | ||||
| Box A | 50 | 382 | CACCGGAA | 12.9 | CRE | ||||||
| 48 | 432 | TCTCGCGA | 10.6 | 49 | 401 | GACCGGAA | 7.4 | 45–50 | 9.5 | TGACGTCA | 190 |
| 49 | 556 | AGCCGGAA | 8.7 | 45–51 | 5.1 | TGATGTCA | 125 | ||||
| 50 | 600 | GCGGAAGT | 33.6 | 46–50 | 7.1 | TTGCGTCA | 48 | ||||
| E-Box | 50 | 541 | CGCCGGAA | 24.9 | E-Box | ||||||
| 49 | 755 | CACGTGAC | 9.0 | ETS:ETS | 46–50 | 7.3 | CCACGTGA | 123 | |||
| 48 | 294 | TCACGTGA | 9.4 | 51 | 820 | GCGGAAGC | 7.9 | 47–51 | 7.6 | TCACGTGA | 89 |
| 49 | 582 | TCACGTGG | 9.0 | 50 | 712 | AGCGGAAG | 18.5 | ||||
| 50 | 433 | AAGCGGAA | 15.9 | ||||||||
10.6.1. The 8 Consensus Sequences Representing TFBS
We have divided the TFBSs into two groups: the non-palindromic sequences which are bound by a protein monomer, and the palindromic sequences which are bound by protein dimers. We present the distribution of the TFBSs, their relevant variants, and an X-ray crystal structure of the protein bound to DNA if it exists in the literature to help understand the length of the TFBS (Fig. 10.4). The majority of these TFBSs preferentially occur in the promoters of housekeeping genes presumably reflecting the abundance of these types of promoters. The notable exception is that TATA preferentially occurs in tissue specific genes. GO term analysis of the genes whose promoters contain these different TFBSs reveals that individual TFBSs preferentially occur in the promoters of specific kinds of genes. This general conclusion lends support to the general proposition that one can unravel the function of a gene by knowing its promoter sequence.
Fig. 10.4.
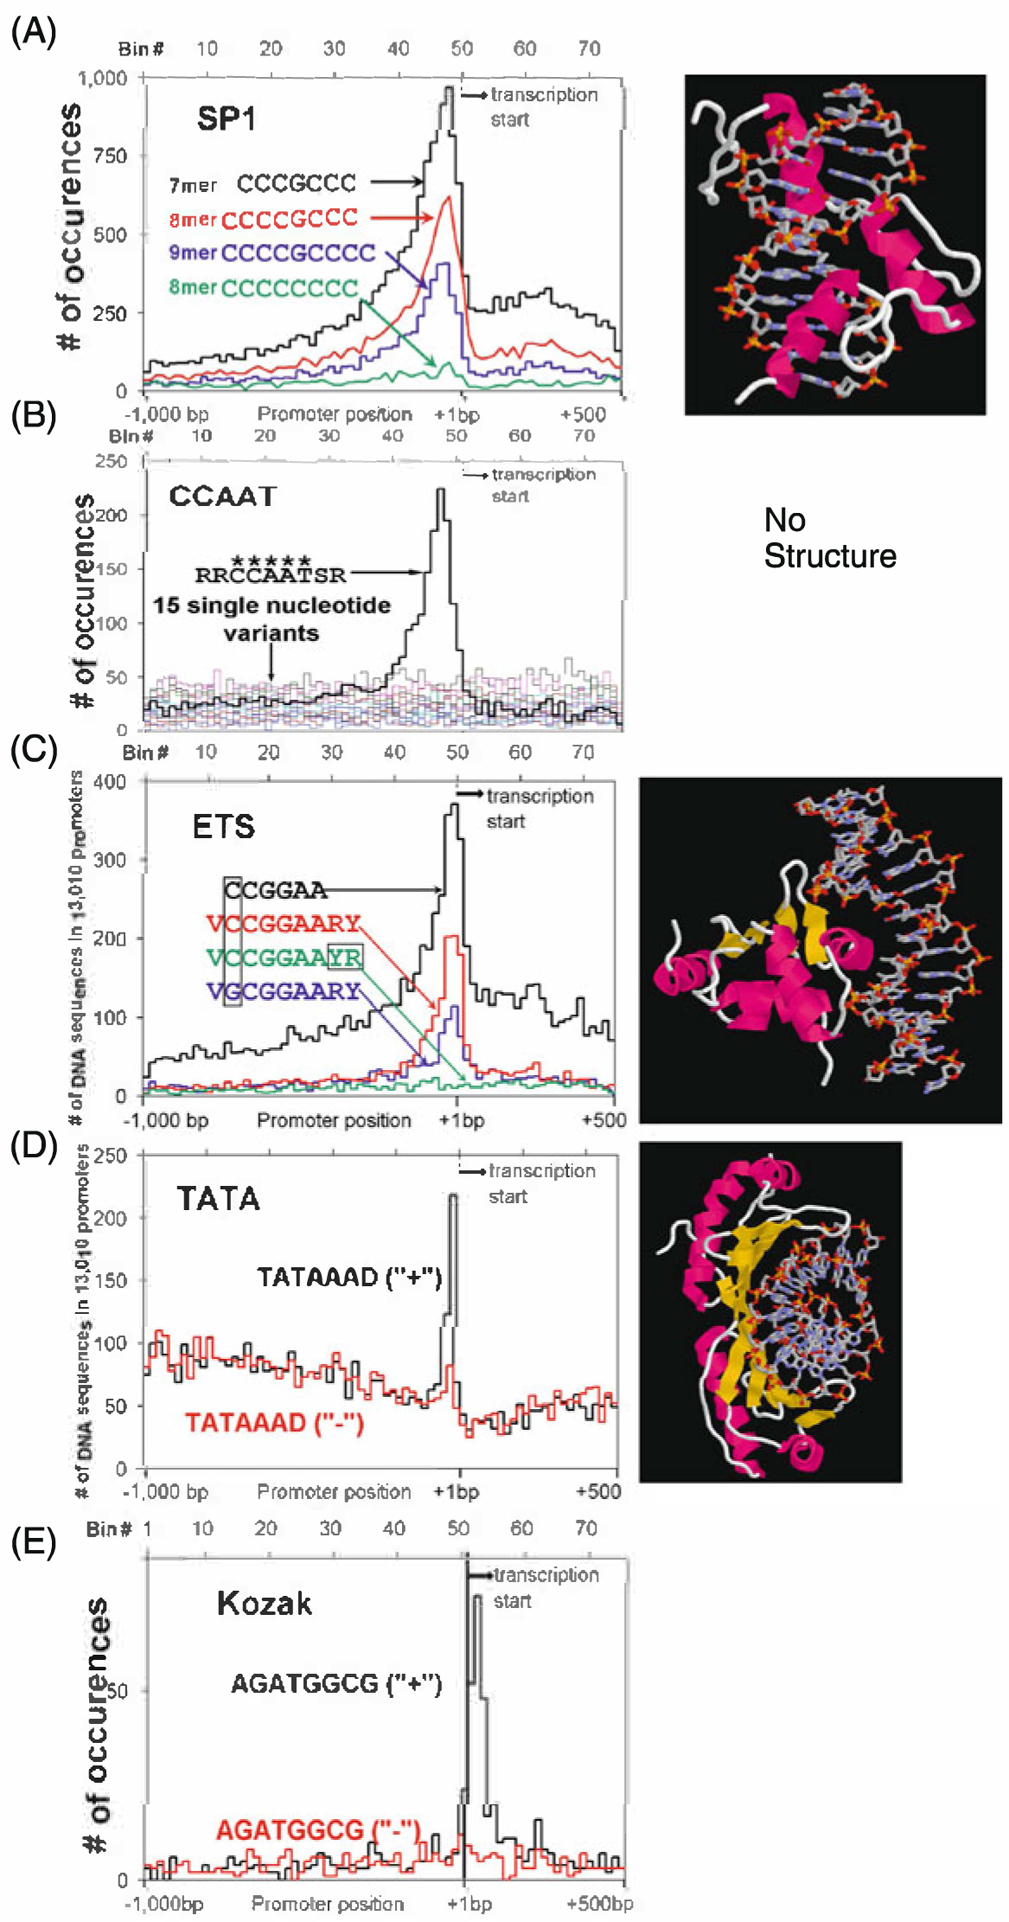
Distribution of non-palindromic TFBS in promoters. We include both the distribution of the TFBS and the X-ray crystal structure if it exists. a SP1 sequences (CCCGCCC, CCCCGCCC, CCCCGCCCC) and a non-peaking single base variation (CCCCCCCC). Crystal structure of a three zinc finger protein bound to DNA. b The CCAAT consensus RRCCAATSR and the 15 single base variants of the central CCAAT. Note the 5-mer CCAAT is needed for there to be any localization in the proximal promoter. No crystal structure is available. c ETS core (CCGGAA), consensus sequence (VCCGGAARY), and a peaking (VGCGGAARY) and non-peaking VCCGGAAYR variant. Crystal structure of ETS bound to DNA d Strand specific localization of the TATAAAD sequence. Note both the high background and the sharpness of the peak. Crystal structure of TATA bound to DNA. This is the only protein DNA complex presented here without an α-helix in the major groove of DNA. e Kozak sequence (AGATGGCG) on the plus strand (+) and minus strand (−). Again, note the DNA strand dependence of the localization of this sequence
10.6.1.1. Non-palidromic Sequences
SP1 is found in 21% of promoters. Twenty one 8-mers have been placed in this group (Fig. 10.4). The most abundant localizing sequence is the sequence CCCCGCCC bound by the SP1 family of 3-zinc finger motif proteins [22]. This sequence contains a CpG and methylation decreases binding [12]. Extended sequences also peak including the 8-mer GCCCCGCC and the 9-mer CCCCGCCCC which is the length of DNA that a 3-zinc finger protein could bind. Many 8-mers were placed in this group and it is not obvious that these sequences represent a unique TFBS. The KLF family of C2H2 zinc finger proteins is known to bind to the CCCCTCCC variant. There are many C2H2 zinc finger family members and one presumes that they may bind to SP1 related sequences.
CAAT is found in 8% of promoters. Thirty one 8-mers contain an invariant 5-mer (CCAAT) termed CAAT which was one of the first specific DNA sequences identified that was critical for gene expression [23]. This TFBS does not contain a CpG and thus is immune to epigenetic regulation. Neighboring DNA sequences are constrained resulting in the consensus 9-mer (RRCCAATSR) (Fig. 10.4). This sequence is the furthest from the transcription start site, peaking about at −100 bps. There are several TFs that can bind to this sequence. One is a trimeric protein called CBF or NF-Y [24] with homology to the yeast proteins HAP2 and HAP3. There is no X-Ray structure for this protein DNA complex. 8-mers in this group appear to represent a unique TFBS.
ETS is found in 8% of promoters. Nineteen 8-mers have a core consensus CCGGAA which is bound by the ETS family ofTFs [25, 26]. These sequences contains a CpG and methylation decreases DNA binding [12]. The extended consensus is the 9-mer VCCGGAARY. This extended consensus is found in DNA binding site selection experiments using ETS proteins [26]. Six 8-mers contain a variant ETS sequence, the 6-mer GCGGAA, a single base change from the ETS consensus. The extension of this sequence is the 9-mer RGCGGAAGY found in 2% of promoters. DNA binding site selection experiments indicate that this ETS site variant is bound by the PEA-3 subfamily of ETS proteins [27, 28].
ETS:ETS and ETS:CRE pairs:
Recent work from our group indicates that some of the discontinuous 8-mers that localize are combinations of ETS:ETS or ETS:CRE sites. We observe two continuous ETS sequences with the GCGGAA ETS variant always being a member of the ETS:ETS pair. This direct repeat is not what has been observed with biochemical selection experiments where inverted ETS sites are observed [29]. An 8-mer representing the pair of ETS sites is AAGCGGAA. An additional partner for ETS is observed in several 8-mers that overlap to produce GGAAGTGACGT that appear to be an ETS (CCGGAAGTG) and a CRE (TGACGT) site that overlap. An interesting aspect of these juxtapositions of two ETS sites and the ETS and CRE site is that the space between the two sites is invariant suggesting some structural constraint that would be exciting to examine.
TATA is found in 3% of promoters. Nine 8-mers contain the consensus 7-mer TATAAAD, a sequence bound by the TATA binding protein (TBP) [30] that recruits the basal machinery to initiate transcription [31]. This TFBS does not contain a CpG. The TATA sequence shows the sharpest peak but also has the highest background. This is the only TF binding site that localizes and occurs in a DNA strand specific manner (Fig. 10.3). TATA also localizes in a strand specific manner in Drosophila. TATA occurs in only a few percent of promoters when you restrict the analysis to around −30 bps [2, 32].
Box-A is found in 1% of promoters. Only one 8-mer contains this TFBS (TCTCGCGA). This TFBS is involved in the regulation of the ribosomal genes but the TF that binds this sequence is not known [33]. This TFBS has two CpGs allowing methylation to potentially modulate DNA binding.
Kozak:
Downstream of the TSS we observe the Kozak sequence that contains the initiating ATG where protein synthesis initiates from the mRNA. As expected, this sequence is strand specific. It is sometimes difficult to observe the strand specific properties of the Kozak sequence because the sequence can be palindromic.
YY1:
Previously, we grouped all ATG containing sequences that occur downstream of the TSS as Kozak sequences. Closer examination suggests that they are bound by YY1, a zinc finger protein [34].
Protein Coding:
We observe multiple 8-mers downstream of the TSS that occur on a single strand and appear to be protein coding. They can translate into hydrophobic amino acids that occur at the 5’ end of proteins as a transmembrane signal.
10.6.1.2. The Palindromic Sequences
Three sequences that localize in promoters are palindromic (Fig. 10.5). The proteins that binding these palindromic sequences are dimeric raising the possibility that heterodimers can form and bind variants of the consensus sequence. This is known for the B-ZIP and B-HLH-ZIP proteins that bind the CRE and E-Box respectively. The crystal structures of dimer B-ZIP and B-HLH-ZIP protein help rationalize why these proteins bind palindromic sequences.
Fig. 10.5.
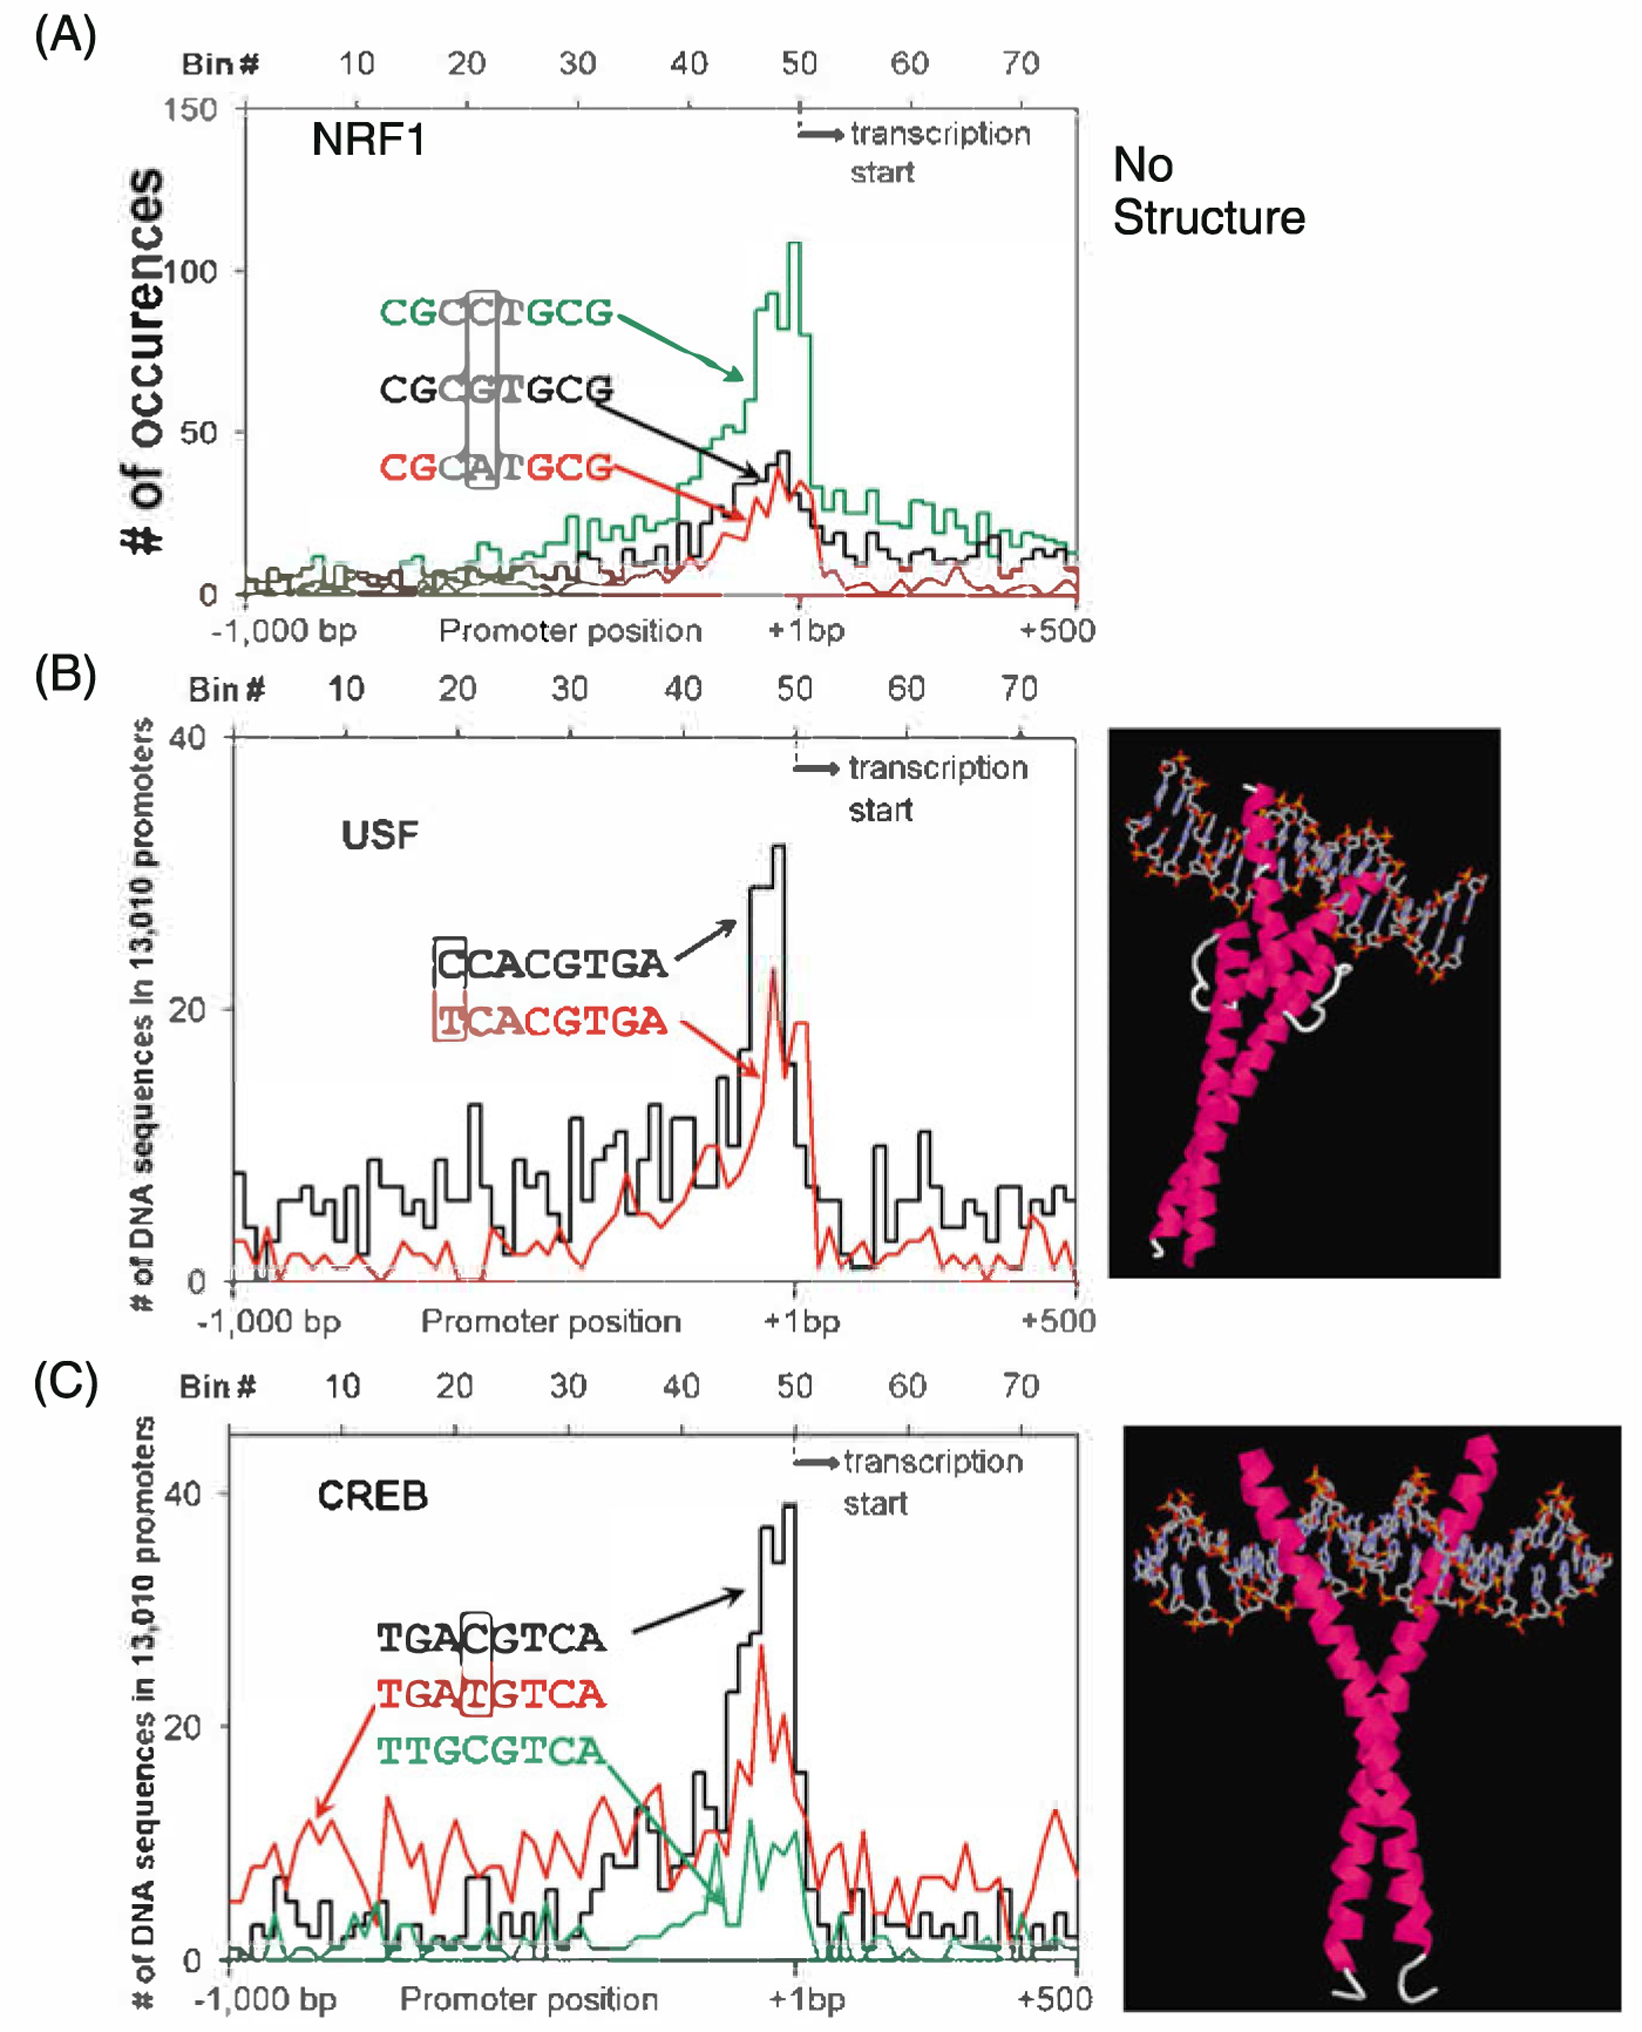
Distribution of palindromic TFBS in promoters. We include both the distribution of the TFBS and the X-ray crystal structure if it exists. a NRF-1 sequence (CGCCTGCG, CGCGTGCG, CGCATGCG). No X-ray structure exists. b E-Box sequences (TCACGTGG, TCACGTGA). Crystal structure of USF bound to E-Box sequence [38]. c CRE-like sequences (TGACGTCA, TGATGTCA, TTGCGTCA). Crystal structure of CREB bound to the CRE sequence [46]
NRF1 is found in 6% of promoters. The palindromic CGCATGCG sequence is the most localizing 8-mer. This TFBS contains two CpGs. NRF-1 is the only member of the family and activates the expression of nuclear genes that function in the mitochondrion and helps to link general cellular respiration with other cellular functions including cell growth [35]. Unfortunately, no crystal structure exists. When we vary each bp, we identify two additional sequences that localize resulting in the consensus CGCVTGCG. We have grouped several C & G rich 8-mers into this TFBS group but these 8-mers may represent binding sites for other TFs.
E-Box is found in 1.5% of promoters. The palindromic 8-mer TCACGTGA and the related 8-mer, CCACGTGA, localize in proximal promoters. This sequence contains a CpG and methylation could affect DNA binding. These sequences are bound by the USF family of dimeric B-HLH-ZIP proteins [36, 37]. The core of this sequence is the E box sequence 6-mer CANNTG that is bound by B-HLH proteins [38]. Varying each base pair in this consensus does not identify additional DNA sequences that cluster. Keeping one half of the palindrome constant and varying the other half (NNNNGTGA) does not identify additional DNA sequences that localize. This is one of the two sequences that localize in both human and Drosophila promoters (the other is the TATA element). There are over 100 B-HLH-ZIP proteins and many are known to heterodimerize, e.g. E12 and MyoD heterodimerize and bind the E-Box sequence. A more comprehensive examination of the DNA binding of heterodimers using new comprehensive techniques is an exciting issue to examine.
CRE is found in 2.4% of promoters. The palindromic 8-mer TGACGTCA sequence is known as the cAMP responsive element (CRE) [39] [40, 41]. The CRE is bound by a variety of B-ZIP proteins homodimers including CREB, ATFl, and Oasis and by heterodimers including FOS|UN and ATF2|JUN [42]. CpG methylation attenuated CREB binding to the CRE [43] but less is known about how CpG methyation affects the binding of other B-ZIP proteins to the CRE. We varied each base of the CRE TFBS and identified the TGATGTCA sequence that localizes in promoters. This sequence has the CG in the CRE changed to a TG as would be expected if the methyl CpG deaminates to TG. Thus this sequence cannot be regulated by CpG methylation. We identified an additional sequence that clusters when we keep one half of the palindrome constant and let the second half vary (NNNNGTCA). This sequence is TTGCGTAC that contains C/EBP and CREB half sites and can be bound by a C/EBP|ATF4 [44] or C/EBP|ATF2 heterodimer [45]. Twelve 8-mers contain the 5 bp sequence GTCAC which is observed in both the CRE and E-Box TFBSs. It could be that there is a competition for a B-ZIP or a B-HLH-ZIP protein to bind this sequence.
10.6.2. Additional DNA Sequences that Localize in Proximal Promoters
The analysis presented here highlights what can be gleaned from an examination of DNA sequences that preferentially localize in all promoters. Presently, we are examining subsets of promoters with similar properties to identify additional sequences that localize in proximal promoters. For example, when we examine the E2F binding site (TTTCGCG), a sequence known to localize in promoters of cell cycle genes, it does not appear when we examine all promoters but does when we examine promoters that are well bound by RNA polymerase II. This strategy will allow one to identify more DNA sequences in proximal promoters with biological function.
10.7. Conclusion
Ultimately, gene expression is controlled by the DNA sequence of the genome. It has been very challenging to unravel this code because of the difficulty of identifying the DNA sequences that are functional TFBSs. The analysis of the localization of DNA sequences in promoters has allowed us to begin to define DNA sequences that are important in regulating gene expression. As we lê more about the sequences that occur in the promoters of different organisms, we will be able to observe the changes that have occurred between humans and Drosophila. Is ETS a more ancient sequence than the CRE? The answer to these types of questions will give us insight into the wiring hierarchy that has occurred as promoters evolve in metazoans.
References
- 1.Ohler U, Liao GC, Niemann H, Rubin GM (2002) Computational analysis of core promoters in the Drosophila genome. Genome Biol 3:RESEARCH0087 [DOI] [PMC free article] [PubMed] [Google Scholar]
- 2.FitzGerald PC, Shlyakhtenko A, Mir AA, Vinson C (2004) Clustering of DNA sequences in human promoters. Genome Res 14:1562–1574 [DOI] [PMC free article] [PubMed] [Google Scholar]
- 3.Fitzgerald PC, Sturgill D, Shyakhtenko A, Oliver B, Vinson C (2006) Comparative genomics of Drosophila and human core promoters. Genome Biol 7:R53. [DOI] [PMC free article] [PubMed] [Google Scholar]
- 4.Marino-Ramirez L, Spouge JL, Kanga GC, Landsman D (2004) Statistical analysis of over-represented words in human promoter sequences. Nucleic Acids Res 32:949–958 [DOI] [PMC free article] [PubMed] [Google Scholar]
- 5.Bina M, et al. (2004) Exploring the characteristics of sequence elements in proximal promoters of human genes. Genomics 84:929–940 [DOI] [PubMed] [Google Scholar]
- 6.Bina M, et al. (2009) Discovering sequences with potential regulatory characteristics. Genomics 93:314–322 [DOI] [PubMed] [Google Scholar]
- 7.Suzuki Y, Yamashita R, Sugano S, Nakai K (2004) DBTSS, DataBase of Transcriptional Start Sites: progress report 2004. Nucleic Acids Res 32:D78–81 [DOI] [PMC free article] [PubMed] [Google Scholar]
- 8.Zhang MQ (1998) A discrimination study of human core-promoters. Pac Symp Biocomput 3:240–251 [PubMed] [Google Scholar]
- 9.Bird AP (1986) CpG-rich islands and the function of DNA methylation. Nature 321:209–213 [DOI] [PubMed] [Google Scholar]
- 10.Gardiner-Garden M, Frommer M (1987) CpG islands in vertebrate genomes. J Mol Biol 196:261–282 [DOI] [PubMed] [Google Scholar]
- 11.Bird A (2002) DNA methylation patterns and epigenetic memory. Genes Dev 16:6–21 [DOI] [PubMed] [Google Scholar]
- 12.Rozenberg JM, et al. (2008) All and only CpG containing sequences are enriched in promoters abundantly bound by RNA polymerase II in multiple tissues. BMC Genomics 9:67. [DOI] [PMC free article] [PubMed] [Google Scholar]
- 13.Jones PA, Baylin SB (2007) The epigenomics of cancer. Cell 128:683–692 [DOI] [PMC free article] [PubMed] [Google Scholar]
- 14.Eckhardt F, et al. (2006) DNA methylation profiling of human chromosomes 6, 20 and 22. Nat Genet 38:1378–1385 [DOI] [PMC free article] [PubMed] [Google Scholar]
- 15.Weber M, et al. (2007) Distribution, silencing potential and evolutionary impact of promoter DNA methylation in the human genome. Nat Genet 39:457–466 [DOI] [PubMed] [Google Scholar]
- 16.Mito Y, Henikoff JG, Henikoff S (2005) Genome-scale profiling of histone H3.3 replacement patterns. Nat Genet 37:1090–1097 [DOI] [PubMed] [Google Scholar]
- 17.Yuan GC, et al. (2005) Genome-scale identification of nucleosome positions in S. cerevisiae. Science 309:626–630 [DOI] [PubMed] [Google Scholar]
- 18.Tillo D, Hughes TR (2009) G+C content dominates intrinsic nucleosome occupancy. BMC Bioinformatics 10:442. [DOI] [PMC free article] [PubMed] [Google Scholar]
- 19.Tillo D, et al. (2010) High nucleosome occupancy is encoded at human regulatory sequences. PLoS One 5:9129. [DOI] [PMC free article] [PubMed] [Google Scholar]
- 20.Polavarapu N, Marino-Ramirez L, Landsman D, McDonald JF, Jordan IK (2008) Evolutionary rates and patterns for human transcription factor binding sites derived from repetitive DNA. BMC Genornics 9:226. [DOI] [PMC free article] [PubMed] [Google Scholar]
- 21.Weirauch MT, Hughes TR (2010) Dramatic changes in transcription factor binding over evolutionary time. Genome Biol 11:122. [DOI] [PMC free article] [PubMed] [Google Scholar]
- 22.Pavletich NP, Pabo CO (1991) Zinc finger-DNA recognition: crystal structure of a Zif268-DNA complex at 2.1 A. Science 252:809–817 [DOI] [PubMed] [Google Scholar]
- 23.Dynan WS, Tjian R (1985) Control of eukaryotic messenger RNA synthesis by sequence-specific DNA-binding proteins. Nature 316:774–778 [DOI] [PubMed] [Google Scholar]
- 24.Sinha S, Maity SN, Lu J, de Crombrugghe B (1995) Recombinant rat CBF-C, the third subunit of CBF/NFY, allows formation of a protein-DNA complex with CBF-A and CBF-B and with yeast HAP2 and HAP3. Proc Natl Acad Sci U S A 92:1624–1628 [DOI] [PMC free article] [PubMed] [Google Scholar]
- 25.Sharrocks AD (2001) The ETS-domain transcription factor family. Nat Rev Mol Cell Biol 2:827–837 [DOI] [PubMed] [Google Scholar]
- 26.Graves BJ, Petersen JM (1998) Specificity within the ets family of transcription factors. Adv Cancer Res 75:1–55 [DOI] [PubMed] [Google Scholar]
- 27.Brown TA, McKnight SL (1992) Specificities of protein–protein and protein–DNA interaction of GABP alpha and two newly defined ets-related proteins. Genes Dev 6:2502–2512 [DOI] [PubMed] [Google Scholar]
- 28.Wei GH, et al. (2010) Genome-wide analysis of ETS-family DNA-binding in vitro and in vivo. Embo J 29:2147–2160 [DOI] [PMC free article] [PubMed] [Google Scholar]
- 29.Jolma A, et al. Multiplexed massively parallel SELEX for characterization of human transcription factor binding specificities. Genome Res 20:861–873 [DOI] [PMC free article] [PubMed] [Google Scholar]
- 30.Kim Y, Geiger JH, Hahn S, Sigler PB (1993) Crystal structure of a yeast TBP/TATA-box complex. Nature 365:512–520 [DOI] [PubMed] [Google Scholar]
- 31.Geiger JH, Hahn S, Lee S, Sigler PB (1996) Crystal structure of the yeast TFIIA/TBP/DNA complex. Science 272:830–836 [DOI] [PubMed] [Google Scholar]
- 32.Kim TH, et al. (2005) A high-resolution map of active promoters in the human genome. Nature 436:876–880 [DOI] [PMC free article] [PubMed] [Google Scholar]
- 33.Perry RP (2005) The architecture of mammalian ribosomal protein promoters. BMC Evol Biol 5:15. [DOI] [PMC free article] [PubMed] [Google Scholar]
- 34.Kim J, Kim J (2009) YY1’s longer DNA-binding motifs. Genomics 93:152–158 [DOI] [PMC free article] [PubMed] [Google Scholar]
- 35.Scarpulla RC (2006) Nuclear control of respiratory gene expression in mammalian cells. J Cell Biochem 97:673–683 [DOI] [PubMed] [Google Scholar]
- 36.Bendall AJ, Molloy PL (1994) Base preferences for DNA binding by the bHLH-Zip protein USF: effects of MgCl2 on specificity and comparison with binding of Myc family members. Nucleic Acids Res 22:2801–2810 [DOI] [PMC free article] [PubMed] [Google Scholar]
- 37.Boyd KE, Farnham PJ (1999) Coexamination of site-specific transcription factor binding and promoter activity in living cells. Mol Cell Biol 19:8393–8399 [DOI] [PMC free article] [PubMed] [Google Scholar]
- 38.Ferre-D’Amare AR, Prendergast GC, Ziff EB, Burley SK (1993) Recognition by Max of its cognate DNA through a dimeric b/HLH/Z domain. Nature 363:38–45 [DOI] [PubMed] [Google Scholar]
- 39.Montminy M (1997) Transcriptional regulation by cyclic AMP. Annu Rev Biochem 66: 807–822 [DOI] [PubMed] [Google Scholar]
- 40.Shaywitz AJ, Greenberg ME (1999) CREB: a stimulus-induced transcription factor activated by a diverse array of extracellular signals. Annu Rev Biochem 68:821–861 [DOI] [PubMed] [Google Scholar]
- 41.Mayr B, Montminy M (2001) Transcriptional regulation by the phosphorylation-dependent factor CREB. Nat Rev Mol Cell Biol 2:599–609 [DOI] [PubMed] [Google Scholar]
- 42.Vinson C, et al. (2002) Classification of human B-ZIP proteins based on dimerization properties. Mol Cell Biol 22:6321–6335 [DOI] [PMC free article] [PubMed] [Google Scholar]
- 43.Iguchi-Ariga SM, Schaffner W (1989) CpG methylation of the cAMP-responsive enhancer/promoter sequence TGACGTCA abolishes specific factor binding as well as transcriptional activation. Genes Dev 3:612–619 [DOI] [PubMed] [Google Scholar]
- 44.Vinson CR, Hai T, Boyd SM (1993) Dimerization specificity of the leucine zipper-containing bZIP motif on DNA binding: prediction and rational design. Genes Dev 7:1047–1058 [DOI] [PubMed] [Google Scholar]
- 45.Shuman JD, Cheong J, Coligan JE (1997) ATF-2 and C/EBPalpha can form a heterodimeric DNA binding complex in vitro. Functional implications for transcriptional regulation. J Biol Chem 272:12793–12800 [DOI] [PubMed] [Google Scholar]
- 46.Schumacher MA, Goodman RH, Brennan RG (2000) The structure of a CREB bZIP.somatostatin CRE complex reveals the basis for selective dimerization and divalent cation-enhanced DNA binding. J Biol Chem 275:35242–35247 [DOI] [PubMed] [Google Scholar]