

Abstract
Immune activation plays an important role in the pathogenesis of HIV disease. Although the causes are not fully understood, the forces that lead to immune dysfunction differ for CD4 and CD8 T cells. In this study, we report that the molecular pathways that drive immune activation during chronic HIV infection are influenced by differences in the homeostatic regulation of the CD4 and CD8 T cell pools. Proliferation of CD4 T cells is controlled more tightly by CD4 T cell numbers than is CD8 T cell proliferation. This difference reflects the importance of maintaining a polyclonal CD4 T cell pool in host surveillance. Both pools of T cells were found to be driven by viral load and its associated state of inflammation. In the setting of HIV-induced lymphopenia, naive CD4 T cells were recruited mainly into the proliferating pool in response to CD4 T cell depletion, whereas naive CD8 T cell proliferation was driven mainly by levels of HIV RNA. RNA analysis revealed increased expression of genes associated with type I IFN and common γ chain cytokine signaling in CD4 T cell subsets and only type I IFN-associated genes in CD8 T cell subsets. In vitro studies demonstrated enhanced STAT1 phosphorylation in response to IFN-α and increased expression of the IFNAR1 transcripts in naive and memory CD4 T cells compared with that observed in CD8 T cells. CD4 T cell subsets also showed enhanced STAT1 phosphorylation in response to exogenous IL-7.
Human immunodeficiency virus infection is characterized by CD4 T cell depletion, CD8 T cell expansion, and chronic immune activation that leads to immune dysfunction. The mechanism(s) of HIV-induced immune activation are not completely understood. The dynamics of CD4 and CD8 T cells are altered in many ways during HIV infection. Although both show evidence of increased proliferation and preferential loss of the naive subset, there is depletion of CD4 T cells and expansion of CD8 T cells (1–5). Distinct pathways differentially influence proliferation of CD4 and CD8 T cells in patients with HIV infection. Proliferation of CD4 T cells is driven by a combination of the homeostatic response to CD4 T cell depletion (CD4 T cell counts) and viral load (HIV RNA levels). In contrast, CD8 T cell proliferation is driven mainly by HIV RNA levels (6).
T cell homeostasis is a mechanism in which the number of T cells is regulated throughout life. Slow cycling of T cells in the periphery occurs in immunocompetent hosts to maintain the T cell repertoire (7). In lymphopenic bone marrow transplant recipients, homeostatic proliferation leads to an accumulation of cells with a highly activated memory phenotype (8). During untreated HIV infection, the homeostatic response to CD4 T cell depletion occurs in an Ag-rich inflammatory environment. Together these forces contribute to increased proliferation in both CD4 and CD8 T cells (6). Complete CD4 T cell reconstitution after antiretroviral therapy (ART) is a slow process that typically requires many years and depends on the CD4 T cell number prior to therapy (9–11). In contrast, CD8 T cell numbers are already expanded, and the CD8 T cell pool does not seem to be influenced by the homeostatic forces associated with CD4 T cell depletion (6).
T cell homeostasis is mediated by homeostatic cytokines, such as IL-7, that belong to the common γ chain (γc) cytokine family (IL-2, IL-4, IL-7, IL-9, IL-15, and IL-21) and are defined by their receptors sharing the cytokine signaling γc. IL-7 signals through a heterodimer receptor composed of IL-7Rα and γc (12). One can attempt to determine the in vivo exposure to these cytokines by looking for evidence of signaling in these downstream pathways. For example, the IL-7R complex signals through JAK1 and JAK3, leading to the phosphorylation of STAT1, STAT3, and STAT5 (13–15).
During HIV infection, HIV replication leads to activation of the innate and adaptive immune systems, generating an inflammatory environment associated with the induction of type I IFN (16). The potential role of type I IFN in HIV pathogenesis and treatment has been studied since the beginning of the HIV epidemic (17). Chronic exposure to type I IFN may have detrimental consequences on T cell homeostasis and survival (18–20), whereas exogenous administration may lead to reductions of Kaposi sarcoma and HIV levels in some patients with high CD4 T cell counts (21). In Sooty mangabeys and African green monkeys (natural hosts of SIV infection), acute SIV infection leads to a robust type I IFN response that is downregulated after 28 d postinfection. In these animals, there are high levels of viremia without signs of immune activation. In contrast, SIV-infected rhesus macaques show a sustained type I IFN response in the chronic phase of SIV infection and develop a similar disease to humans (22, 23). Although type I IFNs exhibit antiviral effects, they also can inhibit thymopoiesis and B cell development (24) and can induce proliferation and exhaustion of hematopoietic stem cells (25). One is able to determine whether IFN-α has played a role in cell activation in vivo by looking for expression of type I IFN-associated genes, such as 2′,5′-oligoadenylate synthetase (OAS), as well as IFN-associated protein modification, such as phosphorylation of cytoplasmic STAT1, STAT2, and STAT3 (14).
In the current study, to gain a better understanding of the mechanisms of immune activation during HIV infection, we have examined how the homeostatic response to CD4 T cell depletion (reflected in CD4 counts) and the inflammatory response to HIV infection (reflected in HIV RNA levels) affect CD4 and CD8 T cell subsets and the possible roles of two cytokines (IL-7 and IFN-α) associated with these environments.
Materials and Methods
Patients and healthy volunteers
HIV-infected patients were studied in National Institutes of Health (NIH) intramural Institutional Review Board-approved HIV clinical research studies, and healthy volunteers were obtained through the NIH Blood Bank. The majority of the patients studied had chronic HIV infection.
For the ex vivo 5-ethynyl-2′-deoxyuridine (EdU) studies (Tables I, II), the cohort of patients with <50 copies/ml (n = 7) had a median CD4 T cell count of 304 (256–525) cells/μl and a median CD8 count of 602 (305–1023) cells/μl. (Here and throughout the article, values in parentheses represent interquartile ranges.) In this cohort of patients, a single-copy RNA assay was performed to determine HIV RNA viral load. The median HIV RNA viral load was 0.5 (0.3–11.10) copies/ml. The cohort of patients with >50 copies/ml (n = 13) had a median CD4 count of 280 (151–459) cells/μl and a median CD8 T cell count of 791 (518–1237) cells/μl. The median HIV RNA viral load in these subjects was 9196 (428–38,366) copies/ml. Healthy controls obtained through the NIH Blood Bank for the ex vivo EdU experiments (n = 22) had a median CD4 count of 381 (322–549) cells/μl and a median CD8 count of 217 (140–309) cells/μl. Median age of the healthy controls for the EdU studies was 48 (39–55) years old. Eighteen percent of the donors were female.
Table I.
CD4 and CD8 T cell subset proliferation in patients with HIV infection and healthy volunteers
| CD4 Total | CD4 Naive | CD4 Memory | CD4 Effector/Memory | CD4 TEM | CD8 Total | CD8 Naive | CD8 Memory | CD8 Effector/Memory | CD8 TEM | |
|---|---|---|---|---|---|---|---|---|---|---|
| CD4 and CD8 T cell subsetsa (%) | ||||||||||
| Median | 42 | 13.2 | 50.5 | 7.43 | 0.011 | 55.9 | 25.5 | 26.2 | 15.6 | 6.41 |
| 1st to 3rd quartile | 19.30–46.80 | 11.40–17.30 | 42.90–66.80 | 6.92–11.60 | 0.002–6.730 | 52.00–79.70 | 10.70–37.60 | 12.40–50.80 | 8.20–22.10 | 6.09–14.40 |
| Cycling T cells within compartment (%) | ||||||||||
| Median | 0.052 | 0.0085 | 0.039 | 0.1 | 0.28 | 0.043 | 0.013 | 0.046 | 0.088 | 0.035 |
| 1st to 3rd quartile | 0.035–0.069 | 0.004–0.044 | 0.018–0.045 | 0.075–0.230 | 0.048–3.850 | 0.016–0.110 | 0.005–0.037 | 0.009–0.057 | 0.034–0.160 | 0.026–0.054 |
| Total cells cycling within compartment (cells/μl) | ||||||||||
| Median | 0.133 | 0.005 | 0.059 | 0.029 | 0.002 | 0.163 | 0.011 | 0.042 | 0.046 | 0.022 |
| 1st to 3rd quartile | 0.120–0.465 | 0.001–0.008 | 0.038–0.124 | 0.017–0.144 | 0.000–0.009 | 0.073–0.852 | 0.005–0.025 | 0.013–0.055 | 0.019–0.267 | 0.003–0.048 |
| CD4 and CD8 T cell subsetsb (%) | ||||||||||
| Median | 26.6 | 18 | 45.6 | 13.7 | 0.083 | 71 | 16 | 25.4 | 13.9 | 14.2 |
| 1st to 3rd quartile | 16.45–40.35 | 9.87–29.10 | 33.30–53.50 | 8.78–22.85 | 0.039–0.570 | 58.50–82.70 | 9.62–31.45 | 16.95–33.45 | 10.23–22.75 | 8.10–24.05 |
| Cycling cells within compartment (%) | ||||||||||
| Median | 0.31 | 0.047 | 0.2 | 0.74 | 0.58 | 0.17 | 0.038 | 0.23 | 0.36 | 0.14 |
| 1st to 3rd quartile | 0.195–0.780 | 0.025–0.255 | 0.115–0.425 | 0.485–1.87 | 0.087–9.61 | 0.125–0.505 | 0.022–0.130 | 0.130–0.560 | 0.240–0585 | 0.079–0.260 |
| Total cells cycling within compartment (cells/μl) | ||||||||||
| Median | 1.017 | 0.026 | 0.236 | 0.249 | 0.003 | 1.42 | 0.059 | 0.503 | 0.334 | 0.167 |
| 1st to 3rd quartile | 0.619–1.361 | 0.012–0.049 | 0.159–0.354 | 0.211–0.444 | 0.001–0.017 | 1.130–2.701 | 0.040–0.100 | 0.264–0.876 | 0.190–0.698 | 0.042–0.397 |
| CD4 and CD8 T cell subsetsc (%) | ||||||||||
| Median | 60.15 | 15.9 | 40.74 | 10.4 | 0.24 | 21.5 | 21.5 | 21.85 | 5.61 | 5.01 |
| 1st to 3rd quartile | 48.60–69.75 | 9.04–21.80 | 35.35–46.45 | 7.70–15.95 | 0.02–0.99 | 14.73–26.13 | 12.83–35.23 | 11.43–28.35 | 3.68–7.72 | 1.33–16.83 |
| Cycling cells within compartment (%) | ||||||||||
| Median | 0.053 | 0.009 | 0.027 | 0.115 | 0.062 | 0.024 | 0.005 | 0.0185 | 0.033 | 0.021 |
| 1st to 3rd quartile | 0.02–0.12 | 0.004–0.017 | 0.013–0.054 | 0.059–0.277 | 0.030–0.675 | 0.012–0.036 | 0.002–0.013 | 0.011–0.038 | 0.016–0.107 | 0.011–0.033 |
| Total cells cycling within compartment (cells/μl) | ||||||||||
| Median | 0.201 | 0.004 | 0.051 | 0.05 | 0.001 | 0.048 | 0.003 | 0.01 | 0.0054 | 0.002 |
| 1st to 3rd quartile | 0.122–0.465 | 0.002–0.012 | 0.025–0.099 | 0.019–0.107 | 0.000–0.004 | 0.030–0.089 | 0.001–0.006 | 0.003–0.016 | 0.002–0.010 | 0.000–0.010 |
Percentage and absolute number of cycling CD4 and CD8 T cell subsets in HIV and healthy controls. The percentages of total CD4 and CD8 T cells were obtained by gating on CD3+CD4+ T cells and for CD8 T cells CD3+CD4− T cells. Percentages of each subset were obtained using CD45RA and CD27 to define naive, memory, effector/memory, and TEM T cells. The absolute numbers of cycling T cell within each compartment were calculated from CD4 and CD8 T cell counts.
Less than 50 copies/ml; n = 7.
More than 50 copies/ml; n = 13.
Healthy volunteers; n = 22.
Table II.
Relationship between rates of proliferating CD4 T cell and CD8 T cell subsets with CD4 T cell counts and viral load VL, viral load.
| Model Includes | Log CD4 Coefficient | p Value | Log VL Coefficient | p Value | R2 | |
|---|---|---|---|---|---|---|
| CD4 T cell subsets | ||||||
| Total | Log CD4 | −1.141 | 0.01 | NA | NA | 0.317 |
| Log VL | NA | NA | 0.169 | 0.005 | 0.357 | |
| Both | −1.063 | 0.002 | 0.159 | 0.001 | 0.631 | |
| Naive | Log CD4 | −1.717 | 0.006 | NA | NA | 0.35 |
| Log VL | NA | NA | 0.139 | 0.139 | 0.118 | |
| Both | −1.657 | 0.006 | 0.123 | 0.112 | 0.442 | |
| Memory | Log CD4 | −1.127 | 0.015 | NA | NA | 0.287 |
| Log VL | NA | NA | 0.173 | 0.006 | 0.349 | |
| Both | −1.047 | 0.005 | 0.163 | 0.002 | 0.596 | |
| Effector/memory | Log CD4 | −1.015 | 0.032 | NA | NA | 0.23 |
| Log VL | NA | NA | 0.194 | 0.002 | 0.434 | |
| Both | −0.924 | 0.009 | 0.186 | 0.001 | 0.624 | |
| CD8 T Cell Subsets | ||||||
| Total | Log CD4 | −0.434 | 0.348 | NA | NA | 0.049 |
| Log VL | NA | NA | 0.177 | 0.002 | 0.421 | |
| Both | −0.349 | 0.335 | 0.174 | 0.003 | 0.453 | |
| Naive | Log CD4 | −0.458 | 0.424 | NA | NA | 0.036 |
| Log VL | NA | NA | 0.16 | 0.034 | 0.226 | |
| Both | −0.381 | 0.464 | 0.157 | 0.041 | 0.251 | |
| Memory | Log CD4 | −0.669 | 0.238 | NA | NA | 0.076 |
| Log VL | NA | NA | 0.244 | <0.001 | 0.525 | |
| Both | −0.552 | 0.167 | 0.239 | <0.001 | 0.577 | |
| TEM | Log CD4 | −0.29 | 0.486 | NA | NA | 0.027 |
| Log VL | NA | NA | 0.163 | 0.001 | 0.444 | |
| Both | −0.211 | 0.51 | 0.161 | 0.002 | 0.458 | |
| Effector/memory | Log CD4 | −0.354 | 0.339 | NA | NA | 0.051 |
| Log VL | NA | NA | 0.115 | 0.018 | 0.274 | |
| Both | −0.3 | 0.358 | 0.112 | 0.022 | 0.31 | |
Ex vivo BrdU incorporation was performed in 152 healthy controls (Table III) obtained from the NIH Blood Bank to study correlations between T cell proliferation and T cell counts. The median CD4 and CD8 T cell counts were 522 (377–869) cells/μl and 267 (201–423) cells/μl, respectively. The median age was 55 (38–54) years old. Eighteen percent of the subjects were female.
Table III.
Relationship between proliferating CD4 and CD8 T cells with CD4 and CD8 T cell counts in healthy volunteers
| Healthy Controls | ||||||
|---|---|---|---|---|---|---|
| Log of % T Cell Cycling | CD8 Slope | p Value | R2 | CD4 Slope | p Value | R2 |
| CD4 | −0.498 | <0.0001 | 0.161 | −0.666 | <0.0001 | 0.303 |
| CD8 | −0.48 | <0.0001 | 0.124 | −0.39 | 0.0003 | 0.086 |
For in vitro stimulation with recombinant human (rh) IL-7 and rhIFN-.α (Fig. 4), PBMCs from healthy controls and HIV-infected patients were isolated by Ficoll gradient centrifugation and frozen until use. PBMCs from HIV-infected individuals (n = 10) had a median CD4 count of 126 (95–255) cells/μl, median CD8 count of 1052 (710–1604) cells/μl and median HIV RNA viremia of 105,173 (61,723–192,758) copies/ml. Patients with suppressed viremia on ART to <50 copies/ml for at least 6 mo (n = 11) had a median CD4 count of 143 (113–187) cells/μl and median CD8 count of 658 (371–850) cells/μl.
FIGURE 4.

STAT1 and STAT5 phosphorylation in response to in vitro stimulation with IFN-α, IL-7, and a combination of both cytokines. PBMCs from healthy volunteers (n = 10), HIV-infected individuals with HIV RNA levels of <50 copies/ml (n = 11), and HIV-infected individuals with HIV RNA levels of >30,000 copies/ml (n = 10) were stimulated in vitro with IL-7 (1 ng/ml), IFN-α (100 U/ml), or a combination of both cytokines. Phosphorylation of STAT1 and STAT5 in naive (CD45RA+CD27+) (A) and memory (CD45RA+CD27+) (B) T cell subsets was analyzed by multicolor flow cytometry in CD4 and CD8 T cells. The Mann-Whitney U test was performed for the comparison between groups.
For the JAK/STAT signaling microarray studies, CD4 or CD8 T cell subsets were obtained from seven patients with HIV infection. In the CD4 T cell subset analysis, patients had a median CD4 T cell count of 131 (127–277) cells/μl, a median CD8 count of 1169 (874–1488) cells/μl and a median viral load of 14,047 (2070–28,253) copies/ml. For the CD8 T cell subset analysis, patients had a median CD4 count of 209 (140–279) cells/μl, a median CD8 count of 748 (360–918) cells/μl, and a median viral load of 41,977 (8069–95,302) copies/ml. Healthy controls were obtained through the NIH Blood Bank for the control CD4 (n = 4) and CD8 (n = 4) T cell subsets.
All of the patients enrolled in these studies were drawn from the patient population seen at the NIH Clinical Research Center as part of Institutional Review Board-reviewed and approved protocols. They were receiving a variety of antiretroviral medications including nucleos(t)ide analogues, nonnucleoside reverse transcriptase inhibitors, protease inhibitors, and integrase inhibitors. The specific details of therapy are given in Supplemental Table II.
Ex vivo EdU and BrdU labeling
PBMCs isolated from healthy controls and HIV-infected individuals by Ficoll-Hypaque density separation were cultured at a concentration of 106 cells/ml in RPMI 1640 containing 10% autologous serum for 6 h in the presence of 15 mM of the thymidine analogue EdU (Invitrogen). After harvest and washes with wash buffer (1% BSA/PBS), cells were fixed at room temperature with 4% paraformaldehyde (Electron Microscopy Sciences) for 15 min at a concentration of 10 × 106 cells/ml. Cells were washed subsequently, resuspended in PBS, and stored overnight at 4°C. After being permeabilized the next day with Perm/Wash buffer (BD Biosciences), incorporated EdU was labeled covalently with an Alexa Fluor 647 azide dye probe following the manufacturer’s instructions. Cells were washed once with Perm/Wash buffer and twice with 1% BSA/PBS before proceeding to mAb staining.
Ex vivo BrdU labeling of whole blood was performed as described previously (4).
Flow cytometry
Prior to being stained, all of the samples were incubated for 10 min with human IgG (Sigma-Aldrich, St. Louis, MO) to block potential Fc receptor binding. For EdU proliferation assays, cells were stained for 30 min at 4°C with a mixture of the following mAbs: anti-CD3 AmCyan (BD Biosciences, clone SK7), anti-CD4 PerCP (BD Biosciences, clone SK3), anti-CD27 FITC (BD Biosciences, clone L128), and anti-CD45RA Pacific blue (Invitrogen, clone MEM-56). Activated healthy donor PBMCs were used to compensate for the Alexa Fluor 647 dye by covalent labeling of incorporated EdU. Between 2 × 10⁶ and 5 × 10⁶ total cells were acquired for each sample to capture an adequate number of cycling cell events. The analysis of the T cell subsets was performed using FlowJo. Table I shows the percentages of CD4 and CD8 T cell subsets, the percentages of cycling T cell subsets within the compartment, and the total number of cycling cells within each compartment. Total numbers of CD4 and CD8 T cell subsets were determined by the formula: total cell number of the T cell subsets (cells per microliter) = (percentage of T cell subset × CD4 or CD8 T cell count)/100. The total number of cycling T cell subsets was determined by the formula: total number of cycling T cell subsets (cells per microliter) = (percentage of cycling T cell subset × total cell number of the subset)/100.
In vitro stimulation and flow cytometry
PBMCs from HIV-infected individuals and healthy controls were thawed and rested overnight. Cells were washed and adjusted at a concentration of 2 × 10⁶ cells/ml. Stimulation was performed with previously defined optimal doses of either rhIL-7 (1 ng/ml) or IFN-α (100 U/ml), or a mix of both cytokines, and incubated for 30 min at 37°C and 5% CO2. Stimulation was stopped by fixation with 4% paraformaldehyde followed by a permeabilization step with a 1:1 methanol/acetone mix for 30 min on ice. After three washes, cells were stained for 1 h at room temperature with a mix of anti-CD3 Qdot 605 (Invitrogen, clone UHCT1), anti-CD4 Pacific blue (BD Biosciences, clone RPA-T4), anti-CD45RA PerCP (BD Biosciences, clone 5H9), anti-CD27 FITC (BD Biosciences, clone L128), anti-tyrosine 694-phosphorylated STAT5 Alexa Fluor 647 (BD Biosciences, clone 47), and anti-tyrosine 701-phosphorylated STAT1 Alexa Fluor 488 (Cell Signaling, clone 58D6). Full-minus-one controls were performed in the Alexa Fluor 647 and Alexa Fluor 488 channel for control of compensation spread (26). The samples for both experiments were collected on a BD LSR II using FACSDiva software. Data were analyzed subsequently using FlowJo (Tree Star). The nonparametric Mann-Whitney U test was used for the comparison between groups.
JAK/STAT signaling microarray
CD8+ (n = 4) and CD4+ (n = 4) T cells from HIV-infected patients with HIV RNA viremia of >50 copies/ml and CD8+ (n = 4) and CD4+ (n = 4) T cells from healthy controls were isolated by negative selection (Miltenyi Biotec, Auburn, CA). Cell sorting of the CD4 and CD8 T cell subsets were performed based on surface staining of CD3+CD8+ or CD3+CD4+ and naive CD45RA+CD27+CD127highHLA-DRlow and CD3+CD8+ or CD3+ CD4+ and memory CD45RA−CD27+CD127highHLA-DRlow cell populations. Sorted cell populations were spun down and stored as dry pellets at −80°C. Samples analyzed by transcript levels of genes related to cytokine signaling were determined by the JAK/STAT Signaling Pathway microarray (SABiosciences, Frederick, MD). Briefly, total RNA was harvested from each individual T cell subset from each patient or healthy control, and contaminating DNA was digested with DNase. mRNA was converted to cDNA and loaded onto PCR array plates for quantitative real-time PCR. Quantification of transcript levels was determined by normalizing to five housekeeping genes from each individual sample (deposited to the Gene Expression Omnibus under accession number GSE25456; http://www.ncbi.nlm.nih.gov/geo/query/acc.cgi acc=GSE25456). Relative gene expression levels for each subset were averaged and compared between cell populations from the patient group and healthy controls. Because of the multiple comparisons, only p values ≤0.01 were considered significant.
Statistical analysis
To determine the contributions of CD4 count and viral load to the proliferation of CD4 cells in cross-sectional data, we performed three separate regressions, each using the log percentage of CD4 cells cycling as the dependent variable. The independent variables in the three separate regressions were 1) log CD4 count, 2) log viral load, and 3) log CD4 and log viral load, respectively. We assessed the independent contributions of log CD4 and log viral load by evaluating the p values of the coefficients and whether the R2 value improved markedly when both variables were included. Similar analyses were done on CD8 proliferation.
To determine the longitudinal relationships between proliferation and cell count after ART initiation in longitudinal data, we used a linear mixed model to estimate an average slope while allowing each patient to have his or her own slope and intercept relating proliferation to cell count. We confirmed results using simpler analyses involving weighted combinations of patient-specific slopes. To answer a more focused question of what happened with proliferation during the time of sharp CD4 increase after therapy, we plotted CD4 count versus time and determined when the CD4 count appeared to taper off after an initial increase for each patient. Over that same period of time, we computed the slope of the relationship between log percentage of CD4 cells cycling and time, noting whether this slope was negative or positive. We then used a sign test on the proportion of slopes that were negative. A similar analysis was performed for proliferation over the same time period for CD8 T cells.
For the between-group comparisons of phosphorylation in response to cytokine stimulation (Fig. 4), the nonparametric Mann-Whitney U test was used. We required a more stringent significance level of ≤0.01 for the gene expression comparisons to account for multiplicity. Because the small numbers of participants (four individuals per group) preclude such small p values if a nonparametric test is used, the t test was used for these comparisons.
Results
Proliferation of peripheral T cell subsets in HIV-infected patients and healthy controls
To determine the relative contributions of naive and memory subsets to the overall proliferation of CD4 and CD8 T cell pools, a series of studies were performed using PMBCs from patients with HIV infection (n = 20) and healthy controls (n = 22) spanning a range of CD4 counts (183–503 cells/μl) and HIV RNA levels (<50–71,500 copies/ml in the cohort of HIV-infected patients and a range of CD4 counts (322–549 cells/μl in the cohort of healthy controls.
Spontaneous ex vivo incorporation of the thymidine analog EdU was used to determine the relative contributions of naive (CD45RA+CD27+), memory (CD45RA−CD27+), effector/memory (CD45RA−CD27−), and terminal effector memory (TEM) (CD45RA+CD27−) subsets to the overall proliferation of the CD4 and CD8 T cells (Fig. 1A). Given the previously established relationships between viral load and proliferation rate, patients with HIV RNA levels of <50 copies/ml (n = 7) were analyzed separately from those with HIV RNA levels of >50 copies/ml (n = 13). Both the percentage and the absolute number of proliferating T cells were determined (Table I). The highest rates of turnover were seen within the CD4 pool (Fig. 1B). This was particularly true for the effector/memory and TEM subset in patients with HIV RNA levels >50 copies/ml. In contrast, the highest absolute number of proliferating cells was seen within the CD8 pool. This was especially true in the memory and effector/memory subsets in patients with HIV RNA levels >50 copies/ml. The absolute number of CD8 T cells proliferating was 3.4 times higher in HIV-infected patients with HIV RNA levels <50 copies/ml than that in healthy controls (0.163 and 0.048, p = 0.003). This likely reflects the persistence of active viral replication or high levels of Ag in all of the individuals with HIV infection (Fig. 1B, Table I).
FIGURE 1.
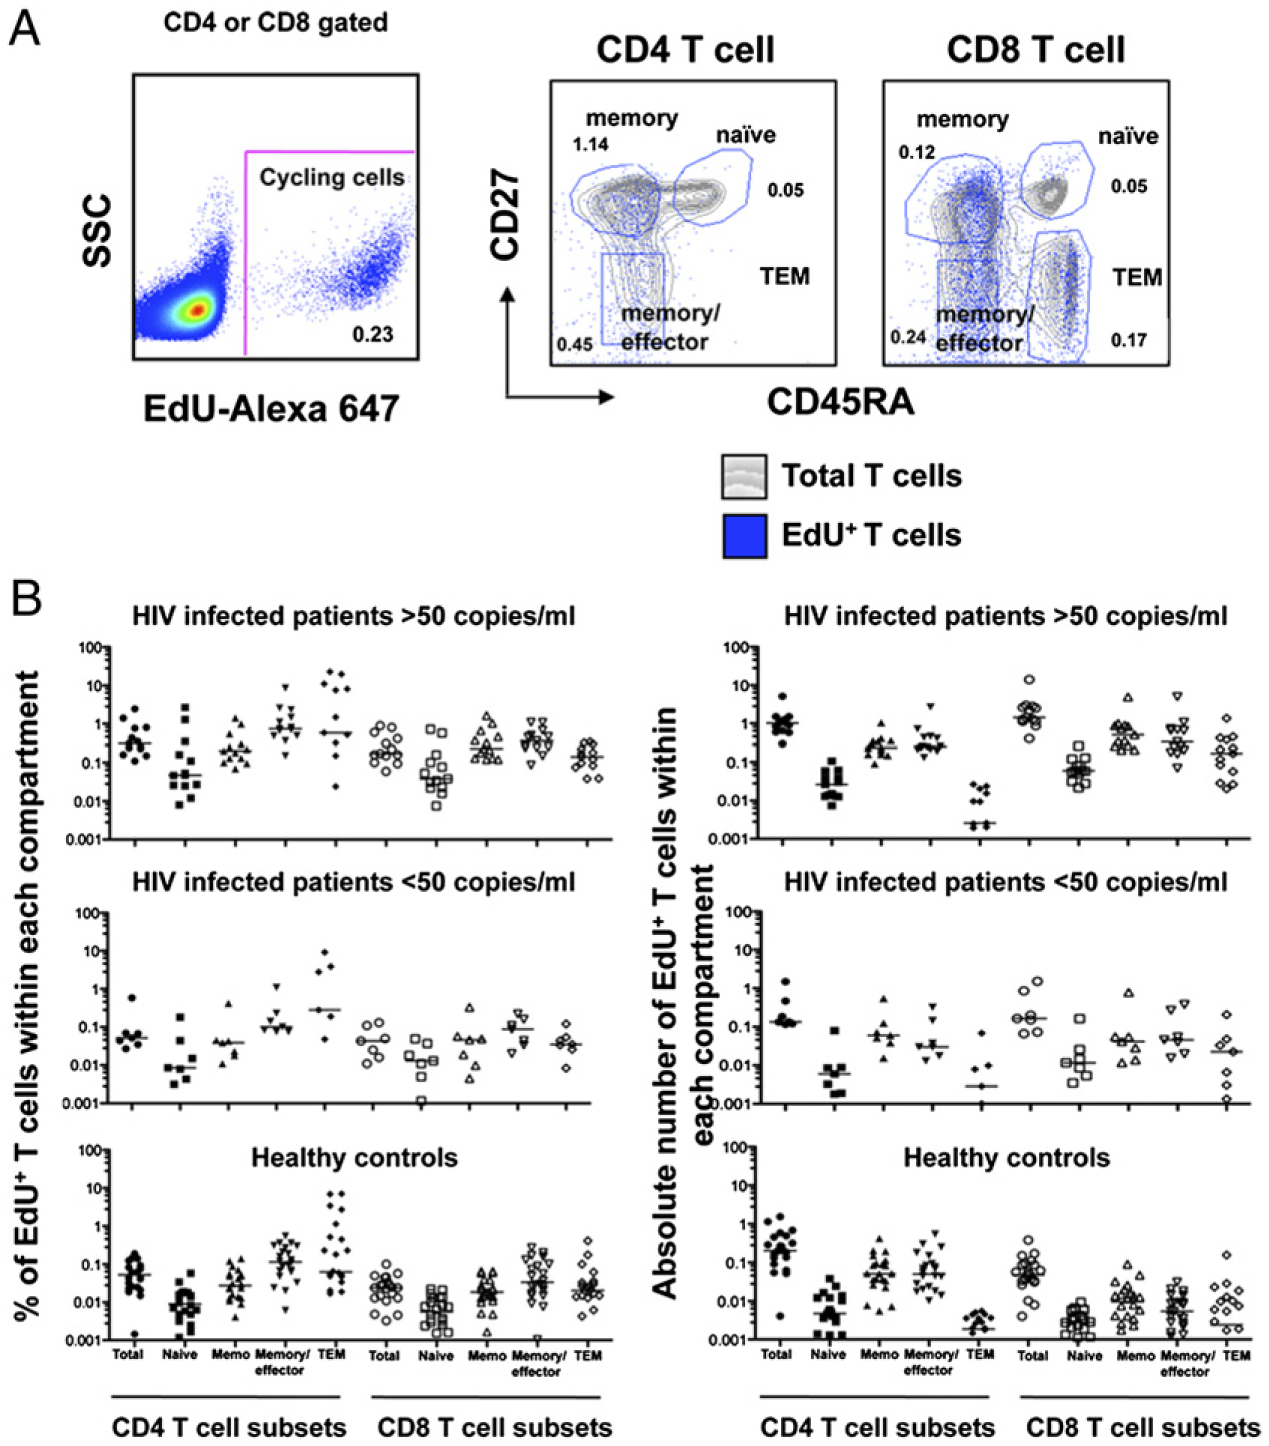
Ex vivo proliferation of CD4 and CD8 T cell subsets determined by EdU incorporation. A, PBMCs from patients were labeled with EdU to measure spontaneous ex vivo proliferation of T cell subsets: naive (CD45RA+CD27+), memory (CD45RA−CD27+), effector/memory (CD45RA−CD27−), and TEM (CD45RA+CD27−). The gray contour plots represent the total population of CD4 or CD8 T cells, and the overlay blue dot plot represents the proliferating population. The percentages indicate the percentages of the cells within each gate that are cycling. B, Percentages and the absolute numbers of proliferating CD4 and CD8 T cell subsets from patients with HIV infection and HIV RNA levels of <50 or >50 copies/ml) (Table I). Bars in the graph represent median values. Actual numbers for the medians are presented in Table I.
CD4 naive phenotype T cells proliferate as part of the homeostatic response to HIV-induced CD4 T cell depletion
To more precisely determine the relative contributions of CD4 depletion and HIV replication to the proliferation of CD4 T cell subsets, we performed a series of regression analyses relating the percentage of CD4 cells cycling (dependent variable) to CD4 count, viral load, or both independent variables after log transforming each variable. For each compartment, the three rows in Table II show the results when the model includes only log CD4, only log viral load, or both log CD4 and log viral load, respectively. As can be seen from Table II, both CD4 depletion and HIV RNA levels drive CD4 T cell proliferation. CD4 T cell depletion was the main driver for the proliferation of naive CD4 T cells. Log CD4 count showed a strong negative correlation with the proliferation of naive CD4 T cells (R2 = 0.350, p = 0.006); the addition of log viral load increased the R2 value by a small and statistically insignificant amount, from 0.350 to 0.442 (p = 0.112). An interesting question is whether it is CD4 T cell depletion in general or naive CD4 T cell depletion in particular that stimulates the proliferation of naive CD4 T cells. In separate univariate regressions, total CD4 count and naive CD4 count were each strongly negatively associated with naive CD4 T cell proliferation (R2 = 0.350, p = 0.006; R2 = 0.32, p = 0.01, respectively). Because CD4 count and naive CD4 count are highly correlated with each other, neither CD4 count nor naive CD4 count was statistically significant when both were included in the model. Therefore, it is difficult to determine which of them is the driving force behind naive CD4 T cell proliferation. CD4 depletion and viral load appeared to play similar roles in driving the proliferation of the memory pool. Both were correlated with the rates of proliferation. A positive association was observed with the HIV RNA levels (R2 = 0.349, p = 0.006), and a negative correlation was observed with the CD4 counts (R2 = 0.287, p = 0.015); the inclusion of both increased the R2 value to 0.596. In contrast, neither CD4 (Table II) nor CD8 (Supplemental Table I) counts appeared to play any significant role in the turnover rates of naive CD8 T cells. HIV RNA level was the major driver of both naive and memory CD8 T cell turnover.
Homeostatic proliferation within the CD4 T cell compartment of healthy controls is more sensitive to changes in CD4 T cell counts than CD8 T cells are sensitive to changes in CD8 T cell counts
Because the weak relationship observed between CD8 T cell counts and proliferation of CD8 T cells in patients with HIV infection could be difficult to ascertain due to an already expanded CD8 T cell compartment, we examined the contributions of CD4 and CD8 T cell counts to the proliferation of CD4 and CD8 T cells in healthy controls (n = 152) utilizing ex vivo BrdU labeling and compared the findings to those in patients with HIV infection (Fig. 2). In healthy controls, there was a weak inverse association (although statistically significant) between CD8 T cell proliferation and either CD8 T cell counts (R2 = 0.124, p < 0.001) or CD4 T cell counts (R2 = 0.086, p <0.001) (Fig. 2A, 2B, Table III). In patients with HIV infection, those associations with CD8 T cell proliferation were not seen (R2 = 0.008, p = 0.705 and R2 = 0.049, p = 0.348 for CD8 and CD4 counts, respectively) (Fig. 2A, 2B). In contrast, there was a similar negative association between CD4 T cell count and CD4 T cell proliferation in both healthy controls (R2 = 0.303, p < 0.001) and HIV-infected individuals (R2 = 0.317, p = 0.010) (Fig. 2C). There was a weak negative association between CD8 T cell counts and proliferating CD4 T cells in healthy controls (Fig. 2D, Table III). These data strongly suggest that the maintenance of T cell numbers is regulated by different mechanisms in CD4 and CD8 T cells. CD4 T cells are sensitive to changes in CD4 T cell count, whereas CD8 T cells appear to be more sensitive to external forces, such as viral infections and the resulting inflammatory environment.
FIGURE 2.
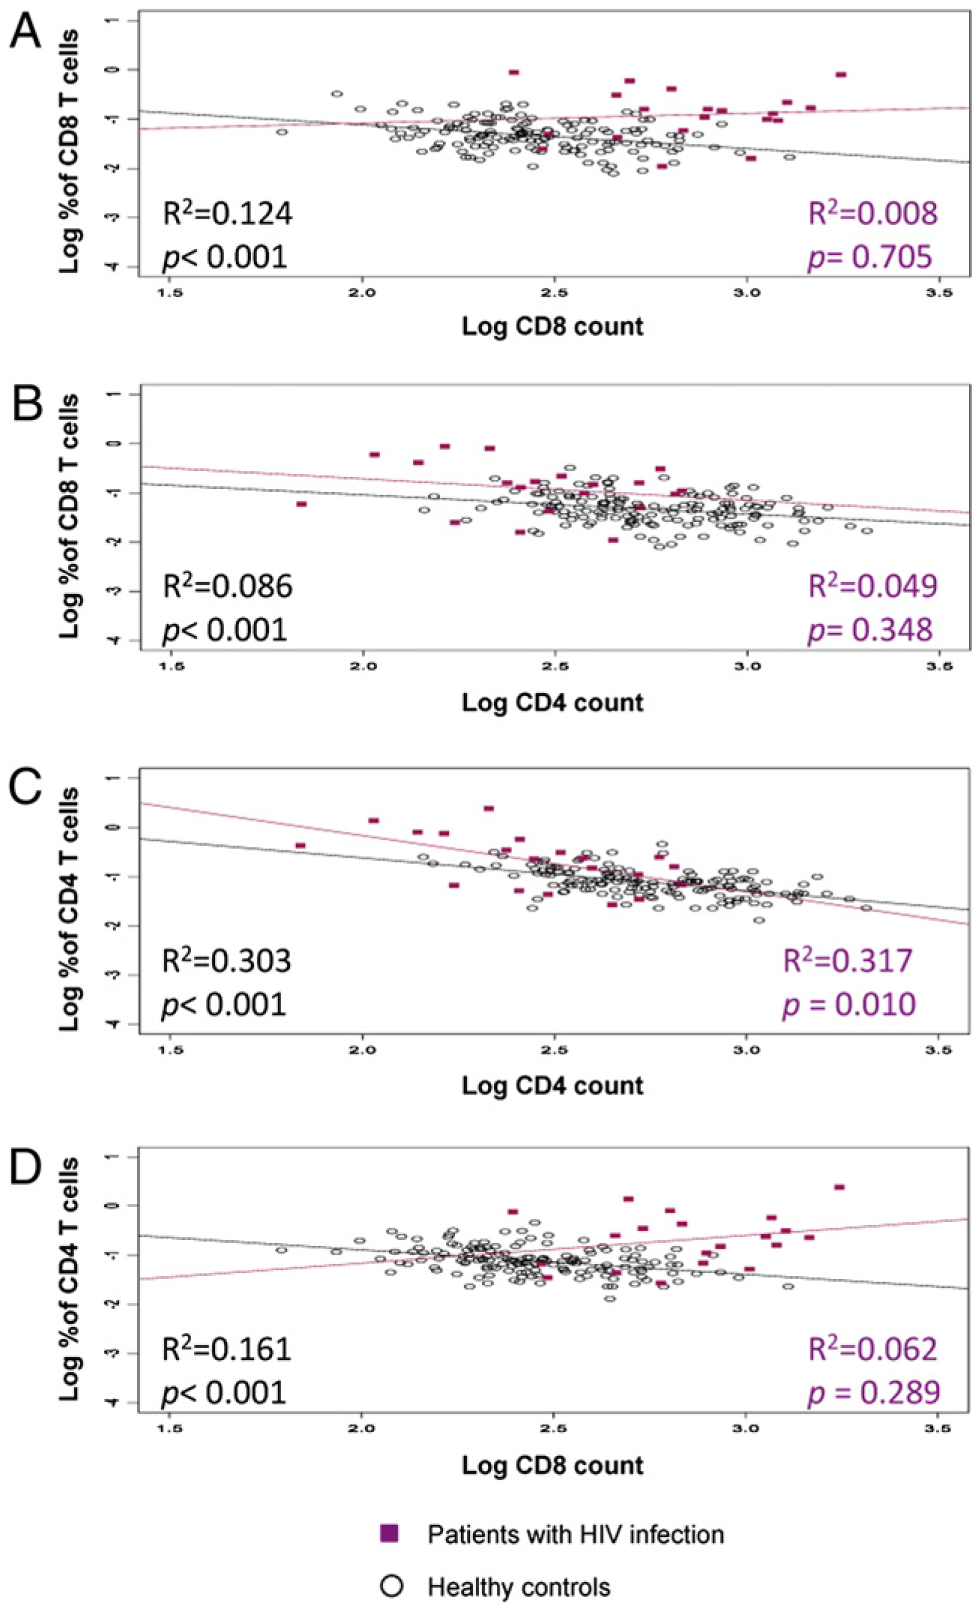
Relationships between CD4 or CD8 proliferating T cells and CD4 or CD8 T cell counts. Ex vivo proliferation of T cells depicted from healthy controls (n = 152, black dots) and HIV-infected individuals (n = 20, red squares). The association between percentage of CD8 T cells proliferating and CD8 T cell counts (A) or CD4 T cell counts (B) and the association of percentage of CD4 T cells proliferating and CD4 T cell counts (C) or CD8 T cell counts (D).
Association between CD4 T cell proliferation and CD4 T cell count recovery during therapy
From the results above, it is clear that the dynamics of CD4 and CD8 T cell turnover are influenced by different mechanisms that are highlighted during HIV infection. To examine this further, we next tested the impact of ARTon CD4 and CD8 T cell proliferation. ART leads to a decrease in viral replication, a reduction in the inflammatory environment, and a reconstitution of CD4 T cell numbers. We analyzed ex vivo BrdU incorporation in 36 patients at multiple time points after starting therapy (Fig. 3) (27). As previously noted by others and ourselves, as the CD4 T cell counts increased, the proportion of CD4 T cells cycling decreased. As the viral load decreased, the percentage of both CD4 and CD8 T cells proliferating fell. Among patients with early CD4 T cell count increases (n = 23), all but one had decreased CD4 T cell proliferation. During the same period among these 23 patients, CD8 T cell counts increased significantly in six patients, whereas CD8 T cell counts significantly decreased in four patients. In the remainder, there was no significant change. Fig. 3A and 3B illustrate these two patterns in two selected patients. The four patients with statistically significant decreases in CD8 T cell count had somewhat higher baseline CD4 T cell counts than the six patients with statistically significant increases in CD8 T cell count (p = 0.067), but it is difficult to draw conclusions with such small numbers (Fig. 3C). By examining proliferation as a function of cell count (ignoring time), we found an inverse relationship between CD4 T cell proliferation and total number of CD4 T cells. The percentage of proliferating CD4 T cells dropped an average of 0.09% for each 100 cell increase in CD4 count (p < 0.001). No such relationship was observed for CD8 T cells.
FIGURE 3.

Changes in CD4 and CD8 T cell counts and proliferation during ART. Ex vivo BrdU labeling at several time points was performed in patients (n = 36) undergoing ART. A and B, Two patients, one with a decrease in CD8 T cell count (A) and one with an increase in CD8 T cell count (B). C, Comparison of patients where CD8 T cell count increased significantly (n = 6) and decreased significantly (n = 4) after ART. Relationships with baseline CD4 and CD8 T cell count and viral load are shown.
In vivo pattern of gene expression in CD4 and CD8 T cell subsets during HIV infection
To attempt to identify the signaling pathways involved in CD4 and CD8 T cell activation in the setting of HIV infection, we focused our attention on differential patterns of gene expression in sorted naive and memory subsets of CD4 and CD8 T cells (n = 4) from each of two groups, healthy controls and patients with HIV infection and HIV RNA levels >50 copies/ml. We used a commercial array of 82 genes known to be involved in cytokine signaling (Materials and Methods, Table IV). Given the multiple comparisons being made, we only focused on those genes where the p value for the comparison was ≤0.01. Compared to cells from healthy volunteers, naive CD4 T cells from patients with HIV RNA levels of >50 copies/ml showed increased expression of genes associated with type I IFN signaling pathways (IFNAR and STAT1) and genes associated with γc cytokine signaling (IL2RG and SOCS1). Similar to naive CD4 T cells, the gene expression profiles of naive CD8 T cells from HIV-infected patients showed increased expression of genes associated with type I IFN signaling (STAT1). In contrast to CD4 T cells, there was downregulation of genes associated with γc cytokine signaling (STAT5B).
Table IV.
Relative fold increased expression in CD4 and CD8 T cell subsets of type I IFN- and γc cytokine-associated genes
| Relative Fold Increase for Naive T Cellsa | ||||
|---|---|---|---|---|
| Naive CD8 | p Value | Naive CD4 | p Value | |
| γc-Cytokine-associated genes | ||||
| BCL2L1 | 1.46 | 0.41 | 1.75 | 0.02 |
| IL2RG | −1.14 | 0.5 | 1.47 | <0.01 |
| JAK1 | −1.42 | 0.02 | 1.22 | 0.14 |
| JAK3 | −1.52 | 0.06 | 1.27 | 0.09 |
| STAT5A | 1.29 | 0.49 | 1.18 | 0.22 |
| STAT5B | −1.49 | 0.01 | 1.19 | 0.53 |
| SOCS1 | 1.34 | 0.46 | 1.98 | <0.01 |
| Relative Fold Increase for Memory CD127high T cellsa | ||||
| Memory CD8 | p Value | Memory CD4 | p Value | |
| BCL2L1 | 2 | 0.07 | 1.73 | <0.01 |
| IL2RG | −1.17 | 0.32 | 1.63 | <0.01 |
| JAK1 | −1.41 | 0.01 | 1.17 | 0.12 |
| JAK3 | 1 | 1 | 1.37 | 0.03 |
| STAT5A | 1.23 | 0.29 | 1.37 | <0.01 |
| STAT5B | 1.33 | 0.57 | 1.62 | 0.02 |
| SOCS1 | 1.62 | 0.17 | 1.89 | 0.03 |
| Relative Fold Increase for Naive T Cellsa | ||||
| Naive CD8 | p Value | Naive CD4 | p Value | |
| Type I IFN-associated genes | ||||
| IFNAR1 | −2.72 | 0.15 | 1.53 | <0.01 |
| ISG15 | 11.2 | 0.05 | 2.07 | 0.1 |
| IRF9 | −1.29 | 0.05 | 1.22 | 0.54 |
| OAS1 | 10.01 | 0.02 | 3.64 | 0.04 |
| STAT1 | 3.56 | 0.01 | 2.48 | 0.01 |
| STAT2 | 1.49 | 0.23 | 1.6 | 0.07 |
| Relative Fold Increase Memory CD127high T Cellsa | ||||
| Memory CD8 | p Value | Memory CD4 | p Value | |
| IFNAR1 | −2.13 | 0.08 | 1.94 | <0.01 |
| ISG15 | 12.44 | 0.01 | 2.57 | 0.09 |
| IRF9 | −1.05 | 0.76 | 1.04 | 0.8 |
| OAS1 | 12.83 | <0.01 | 4.35 | 0.01 |
| STAT1 | 3.84 | <0.01 | −3.92 | 0.57 |
| STAT2 | 1.68 | 0.12 | 1.93 | <0.01 |
HIV versus healthy volunteers.
For memory CD4 and CD8 T cells, there was increased expression of some type I IFN-associated genes among the HIV-infected individuals compared with that among healthy controls. The γc cytokine-associated genes were upregulated in memory CD4 T cells (BCL2L1, IL2RG, and STAT5A) but not in memory CD8 T cells.
Enhanced in vitro STAT1 phosphorylation in response to IL-7 or IFN-α in naive CD4 T cells from viremic HIV-infected individuals
One possible explanation for these differences in the pattern of gene expression in CD4 and CD8 T cells is a differential response of CD4 and CD8 T cells to homeostatic cytokines, such as IL-7 and to type I IFN. Because HIV-induced lymphopenia is associated with increased serum levels of IL-7 and HIV replication is associated with increased type I IFN production, we next studied the in vitro response of CD4 and CD8 naive and memory T cells from HIV-infected individuals to IL-7 or IFN-α, or in combination (28). We measured the impact in downstream pathways triggered by these cytokines, including STAT1 for the IFN-α response and STAT5 for IL-7. Naive CD4 T cells from viremic HIV-infected individuals (>30,000 copies/ml) showed enhanced STAT1 phosphorylation after stimulation with either IL-7 or IFN-α when compared with those of patients with suppressed viremia (p = 0.0003; p = 0.0014) or healthy controls (p < 0.0001; p = 0.0002) (Fig. 4A). In contrast, this enhancement was not observed for STAT5 phosphorylation. In the memory pools, CD4 memory T cells showed a similar response to that observed in naive CD4 T cells after in vitro stimulation with IL-7 or IFN-α, or a combination of both cytokines. CD8 memory T cells from patients with HIV RNA levels >30,000 copies/ml were less responsive to IL-7 than cells from healthy controls with respect to pSTAT5 phosphorylation, probably because of the loss of CD127 expression (29) (Fig. 4B).
Discussion
The present study has delineated clear differences in the activation of discrete T cell subsets in patients with HIV infection and has provided insights as to the regulation of the CD4 and CD8 T cell pools in healthy controls. Studies of the signaling pathways associated with this activation have identified type I IFN and common γc cytokines as playing important roles.
A key feature of the immune systems of patients with HIV infection is an expansion of the CD8 T cell pool in a setting of CD4 depletion. The reasons behind this dichotomy, given the fact that both pools demonstrate enhanced proliferation, have remained unclear (30, 31). Data from the current study suggest that this difference could relate to the relative importance of homeostatic forces in the regulation of these two pools. Homeostatic forces likely are regulated to allow only a limited degree of expansion for each individual cell so as to preserve diversity of the repertoire (32, 33). It is probable that there is no such restriction for Ag-driven/inflammatory responses of the CD4 or CD8 pools. In addition, it appears from the current data that the CD8 T cell pool is not as significantly influenced by homeostatic forces as the CD4 pool. One possible explanation for this is the fact that the CD8 counts are commonly at a level above which a homeostatic force would be needed. Given this, one could envision a scenario whereby homeostatic and Ag-driven/inflammatory responses acting together lead to a scenario of CD4 depletion with CD8 expansion.
Both the degree of CD4 depletion and the level of HIV viremia were found to be significant in vivo forces driving T cell proliferation. CD4 depletion had the greatest impact on CD4 proliferation. This was particularly true for the naive subset of CD4 T cells and was seen in both the percentage and the total number of proliferating cells. In contrast, neither CD4 nor CD8 count had much effect on CD8 turnover. HIV viral load was the driving force behind CD8 T cell turnover and had the greatest impact on the proliferation of CD4 and CD8 memory subsets. Thus, although viral load was a significant driver of both CD4 and CD8 proliferation, CD4 depletion only influenced the rate of CD4 T cell proliferation. Taken together, these data suggest that the overall size of the CD4 T cell pool is an important parameter for host defense and effort is made by the host to maintain it at a certain size. In contrast, the CD8 pool size appears to be mainly driven by external factors, such as infection (34). These findings and interpretation are consistent with a model in which the CD4 pool plays more of a regulatory role as the “conductor of the immune orchestra” as suggested by Green and Gershon (35), whereas the CD8 pool predominantly takes on the role of effectors.
Although the number of CD4 T cells was found to increase after the initiation of ART, the CD8 T cell pool response was variable. Of the 23 patients with early CD4 T cell count increase studied, 6 patients showed a statistically significant increase, whereas 4 patients showed a statistically significant decrease in CD8 T cell counts and 13 patients showed no statistically significant change. These data are consistent with the viral load being a major driver of the expansion of the CD8 T cell pool and a reflection of the role of an intact CD4 T cell pool in helping to support that expansion. Although HIV viremia contributes directly and indirectly to the proliferation/activation of CD8 T cells, it is likely that the observed immune activation of these cells is the sum of multiple factors (36).
In an attempt to better understand these differences at the molecular level, we examined the patterns of gene expression and patterns of STAT protein phosphorylation in naive and memory subsets of CD4 and CD8 T cells from healthy controls and patients with HIV infection and high viral load. We chose to look at common γc cytokine signaling pathways as reflective of homeostatic forces mediated through IL-2, IL-7, and IL-15 and type I IFN pathways as reflective of host response to viral infection. Compared to healthy controls, patients with HIV infection had increased expression of genes associated with γc cytokine signaling in naive and memory CD4 T cells. Similar differences in genes associated with γc signaling were not seen within either subset of CD8 T cells. Evidence of increased expression of type I IFN-associated genes was seen in both naive and memory, CD4, and CD8 T cells. These data are also consistent with a model in which CD4 T cells are influenced by both homeostatic and viral forces, whereas CD8 cells are only perturbed by the virus.
Patients with advanced HIV infection have been shown to have increased plasma levels of IL-7 and type I IFN. These same patients also have been shown to have decreased responses to IFN-α therapy in the setting of Kaposi’s sarcoma or hepatitis C (21, 37, 38). Of note was the fact that CD4 T cells from patients with higher viral loads were shown in the current study to have increased phosphorylation of STAT1 in vitro in response to either IFN-α or IL-7 when compared with that of controls. This enhanced responsiveness of CD4 T cells to IFN-α in the setting of chronic HIV infection may be one explanation for persistent immune activation and CD4 depletion. We postulate that the increased phosphorylation in vitro is secondary to the increased exposure to type I IFNs in vivo.
In addition to examining CD4 and CD8 proliferation in patients with HIV infection, the current study has examined the impact of CD4 count on T cell proliferation in healthy controls. Reflecting the findings in patients with HIV infection, the proportion and number of proliferating cells in the CD4 pool of healthy controls was the highest in individuals with lower CD4 counts. The fact that the absolute number of proliferating cells also increased in the healthy controls strongly suggests that this is a response to homeostatic forces as opposed to an artifact of lower cell numbers. In contrast, there was no relationship between CD8 T cell counts and either CD4 or CD8 proliferation and no relationship between CD4 counts and proliferation of the CD8 pool. Of note was the fact that the absolute number of proliferating CD4 T cells was similar between healthy controls and patients with HIV infection and HIV RNA levels <50 copies/ml, suggesting similar levels of “thymopoiesis” in these two groups. In contrast, the absolute number of proliferating CD8 T cells was 3.4-fold higher in the patients with HIV infection and HIV RNA levels <50 copies/ml compared with that of controls, suggesting the presence of ongoing viral replication or at least persistent forces driving CD8 T cell activation in these patients with “undetectable” viremia. Variation in this persistent activation in the setting of low viral loads may explain the marked difference in biomarkers associated with immune system activation in these patients. Given the importance of biomarkers in predicting all causes of mortality (39), understanding this relationship is of considerable interest.
In summary, the current study has provided additional perspective on the pathways involved in the activation of CD4 and CD8 T cells in patients with HIV infection and delineated differential effects on the CD4 and CD8 T cell pools and naive and memory T cell subsets. Ongoing exposure to the combination of homeostatic forces and type I IFN activation may be responsible for the selective depletion of CD4 T cells.
Supplementary Material
Acknowledgments
We thank the patients of the National Institute of Allergy and Infectious Diseases HIV Clinic for participation in this study and the healthy controls of the NIH Blood Bank. We also thank Dr. Anthony Fauci for guidance and support and Dr. Gene Shearer for critical reading of the manuscript.
This work was supported by the Intramural Research Program of the National Institute of Allergy and Infectious Diseases, National Institutes of Health and Science Applications International Corporation (Frederick, MD). This work was also supported in part by federal funds from the National Cancer Institute, National Institutes of Health under Contract N01-CO-12400.
Abbreviations used in this article:
- ART
antiretroviral therapy
- γc
common γ chain
- EdU
5-ethynyl-2′-deoxyuridine
- NIH
National Institutes of Health
- OAS
2′,5′-oligoadenylate synthetase
- rh
recombinant human
- TEM
terminal effector memory
- VL
viral load
Footnotes
Disclosures
The authors have no financial conflicts of interest.
The microarray data presented in this article have been submitted to the Gene Expression Omnibus under accession number GSE25456.
Publisher's Disclaimer: The content of this publication does not necessarily reflect the views or policies of the Department of Health and Human Services, nor does mention of trade names, commercial products, or organizations imply endorsement by the U.S. Government.
The online version of this article contains supplemental material.
References
- 1.Sachsenberg N, Perelson AS, Yerly S, Schockmel GA, Leduc D, Hirschel B, and Perrin L. 1998. Turnover of CD4+ and CD8+ T lymphocytes in HIV-1 infection as measured by Ki-67 antigen. J. Exp. Med 187: 1295–1303. [DOI] [PMC free article] [PubMed] [Google Scholar]
- 2.Ho DD, Neumann AU, Perelson AS, Chen W, Leonard JM, and Markowitz M. 1995. Rapid turnover of plasma virions and CD4 lymphocytes in HIV-1 infection. Nature 373: 123–126. [DOI] [PubMed] [Google Scholar]
- 3.Kovacs JA, Lempicki RA, Sidorov IA, Adelsberger JW, Herpin B, Metcalf JA, Sereti I, Polis MA, Davey RT, Tavel J, et al. 2001. Identification of dynamically distinct subpopulations of T lymphocytes that are differentially affected by HIV. J. Exp. Med 194: 1731–1741. [DOI] [PMC free article] [PubMed] [Google Scholar]
- 4.Lempicki RA, Kovacs JA, Baseler MW, Adelsberger JW, Dewar RL, Natarajan V, Bosche MC, Metcalf JA, Stevens RA, Lambert LA, et al. 2000. Impact of HIV-1 infection and highly active antiretroviral therapy on the kinetics of CD4+ and CD8+ T cell turnover in HIV-infected patients. Proc. Natl. Acad. Sci. USA 97: 13778–13783. [DOI] [PMC free article] [PubMed] [Google Scholar]
- 5.Hazenberg MD, Hamann D, Schuitemaker H, and Miedema F. 2000. T cell depletion in HIV-1 infection: how CD4+ T cells go out of stock. Nat. Immunol 1: 285–289. [DOI] [PubMed] [Google Scholar]
- 6.Catalfamo M, Di Mascio M, Hu Z, Srinivasula S, Thaker V, Adelsberger J, Rupert A, Baseler M, Tagaya Y, Roby G, et al. 2008. HIV infection-associated immune activation occurs by two distinct pathways that differentially affect CD4 and CD8 T cells. Proc. Natl. Acad. Sci. USA 105: 19851–19856. [DOI] [PMC free article] [PubMed] [Google Scholar]
- 7.Surh CD, and Sprent J. 2000. Homeostatic T cell proliferation: how far can T cells be activated to self-ligands? J. Exp. Med 192: F9–F14. [DOI] [PMC free article] [PubMed] [Google Scholar]
- 8.Hakim FT, Cepeda R, Kaimei S, Mackall CL, McAtee N, Zujewski J, Cowan K, and Gress RE. 1997. Constraints on CD4 recovery postchemotherapy in adults: thymic insufficiency and apoptotic decline of expanded peripheral CD4 cells. Blood 90: 3789–3798. [PubMed] [Google Scholar]
- 9.Vrisekoop N, van Gent R, de Boer AB, Otto SA, Borleffs JC, Steingrover R, Prins JM, Kuijpers TW, Wolfs TF, Geelen SP, et al. 2008. Restoration of the CD4 T cell compartment after long-term highly active anti-retroviral therapy without phenotypical signs of accelerated immunological aging. J. Immunol 181: 1573–1581. [DOI] [PubMed] [Google Scholar]
- 10.Connors M, Kovacs JA, Krevat S, Gea-Banacloche JC, Sneller MC, Flanigan M, Metcalf JA, Walker RE, Falloon J, Baseler M, et al. 1997. HIV infection induces changes in CD4+ T-cell phenotype and depletions within the CD4+ T-cell repertoire that are not immediately restored by antiviral or immune-based therapies. Nat. Med 3: 533–540. [DOI] [PubMed] [Google Scholar]
- 11.Gea-Banacloche JC, Weiskopf EE, Hallahan C, López Bernaldo de Quirós JC, Flanigan M, Mican JM, Falloon J, Baseler M, Stevens R, Lane HC, and Connors M. 1998. Progression of human immunodeficiency virus disease is associated with increasing disruptions within the CD4+ T cell receptor repertoire. J. Infect. Dis 177: 579–585. [DOI] [PubMed] [Google Scholar]
- 12.Puel A, Ziegler SF, Buckley RH, and Leonard WJ. 1998. Defective IL7R expression in T(−)B(+)NK(+) severe combined immunodeficiency. Nat. Genet 20: 394–397. [DOI] [PubMed] [Google Scholar]
- 13.Mazzucchelli R, and Durum SK. 2007. Interleukin-7 receptor expression: intelligent design. Nat. Rev. Immunol 7: 144–154. [DOI] [PubMed] [Google Scholar]
- 14.Gadina M, Hilton D, Johnston JA, Morinobu A, Lighvani A, Zhou YJ, Visconti R, and O’Shea JJ. 2001. Signaling by type I and II cytokine receptors: ten years after. Curr. Opin. Immunol 13: 363–373. [DOI] [PubMed] [Google Scholar]
- 15.Lu N, Wang YH, Wang YH, Arima K, Hanabuchi S, and Liu YJ. 2009. TSLP and IL-7 use two different mechanisms to regulate human CD4+ T cell homeostasis. J. Exp. Med 206: 2111–2119. [DOI] [PMC free article] [PubMed] [Google Scholar]
- 16.Boasso A, and Shearer GM. 2008. Chronic innate immune activation as a cause of HIV-1 immunopathogenesis. Clin. Immunol 126: 235–242. [DOI] [PMC free article] [PubMed] [Google Scholar]
- 17.Preble OT, Rook AH, Quinnan GV, Vilcek J, Friedman RM, Steis R, Gelmann EP, and Sonnabend JA. 1984. Role of interferon in AIDS. Ann. N. Y. Acad. Sci 437: 65–75. [DOI] [PubMed] [Google Scholar]
- 18.Boasso A, Hardy AW, Landay AL, Martinson JL, Anderson SA, Dolan MJ, Clerici M, and Shearer GM. 2008. PDL-1 upregulation on monocytes and T cells by HIV via type I interferon: restricted expression of type I interferon receptor by CCR5-expressing leukocytes. Clin. Immunol 129: 132–144. [DOI] [PMC free article] [PubMed] [Google Scholar]
- 19.Herbeuval JP, Hardy AW, Boasso A, Anderson SA, Dolan MJ, Dy M, and Shearer GM. 2005. Regulation of TNF-related apoptosis-inducing ligand on primary CD4+ T cells by HIV-1: role of type I IFN-producing plasmacytoid dendritic cells. Proc. Natl. Acad. Sci. USA 102: 13974–13979. [DOI] [PMC free article] [PubMed] [Google Scholar]
- 20.Boasso A, Herbeuval JP, Hardy AW, Anderson SA, Dolan MJ, Fuchs D, and Shearer GM. 2007. HIV inhibits CD4+ T-cell proliferation by inducing indoleamine 2,3-dioxygenase in plasmacytoid dendritic cells. Blood 109: 3351–3359. [DOI] [PMC free article] [PubMed] [Google Scholar]
- 21.Lane HC, Kovacs JA, Feinberg J, Herpin B, Davey V, Walker R, Deyton L, Metcalf JA, Baseler M, Salzman N, et al. 1988. Anti-retroviral effects of interferon-alpha in AIDS-associated Kaposi’s sarcoma. Lancet 2: 1218–1222. [DOI] [PubMed] [Google Scholar]
- 22.Bosinger SE, Li Q, Gordon SN, Klatt NR, Duan L, Xu L, Francella N, Sidahmed A, Smith AJ, Cramer EM, et al. 2009. Global genomic analysis reveals rapid control of a robust innate response in SIV-infected sooty mangabeys. J. Clin. Invest 119: 3556–3572. [DOI] [PMC free article] [PubMed] [Google Scholar]
- 23.Jacquelin B, Mayau V, Targat B, Liovat AS, Kunkel D, Petitjean G, Dillies MA, Roques P, Butor C, Silvestri G, et al. 2009. Nonpathogenic SIV infection of African green monkeys induces a strong but rapidly controlled type I IFN response. J. Clin. Invest 119: 3544–3555. [DOI] [PMC free article] [PubMed] [Google Scholar]
- 24.Wang J, Lin Q, Langston H, and Cooper MD. 1995. Resident bone marrow macrophages produce type 1 interferons that can selectively inhibit interleukin-7-driven growth of B lineage cells. Immunity 3: 475–484. [DOI] [PubMed] [Google Scholar]
- 25.Sato T, Onai N, Yoshihara H, Arai F, Suda T, and Ohteki T. 2009. Interferon regulatory factor-2 protects quiescent hematopoietic stem cells from type I interferon-dependent exhaustion. Nat. Med 15: 696–700. [DOI] [PubMed] [Google Scholar]
- 26.Roederer M 2001. Spectral compensation for flow cytometry: visualization artifacts, limitations, and caveats. Cytometry 45: 194–205. [DOI] [PubMed] [Google Scholar]
- 27.Polis MA, Sidorov IA, Yoder C, Jankelevich S, Metcalf J, Mueller BU, Dimitrov MA, Pizzo P, Yarchoan R, and Dimitrov DS. 2001. Correlation between reduction in plasma HIV-1 RNA concentration 1 week after start of antiretroviral treatment and longer-term efficacy. Lancet 358: 1760–1765. [DOI] [PubMed] [Google Scholar]
- 28.Phillips AN, Lampe FC, Smith CJ, Geretti AM, Rodger A, Lodwick RK, Cambiano V, Tsintas R, and Johnson MA. 2010. Ongoing changes in HIV RNA levels during untreated HIV infection: implications for CD4 cell count depletion. AIDS 24: 1561–1567. [DOI] [PubMed] [Google Scholar]
- 29.Paiardini M, Cervasi B, Albrecht H, Muthukumar A, Dunham R, Gordon S, Radziewicz H, Piedimonte G, Magnani M, Montroni M, et al. 2005. Loss of CD127 expression defines an expansion of effector CD8+ T cells in HIV-infected individuals. J. Immunol 174: 2900–2909. [DOI] [PubMed] [Google Scholar]
- 30.Douek DC 2003. Disrupting T-cell homeostasis: how HIV-1 infection causes disease. AIDS Rev. 5: 172–177. [PubMed] [Google Scholar]
- 31.Lane HC 2010. Pathogenesis of HIV infection: total CD4+ T-cell pool, immune activation, and inflammation. Top. HIV Med 18: 2–6. [PubMed] [Google Scholar]
- 32.Surh CD, and Sprent J. 2008. Homeostasis of naive and memory T cells. Immunity 29: 848–862. [DOI] [PubMed] [Google Scholar]
- 33.Asquith B, Borghans JA, Ganusov VV, and Macallan DC. 2009. Lymphocyte kinetics in health and disease. Trends Immunol. 30: 182–189. [DOI] [PubMed] [Google Scholar]
- 34.Foulds KE, Zenewicz LA, Shedlock DJ, Jiang J, Troy AE, and Shen H. 2002. Cutting edge: CD4 and CD8 T cells are intrinsically different in their proliferative responses. J. Immunol 168: 1528–1532. [DOI] [PubMed] [Google Scholar]
- 35.Green DR, and Gershon RK. 1982. Hyperimmunity and the decision to be intolerant. Ann. N. Y. Acad. Sci 392: 318–329. [DOI] [PubMed] [Google Scholar]
- 36.Douek D 2007. HIV disease progression: immune activation, microbes, and a leaky gut. Top. HIV Med 15: 114–117. [PubMed] [Google Scholar]
- 37.Lane HC 1994. Interferons in HIVand related diseases. AIDS 8(Suppl. 3): S19–S23. [DOI] [PubMed] [Google Scholar]
- 38.Lempicki RA, Polis MA, Yang J, McLaughlin M, Koratich C, Huang DW, Fullmer B, Wu L, Rehm CA, Masur H, et al. 2006. Gene expression profiles in hepatitis C virus (HCV) and HIV coinfection: class prediction analyses before treatment predict the outcome of anti-HCV therapy among HIV-coinfected persons. J. Infect. Dis 193: 1172–1177. [DOI] [PubMed] [Google Scholar]
- 39.Kuller LH, Tracy R, Belloso W, De Wit S, Drummond F, Lane HC, Ledergerber B, Lundgren J, Neuhaus J, Nixon D, et al. ; INSIGHT SMART Study Group. 2008. Inflammatory and coagulation biomarkers and mortality in patients with HIV infection. PLoS Med. 5: e203. [DOI] [PMC free article] [PubMed] [Google Scholar]
Associated Data
This section collects any data citations, data availability statements, or supplementary materials included in this article.