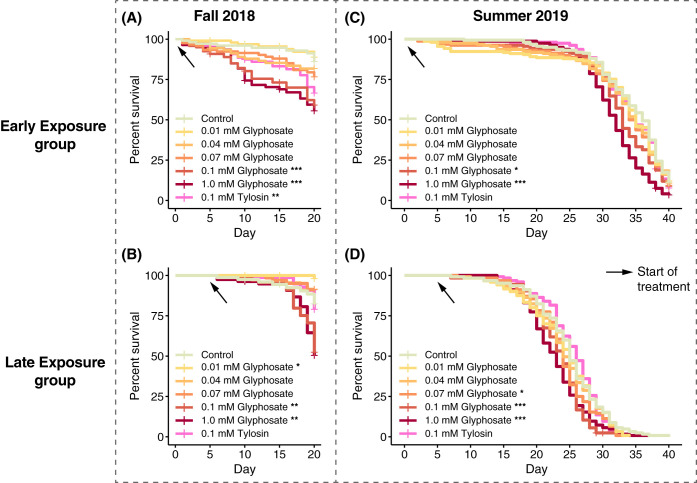
FIG 6.
Percent survival of age-controlled, caged bees treated with different doses of glyphosate or tylosin, shown as a Kaplan-Meier survival curve. (A and B) In fall of 2018, 1-day-old bees (A) and 5-day-old bees (B) were divided into seven groups, composed of 4 cup cages each with 26 to 30 bees, which were fed 0.01, 0.04, 0.07, 0.1, or 1.0 mM glyphosate in sterile sucrose syrup, 0.1 mM tylosin in sterile sucrose syrup, or sterile sucrose syrup for 20 and 15 days, respectively. Bees were sampled from each group every 5 days after the start of treatment, and dead bees were counted and removed from cup cages in a daily census. (C and D) The experiment was replicated in the summer of 2019, when 1-day-old bees (C) and 5-day-old bees (D) were divided into seven groups, composed of 4 cup cages each with 38 to 40 or 30 to 32 bees, respectively, which were fed 0.01, 0.04, 0.07, 0.1, or 1.0 mM glyphosate in sterile sucrose syrup, 0.1 mM tylosin in sterile sucrose syrup, or sterile sucrose syrup for 40 and 35 days, respectively. Bees were not sampled during treatment; dead bees were removed from cup cages in a daily census. The Cox proportional hazards model was implemented in the survival package in R (Table S3). *, P < 0.05; **, P < 0.01; ***, P < 0.001.

