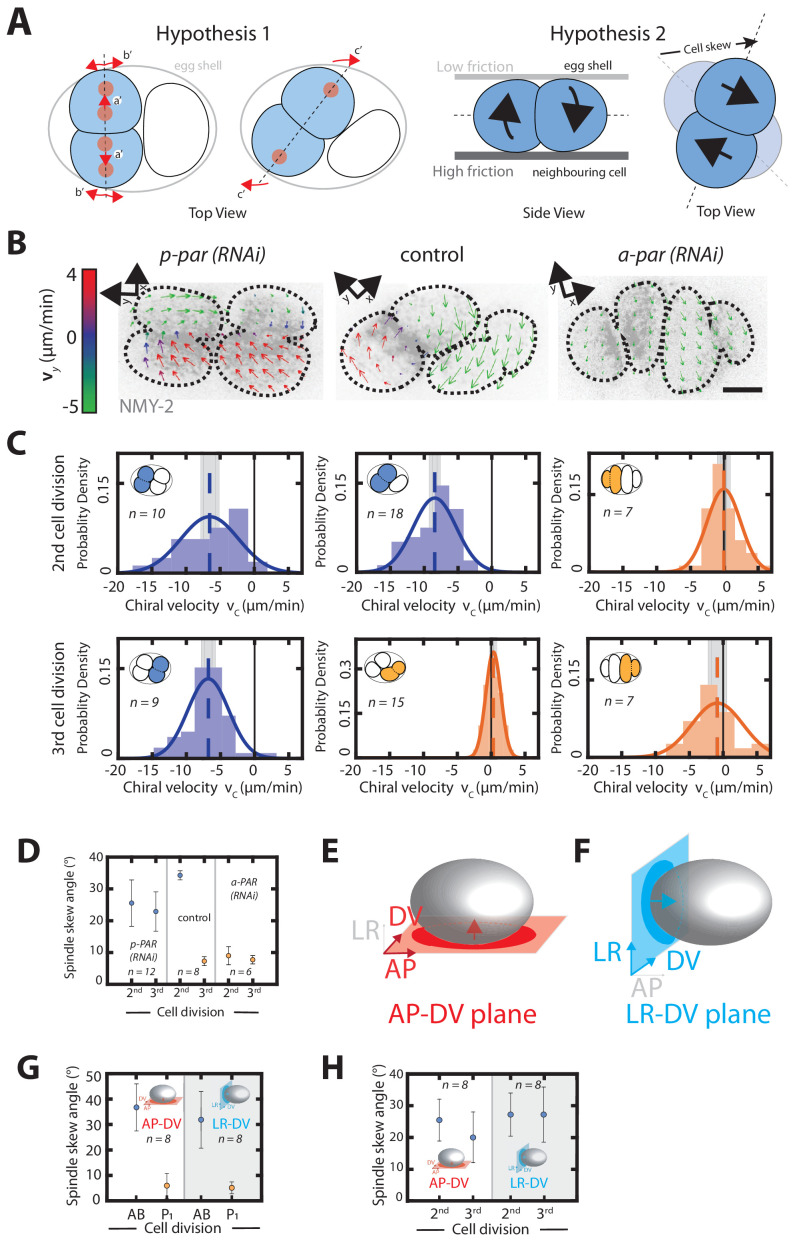
Figure 3. Chiral counter-rotating flows are cell-lineage dependent.
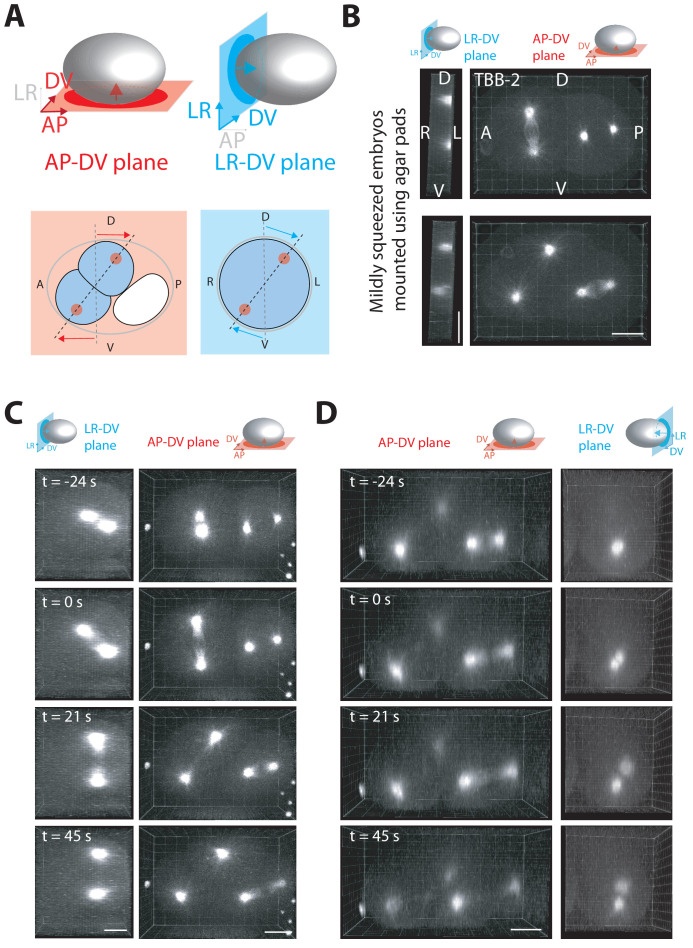
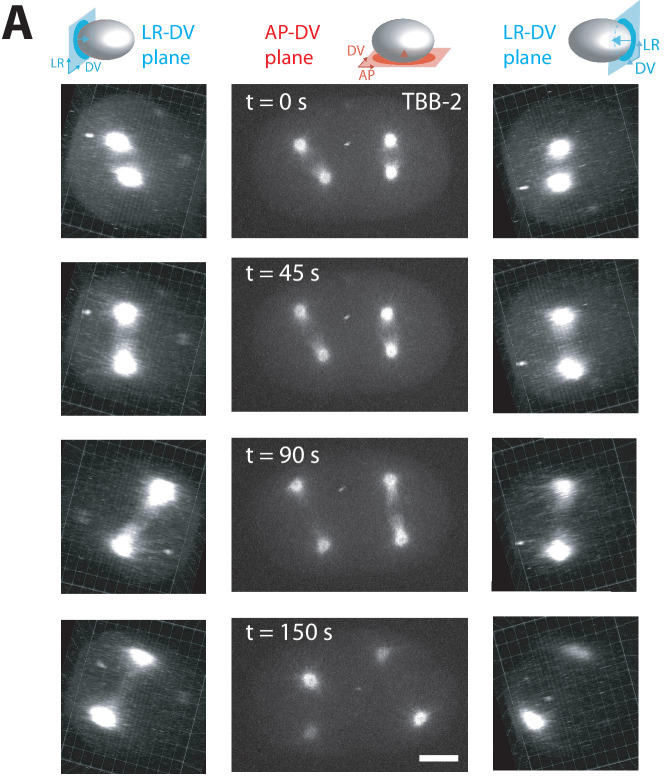
(A) Possible mechanisms of spindle skew and cell rearrangement. Hypothesis one: spindle skews are driven by spindle elongation. The mitotic spindle initially elongates along the dorsoventral axis (a’ and b’), but then skews (c’) because there is not enough space given the physical constraints imposed by the eggshell. Dashed line depicts the cell division axis, red dots depict spindle poles, arrows indicate spindle pole movements. Hypothesis two: spindle skews are driven by counter-rotating flows of the dividing cell halves. Left: top view, right: side view. Chiral counter-rotation of the two halves of a dividing cell gives rise to a cell skew if the dividing cell experiences non-uniform friction with its surroundings, e.g. a lower friction with the eggshell above and a higher friction with the cell below. (B) Representative images of cortical myosin (grey, NMY-2::GFP) for the second and the third cell division of C. elegans embryos. Arrows indicate the cortical flow field as measured by PIV and time-averaged over 21 s and over the onset of cytokinesis. Arrow colors indicate the y-direction velocity (parallel to the cytokinesis furrow, coordinate systems are indicated). (C) Histograms of the instantaneous chiral counter-rotating flow velocity for par perturbations (see Materials and methods for definition). Solid lines indicate the best-fit gaussian probability density function. Dotted vertical colored lines represent the mean , grey boxes represent the error of the mean. Thin black solid lines indicate a chiral flow velocity of zero. Inset, colored cells indicate the cell analyzed; AB lineage in blue, P/EMS lineage in orange. (D) Spindle skew angle for control (L4440), par-2; chin-1; lgl-1 (RNAi) and par-6 (RNAi) embryos. (E, F) Schematic of a C. elegans embryo. 3-D recordings capturing spindle pole movements and corresponding spindle skews were projected on either the (E) anteroposterior-dorsoventral (AP-DV) plane (red) or the (F) left-right-dorsoventral (LR-DV) plane (blue). (G, H) Spindle skew angles during the second and third cell division in control (G) and upon par-2 (RNAi) (H) projected onto the anteroposterior-dorsoventral plane (termed AP-DV plane, left) or onto the dorsoventral-left-right plane (termed LR-DV plane, right). The embryo schematic denotes the plane of projection (rectangle) and the direction of view (arrow) as described above. Scale bars, 10 µm. Errors indicate the error of the mean at 95% confidence.


