

Abstract
Pavlovian learning is influenced by at least two temporal variables: The time between the onset of the conditioned stimulus (CS) and presentation of the unconditioned stimulus (US), and the time between successive conditioning trials (the intertrial interval, or ITI). Wagner’s Sometimes Opponent Process (SOP) model (e.g., 1981) provides a rich account of the effects of varying the absolute durations of CS and ITI. However, other theories have contrastingly emphasized the role of the relative durations of CS (T) and ITI (I). Three experiments with rats used an appetitive conditioning preparation to separate the two approaches. They manipulated absolute values of I and T over a factor of six and compared the effect of varying T and I/T by the same factor. Conditioning was indexed by the rate of foodcup entry during training, during common tests conducted later with different combinations of I and T, and with a reinforcers-to-criterion measure. Experiment 1 found that learning with a 10-s CS was superior to that with a 60-s CS when the I/T ratio was the same. There was little evidence of learning with the 60-s CS. Experiment 2 replicated that result and extended it to show that a 60-s CS still supported little conditioned responding when I/T was increased from 12 to 72. Experiment 3 then examined intermediate CS durations between 10-s and 60-s while I/T was controlled. The results support a role for absolute CS duration rather than the I/T ratio. Explanations based on SOP and behavior systems theory are explored.
Keywords: I/T, CS duration, timing, associative learning, common test
Temporal factors are known to have an important role in Pavlovian conditioning. One important temporal variable is the time between the onset of the conditioned stimulus (CS) and presentation of the unconditioned stimulus (US). As a general rule, conditioned responding is stronger when the CS signals the onset of the US after a short, relative to a long, delay (e.g., Schneiderman & Gormezano, 1964; see also Harris & Carpenter, 2011). Nevertheless, many influential models of associative learning do not directly address the impact of CS-US intervals on conditioning (e.g., Mackintosh, 1975; Pearce & Hall, 1980; Rescorla & Wagner, 1972). The Sometimes Opponent Process (SOP) model proposed by Wagner (e.g., 1981) is an exception, however. In SOP, processing of the CS is described by the real-time activation and decay of elements representing the CS and the US in memory. According to this view, short CS durations support stronger conditioning because more elements representing the CS are in a state of focal activation (A1) when the US is presented. In contrast, long CS durations support weaker conditioning because more of the elements representing the CS have decayed to a secondary state of activation (A2) prior to the presentation of the US.
A second important temporal variable in conditioning is the time between CS presentations, or intertrial interval (ITI). Conditioning with long ITIs is typically more effective than conditioning with short ITIs (e.g., Barnet, Grahame & Miller, 1995; Rescorla & Durlach, 1987). Wagner’s SOP theory provides at least two further mechanisms that explain the effects of ITI. According to SOP, excitatory CS-US associations are formed when both the CS and US are in an A1 state of activity. On a given trial, CS and US elements are activated into an A1 state, and must gradually decay to A2 before being fully inactive again. Further, elements must be in the inactive state before they can be activated back to A1. When conditioning occurs with short ITIs, some CS and/or US elements may still be in a state of A2 during the subsequent trial, preventing full activation to A1 and reducing the amount of excitation acquired on a given trial. In contrast, with longer ITIs, elements can decay back to the inactive state prior to the next trial, allowing for full activation to A1 when the CS and US are next presented. The results of a series of experiments by Bouton, Sunsay, and colleagues (Bouton & Sunsay, 2003; Sunsay, Stetson, & Bouton, 2004; but see also Harris & Bouton, in press) has suggested a role for this mechanism, so-called “self-generated” priming, in appetitive conditioning in rats.
Wagner’s SOP model also includes a second mechanism, “retrieval-generated priming,” that further favors long over short ITIs (see also Wagner, 1978). CSs and USs are not only associated with each other, but with the background context in which conditioning trials occur. When the context becomes associated with the US, for example, the context will retrieve a representation of the US, putting its elements into A2, and thus prevent full excitatory conditioning when the CS and US are subsequently paired. With long ITIs, the association between the context and the US undergoes extinction, thus reducing priming and allowing for stronger conditioning to the CS. In contrast, with short ITIs, the context would undergo less extinction and thus maintain strong conditioning, subsequently blocking conditioning to the CS. Associations between the context and CS, which would also weaken conditioning through retrieval generated priming, would follow similar principles. Sunsay and Bouton (2008) reported facilitated conditioning with ITIs that were longer than those that appeared to be at the upper limit of self-generated priming established in Bouton and Sunsay (2003) and Sunsay et al. (2004). They also reported evidence that was consistent with Wagner’s retrieval-generated priming mechanism. Overall, the theories of Wagner appear to successfully address the importance of the absolute durations of CSs and ITIs by assuming that they contribute to conditioning separately.
An alternative approach emphasizes the importance of the relative durations of the ITI and CS as the primary determinant of conditioning and performance (e.g., Balsam, Drew, & Gallistel, 2010; Gallistel & Gibbon, 2000; Gibbon & Balsam, 1981). According to this approach, the animal bases its decision to respond on a real-time comparison of the rate of US presentation in the presence of the CS or trial (T) and the rate of US presentation in the ITI or background interval (I). This comparison takes the form of a ratio of I/T. A more recent approach offered by Balsam and Gallistel (2009) suggests that conditioning depends on the “informativeness” of a CS regarding the US. Informativeness is a restatement of the I/T ratio in terms of Shannon’s theory of information (1948). That is, the information, in bits, conveyed to the animal about the delay to the next US by a CS relative to the information conveyed by the background is directly proportional to the I/T ratio.
A number of appetitive conditioning experiments have attempted to separate the contribution of I/T from the separate possible contributions of I and T. Lattal (1999, Experiment 1) examined acquisition of conditioned responding across groups of rats trained with an I/T ratio of either 1.5 or 24. Following conditioning, all rats received an identical test session that included each group’s trained durations, as well as all other group’s trained durations. Thus, all rats were tested under common conditions. If differences observed during conditioning reflect learning, then these differences should persist during the common test. However, if they reflect performance, then any difference would be expected to be lost when testing occurs under common conditions. Lattal (1999) found that rats trained with the larger I/T ratio tended to respond more in a common test. However, this conclusion was complicated by the fact that groups trained with the smaller I/T ratio had greater pre-CS responding than groups trained with the larger ratio. In a separate experiment (Experiment 4), Lattal compared groups of rats trained with an I/T ratio of either 3 or 12. During a common test, rats trained with the 12 ratio tended to respond more, and importantly, no pre-CS differences were observed. However, an effect of T was also observed; rats trained with shorter T durations (8 s) responded more than rats trained with longer T duration (32). Thus, although the larger I/T ratio produced greater responding, an effect of T was observed with a 4-fold increase in CS duration (8 vs. 32). The fact that shorter values of T produced greater responding within a particular I/T ratio suggests that I/T cannot be the sole determinant of conditioned responding.
Holland (2000) also examined the role of T and I durations, and I/T ratio, on rat appetitive conditioning. In Experiment 1, he trained rats with T durations of either 10 or 20 s. The I was orthogonally varied across different groups to produce I/T ratios of 1.5, 3, 12, 24, and 48. Comparison within identical I durations revealed a significant effect of T; rats trained with 10 s CSs responded more than rats trained with 20 s CSs. However, when the effect of T was compared in groups with the same I/T ratio, the effect was not significant. That is, groups trained with the same I/T ratio, but 10- or 20-s T durations, did not differ. However, in a second experiment, Holland examined a wider range of T values (20, 40, 80, or 160 s) with a single I/T ratio (6). He assessed the strength of conditioning in several ways, including the ability of the original CS to block learning about a second CS. During this test, the ability to block was strongest for rats trained with a 40 s CS, and weakest for rats trained with a 160 s CS. Thus, although all rats had been trained with an identical I/T ratio, the absolute duration of T still controlled the strength of conditioning. Holland (2000) concluded that with very long intervals, the absolute durations of I and T are critical to conditioning, over and above the I/T ratio. Kirkpatrick and Church (2000) reported a similar overall effect of CS duration on asymptotic level of conditioning, but no effect of I/T ratio.
In contrast, a more recent paper provided better support for the importance of I/T. Ward, Gallistel, Jensen, Richards, Fairhurst, and Balsam (2012) reported experiments with rats and mice that varied combinations of I and T across I/T ratios. One experiment compared conditioned responding in groups conditioned with CS durations of 8 or 24 s and I/T ratios of 4, 10, or 28. They found that the larger I/T ratios resulted in higher rates of foodcup entry responses controlled by the CS. In addition to response rate, analysis with a change-point algorithm (Gallistel, Fairhurst, & Balsam, 2004) suggested that I/T influenced the number of trials required to produce the onset of conditioned responding. Specifically, I/T influenced the number trials to the detection of a significant change in the slope of the cumulative record of response rate difference scores (CS-ITI). Although these results support a role of I/T, Ward et al. (2012) only varied the absolute duration of the CS over a set of relatively short durations (8, 20, and 24 s). As noted earlier, other evidence suggests that a role for CS duration, beyond that of I/T, may be especially likely with relatively long absolute durations (Holland, 2000).
The purpose of the present experiments was to further examine the role of CS duration and I/T ratio in appetitive conditioning. As we have noted, Holland (2000, Experiment 2) observed CS duration effects with relatively long durations when I/T was held constant at 6. However, because conditioning was only compared within a single I/T ratio, the potential influence of I/T on conditioning with long intervals was not actually examined with longer CS durations. In the present Experiments 1 and 2, CS duration and I/T ratio were both varied across a 6-fold range, allowing a direct comparison of their respective contributions to the acquisition of appetitive conditioning. Experiment 3 then studied the effects of varying CS duration within the 6-fold range that had been manipulated while holding I/T constant at 12.
In all experiments, the rate of acquisition was assessed by analyzing response rate during CS presentations as well as using a reinforcers-to-criterion measure. The latter is relevant because theories emphasizing relative time durations suggest that I/T specifically influences the point in training where conditioned responding first emerges, which is assumed to reflect a “decision point.” Nevertheless, such a measure is not always used to examine the role of I/T in conditioning (see Holland, 2000). Two additional features of the current experiments are noteworthy. First, following acquisition, the strength of conditioning was also assessed with a common test in which all subjects were tested with each of the I and T combinations that had been manipulated between groups during conditioning. Any differences that emerge during testing with different I and T combinations would suggest an effect on performance, whereas group differences that persist over different test combinations would reflect differences in learning that were created prior to the test (see also Lattal, 1999). Second, the method differed from those used by Holland (2000), Lattal, (1999), and Ward et al. (2012; Experiment 1) in that although the duration of each CS presentation was fixed, the CS-US interval varied across trials so that the US was always delivered at an unpredictable moment after CS onset. The variable method reduced the impact of response rates peaking at the time of expected US delivery, which can complicate comparisons of responding in CSs of different fixed CS-US intervals (e.g., see also Harris & Carpenter, 2011; Harris, Gharaei, & Pincham, 2011; Ward et al., 2012, Experiments 2 and 3).
Experiment 1
The purpose of the first experiment was to examine and compare the impact of manipulating CS duration and I/T ratio over large but identical differences in value. Three groups of rats received conditioning with a tone (CS) and a food pellet (US). The groups received different trial durations and ITIs that were varied over a six-fold range. Group 120/10 received a 120-s ITI and a 10-s CS, Group 120/60 received a 120-s ITI and a 60-s CS, and Group 720/60 received a 720-s ITI and a 60-s CS. Key comparisons were between Groups 120/10 and 720/60, which had the same I/T ratio (12) but CS durations that differed by a factor of 6, and between Groups 120/60 and 720/60, which had the same CS durations but I/T ratios that differed by the same factor of 6. According to theories that emphasize I/T (e.g., Balsam et al., 2010; Gallistel & Gibbon, 2000; Gibbon & Balsam, 1981), conditioning should proceed at a similar rate in the former groups but at different rates in the latter ones. On the final day, groups received a common test with each combination of I and T (120/10, 120/60, and 720/60).
Method
Subjects
The subjects were 24 female Wistar rats (Charles River, St. Constance, QC). The rats had served in an operant conditioning experiment that involved lever pressing for sucrose- and grain-based pellets under food deprivation in the same apparatus. Outside of experimental sessions, rats had free access to water in suspended stainless steel cages in a climate controlled colony room with a 16:8 light:dark cycle. Rats were maintained at 80% of their free-feeding weights with supplemental feeding following each day’s session.
Apparatus
Conditioning proceeded in two sets of four standard conditioning chambers (Med-Associates Model Number: ENV-008-VP, St. Albans, VT) that were housed in different rooms of the laboratory. Each set had unique features that allowed use as separate contexts, although they were not used in that capacity here. Chambers in each set measured 30.5 cm × 24.1 cm × 21.0 cm (1 × w × h), with side walls and ceilings made of clear acrylic plastic and front and rear walls made of brushed aluminum. Recessed 5.1 cm × 5.1 cm food cups with infrared photobeams positioned approximately 1.2 cm behind the plane of the wall and 1.2 cm above the bottom of the cup were centered in the front wall about 3 cm above the floor grid. In one set of four chambers, the floor was composed of stainless steel rods (0.5 cm in diameter) in a horizontal plane spaced 1.6 cm center to center, whereas in the other set, the floor was composed of identical rods spaced 3.2 cm apart in two separate horizontal planes, one 0.6 cm lower than the other and horizontally offset by 1.6 cm. Chambers with the planar floor grid had a side wall with black panels (7.6 cm × 7.6 cm) placed in a diagonal arrangement, and there were diagonal stripes on both the ceiling and the back panel, all oriented in the same direction, 2.9 cm wide, and about 4 cm apart. The remaining chambers, with the staggered floor, were not adorned in any way.
Both sets were housed in sound-attenuating cubicles and were continuously illuminated by two 7.5-W incandescent light bulbs mounted on the interior ceiling. A fan attached to the top of the right wall in each cubicle provided 60 dB of background noise. Observation of each subject was provided by a video camera mounted to the wall of each experimental room, approximately 1.2 m from the sound-attenuating chambers. Observations from the video cameras could be recorded on select sessions. Clear acrylic plastic windows in the front of each chamber permitted view of each rat.
The CS was a 3000 Hz tone (80 dB) that was delivered through a 7.6-cm speaker mounted to the ceiling of the sound attenuation cubicle. The US was one 45-mg MLab Rodent Tablet (5-TUM: 181156; TestDiet, Richmond, IN) food pellet. The apparatus was controlled by computer equipment located in an adjacent room.
Procedure
Conditioning
Rats had been subjects in an instrumental learning experiment in a different set of operant chambers. They were experienced in retrieving pellets from the food cup, but naive to the tone. Rats were assigned to one of three groups (n = 8), with assignment being independent of the previous treatment. Each group received eight reinforced presentations of one combination of a CS and ITI duration during each daily session. Each reinforced CS was divided into 8 blocks of equal duration, and one block was selected randomly and without replacement to precede the US on each trial. Group 120/10 (I/T = 12) received a 10-s CS following a variable 120 s ITI with the US delivered after one of eight 1.25-s intervals following CS onset. Group 120/60 (I/T = 2) received presentations of a 60-s CS separated by a variable 120 s ITI with the US delivered following one of eight 7.5 s intervals following CS onset. Group 720/60 (I/T = 12) received a 60 s CS presentations separated by a variable 720 s ITI with the US was delivered following one of eight 7.5 s intervals. For all groups, a nonreinforced probe (test) CS of the usual duration separated the 5th and 6th reinforced CS in each session. Probe tests allowed us to measure magazine entries elicited by the CS (rather than also by a food pellet). Conditioning lasted 5 days (one session per day) for a total of 40 trials. Session durations were 17.5 min, 25 min, and 105 min for Groups 120/10, 120/60, and 720/60, respectively.
Common Test
On Day 6, all rats received a test session in which there were three presentations of each ITI and CS duration combination (120/10, 120/60, and 720/60). (The designated ITI preceded the corresponding CS.) The US was presented at CS offset. Rats were tested in three squads, each containing 2-3 rats from each conditioning group. Trial types were intermixed in a pseudorandom order, with the restriction that each was presented once during each of the three 3-trial blocks (cf. Lattal, 1999).
Data analysis
Food cup entries during conditioning and testing were recorded during the CS period prior to US delivery, as well as during a period of the ITI preceding the CS. Consistent with Lattal (1999), the pre-CS period for each group was defined as the period immediately preceding the CS presentation which was identical in duration to the CS period. In each experiment, groups had their pre-US food cup entry rates normalized to 10 s for comparison (e.g., groups conditioned with a 60-s CS had their pre-US rate divided by 6). This normalization procedure was used to analyze conditioning data and was not applied to data from tests. In each experiment, we also calculated the number of four-trial blocks required to reach an acquisition criterion of three consecutive blocks with elevation scores of 1.5 or above (cf. Morris & Bouton, 2006; Sunsay & Bouton, 2003). Alpha was set to .05 for all statistical tests; effects sizes and their confidence intervals are reported for tests relevant to the hypotheses.
Results
Conditioning
The results of the conditioning phase are summarized in Figure 1. For each group, CS food-cup entry rates (response rate) increased over 4-reinforcer-trial blocks of the phase (probe trials were not included in the acquisition criterion analysis). Group 120/10 showed the highest response rate throughout, whereas groups 120/60 and 720/60 showed similar but lower rates of CS responding. These observations were supported by a Group by Block ANOVA, which found significant effects of group, F(2, 21) = 18.63, MSE = 1026.69, p < .001, ηp2 = .64, 95% CIs [.31, .76], and block, F(9, 189) = 6.52, MSE = 109.48, p < .001, ηp2 = .24, 95% CIs [.11, .30], as well as a group by block interaction, F(18, 189) = 3.31, p < .001, ηp2 = .24, 95% CIs [.11, .30], Pairwise Group by Block ANOVAs compared CS response rate in each group. For Groups 120/10 and 720/60, which differed in CS and ITI duration but were matched on I/T ratio, the analysis found significant effects of group, F(1, 14) = 17.97, MSE = 1424.88, p = .001, ηp2 = .56, 95% CIs [.15, .74], block, F(9, 126) = 6.86, MSE = 131.35, p < .001, and a group by block interaction, F(9, 126) = 3.46, p = .001. For Groups 120/60 and 720/60, which differed in ITI duration and I/T but were matched on CS duration, the analysis found a significant effect of block, F(9, 126) = 2.43, MSE = 63.13, p = .014, but no effect of group or group by block interaction. For Groups 120/10 and 120/60 which differed in CS duration and I/T but were matched for ITI duration, there were significant effects of group, F(1, 14) = 24.61, MSE = 1279.21, p < .001, block, F(9, 126) = 5.48, MSE = 133.96, p < .001, and a group by block interaction, F(9, 126) = 4.27, p = .005. Not surprisingly, pre-CS responding was somewhat higher in the groups conditioned with the shorter (120-s) ITI. A Group by Block ANOVA found a significant effect of group, F(2, 21) = 5.43, MSE = 247.14, p = .013. Planned group by block ANOVAs found that Group 720/60 differed from Group 120/10, F(1, 14) = 8.73, MSE = 306.31, p =.010, and Group 120/60, F(1, 14) = 7.50, MSE = 109.47, p =.016, but Groups 120/10 and 120/60 did not differ from one another statistically, F(1, 14) = 1.63, MSE = 325.64, p = .222.
Figure 1. Results of Experiment 1: Conditioning.

Note. Food cup entries per minute (Response rate) in the CS (solid) and pre-CS period (dashed) across 4-trial blocks during training. Error bars are the standard error of the mean and only appropriate for between group comparisons.
Figure 2 shows responding over time in the probe trials (CS presentations without the US) of the final two conditioning sessions (Days 4 and 5) for each group. Mean food-cup responding was averaged over 10ths of the CS (i.e., each second of the 10-s CS in Group 120/10 [top] and over 6-s blocks of the probe CS in Groups 120/60 [middle] and 720/60 [bottom]). Consistent with the data shown in Figure 1, Group 120/10 responded more than Groups 120/60 and 720/60, and more important, responding was relatively uniform throughout the CS. A Group by Time Block ANOVA found a significant effect of group, F(2, 21) = 10.02, MSE = 1.16, p =.001, ηp2 = .49, 95% CIs [.13, .65], but no effect of time block or interaction, largest F(18, 189) = 1.49, MSE = 0.25. The dashed lines in each panel represent pre-CS responses. For Group 120/10 (top), pre-CS responses were counted for each second of the 10 s immediately preceding of the final two probe CS presentations. For Groups 120/60 (middle) and 720/60 (bottom), the average number of food cup entries in the final ten 6-s blocks prior to the probe CS are shown. Groups did not differ in food cup responding in the ITI periods immediately preceding the final two probe CS presentations. A Group by Block ANOVA found no reliable effects, largest F(2, 21)= 1.89, MSE = 0.20.
Figure 2. Results of Experiment 1: Probe trials.
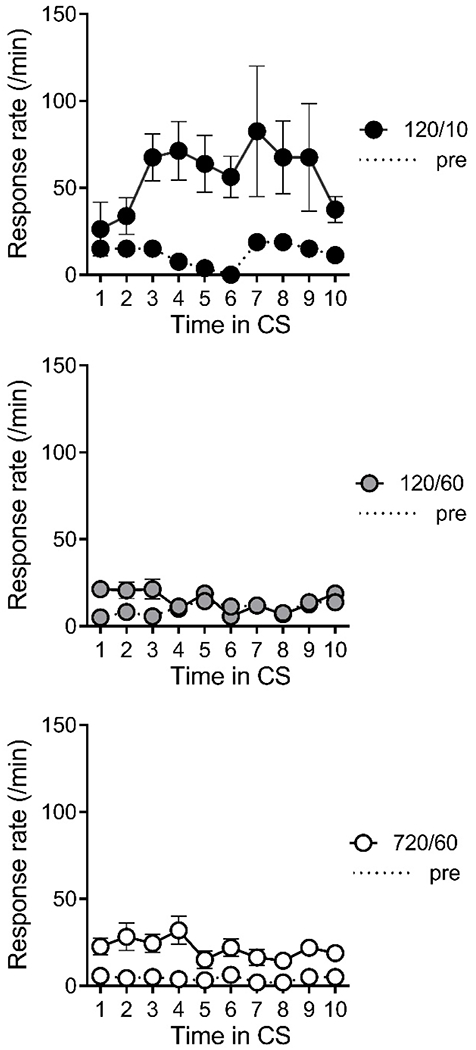
Note. Food cup entry rate (per second) in the CS (solid lines) and pre-CS periods (dashed lines) across time in probe trials (CS presentations without the US) during the final two sessions. Mean number of food cup entries during each 10th of the CS (i.e., each second of the 10-s CS in Group 120/10 and over 6-s blocks of the probe CS in Groups 120/60 and 720/60). Error bars are the standard error of the mean and only appropriate for between group comparisons.
The median number of reinforcers to the acquisition criterion (elevation score of 1.5 or more on three consecutive 4-trial blocks) was 6, 10, and 10 for Groups 120/10, 120/60, and 720/60. A nonparametric Kruskal-Wallis test returned a significant value of 12.06, p = .002. Dunn’s multiple comparisons found a significant difference between Groups 120/10 and 120/60, p = .001, a marginal difference between Groups 120/10 and 720/60, p = .053, and no difference between Groups 120/60 and 720/60, p = .706.
Common Test
Figure 3 summarizes mean food cup entry rates in the CS and pre-CS periods during the common test separately for the (averaged) three test trials at each combination of I and T. The between-group pattern was clearly consistent across the tested combinations. In each panel, Group 120/10 showed the highest response rate, whereas Groups 120/60 and 720/60 showed a similar and lower rates of responding. We compared CS response rates with a Group (120/10, 120/60, 720/60) by Tested I/T combination (120/10, 120/60, 720/10) ANOVA. The analysis found significant effects of Group, F(2, 21) = 12.21, MSE = 597.79, p < .001, ηp2 = .54, 95% CIs [.18, .69], Test I/T combination, F(2, 42) = 14.69, MSE = 78.13, p < .001, ηp2 = .41, 95% CIs [.17, .56], and a significant interaction, F(4, 21) = 7.99, p < .001, ηp2 = .43, 95% CIs [.20, .71]. To assess the interaction, response rate in each I/T combination was compared for each group in separate repeated-measures ANOVAs. For Group 120/10, the analysis indicated statistically significant different levels of responding across I/T combinations, F(2, 14) = 12.34, MSE = 187.45, p = .001, and a significant linear trend, F(1, 7) = 19.10, MSE = 213.89, p = .003, suggesting higher response rate on the 10 s test trials in comparison to the 60 s test trials. Follow up comparisons suggested that responding in 120/10 trials was significantly greater than in 120/60 trials, F(1, 7) = 8.87, MSE = 305.74, p = .021, and 720/60 trials, F(1, 7) = 19.10, MSE = 213.89, p = .003, and responding did not significantly differ in 120/60 and 720/60 trials, F(1, 7) = 3.28, MSE = 42.73, p = .113. For Groups 120/60 and 720/60, the analysis did not suggest different levels of responding across test trial I/T or linear trend (in parentheses), Group 120/60: F(2, 14) = 2.30, MSE = 16.71, p = .137 (F[1, 7] = 2.82, MSE = 27.17, p = .137), Group 720/60: F(2, 14) = 1.46, MSE = 30.21, p = .265 (F[1, 7] < 1). The same ANOVA on pre-CS response rates found no reliable effects, largest F(2, 42) = 1.84, MSE = 74.44.
Figure 3. Results of Experiment 1: Common test.

Note. Mean food cup entries in the common test (collapsed across CS duration; see text) of Experiment 1. Error bars are the standard error of the mean and only appropriate for between group comparisons.
Planned one-way ANOVAs on CS response rates in each I/T combination found reliable group differences in all combinations: 120/10 trials, F(2, 21) = 15.24, MSE = 382.14, p < .001; 120/60 trials, F(2, 21) = 7.72, MSE = 207.04, p = .003; and 720/60 trials, F(2, 21) = 6.84, MSE = 164.85, p = .005. Planned contrasts further assessed the source of the difference in each I/T combination. For 120/10 and 120/60 trials, the contrasts revealed that Group 120/10 differed from Groups 120/60 and 720/60, largest p = .02, and that Groups 120/60 and 720/60 were not different, smallest p = .23. For 720/60 trials, a planned contrast found that Group 120/10 differed from Group 120/60, but did not reliably differ from Group 720/60, p = .13. Further, Group 720/60 differed marginally from Group 120/60, p = .05.
Discussion
Acquisition of conditioned responding clearly differed between the groups conditioned with the same I/T ratio (Groups 120/10 and 720/60). Instead, the absolute duration of the CS had a more significant role. Group 120/10 acquired the strongest conditioned responding, and the groups conditioned with the 60-s CS duration (Groups 120/60 and 720/60) showed similarly low levels of conditioned responding during conditioning and in the common test. Although there was an effect of the tested I/T during the common test, it was due to diminished responding during the extended 60-s CSs tested in the 120/10 group, which was presumably a result of extinction occurring during the extended (60-s) CS presentations. The fact that the groups still differed based on their conditioning treatments during the common test indicated an effect of CS duration on learning. The results are on the whole consistent with other studies that found effects of CS duration over and above I/T (Holland, 2000; Kirkpatrick & Church, 2000; Lattal, 1999), and extend such findings to a procedure that used variable CS-US intervals to prevent differences in US timing within the CS to make comparisons across CSs of different durations difficult.
Experiment 2
In the previous experiment, groups that received conditioning with the 60-s CS showed only weak evidence of conditioning. This result could have been due to the fact that the groups had I/T ratios of only 2 and 12. That is, it is possible that an even higher I/T ratio could overcome the effect of the 60-s CS duration and allow it to produce better conditioning. Experiment 2 was therefore designed to further compare the effects of manipulating the large differences in both I and I/T in a factorial design. Rats received conditioning with either a 10-s or 60-s CSs with I/T ratios of either 12 or 72. It may be worth noting that 72 is the highest I/T ratio that has been tested in the studies that have manipulated I and T in appetitive conditioning (Holland, 2000; Lattal, 1999; Ward et al., 2012). It would be interesting and perhaps significant if the 60-s CS still did not acquire much conditioning with such a generous ratio.
Method
Subjects and Apparatus
The subjects were 32 naive female Wistar rats obtained from the same provider as in Experiment 1. They were approximately 80-90 days old at the start of the experiment. The rats were housed and maintained under the same conditions as in Experiment 1. The apparatus was the same as that described in Experiment 1.
Procedure
Magazine training
On Day 1, all rats were trained to eat food pellets from the food cup. The session lasted 30 min and the rats received an average of 30 free pellets at variable intervals during the session.
Conditioning
On Day 2, each rat was assigned to one of four groups (n = 8) that differed in CS and ITI durations. Each group received two reinforced CS presentations in each session. There were no probe trials. Each CS was divided into 8 equal-duration blocks, and one block was selected without replacement to precede the US on each trial. Group 120/10 (I/T = 12) received a 10 s CS following a variable 120 s ITI with the US delivered after one of eight 1.25-s intervals following CS onset. Group 720/10 (I/T = 72) received presentations of 60-s CS separated by a variable 720 s ITI with the US delivered following one of eight 1.25 s intervals following CS onset. Group 720/60 (I/T = 12) received 60-s CS presentations separated by a variable 720 s ITI with the US was delivered following one of eight 7.5-s intervals. Group 4320/60 (I/T = 72) received 60-s CS presentations separated by a variable 4,320-s (72-min) ITI with the US was delivered following one of eight 7.5 s intervals. The conditioning phase lasted for 20 sessions (40 trials). Mean session duration was 4.3 min, 24.3 min, 26.0 min, and 146.0 min for Groups 120/10, 720/10, 720/60, and 4320/60, respectively.
Common Test
On Day 22, all rats received a test session that contained one presentation of each CS and ITI combination (120/10, 720/10, 720/60, and 4320/60). Rats were tested in four squads, each composed of 2 rats from each conditioning group. The order of presentation ensured that trials were presented in each possible test trial position equally across test groups (cf. Lattal, 1999).
Results
Conditioning
Food cup entry rates in the CS prior to the delivery of the US and pre-CS periods are summarized in Figure 4. For each group, response rate in the CS increased across the conditioning phase, although Groups 120/10 and 720/10 clearly had the highest response rates and Groups 720/60 and 4320/60 had the lowest. A CS duration (10 s, 60 s) by I/T ratio (12, 72) by Block (10) ANOVA found a significant effect of CS duration, F(1, 28) = 11.45, MSE = 823.33, p = .002, ηp2 = .29, 95% CIs [.05, .50], Session, F(9, 252) = 10.46, MSE = 87.14, p < .001, ηp2 = .27, 95% CIs [.16, .33], and a CS duration by Session interaction, F(9, 252) = 7.05, p < .001, ηp2 = .20, 95% CIs [.10, .26], No effect or interaction involving the I/T ratio factor approached significance, Fs < 1. At the end of the conditioning phase, groups trained with shorter relative CS and ITI durations (120/10 and 720/60) responded at a higher rate during the pre-CS period. A CS duration by I/T ratio by Block ANOVA found a significant effect of I/T ratio F(1, 28) = 6.99, MSE = 134.81, p = .01, ηp 2 = .20, 95% CIs [.01, .42], but no other effects or interactions, largest F = 2.15. This effect of I/T ratio is consistent with a role of ITI duration (see Experiment 1), which was longer in the groups with larger ET ratios.
Figure 4. Results of Experiment 2: Conditioning.

Note. Food cup entries per minute (Response rate) in the CS and pre-CS period (pre) across 4-trial blocks during conditioning.
The median number of reinforcers to the acquisition criterion was 7, 6, 10, and 9.5 for Groups 120/10, 720/10, 720/60, and 4320/60. A nonparametric Kruskal-Wallis test indicated significant differences, χ2(3)= 13.55, p = .003. Follow up Dunn’s multiple comparisons found a significant difference between Groups 720/10 and 720/60, p = .003.
Common Test
Figure 5 depicts the mean food cup entry rates in the CS and pre-CS periods during each tested ET combination. We compared CS response rate in each tested ET combination with a Training CS duration (10 s, 60 s) by ET ratio (12.0, 72.0) by Test ET combination (120/10, 720/10, 720/10, 4320/60) ANOVA. The analysis found a significant effect of CS duration used during conditioning, F(1, 28) = 16.17, MSE = 393.98, p < .001, ηp2 = .37, 95% CIs [.09, .56], and no other effects or interactions, largest F(3, 84) = 1.51, MSE = 77.69. The same analysis applied to pre-CS response rates found no statistically significant differences, largest F(3, 84) = 1.77, MSE = 59.12.
Figure 5. Results of Experiment 2: Common test.

Note. Mean food cup entries per minute in the common test (separated by ITI/CS duration tested; see text). Error bars are the standard error of the mean and only appropriate for between group comparisons.
Planned CS Duration by ET Ratio ANOVAs were conducted for each tested ET combination. Each analysis returned a statistically significant effect of CS duration, ps = .009 − .001 ηp2 = .22 − .34, and no effects of ET ratio, Fs < 1. The same analyses applied to pre-CS responding found no significant effects, largest F(1, 28) = 2.81, MSE = 28.97.
Discussion
Consistent with Experiment 1, CS duration, rather than ET ratio, was the factor that influenced responding during acquisition. The present experiment further demonstrated that responding with each of the two CS durations was similar despite a large difference (6x) in the I/T ratio. And once again, the common tests suggest that the effect of CS duration was on learning rather than performance. Although the trials to criterion results were somewhat more ambiguous (see General Discussion), the results continue to suggest that CS duration can contribute to learning in a manner that is independent of I/T.
Experiment 3
Experiments 1 and 2 clearly demonstrate an effect of CS duration on the acquisition of responding across a range of I/T ratios. Notably, a 60-s CS was never able to support much conditioned responding, even with a high I/T ratio of 72. To further characterize the effect of CS duration in this preparation, Experiment 3 examined intermediate CS durations between 10-s and 60-s while controlling for I/T. Groups were conditioned with either a 10-s, 27-s, 43-s, or 60-s CS with ITI durations that maintained an I/T ratio of 12.
Method
Subjects and Apparatus
The subjects were 32 naive female Wistar rats obtained from the same provider as in Experiments 1 and 2. They were approximately 80-90 days old at the start of the experiment. The maintenance conditions and apparatus were the same as in the preceding experiments.
Procedure
Magazine training
On Day 1, all rats were trained to eat food pellets from the food cup. The session lasted 30 min and the rats received an average of 30 pellets during the session.
Conditioning
On Day 2, each rat was assigned to one of four groups (n = 8). Each group received eight reinforced CS presentations in each of five sessions. There were no probe trials. As usual, each CS was divided into 8 equal blocks, and one block was selected without replacement to precede the US on each trial. Group 120/10 (I/T = 12) received a 10-s CS following a variable 120-s ITI with the US delivered after one of eight 1.25-s intervals following CS onset. Group 320/27 (I/T = 12) received presentations of 27-s CS separated by a variable 320-s ITI with the US delivered following one of eight 3.37-s intervals following CS onset. Group 520/43 (I/T = 12) received 43-s CS presentations separated by a variable 520-s ITI with the US was delivered following one of eight 5.37-s intervals. Group 720/60 (I/T = 12) received 60-s CS presentations separated by a variable 720-s ITI with the US was delivered following one of eight 7.5-s intervals. Session duration was 17.3 min, 46.3 min, 75.1 min, and 104.0 min for Groups 120/10, 320/27, 520/43, and 720/60.
Common Test
On Day 7 all rats received a test session consisting of two presentations of each combination of CS and ITI duration (120/10, 320/27, 520/43, and 720/60). Rats were tested in four squads, each composed of 2 rats from each conditioning group. The order of presentation ensured that trials were presented in each possible test trial position equally across test groups.
Results
Conditioning
Figure 6 illustrates food cup entry rates in the CS prior to the delivery of the US and during the pre-CS period are shown over 4-trial blocks. For each group, response rate in the CS increased over the conditioning phase. A Group by Block ANOVA on CS responding found a significant effect of block, F(9, 252) = 11.79, MSE = 64.72, p < .001, ηp2 = .30, 95% CIs [.18, .36], but no effect of group, F(3, 28) = 1.74, MSE = 828.35, or interaction, F(9, 252) = 1.28. In the pre-CS periods, response rate tended to be highest in Group 120/10, which also showed an abrupt (and inexplicable) increase in pre-CS responding in the eighth 4-trial block. A Group by Block ANOVA found significant effects of group, F(3, 28) = 5.49, MSE = 144.65, p = .004, ηp2 = .37, 95% CIs [.05, .53], block, F(9, 252) = 2.39, MSE = 37.80, p = .01, ηp2 = .08, 95% CIs [.00, .12], and group by block interaction, F(27, 252) = 1.79, p = .01, ηp2 = .16, 95% CIs [.01, .16], However, the groups did not differ in pre-CS responding in the final session of the phase, F(3, 28) = 1.17, MSE = 42.51, p = .330.
Figure 6. Results of Experiment 3: Conditioning.

Note. Food cup entries per minute (Response rate) in the CS and pre-CS period (pre) across 4-trial blocks during training. Error bars are standard error of the mean and only appropriate for between comparison.
The median number of 4-trial blocks required to reach the acquisition criterion (elevation score of 1.5 or more on three consecutive 4-trial blocks) was 10, 7, 9.5, and 10 for Groups 120/10, 320/27, 520/43, and 720/60. A Kruskal-Wallis test suggested that the median trials to acquisition differed among groups, χ2(3) = 11.26, p = 0.010, and follow up comparisons (Dunn’s test) found a significant difference between Groups 320/27 and 720/60, p = .013. It is worth noting that the median for Group 120/10 was anomalous when it was compared with the medians of the similar 120/10 groups in Experiments 1 and 2 (6 and 7, respectively). (The anomaly was due at least in part to the extraordinarily high level of pre-CS responding recorded during trial-block 8 shown in Figure 6). We analyze the data across all of the present experiments in the General Discussion.
Common Test
Mean food cup entry rates in the CS and pre-CS periods during the common test are shown in Figure 7. Responding in the CS tended to be weakest in Group 720/60. A Group (120/10, 320/27, 520/43, 720/60) by Test I/T Combination (120/10, 320/27, 520/43, 720/60) ANOVA found no reliable differences among the trial types, F(3, 84) = 1.13, MSE = 46.42. However, there was modest evidence of a decreasing linear trend across the increasing CS durations of conditioning, F(1, 28) = 3.38, p = .077. A Group by I/T combination ANOVA did not find differences in mean response rate in the pre-CS periods, F < 1. After collapsing the data over test I/T combination, planned pairwise tests provided marginal evidence for lower responding in Group 720/60 than Groups 120/10, p = .056, 320/27, p = .062, and 520/43, p = .065, which did not differ from one another, smallest p = .864. Nonetheless, when Groups 120/10, 320,27 and 520/43 were pooled and compared to Group 720/60, the difference was significant, F(1, 30) = 5.77, MSE = 176.52, p = .023. To further assess possible group differences in the ability of the CS to increase responding above baseline, elevation scores were calculated as the difference in responding in the CS and during the pre-CS period (e.g., Sunsay & Bouton, 2008). Mean elevation scores were 19.2, 21.5, 20.9, and 8.6 in Groups 120/10, 320/27, 3520/47, and 720/60. Here the linear trend was significant, F(1, 28) = 4.32, p = .047, and Group 720/60 differed from Groups 120/10, p = .006, 520/43, p = .007, and 320/27, p =.051. Groups 120/10, 320/27, and 520/43 did not differ from one another, ps > .76.
Figure 7. Results of Experiment 3: Common test.

Note. Mean food cup entry rates in the common test (collapsed across CS duration; see text). Error bars are the standard error of the mean and only appropriate for between group comparisons.
Discussion
The results suggest that CS durations of less than 60 s produce better conditioning than the 60-s CS when I/T is controlled, and there was evidence of a statistically linear increase in conditioned responding as the CS duration decreased from 60 s. We analyze the linear trend further in the General Discussion. The poor responding in Group 720/60 continues to suggest that the ability of a 60-s CS to support conditioned foodcup responding is not good.
The approach taken here was similar to that employed by Holland (2000, Experiment 2), who studied CS durations that varied from 20- to 160-s while maintaining an I/T ratio of 6.0. As here, Holland found that conditioned responding decreased with increases in CS duration. The present results extend those results to conditioning with shorter CSs and an I/T ratio of 12. They also provide unique evidence to suggest a role for CS duration with a trials-to-criterion measure and when conditioning is conducted with variable CS-US intervals.
General Discussion
The present experiments varied I and T durations in appetitive conditioning with a procedure that used variable CS-onset-to-US intervals. The results provide new support for the role of CS duration that appears to be independent of either I or I/T. Experiment 1 found that conditioning with a six-fold difference in CS duration produced different levels of responding to the CS, whereas a similar six-fold difference in I/T ratio had no effect. Experiment 2 extended that finding, and showed that a 60-s CS still showed little ability to control conditioned responding when the ITI was sextupled to yield an unusually large I/T ratio of 72. The results of Experiment 3 suggested that CSs with durations that increased from 10 to 60 s showed a statistically linear decrease in conditioning even when the I/T ratio was controlled. In each experiment, the rats also responded during common tests with different combinations of I and T according to the parameters that had been used during conditioning rather than testing. The pattern thus suggests that the effect of CS duration was on learning rather than performance. Overall, the results are more consistent with a conditioning theory that emphasizes independent contributions of CS and ITI duration on learning (e.g., Wagner, 1981) than theories that emphasize the relative durations of CS and ITI (e.g., Gallistel & Gibbon, 2000).
Reinforcers to Criterion
As noted earlier, theories that emphasize I/T actually suggest that the effect of variations of I/T will be to change the point in conditioning at which the organism decides to begin responding to the CS. In addition to the rate of responding supported by different combinations of CS and ITI durations, we therefore also inferred the decision point by analyzing the number of reinforcers it took to reach a response criterion. Such a measure has been widely used to provide an index of the animal’s decision point (e.g., Balsam & Payne, 1979; Gallistel & Gibbon, 2000; Gibbon et al., 1977, 1980; Gibbon & Balsam, 1981), and has also been used in prior work in this laboratory (Bouton & Sunsay, 2003; Morris & Bouton, 2006, Sunsay et al., 2004). We did not use the decision-point algorithm suggested by Gallistel et al. (2004) because Harris (2011) has shown that the algorithm identifies artifactual change points when random jitter is added to simulations using smooth curves.
The top panel of Figure 8 summarizes the median number of reinforcers to criterion (elevation score of 1.5 or more on three 4-trial blocks; cf. Morris & Bouton, 2006; Sunsay & Bouton, 2003) plotted for each group in each experiment as a function of CS duration. The line is the regression line, slope = 0.056, R2 = .586, which significantly deviated from zero, F(1, 9) = 12.72, p =.006. Across all of the present experiments, CS duration was thus a good predictor of median trial-blocks to criterion, Spearman’s rank correlation rs = .69, p = .023 (Pearson’s r = .76, p = .006). The lower panel of the figure replots the same data as a function of I/T ratio. The line again represents the regression, slope = −0.019, R2 = .087, which here did not deviate from zero, F(1, 9) < 1. As the figure suggests, there was no correlation between the I/T ratio and median trial blocks to criterion, Spearman’s rank correlation rs = −.54, p = .232 (Pearson’s r = −.29, p = .477). When the results are summarized this way, it is again clear that the effect of CS duration (T) was independent of I/T ratio in determining the acquisition of responding in the present experiments.
Figure 8. Correlation Between Blocks to Criterion and CS Duration, and I/T ratio.

Note. Median number of 4-trial blocks for each group in all experiments to reach the reinforcers to acquisition criterion (three consecutive blocks with an elevation score greater than 1.5). The top panel shows median blocks to criterion as a function of CS duration, and the bottom panel shows blocks to criterion as a function of I/T ratio. The lines are regression lines.
SOP Theory
As described in the Introduction, Wagner’s SOP theory suggests that short CS durations support stronger conditioning because a greater number of CS elements are still in a state of focal activation (A1) at the moment the US is presented. The results of the present experiments are consistent with this approach. It is worth noting that, according to SOP, the function relating conditioning to CS duration should eventually become flat as the CS-US interval reaches a point at which the proportion of CS elements available to go to A1 (after decaying from A2 to the Inactive state) reaches an equilibrium set by the probabilities of elements decaying from A2 to Inactivity and then being activated from Inactivity to A1 (Brandon, Vogel, & Wagner, 2003; Mazur & Wagner, 1982; Wagner, 1981). SOP thus predicts that increasing the CS duration will no longer cause a further decrease in conditioning after a critical duration. This prediction was not specifically tested here.
It is notable that our procedure arranged fixed-duration CS presentations with US presentation following an unpredictable time within the CS. We used this method in an attempt to reduce the development of timed responding during the CS (Figure 2; see also Harris et al., 2011). Interestingly, SOP suggests that US presentation during the CS could result in some inhibitory conditioning of the CS, because US presentation could put more US elements in A2 (after decaying from A1) while CS elements are in A1, the conditions that promote inhibitory learning. With a short duration CS, conditioning is strong and most of the US elements will be activated by the CS into A2 before the US is presented. With a long-duration CS, however, conditioning is weaker and fewer US elements are in A2 when the US is presented. This could allow US presentation to put more US elements into A2 (after decaying from A1) while some CS elements are in A1 and produce some inhibitory conditioning of the CS. It is possible that such a mechanism could have further influenced the CS duration effect observed here, although it is worth remembering that this is an SOP mechanism, and not a factor considered by models emphasizing I/T.
Although Experiment 2 found little effect of manipulating ITI duration, compared with CS duration, we and others have examined several effects of varying ITI duration that are consistent with predictions of SOP (e.g., Bouton & Sunsay, 2003; Ewing, Larew, & Wagner, 1985; Rescorla & Durlach, 1987; Sunsay & Bouton, 2008). For instance, with ITIs of under 240 s (e.g., 60 s), a memory of CS or US may still be in A2 and cause inferior conditioning and/or performance (Bouton & Sunsay, 2003; Sunsay et al., 2004). In the present method, ITIs of over 240 s may no longer support such self-generated priming (Bouton & Sunsay, 2003; Sunsay et al., 2004). Beyond 240 s, additional context exposure that occurs when the ITI is further increased may cause an increase conditioning by reducing (extinguishing) retrieval-generated priming by the context (Sunsay & Bouton, 2008). For example, removal of the rat from the context during long ITIs removed the benefit of a long ITI, presumably because it prevented the extinction of contextual retrieval-generated priming (Sunsay & Bouton, 2008, Experiment 2). The present results thus join several other findings in suggesting that SOP theory can provide a reasonable account of both CS and ITI duration effects.
CS Duration and the Form of the Conditioned Response
On the other hand, it is worth noting that the present finding that a 60-s CS did not support much appetitive conditioning contrasts with the known effectiveness of 60-s CSs in aversive conditioning. For example, in the conditioned suppression method, CSs of 60-s durations are common and support excellent conditioning with ITIs of 3-20 min (Bouton & Bolles, 1980; Bouton, 1984; Reberg & LeClerc, 1977; Swartzentruber & Bouton, 1992; Williams, Travis, & Overmier, 1986). Many classic conditioned suppression experiments use CSs that are even longer than 60 s (Annau & Kamin, 1961; Rescorla, 1968). It seems clear that a 60-s CS can support robust conditioning in fear or emotional conditioning as opposed to the appetitive foodcup-entry method used here.
Trial or CS duration is known to have important effects on the nature or form of the conditioned response. For example, in an early study with rabbits, Vandercar and Schneiderman (1967) found that as CS duration increased from only 0.25 s to 6.75 s, the conditioned eyeblink response essentially disappeared while respiration and heart rate responses increased. Instead of weakening conditioning, increasing the CS duration thus changed the qualitative nature of the conditioned response. Related results have been demonstrated with sexual conditioning in the male Japanese quail (Akins, Domjan, & Gutierrez, 1994; see also Akins, 2000). In those studies, the CS was presentation of a foam block, and the US was the opportunity to copulate with a female. With a short CS (e.g., 1 min), the conditioned response was approaching the location of the CS; with a 20-min CS, the birds showed less of that behavior, and acquired a response consisting of pacing from one side of the chamber to the other. (Subsequent experiments found that CSs conditioned with different I/T ratios might also generate qualitatively different conditioned responses but did not directly contrast I/T and CS duration, Burns & Domjan, 2001). The different CRs conditioned to the 1-min and 20-min CS are thought to be consistent with behavior systems theory (Timberlake & Lucas, 1989; Timberlake, 1994, 2001). In the Japanese quail, the form of the conditioned sexual response acquired with a 1-min CS may reflect focal search behavior, which is adaptive when the US is close in time or space (Timberlake & Lucas, 1989). In contrast, the pacing behavior acquired with a 20-min CS may be related to the animal’s general search mode, which may be more adaptive when the US is temporally or spatially distant (Timberlake & Lucas, 1989; Timberlake, 2001). All told, the results contrast with the idea that longer CSs lead to weaker conditioning. Instead, they may support a different conditioned response.
It is thus possible that longer CSs in the present preparation supported unmeasured conditioned responses that differed from foodcup entry behavior. We investigated the possible influence of response topography by studying videotapes of the animals’ behavior recorded during each experiment’s common test sessions (not shown). These analyses failed to uncover systematic differences in general activity (e.g., crossing the center of the chamber), head jerking, pacing, or rearing to the source of the tone that were related to CS duration. We should note again, however, that the CS-US interval was varied from trial to trial in the present method. The method caused a uniform pattern of food-cup responding over time (Figure 2; see also Harris et al., 2011), and this (or just the CS-US interval variability itself) could have reduced our ability to detect differences in behavior controlled by the different CS durations. To our knowledge, the effect of variable CS-US intervals on the qualitative form of the conditioned response has not been studied.
Timberlake (1994) noted that the behavior systems approach aligns with Konorski’s (1967) suggestion that Pavlovian conditioning with long and short CS-US intervals can support so-called preparatory and consummatory conditioned responses, respectively. Konorski’s (1967) theorizing was in turn part of the inspiration for an affective extension of SOP (AESOP) that proposed that the US is represented by two nodes corresponding to the sensory and emotional features of the US (Wagner & Brandon, 1989). The CS was assumed to enter into separate associations with both the sensory and the emotional US node, and activation of these nodes by CS presentation could therefore control different sensory and emotional conditioned responses. Elements in the emotive US node are assumed to move between A1, A2, and inactivity at a slower rate than elements in the sensory US node. Wagner and Brandon (1989) suggest that the difference has implications for behaviors generated by emotional versus sensory node activity and to differences in CRs with different CS-US intervals. However, they also noted that AESOP does not perfectly correspond with Konorski’s idea of conditioning of preparatory and consummatory CRs with long and short CS durations. Nonetheless, appetitive general search and focal search behaviors to long and short CSs could be conceptualized as reflecting activity evoked by different functional nodes in an SOP framework (Wagner & Brandon, 1989). Such an approach has yet to be developed in any detail.
Conclusions
The present experiments studied the influence of CS duration and I/T ratio on appetitive Pavlovian conditioning in rats. Overall, there was a clear effect of CS duration that was independent of the ITI or the I/T ratio. This result was true when we analyzed the rate of foodcup entries during conditioning or during tests with common combinations of CS duration and ITI. And it was also true when we utilized a reinforcers-to-criterion measure (Figure 8). The results consistently indicate that CS duration was important in determining the conditioned response. Its independence of I or I/T is more consistent with the approaches taken by SOP theory (Wagner, 1981) or behavior systems theory (e.g., Timberlake, 2001) than it is with rate estimation theory (e.g., Gallistel & Gibbon, 2002).
Acknowledgments
The research was supported by NIH Grants RO1 DA033123 (M.E.B), K01 MH116158 (T.P.T). and K01 DA044456 (E.A.T.).
References
- Akins CK (2000). Effects of species-specific cues and the CS-US interval on the topography of the sexually conditioned response. Learning and Motivation, 31, 211–235. 10.1006/lmot.2000.1050 [DOI] [Google Scholar]
- Akins CK, Domjan M, & Gutierrez G (1994). Topography of sexually conditioned behavior in male Japanese quail (Coturnix japonica) depends on the CS-US interval. Journal of Experimental Psychology: Animal Behavior Processes, 20, 199–209. 10.1037/0097-7403.20.2.199 [DOI] [PubMed] [Google Scholar]
- Annau Z, & Kamin LJ (1961). The conditioned emotional response as a function of intensity of the US. Journal of Comparative and Physiological Psychology, 54, 428–432. 10.1037/h0042199 [DOI] [PubMed] [Google Scholar]
- Balsam PD, Drew MR, & Gallistel CR (2010). Time and Associative Learning. Comparative Cognition & Behavior Reviews, 5, 1–22. 10.3819/ccbr.2010.50001 [DOI] [PMC free article] [PubMed] [Google Scholar]
- Balsam PD, & Gallistel CR (2009). Temporal maps and informativeness in associative learning. Trends in Neurosciences, 32, 73–78. 10.1016/i.tins.2008.10.004 [DOI] [PMC free article] [PubMed] [Google Scholar]
- Balsam PD & Payne D (1979). Intertrial interval and unconditioned stimulus durations in autoshaping. Animal Learning & Behavior, 7, 477–482. 10.3758/BF03209705 [DOI] [Google Scholar]
- Barnet RC, Grahame NJ, & Miller RR (1995). Trial spacing effects in Pavlovian conditioning: A role for local context. Animal Learning & Behavior, 23, 340–348. 10.3758/BF03198931 [DOI] [Google Scholar]
- Bouton ME (1984). Differential control by context in the inflation and reinstatement paradigms. Journal of Experimental Psychology: Animal Behavior Processes, 10, 56–74. 10.1037/0097-7403.10.1.56 [DOI] [Google Scholar]
- Bouton ME & Bolles RC (1980). Conditioned fear assessed by freezing and by the suppression of three different baselines. Animal Learning & Behavior 8, 429–434. 10.3758/BF03199629 [DOI] [Google Scholar]
- Bouton ME, & Sunsay C (2003). Importance of trials versus accumulating time across trials in partially reinforced appetitive conditioning. Journal of Experimental Psychology: Animal Behavior Processes, 29, 62–77. 10.1037/0097-7403.29.1.62 [DOI] [PubMed] [Google Scholar]
- Brandon SE, Vogel EH, & Wagner AR (2003). Stimulus representation in SOP: I: Theoretical rationalization and some implications. Behavioural Processes, 62, 5–25. 10.1016/S0376-6357(03)00016-0 [DOI] [PubMed] [Google Scholar]
- Burns M, & Domjan M (2001). Topography of spatially directed conditioned responding: Effects of context and trial duration. Journal of Experimental Psychology: Animal Behavior Processes, 27, 269–278. 10.1037/0097-7403.27.3.269 [DOI] [PubMed] [Google Scholar]
- Ewing MF, Larew MB, & Wagner AR (1985). Distribution-of-trials effects in Pavlovian conditioning: An apparent involvement of inhibitory backward conditioning with short intertrial intervals. Journal of Experimental Psychology: Animal Behavior Processes, 11, 537–547. 10.1037/0097-7403.11.4.537 [DOI] [Google Scholar]
- Gallistel CR, Fairhurst S, & Balsam P (2004). The learning curve: implications of a quantitative analysis. Proceedings of the National Academy of Sciences, 101, 13124–13131. 10.1073/pnas.0404965101 [DOI] [PMC free article] [PubMed] [Google Scholar]
- Gallistel CR, & Gibbon J (2000). Time, rate, and conditioning. Psychological Review, 107, 289–344. 10.1037/0033-295X.107.2.289 [DOI] [PubMed] [Google Scholar]
- Gibbon J, Baldock MD, Locurto C, Gold L, & Terrace HS (1977). Trial and intertrial durations in autoshaping. Journal of Experimental Psychology: Animal Behavior Processes, 3, 264–284. 10.1037/0097-7403.3.3.264 [DOI] [Google Scholar]
- Gibbon J, & Balsam PD (1981). Spreading association in time In Locurto CM, Terrace HS, & Gibbon J (Eds.), Autoshaping and conditioning theory (pp. 219–253). Academic Press. [Google Scholar]
- Gibbon J, Farrell L, Locurto CM, Duncan HJ, & Terrace HS (1980). Partial reinforcement in autoshaping with pigeons. Animal Learning & Behavior, 8, 45–59. 10.3758/BF03209729 [DOI] [Google Scholar]
- Harris JA (2011). The acquisition of conditioned responding. Journal of Experimental Psychology: Animal Behavior Processes, 37, 151–164. 10.1037/a0021883 [DOI] [PubMed] [Google Scholar]
- Harris JA, & Bouton ME (In press). Pavlovian conditioning under partial reinforcement: The effects of non-reinforced trials versus cumulative CS duration. Journal of Experimental Psychology: Animal Learning and Cognition. [DOI] [PubMed] [Google Scholar]
- Harris JA, & Carpenter JS (2011). Response rate and reinforcement rate in Pavlovian conditioning. Journal of Experimental Psychology: Animal Behavior Processes, 37, 375–384. 10.1037/a0024554 [DOI] [PubMed] [Google Scholar]
- Harris JA, Gharaei S, & Pincham HL (2011). Response rates track the history of reinforcement times. Journal of Experimental Psychology: Animal Behavior Processes, 37, 277–286. 10.1037/a0023079 [DOI] [PubMed] [Google Scholar]
- Holland PC (2000). Trial and intertrial durations in appetitive conditioning in rats. Animal Learning & Behavior, 28, 121–135. 10.3758/BF03200248 [DOI] [Google Scholar]
- Kirkpatrick K, & Church RM (2000). Independent effects of stimulus and cycle duration in conditioning: The role of timing processes. Animal Learning & Behavior, 28, 373–388. 10.3758/BF03200271 [DOI] [Google Scholar]
- Konorski J (1967). Integrative activity of the brain. University of Chicago Press [Google Scholar]
- Lattal KM. (1999). Trial and intertrial durations in Pavlovian conditioning: Issues of learning and performance. Journal of Experimental Psychology: Animal Behavior Processes, 25, 433–450. 10.1037/0097-7403.25.4.433 [DOI] [PubMed] [Google Scholar]
- Mackintosh NJ (1975). A theory of attention: variations in the associability of stimuli with reinforcement. Psychological Review, 82, 276–298. 10.1037/h0076778 [DOI] [Google Scholar]
- Mazur JE, & Wagner AR (1982). An episodic model of associative learning: Acquisition In Commons ML, Herrnstein RJ & Wagner AR (Eds.), Quantitative analyses of behavior (vol. 3, pp. 3–39). Ballinger Publishing. [Google Scholar]
- Morris RW, & Bouton ME (2006). Effect of unconditioned stimulus magnitude on the emergence of conditioned responding. Journal of Experimental Psychology: Animal Behavior Processes, 32, 371–385. 10.1037/0097-7403.32.4.371 [DOI] [PubMed] [Google Scholar]
- Pearce JM, & Hall G (1980). A model for Pavlovian learning: variations in the effectiveness of conditioned but not of unconditioned stimuli. Psychological Review, 87, 532–552. 10.1037/0033-295X.87.6.532 [DOI] [PubMed] [Google Scholar]
- Reberg D & Leclerc R (1977). A feature positive effect in conditioned suppression. Animal Learning & Behavior, 5, 143–147. 10.3758/BF03214069 [DOI] [Google Scholar]
- Rescorla RA (1968). Probability of shock in the presence and absence of CS in fear conditioning. Journal of Comparative and Physiological Psychology, 66, 1–15. 10.1037/h0025984 [DOI] [PubMed] [Google Scholar]
- Rescorla RA, & Durlach PJ (1987). The role of context in intertrial interval effects in autoshaping. The Quarterly Journal of Experimental Psychology Section B, 39, 35–48. 10.1080/14640748708402250 [DOI] [Google Scholar]
- Rescorla RA, & Wagner AR (1972). A theory of Pavlovian conditioning: Variations in the effectiveness of reinforcement and nonreinforcement In Black AH & Prokasy WF (eds.), Classical Conditioning II: Current Research and Theory (pp. 64–99). Appleton-Century-Crofts. [Google Scholar]
- Schneiderman N, & Gormezano I (1964). Conditioning of the nictitating membrane of the rabbit as a function of CS-US interval. Journal of Comparative and Physiological Psychology, 57, 188–195. 10.1037/h0043419 [DOI] [PubMed] [Google Scholar]
- Shannon CE (1948). A mathematical theory of communication. Bell Systems Technical Journal, 27, 379–423, 623–656. [Google Scholar]
- Sunsay C & Bouton ME (2008). Analysis of a trial-spacing effect with relatively long intertrial intervals. Learning & Behavior, 36, 104–115. 10.3758/LB.36.2.104 [DOI] [PubMed] [Google Scholar]
- Sunsay C, Stetson L, & Bouton ME (2004). Memory priming and trial spacing effects in Pavlovian learning. Animal Learning & Behavior, 32, 220–229. 10.3758/BF03196023 [DOI] [PubMed] [Google Scholar]
- Swartzentruber D & Bouton ME (1992). Context sensitivity of conditioned suppression following preexposure to the conditioned stimulus. Animal Learning & Behavior, 20, 97–103. 10.3758/BF03200406 [DOI] [Google Scholar]
- Timberlake W (1994). Behavior systems, associationism, and Pavlovian conditioning. Psychonomic Bulletin & Review, 1, 405–420. 10.3758/BF03210945 [DOI] [PubMed] [Google Scholar]
- Timberlake W (2001). Motivational modes in behavior systems In Mowrer RR & Klein SB (Eds.), Handbook of contemporary learning theories (pp. 155–209). Erlbaum. [Google Scholar]
- Timberlake W, & Lucas GA (1989). Behavior systems and learning: From misbehavior to general principles In Klein SB & Mowrer RR (Eds.), Contemporary learning theories: Instrumental conditioning theory and the impact of constraints on learning (pp. 237–275). Erlbaum. [Google Scholar]
- Vandercar DH, & Schneiderman N (1967). Interstimulus interval functions in different response systems during classical discrimination conditioning of rabbits. Psychonomic Science, 9, 9–10. 10.3758/BF03330733 [DOI] [Google Scholar]
- Wagner AR (1978). Expectancies and the priming of STM In Hulse SH, Fowler H, & Honig WK (Eds.), Cognitive processes in animal behavior (pp. 177–209). Erlbaum. [Google Scholar]
- Wagner AR (1981). SOP: A model of automatic memory processing in animal behavior In Spear NE & Miller RR (Eds.), Information processing in animals: Memory mechanisms (pp. 5–47). Erlbaum. [Google Scholar]
- Wagner AR, & Brandon SE (1989). Evolution of a structured connectionist model of Pavlovian conditioning (AESOP) In Klein SB & Mowrer RR (Eds.), Contemporary learning theories: Pavlovian conditioning and the states of traditional learning theory (pp. 149 −189). Erlbaum. [Google Scholar]
- Ward RD, Gallistel CR, Jensen G, Richards VL, Fairhurst S, & Balsam PD (2012). Conditioned stimulus informativeness governs conditioned stimulus-unconditioned stimulus associability. Journal of Experimental Psychology: Animal Behavior Processes, 38, 217–232. 10.1037/a0027621 [DOI] [PMC free article] [PubMed] [Google Scholar]
- Williams DA, Travis GM, & Overmier JB (1986). Within-compound associations modulate the relative effectiveness of differential and Pavlovian conditioned inhibition procedures. Journal of Experimental Psychology: Animal Behavior Processes, 12, 351–362. https://doi.Org/10.1037/0097-7403.12.4.351 [Google Scholar]