Abstract
The thalamic reticular nucleus (TRN), the major source of thalamic inhibition, is known to regulate thalamocortical interactions critical for sensory processing, attention and cognition1-5. TRN dysfunction has been linked to sensory abnormality, attention deficit and sleep disturbance across multiple neurodevelopmental disorders6-9. Currently, little is known about the organizational principles underlying its divergent functions. We performed an integrative study linking single-cell molecular and electrophysiological features of the mouse TRN to connectivity and systems-level function. We found that TRN cellular heterogeneity is characterized by a transcriptomic gradient of two negatively correlated gene expression profiles, each containing hundreds of genes. Neurons in the extremes of this transcriptomic gradient express mutually exclusive markers, exhibit core/shell-like anatomical structure and have distinct electrophysiological properties. The two TRN subpopulations make differential connections to the functionally distinct first-order and higher-order thalamic nuclei to form molecularly defined TRN-thalamus subnetworks. Selective perturbation of the two subnetworks in vivo revealed their differential role in regulating sleep. Taken together, our study provides a comprehensive atlas for TRN neurons at the single-cell resolution, and links molecularly defined subnetworks to the functional organization of the thalamo-cortical circuits.
The thalamic reticular nucleus (TRN) plays key roles in sensory processing, arousal and cognition 1-5. It consists of a shell of GABAergic neurons, receives inputs from cortical and subcortical regions, and provides the major inhibition to thalamocortical (TC) neurons4. During quiescence, the TRN participates in sleep rhythm generation, sleep stability and memory consolidation10,11 , while in active states, TRN neurons contribute to sensory filtering underlying attention3,12. TRN dysfunction may cause behavioral deficits in disorders including schizophrenia, autism and ADHD6-9. Despite its importance, little is known about the detailed molecular, cellular and functional organization of the TRN at the single-cell level, a prerequisite for understanding the broad function of TC circuits.
Though often treated as a homogeneous group of GABAergic neurons, studies increasingly suggest the existence of TRN neuron heterogeneity including molecular and electrophysiological properties, connectivity and function13-19. However, the nature of this heterogeneity as well as its potential role in shaping TC circuit function is unknown. We performed multi-scale single cell analyses to systematically examine the TRN neuron diversity by integrating transcriptomic profiling, electrophysiological recording, connectivity mapping, in situ localization, and in vivo functional perturbation. We find that TRN neurons cannot be separated into distinct subtypes defined by gene expression profiles. Rather, TRN neuron heterogeneity is characterized by a transcriptomic gradient of two negatively correlated expression profiles, each containing hundreds of genes. Neurons in the extremes of this transcriptomic gradient can be identified by the near-exclusive expression of a few marker genes including Spp1 (secreted phosphoprotein 1) and Ecel1 (endothelin converting enzyme like-1), allowing to categorize TRN neurons into two subpopulations (referred to as Spp1+ and Ecel1+ subpopulations). The two subpopulations exhibit distinct anatomical, physiological and functional features. Notably, the Spp1+ subpopulation preferentially projected to first order (FO) thalamic nuclei and had a high tendency to generate sustained rebound bursting. In contrast, the Ecel1+ subpopulation preferentially projected to higher order (HO) nuclei and had a low propensity to generate rebound bursts. Selective perturbation of the two subnetworks in vivo revealed their distinct role in regulating sleep. Taken together, our study provides a comprehensive atlas for TRN neurons at the single-cell resolution, and links systematically-identified genetic subnetworks to the functional organization of the mammalian forebrain.
Transcriptomic heterogeneity
We applied single nucleus RNA sequencing (snRNA-Seq) to identify transcriptomic profiles of possible neuronal subtypes. Consistent with previous studies20,21, nearly all TRN neurons are Pvalb+, whose expression highly overlapped with the Gad2 expression pattern across the entire TRN shown by RNA double-fluorescent in situ hybridization (FISH, Extended Data Fig. 1). We used micro-dissected TRN tissue from Pvalb-tdTomato transgenic mice22 for single nucleus cDNA library preparation23,24 (Fig. 1a). We analyzed the transcriptomes of 1687 nuclei, which had an average of 1.3×10⁶ mapped reads and a median library complexity of 3909 genes, comparable to previous studies23.
Figure 1. Single nuclei RNA-Sequencing reveals transcriptomic gradient of TRN neurons.
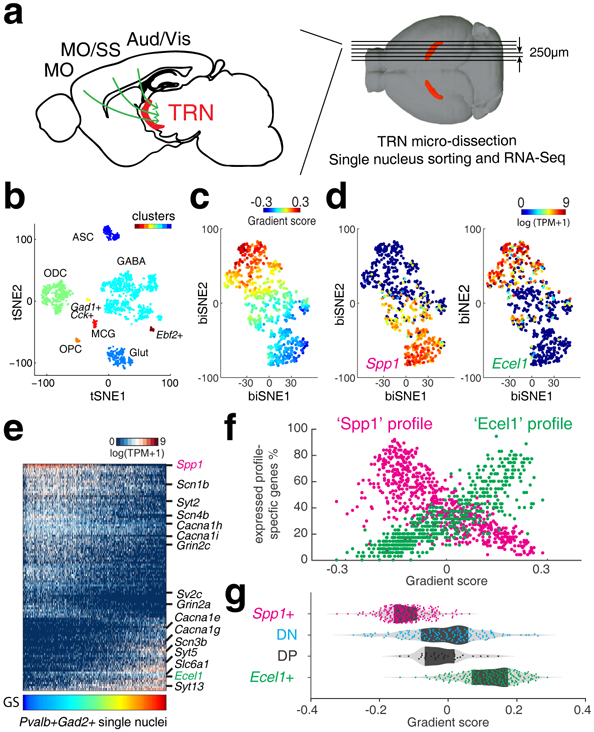
(a) Illustration of TRN gating on corticothalamo (CT) circuitry and experiments. Green arrows illustrate CT projection passing through TRN. MO: motor cortex; SS: somatosensory cortex; Aud: auditory cortex; Vis: visual cortex. Structure in red: TRN tissue (TdTomato). (b) t-SNE embedding shows nucleus clusters, indicated by colors. GABAergic cells (GABA), oligodendrocytes (ODC), Glutamatergic cells (Glut), oligodendrocyte precursor cells (OPC), microglia (MCG), astrocytes (ASC). n = 1,687 nuclei. (c) biSNE embedding of Gad2+ and Pvalb+ single nuclei, pseudo-colored by gradient score (GS), (d) by Spp1 (left) or Ecel1 (right) expression, showing two extremes marked by Spp1 or Ecel1, respectively. n = 671 nuclei. (e) Heat map showing Spp1- and Ecel1- associated transcriptional programs. Some genes relevant to electrophysiological properties are highlighted on the side. Columns: single nuclei; Rows: genes. (f) Scatter plot showing the percentage of ‘Spp1’ and ‘Ecel1’ profile-specific genes expressed in individual TRN cells along the transcriptomic gradient. (g) Distribution of TRN Spp1+, Ecel1+ and intermediate populations DN and DP, along the transcriptomic gradient.
Clustering analysis identified expected GABAergic cells (Gad2+) and non-neuronal cell types as well as glutamatergic neurons (Slc17a7+), which are likely from adjacent thalamic regions (Fig. 1b, Extended Data Fig. 2a). Subsequent hierarchical clustering of the GABAergic cells revealed four sub-populations (Extended Data Fig. 2b, c). The predominant cluster was enriched for the inhibitory neuronal marker Pvalb, consistent with RNA FISH (Extended Data Fig. 1). Hence, this Pvalb+ cluster (a total of 671 neurons) represents inhibitory neurons of the TRN.
The t-SNE clustering based on the most variable genes showed no clear sub-clusters of Gad2+ Pvalb+ cells, the putative TRN neurons. To capture finer distinctions among closely related TRN neurons, we corrected for batch effects and applied the biSNE clustering algorithm23 to the Gad2+ Pvalb+ cells. Interestingly, biSNE mapped cells to an elongated continuum. Examining the most variable genes showed no obvious demarcation separating the neurons into distinct classes. To assign a cellular transcriptional profile along the continuum precisely, we defined a gradient score for how much the expression of genes deviates relative to the middle of the continuum (Methods). Application of the gradient score revealed a continuous shift in gene expression in TRN neurons (Fig. 1c). Further scoring of the genes by their correlation to the gradient identified two negatively correlated transcriptional profiles (Fig. 1d, e). The first profile was highly expressed on one side of the gradient, consisted of elevated expression of Spp1 as well as over 100 other genes including Cacna1i, low-voltage-activated T-type calcium channel subunit alpha-1i known to be important for rebound burst firing of TRN neurons25 (Fig.1e). The second profile was highly expressed in the other side of the gradient, consisted of elevated expression of Ecel1 as well as many other genes including Slc6a1, which encodes a GABA transporter that mediates rapid removal of GABA at the synapse (Fig.1e). The continuum, which we refer to as a transcriptomic gradient, is mainly characterized by the shift in the number of expressed genes that are specific to the ‘Spp1’ profile versus the ‘Ecel1’ profile (profile-specific genes) (Fig. 1e and f). Notably, cells that express both Spp1 and Ecel1 or express neither (referred to as Spp1/Ecel1 double positive (DP) and Spp1/Ecel1 double negative (DN) subpopulations, respectively) do not appear to be low quality as a similar number of genes were detected compared to Spp1+ or Ecel1+ cells (Extended Data Fig. 3a, b). The DP and DN cells also held intermediate positions along the gradient, suggesting that these cells may be part of a functional spectrum between Spp1+ and Ecel1+ profiles (Fig. 1e, g). Thus, our data suggest that the TRN molecular diversity is characterized as a single transcriptomic gradient composed of gradual mixture of two distinct transcription programs marked by highly expressed Spp1+ or Ecel1+ profiles.
A shell/core-like distribution
The binarized on/off expression-pattern of Spp1 and Ecel1 correlates strongly with the transcriptomic gradient (Fig. 1c, d, g and Extended Data Fig. 3a), suggesting that they could be used as markers for the two TRN sub-populations. We developed a classification approach to assign neurons’ identity along the gradient based on whether Spp1 or Ecel1 are expressed. We divided the gradient into three consecutive segments marked by Spp1 single positive (Spp1+), DP/DN, and Ecel1 single positive (Ecel1+) respectively and found that cells along the gradient can be classified into one of the three segments with high accuracy (Extended Fig. 3c and d),
Hence, to examine the spatial distribution of neurons within the TRN, we used Spp1 and Ecel1 as representative markers for the two subpopulations and performed RNA-FISH using Ecel1, Spp1, and Pvalb probes. Consistent with snRNA-Seq data, Spp1+ and Ecel1+ subpopulations exhibited largely non-overlapping expression patterns (Fig. 2). Remarkably, the Spp1 and Ecel1 expression patterns divided TRN into a core (Spp1+) and shell (Ecel1+) structure spanning the entire anterior-posterior extent of the TRN, with DP and DN intermingled within the shell and core (Fig. 2a, b, Extended Data Fig. 3e, f). Quantification revealed a gradually increased fraction of Spp1+ neurons and a reciprocal distribution of Ecel1+ from anterior to posterior, whereas DP neurons were sparse throughout and DN neurons were most abundant in the anterior part (Fig. 2c).
Figure 2. Ecel1+ and Spp1+ neurons show distinct spatial distribution across the TRN.
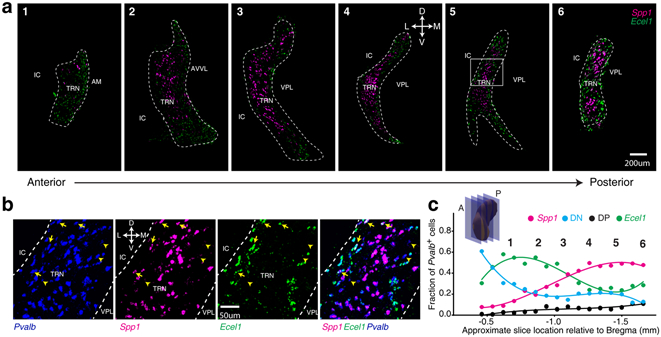
(a) RNA-FISH co-staining in coronal sections. TRN region is delineated based on Pvalb FISH signal. Scale bar: 200μm. D: dorsal; V: ventral; L: lateral; M: medial. IC: internal capsule; AM: anteromedial nucleus; AVVL: anteroventral nucleus; VPL: ventral posterolateral nucleus. Repeated with n = 9. The boxed area in image 5 is zoomed in (b). arrow: DP neurons; arrow-head, DN neurons. (c) Fraction of TRN Pvalb+ cells stained Spp1+, Ecel1+, DN or DP, quantified in RNA-FISH co-staining in coronal sections along anterior (A) to posterior (P) axis. Insert: Schematics of TRN coronal sections.
Hierarchical TRN-thalamic connectivity
Within each functional modality (e.g. somatosensory, visual or auditory) thalamic nuclei are categorized into hierarchically distinct first-order (FO) and higher-order (HO) nuclei based on their principal “driver” inputs26,27. FO nuclei receive and relay peripheral and subcortical sensory information to the cortex, while HO nuclei receive their principal driver inputs from cortical layer V and transfer information among functionally related cortical areas26-28.
We next determined if hierarchically distinct FO and HO thalamic nuclei are innervated by the same or distinct TRN subpopulations. We focused on three main sensory thalamo-cortical (TC) pathways in FO and HO nuclei: visual, somatosensory, and auditory. Fluorescent RetroBeads were injected into each thalamic nucleus to retrogradely label TRN and cortical inputs, and RNA-FISH was used to determine the molecular identity of labeled TRN neurons (Fig. 3a). The retrograde cortical labeling recapitulated known FO and HO corticothalamic (CT) connectivity patterns26,28, confirming the accuracy of our thalamic injection (Extended Data Fig. 4). Strikingly, we found that the majority of TRN neurons retrogradely labeled by injection in FO nuclei were Spp1+ (85.7±3.8%) located in the core region of the TRN. By contrast, most TRN neurons retrogradely labeled from HO nuclei were Ecel1+ cells (86.0±1.3%) located in the shell region of the TRN (Fig. 3b, c). DP and DN TRN neurons did not exhibit an innervation bias (Fig. 3b). These results demonstrate a topographical organization of TRN inputs to hierarchically distinct FO versus HO thalamic nuclei, showing the existence of specific TRN subnetworks for regulating FO and HO TC pathways.
Figure 3. Topographical map of TRN-thalamus projections.
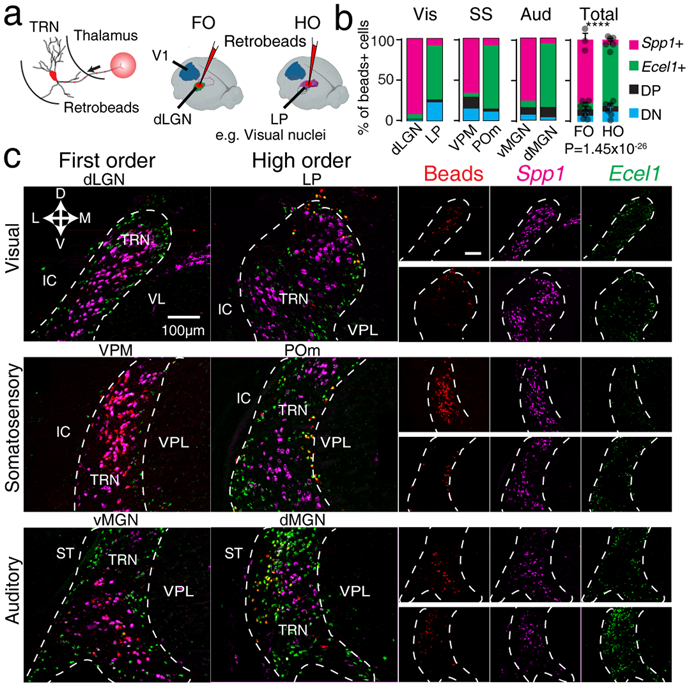
(a) Right: Experiment schematics illustrating injection of retrograde fluorescent beads (RetroBeads) in first-order (FO) or higher-order (HO) thalamic nuclei and retrograde tracing to the projecting TRN neurons. Left: an example illustrating tracing from FO (dLGN) and HO (LP) visual thalamic nuclei. (b) Percentage of Spp1+, Ecel1 +, DP and DN cells labeled by RetroBeads traced from injections targeting different thalamic nuclei, (p=1.45×10⁻²⁶ , two-sided χ-square test. Bars represent mean ± SD). (c) Retrograde tracing of TRN neurons by projecting to FO thalamic nuclei (dLGN, VPM and vMGN, left column) and HO nuclei (LP, POm and dMGN, right column) overlapped with RNA-FISH co-staining for Spp1 and Ecel1, showing high overlap of RetroBeads and Spp1+ staining when FO nuclei were injected and high overlap of RetroBeads and Ecel1+ when HO nuclei were injected. Separate channels are shown in the columns on the right side (upper row panels: injection in FO nuclei; lower row panels: injection in HO nuclei). VL: ventral lateral nucleus; ST: stria terminalis; VPL: ventral posterolateral nucleus. For (b) and (c), n = 3 mice per region.
Molecular and physiological correlation
We combined whole-cell patch-clamp recordings with snRNA-Seq (Patch-Seq, Methods) to examine the relation of transcriptional profiles and electrophysiological properties of TRN neurons. We analyzed 76 neurons across the entire TRN (Fig. 4a, Extended Data Fig. 5a). For each neuron, we recorded its location and electrophysiological properties. The cell contents were then harvested for snRNA-Seq. The distribution of transcriptional profiles of these cells were comparable to the continuum gradient in the original snRNA-Seq dataset, indicating that TRN neuron diversity was adequately sampled (Extended Data Fig. 5b).
Figure 4. Spp1+ and Ecel1+ TRN subpopulations show distinct electrophysiological signatures.
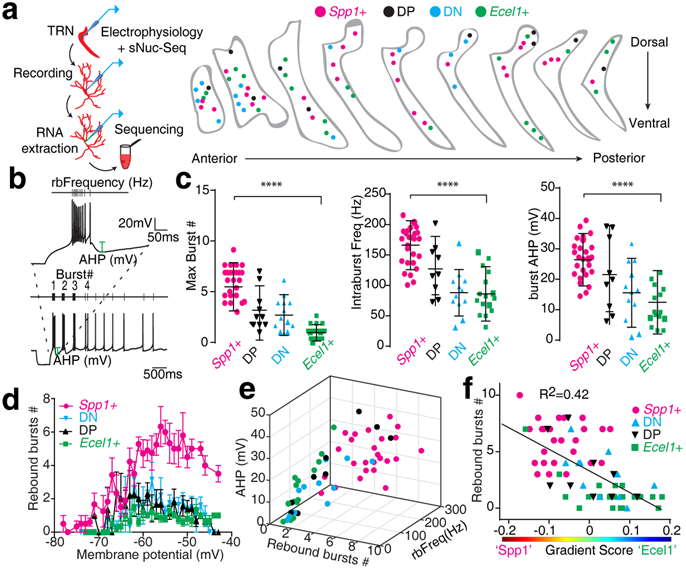
(a) Left: Schematics of experiments. Right: Localization of Patch-Seq neurons in TRN coronal sections. (b) Example of the recording protocol to measure bursting firing: neurons were held at different membrane potentials followed by a hyperpolarizing pulse injection, and traces were quantified for different parameters including the maximum number of rebound bursts. (c) Summary of rebound burst properties (p=0.0001 for all three parameters, two-sided unpaired t-test). Mean ± SD and raw data points. Spp1+ (n=29), Ecel1+ (n=15), DP (n=10) and DN (n=13) neurons collected from 5 mice. (d) Number of rebound bursts generated at different membrane potentials (bars represent mean ± SD). Spp1+ (n=24), Ecel1+ (n=15), DP (n=9) and DN (n=10) neurons collected from 5 mice. (e) The 3D plot of rebound bursts #, frequency within the first rebound burst (rbFreq) and AHP, showing the continuous distribution pattern of Ecel1+ (n=15), DP (n=9),DN (n=10), and Spp1+ (n=29) neurons, collected from 5 mice. (f) Correlation of the gradient score with the maximum burst # (n=59 neurons). Line represents linear regression fitting.
TRN neurons are known to display dual firing modes depending on their resting membrane potential: tonic and burst firing. While tonic firing refers to regular sodium spikes at depolarized membrane potentials, burst firing is characterized by repetitive low-threshold T-type Ca2+ spikes crowned by high-frequency sodium spike trains elicited at hyperpolarized membrane potentials. This burst firing mode is believed to be critical for the generation and/or maintenance of sleep rhythms and may serve unique functions in information processing25,29,30. We thus analyzed rebound burst firing properties of TRN neurons (Fig. 4b). Interestingly, the Spp1+ subpopulation displayed robust rebound bursting activity (average of 5.5 ± 2.4 bursts per 5 seconds; Fig. 4c, d), high spike frequencies within bursts (166.1 ± 40.2 Hz) and a large post-burst after-hyperpolarization (AHP) (26.5 ± 8.6 mV; Fig. 4c). By contrast, the Ecel1+ subpopulation displayed significantly less bursting activity (average of 0.95 ± 0.8 bursts per 5 seconds; Fig. 4c, d) and a significantly lower intra-burst spike frequency (86.1 ± 44.7 Hz) with smaller post-burst AHP (10.7 ± 8.1 mV; Fig. 4c). DP and DN subpopulations exhibited intermediate firing properties (Fig. 4c, d; Extended Data Fig. 5c). Plotting the key properties of the burst firing showed a distribution pattern similar to that of the transcriptome data (Fig. 4e). Importantly, the maximum number of bursts strongly correlated with the molecular gradient score, suggesting that TRN subpopulations have differential molecular mechanisms to generate low-threshold T-type Ca2+ spikes, which forms the ionic basis for the rebound burst firing in TRN neurons (Fig. 4f; Extended Data Fig. 5c).
In parallel, we examined the tonic firing by focusing on single action potential (AP) properties including AP threshold and half-width (APhw) and observed similarly graded changes across TRN subpopulations (Extended Data Fig. 6a, b). Spp1+ neurons exhibited significantly lower AP threshold and APhw than Ecel1+ neurons, suggesting greater excitability, whereas DP and DN subpopulations showed mixed intermediate features. The passive membrane properties, nevertheless, showed little difference among TRN subpopulations (Supplementary Table S1). Moreover, biocytin reconstruction of TRN neurons revealed that neurons with Ecel1+-like firing pattern had a more complex pattern with dendritic ramifications extending in nearly all directions. By contrast, Spp1+-like neurons had shorter total dendritic length (Spp1+-like 974 ± 361.8 μm and Ecel1+-like 1907 ± 739.3 μm) and a simpler dendritic arborization (number of intersections: Spp1+-like 7.5 ± 2.2 and Ecel1+- like 14.1 ± 4.6) with a planar discoid-like architecture (Extended Data Fig. 6c, d, e).
To identify genes contributing to specific neurophysiological properties of TRN neurons, we used a pooled AAV-mediated CRISPR/Cas9 in vivo knockout approach by targeting distinct groups of genes (Extended Data Fig. 7, 8). We found that knockout of Kcng1 increased bursting firing in Ecel1+-like cells, while knockout of Kcnd2 increased rebound bursting in both Spp1+-like and Ecel1+-like neurons without modifying other rebound bursting properties (Extended Data Fig. 9). These results suggest that Kcnd2 and Kcng1 may normally limit burst firing in TRN neurons. (see Supplementary Information).
TRN subnetworks in sleep rhythms
During sleep, stereotypical rhythmic activity patterns are observed across the mammalian forebrain31 and are thought to contribute to the organization and function of sleep32. It is known that two major patterns, delta and spindle oscillations, depend on reciprocal interactions between thalamus and cortex33,34. In addition, global knockout of Cacna1i, the principal low-voltage-activated T-type Ca2+ channel in TRN neurons, leads to changes in these rhythms, suggesting that TRN neurons may play specific roles in generating these global forebrain dynamics25,35. As our data revealed a differential propensity of TRN subpopulations to generate low-threshold T-type Ca2+ spikes, we asked if TRN subpopulations make distinct contributions to sleep rhythms.
To selectively modulate low-threshold Ca2+ spikes in the TRN subpopulations, we developed a genetic perturbation approach that utilizes the Gamma6 subunit of T-type Ca2+ channels. Over-expression of Gamma6 reduces T-type Ca2+ current in vitro by down-regulating T-type Ca2+ channel trafficking to the membrane36. Although this subunit is highly expressed in skeletal and cardiac myocytes, it is not expressed in the brain37, thus can be used to target neurons selectively. We first confirmed the effect of Gamma6 on reducing Ca2+ currents in brain slices from mice injected with Gamma6-carrying lentiviruses into the TRN (Extended Data Fig. 10a, b). To target Spp1+ or Ecel1+ subpopulations, we injected Cre-dependent retrograde lentiviruses containing Gamma6 fused to mCherry into somatosensory FO ventral posteromedial (VPM, for Spp1+ neurons) or HO posteromedial (POm for Ecel1+ neurons) thalamic nuclei of Vgat-IRES-cre mice, which restricts Gamma6 expression to the TRN GABAergic neurons that project to the injected thalamic nuclei (Fig. 5a). Over-expression of Gamma6 led to a significant decrease in the number of hyperpolarization-evoked rebound bursts in both thalamic FO and HO projecting TRN neurons (Fig. 5b, c; Extended Data Fig. 10c, d, e).
Figure 5. Selective perturbation of the firing properties of Spp1+ or Ecel1+ neurons in vivo reveals their differential participation in thalamocortical rhythms.
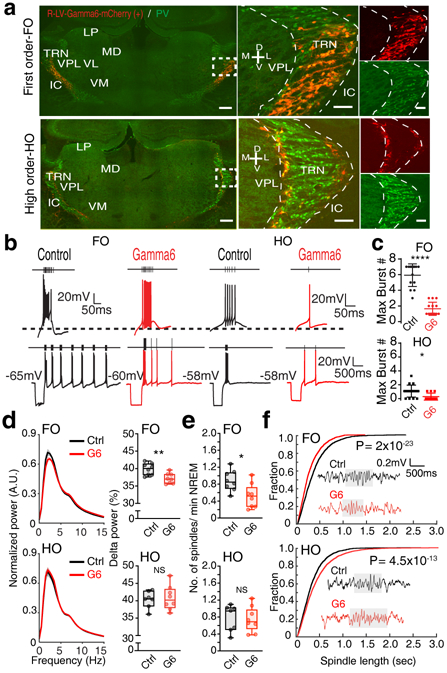
(a) TRN labeled retrogradely with injection in FO (upper) and HO (lower) thalamic nuclei. Left: coronal sections showing TRN (Pvalb, PV) neurons retrogradely-labeled by Gamma6-mCherry (red). Right: Zoom-in views of merged and single-color images of boxed area in the left panel. Scale bar: 100μm. (b) Traces showing differential firing activity changes in TRN neurons in response to hyperpolarizing current-step injections after Gamma6 viral injections in FO vs. HO thalamic nuclei, which retrogradely labels preferentially Spp1+ and Ecel1+ neurons respectively. (c) Gamma6 significantly reduced the number of rebound bursts in TRN neurons (FO control 6.1 ± 1.6 bursts vs. Gamma6 1.7 ± 0.8 bursts, p=0.0001; HO control 1.1 ± 0.26 bursts vs. Gamma6 0.3 ± 0.1 bursts, p=0.0081, two-sided unpaired t-test). Mean ± SD and raw data points. For (a), (b), and (c), FO ncontrol=14 and nGamma6=18 neurons collected from 4 animals, HO ncontrol=12 and nGamma6=11 neurons collected from 4 animals. (d) Left: normalized power spectrum. Right: percentage of power in delta rhythm. Gamma6 expressed in TRN neurons labeled retrogradely from FO led to reduction in the power of delta rhythms (1-4 Hz) (FO: p=0.0045; HO: p=0.75, two-sided unpaired t-test, NS: not significant), (e) significant reduction in spindle density (FO: p=0.038; HO: p=0.96, two-sided Wilcoxon rank-sum test), and (f) decreased spindle length, but increased spindle length when expressed in TRN neurons labeled retrogradely from HO somatosensory thalamic nucleus (Kolmogorov-Smirnov test). Insert: Representative traces of sleep spindles. For data in (d), (e), and (f), FO ncontrol=8, nGamma6=8, HO ncontrol=7, nGamma6=8 animals. Box plots represent minima, 25th, 50th, 75th percentiles, maxima, and raw data points.
We then performed in vivo electroencephalography (EEG) recordings to determine whether sleep rhythms were affected by specifically reducing the bursting activity of FO- or HO-projecting TRN subpopulations. The Gamma6 over-expression in somatosensory FO-projecting TRN neurons, but not in HO-projecting TRN neurons, significantly reduced the power of delta rhythms during NREM sleep compared to the control group (Fig. 5d, e). Analysis of spindle oscillations during NREM sleep showed that Gamma6 over-expression in somatosensory FO-projecting neurons significantly reduced the number and the length of spindle oscillations (Fig. 5e, f; Extended Data Fig. 10f). By contrast, Gamma6 over-expression in HO-projecting subpopulation increased the length of spindle oscillations without changing their numbers (Fig. 5e, f; Extended Data Fig. 10f). Furthermore, we observed a reduction in NREM sleep bouts only in animals expressing Gamma6 in FO-projecting TRN neurons but not HO-projecting neurons (Extended Data Fig. 10g, h). Collectively, our data demonstrate that burst firing of TRN neurons mediated by T-type Ca2+ channels plays a crucial role in sleep spindle generation during NREM sleep, in concert with previous findings25,35,38. Moreover, our data suggest differential roles for the Spp1+ and Ecel1+ subpopulations in regulating sleep spindles and sleep bouts.
Discussion
Our study has generated a comprehensive single-cell resolution atlas of TRN revealing its cellular heterogeneity connected to functionally distinct TRN subnetworks. This knowledge will provide a new framework for deducing the computational principles of TRN in regulating thalamocortical interactions relevant to sensation, action and cognition.
Contrary to the long-held belief that brain cells are represented by discrete cell types, ours and several other recent reports have found evidence for graded gene-expression in multiple brain regions and cell types, though the extent of graded heterogeneity is highly variable. While in some cases, a single or a few genes related to developmental cues were found, i.e. in retina and cortex40,41, in other cases, similar to the TRN in the present study, tens to hundreds of genes exhibiting continual variation were identified, i.e. in the striatum and hippocampal CA1 and CA323,42-46 . Importantly, the continuum of transcriptomic variability in TRN correlates with electrophysiological, connectivity, and anatomical organizations, suggesting that the transcriptomic gradient may serve to increase heterogeneity underlying a host of cellular properties for wide-range functional tuning. This cellular diversity may then facilitate the intrinsic flexibility of TRN to meet the diverse and graded spatial and temporal demands of thalamocortical interactions in the context of sensation, action and cognition. It remains to be elucidated whether the transcriptome continuum is a general organizational principal across wide brain regions or a feature specific to integration centers such as the TRN.
From a topographical viewpoint, our results are largely consistent with divided functional reticular modalities based on distinct input-output relationships between cortex and thalamus17,47,48. Within each functional modality, we revealed the distinct spatial distribution of core (Spp1+) versus shell (Ecel1+) TRN subpopulations that project to FO and HO thalamic nuclei respectively, providing molecular details for the previous reported “slab” or tier-ordered topographical organization in the somatosensory sector17,26,48. Importantly, these anatomical types exhibited distinct propensities to generate low-threshold Ca2+ spiking characterized by distinctions in rebound burst firing. By targeted ectopic expression of the Gamma6 regulatory subunit in these TRN subpopulations, we demonstrated their distinct impact on sleep rhythms (delta and spindle rhythms) in vivo.
The TRN plays essential roles in sensory processing that takes multiple steps and complex computations12,49. Given the distinct electrophysiology and connectivity characteristics of each of the TRN subpopulations, it is likely that these subpopulations mediate different aspects of sensory processing: the first-order projecting Spp1+ TRN neurons with lasting firing are most likely involved in sensory gating, while higher-order projecting Ecel1+ TRN neurons with fast dynamics could be involved in the integration of complex features across modalities or the generation of sensory induced motor signals.
Methods
Animals in this study
All experiments were done in accordance with NIH guidelines and approved by the Broad Institute and MIT Institutional Animal Care and Use Committee (CAC # 041602419 MIT, CAC# 000806141 Broad Institute). Mice were housed with a standard 12 h light/12 h-dark cycle (lights on at 07:00, lights off at 19:00) with ad libitum food and water. All mice used were C57BL/6J background. Animal sample sizes in this study were chosen based on similar previous publications. All animals used in current study were randomly assigned to experimental versus control groups. Experimenters were blinded to genotypes or treatment conditions for data collection and analysis.
Single nucleus RNA-seq
Dissection of the TRN region
We used a transgenic Pvalb-tdTomato mouse line expressing tdTomato in TRN neurons22 and performed fluorescence-aided micro-dissection of tdTomato-positive TRN tissues under a stereo fluorescence microscope. To avoid batch effects due to gender differences, only female mice were included for the whole TRN section series. Female mice at 13-15 weeks p.n. were deeply anesthetized with isoflurane followed by cervical dislocation and decapitation for tissue harvesting. Brains were rapidly removed and placed in ice-cold cutting solution containing (in mM): 194 sucrose, 30 NaCl, 4.5 KCl, 1.2 NaH2PO4, 0.2 CaCl2, 2 MgCl2, 26 NaHCO3, and 10 D-(+)-glucose saturated with 95% O2 and 5% CO2, pH 7.4, 320-340 mOsm/L. A sagittal slice (thickness of 250 μm) series covering the whole TRN section was prepared using a slicer (Leica Microsystems, VT1200 S) and placed under a fluorescent stereomicroscope for microdissection. Dissected TRN regions were placed into ice-cold RNAlater (Sigma-Aldrich, #R0901) to preserve samples. Afterwards, the samples were transferred to 4 °C overnight followed by storage at −80 °C until further processing. In addition, we collected tissue from thalamus and globus pallidus, which are adjacent to TRN, as controls.
Single nuclei isolation and FACS
We purified nuclei as described23 with the following modifications. First, we used Vybrant® DyeCycle™ Violet Stain (Thermo Fisher Scientific, #V35003) instead of Ruby stain to avoid the spectrum overlapping with tdTomato. Second, in one of the batches, neuronal nuclei were enriched by using NeuN antibody staining50. To perform NeuN antibody staining, we incubated purified nuclei in 500 μl Phosphate Buffered Saline (PBS) buffer with 0.5% Bovine Serum Albumin (BSA) (Sigma-Aldrich, #A9418) and 0.2 U/μl RNase inhibitor (Clontech/TaKaRa, #2313A) at 4 ℃ for 15min followed by adding 1 μl Anti-NeuN antibody conjugated with Alexa Fluor®488 (EMD Millipore, #MAB377x) and incubating at 4 °C for another 15 min. We removed the staining buffer after spinning down in 500 x g for 5 min at 4 °C, re-suspended the nuclei pellet in buffer as described23 and labeled nuclei with Vybrant® DyeCycle™ Violet Stain. We used an Astrios flow cytometry sorter (Beckman Coulter) to sort one nucleus into each well of 96-well plates containing 5 μl TCL buffer (Qiagen, #1031576) with 1% 2-Mercaptoethanol (b-ME) in each well. We set fluorescence activated cell sorting (FACS) gating on forward scatter plot, side scatter plot and on fluorescent channels to include only Violet+ or Violet+ NeuN+ (for neuronal nuclei).
Single nucleus RNA library construction and sequencing
Single nucleus RNA library construction was performed as described24. Briefly, RNA was first purified using Agencourt RNAClean XP beads (Beckman Coulter, #A63987) at 2.2X beads to sample volume ratio. PCR product was purified using AMPure XP beads (Beckman Coulter, Agencourt AMPure XP, #A63880) twice at 0.7X volume ratio and eluted in EB buffer (Qiagen, #19086). Purified cDNA were quality checked on the Agilent 2100 BioAnalyzer with high sensitivity DNA Kit (Agilent, #5067-4626) and quantified using Quant-iT PicoGreen dsDNA Assay Kit (Thermo Fisher Scientific, #P7589) on the EnVision 2104 Multilabel Reader (Perkin Elmer). Sequencing libraries were prepared using a Nextera XT kit (Illumina, #FC-131-1024) with 0.075 ng cDNA from each nucleus and 1/4 of the standard reaction volumes. Single nucleus RNA-Seq libraries were sequenced on an Illumina NextSeq 500 with average depth of >1 million reads per nucleus.
Initial processing of sequencing reads
To estimate genome mapping rate, TopHat 2.0.1051 was used to align reads to mouse mm10 UCSC genome with default parameters. To estimate gene expression, RSEM v1.2.852 was run with default parameters on alignments created by Bowtie253 on UCSC gene annotation. TPM estimates were transformed to log-space by taking log (TPM+1). Genes were considered detected if their transformed expression levels are equal to or above 3 (1.1 in log (TPM+1) scale). A library was removed if it had less than 40% genome mapping rate or less than 1500 detected genes.
Analysis of nuclei clusters
Analysis of nuclei clusters and differential gene expression was performed using biSNE software (https://github.com/yinqingl/nucseq_analysis) according to the instructions as described23. When clustering TRN Pvalb+ single nuclei, batch effects were found, which caused data to cluster into three nuclei clusters separated mainly by batches. To correct for this batch effect, the top variant genes within each batch were identified in biSNE analysis, and the identified genes from different batches were pooled. Then, clustering of all TRN Pvalb+ single nuclei was repeated with these pooled set of top variant genes. To obtain gradient score for the TRN Pvalb+ neurons, first, pseudo-time was calculated for all TRN Pvalb+ neurons using biSNE software package with the default parameters. Then, the first 5% and last 5% neurons along the pseudo-time were chosen as two representative populations for the gradient extremes. For each neuron, the median of the Euclidean distance in the PCA space (top 5 PCs) to each member of these two representative populations was calculated and the difference between the medians of the two representative populations was taken as the gradient score.
To assign neuron identities along the gradient, a three-category classifier was constructed using Matlab function ‘fitcnb’ with weights of Spp1+, Ecel1+ samples set to 1 and weights of DP/DN samples weights set to 2 in order to normalize sample size. The accuracy of the classifier is estimated using Matlab function ‘predict’.
Collection of Pvalb+ neurons from hippocampus, striatum, somatosensory and motor cortex
Stereotactic viral injections were performed on 8-10 week-old Pvalb-Cre mice (The Jackson Laboratory, stock #8069). The animals were anaesthetized via isoflurane. 1 ul of high titer AAV1/2 (≈4 x 10¹² Vg/ml of pAAV-EF1a-DIO-EGFP-KASH-WPRE-hGH-polyA, gift from Feng Zhang lab, MIT) was injected into dorsal and/or ventral hippocampus, striatum, somatosensory or motor cortex (M2). The cre-mediated expression of the KASH domain directs the fused GFP protein to the outer nuclear membrane and enables sorting for Pvalb+ positive nuclei. The corresponding stereotactic coordinates were applied for the four brain regions (hippocampus: AP:−1.7mm, ML: +/−1.0mm, DV:−1.7mm; striatum: AP: 0.5mm, ML: +/− 2.0mm, DV: −3.4mm; somatosensory: AP: −0.7mm, ML: +/−2.8mm, DV: −1.2mm; motor cortex: AP: 2.1mm ML: +/−1.5mm, DV: −1.2mm). After each injection, the pipette was held in place for 5 min prior to retraction to prevent leakage. Finally, the incision was sutured and postoperative analgesics (SR-Bupronex, 1 mg/kg) were administered after the surgery. 3-4 weeks later after viral injection, brain tissue from these four regions was dissected into ice-cold RNAlater followed by the isolation of single nuclei and processing similar to that described in “Dissection of the TRN region” section with the FACS gating set on forward scatter plot, side scatter plot, and on fluorescent channels to include only DAPI+GFP+ nuclei.
Identification of genes enriched in Pvalb+ neurons in TRN compared to other brain regions
First, Smart-seq2 data from non-TRN brain regions (hippocampus, motor cortex (M2), somatosensory cortex and striatum) were processed using RSEM as described in the “Sequencing reads initial processing” section. Data from all four tissues were combined into one TPM matrix which was loaded into R and processed with Seurat (v2.2.0)54. To be consistent with the TRN data, nuclei expressing <1500 genes were removed. For clustering, variable genes were selected with the FindVariableGenes function (with default parameters, except setting x.low.cutoff=1), while ScaleData function in Seurat package was used to regress out the number of genes per cell. Louvain clustering was performed24 using 50 nearest neighbors and 9 principle components. Clusters were identified based on marker gene expression. Two clusters of Pvalb+ inhibitory neurons were used for further analysis.
Second, 10X single cell data from mousebrain.org was processed. Count data and metadata was downloaded from mousebrain.org54. We extracted a UMI based count matrix consisting of all Pvalb+ inhibitory neurons with >500 genes detected. The data were transformed into log counts per million (CPM). We also extracted the clustering information for these cells from the website. Using markers extracted from the Smart-seq2 TRN data (Six3, Sst, and Isl1) two clusters, DEINH1 and DEINH2, where identified as putative TRN Pvalb+ inhibitory neurons.
Next, TRN enriched genes were extracted. For the Smart-seq2 data, Pvalb+ TRN cells were compared to Pvalb+ cells from each of the other 3 tissues with MAST55, including the scaled number of genes per cell as a covariate. For the 10X data, the putative Pvalb+ TRN cluster was compared to Pvalb+ cells from each of the other regions in the dataset, including the scaled number of UMIs per cell as a covariate. Note that we only considered regions that had >50 Pvalb+ inhibitory neurons. Here we used the region annotation produced by the mousebrain.org team, except for cells in DEINH1 and DEINH2 which were labelled as coming from the TRN. The Pvalb+ neurons from the thalamus in the 10X data were also excluded from the analysis, since many of those might be TRN neurons that were clustered with the thalamus cells. In both analyses, we limited ourselves to genes that were detected in at least 10 cells.
We extracted genes that match the following criteria: (a) an FDR adjusted p-value < 0.05; (b) log (fold change) > log(2) in all comparisons according to MAST55; (c) expressed in >40% of TRN cells in both the Smart-Seq2 and mousebrain.org54 data; (d) expressed in <25% of Pvalb+ inhibitory neurons in other regions of both datasets.
Disease associated genes
MAST (version 1.05)55 was used to find differentially expressed (DE) genes between Spp1+ cells and Ecel1+ cells (double positive and double negative cells were excluded). A list of ASD genes was downloaded from the SFARI website (https://gene.sfari.org/database/human-gene/) on June 25, 201856. We used all genes with gene scores 1 or 2 (strong/ high confidence genes). A list of Schizophrenia genes was extracted from the recent CLOZUK GWAS56. In particular, we took all significant loci that overlapped exactly one gene in either the PGC GWAS or the joint CLOZUK and PGC meta-analysis57, and used the associated genes that mapped from human to orthologous mouse genes. In Extended Data Fig. 7d, the plot features all genes from this list with absolute log fold change > log(2) and FDR adjusted p-value < .05 according to MAST. Genes are ordered by log fold change, cells ordered as in Extended Data Fig. 7c, and rows are mean centered and scaled by standard deviation, before being plotted using ggplot2.
Multiplex Fluorescence In Situ Hybridization (FISH) and Image analysis
Multiplex RNA-FISH
We used a single molecule fluorescent in situ hybridization (smFISH) method, commercialized as Advanced Cell Diagnostics RNAscope Fluorescent Multiplex Assay, for FISH experiments. Four and15 week-old mice were deeply anesthetized with isoflurane, decapitated, the brains were rapidly dissected out and frozen in blocks using Optimal Cutting Temperature (OCT) compound (Sakura Tissue-Tek, #4583) in an isopropanol/dry ice bath. Serial sections of the samples were cut at 16 μm thickness using a cryostat (Leica Microsystems, CM 1850), adhered to SuperFrost Plus microscope slides (Thermo Fisher Scientific, 12-550-15), and stored at −80 °C until use. Samples were immediately fixed in 4% paraformaldehyde for 30 minutes at 4 °C and stained on the slide according to the Advanced Cell Diagnostics RNAscope Fluorescent Multiplex Assay (ACDBio, #320850) protocol. Samples were then stained for Pvalb (ACDBio, #421931), Spp1 (ACDBio , #435191), Ecel1 (ACDBio#475331), Gad2 (ACDBio, #415071), and Sst (ACDBio, #404631) with antisense probes, and mounted with a coverslip using Vectashield hardset antifade mounting medium with DAPI (Vector Laboratories, #H-1500). Z-stack serial images were taken through the whole depth of tissue across the whole TRN on a Nikon Ti Eclipse inverted microscope equipped with an Andor CSU-W1 confocal spinning disc unit and an Andor DU-888 EMCCD together with 20X/ 0.75 NA air objective lens. Microscope and camera settings were consistent for all imaging procedures.
FISH image Analysis and Quantification
Identification of the TRN was performed manually and confirmed by the characteristic Pvalb expression pattern in this region with reference to the mouse brain atlas. Quantification of cellular colocalization of RNA transcripts was first performed manually using Fiji ImageJ (https://imagej.net/Fiji), and then semi-automatically using CellProfiler (https://cellprofiler.org/) for each TRN series experiment58.
For manual quantification, colocalization was performed on 20X images using the Cell Counter ImageJ plugin. All image Z-stacks were max projected and stitched in order to obtain the full TRN structure of each sample. In smFISH, the counts of fluorescent puncta reflect the RNA expression level, permitting moderate contrast-enhancement without compromising gene-expression assessment. Brightness and contrast were adjusted, and color was flattened identically across samples. Colocalization of Pvalb, Spp1, and Ecel1 FISH experiments, as well as Pvalb, Sst, and Gad2 FISH experiments were quantified on a per cell basis, where cells were delineated by DAPI staining. Total Pvalb+ neurons, Pvalb+ Spp1+ neurons, Pvalb+ Ecel1+ neurons, triple positive Pvalb+ Spp1+ Ecel1+ neurons, and Pvalb+ Spp1- Ecel1- neurons were counted.
For CellProfiler semi-automated quantification, a CellProfiler pipeline that involves a series of imaging processing steps to extract cell types was constructed. Briefly, for each image, a mask outlining the TRN was drawn manually using signal from the Pvalb channel as a guide. Next, the outlines of nuclei (DAPI channel) were identified, following tophat-filter signal enhancement and smoothing, using Otsu thresholding with limits on object size and an algorithm to de-clump groups of tightly-packed cells. Similarly, signals from the Pvalb, Spp1, and Ecel1 channels were identified using adaptive thresholding after tophat filtering. Finally, Pvalb positive cells were identified as those nuclei with a threshold of 30% (by area) co-localization with Pvalb signal. Spp1 positive and Ecel1 positive cells were identified as nuclei with a threshold of 10% (by area) co-localization with each respective signal. The mean fluorescent intensity for each smFISH channel, which is an approximation for the positive puncta counts normalized by cell size, was obtained for each cell. Complete CellProfiler pipelines for each dataset can be found at https://cellprofiler.org/.
To obtain normalized medial-lateral position for TRN cells, TRN left and right boundaries were identified as the leftmost and rightmost Pvalb+ neurons at their dorsal-ventral (d-l) positions along the medial-lateral (m-l) axis. The m-l positions of the boundary neurons were smooth-fitted against their d-l positions using Matlab function ‘interp1’ with ‘pchip’ kernel. The normalized m-l position of each TRN neuron was calculated as the relative distance to the smoothed left and right boundary at its d-l position, using Matlab function ‘interp1’.
Connectivity mapping
Surgery
Three-month-old C57BL/6J mice were anesthetized with isoflurane and placed in a small animal stereotaxic apparatus (David Kopf Instruments). Animals were injected a volume of 60-80 nl red RetroBeads IX (Lumafluor) using a Nanoject (Drummond Scientific) via glass pipettes with 20-30 μm diameter tips in different thalamic nuclei (coordinates in Supplementary Table S2). The incision was closed with vetbond and mice recovered on a heat pad in a clean cage. The post-surgery mice were given injected analgesics (SR-Bupronex 1mg/kg) every 72 h or as needed, and were allowed to recover for at least 5 days before any experimental procedures. All the experimental mice were group-housed pre and post-surgery.
Cryosectioning and fluorescent staining for retrograde tracing
Mice were deeply anesthetized with isoflurane followed by cervical dislocation and decapitation for tissue harvesting. Mouse brains were removed and placed in cryomolds containing enough fresh optimal cutting temperature (OCT) medium to cover the sample as described in the section “Multiplex RNA-FISH”. Sections were cut in a set of 4 rotating series, each containing every one out of four sections. Slides were stored in −80 °C until further processing. One series was used to confirm RetroBeads labeling and to select the sections for further processing. Briefly, slides were fixed in a standard fixation protocol in 4% paraformaldehyde in PBS (4 °C, 15 min) followed by three, 5-min dehydration at room temperature in 50%, 70%, and then 100% ethanol. Once the ethanol was air dried, the samples were stained with Hoechst® 33342 (1:1000) (Thermo Fisher Scientific, #H3570) for 15 minutes at room temperature (RT). After one wash with 1x Wash Buffer (ACDBio, USA, #320850), the samples on glass slides were mounted with Fluoromount™ Aqueous Mounting Media (Sigma-Aldrich, #F4680) and left to dry overnight.
RetroBead imaging and counting
Mounted slides were transferred to a microscope equipped with epifluorescence and IR-DIC optics aligned for Kohler illumination. Entire slides were then imaged at 10X for the red RetroBeads [excitation/emission (nm): 530/590], and Hoechst® 33342 [excitation/emission (nm): 350/461]. The cortical subdivisions were determined according to the Allen Brain Atlas using DAPI channel image. For each cortical subdivision, the RetroBeads were then counted using a custom MATLAB script (https://github.com/yinqingl/image_analysis), which allows normalization of background intensity and pixel counting of fluorescent RetroBeads.
RNA-FISH with RetroBeads
Sections with RetroBeads labeling in the TRN and projection areas were identified as described in “Cryosectioning and fluorescent staining for retrograde tracing”. Fresh frozen sections, corresponding to the selected sections in the same series of slide-set, were removed from −80°C and fixed in 4% paraformaldehyde in PBS at 4°C for 1 hour. FISH for Ecel1, Spp1, and Pvalb expression was performed on selected sections using the RNAscope® Fluorescent Multiplex Assay (ACDBio, USA, #320850) according to the manufacturer’s instructions. RNAscope probes used were Mm-Spp1-C1 (ACDBio, USA, #435191, NM_001204201.1, region 2-1079), Mm-Ecel1-C3 (ACDBio, USA, #475331-C3, NM_001277925.1, region 879-1992), and Mm-Pvalb-C4 (ACDBio, USA, #421931-C4, NM_013645.3, region 2*885). DAPI (1:1000) was included in the final wash buffer for nuclear counterstaining. Slides were mounted with coverslips using Fluoromount™ mounting media.
Confocal imaging
The fluorescent multiplex FISH images were taken as z-stacks on a Nikon Eclipse Ti-E inverted confocal equipped with Andor CSU-W1 spinning disc unit and EMCCD camera (Andor, iXon Ultra 888). Excitation laser lines are 405 nm (DAPI), 488 nm (Alex Fluor 488), 561 nm (Alexa Fluor 568, RetroBeads), 640 nm (Alexa Fluor 647). Pvalb-C4 was imaged in wide field LED fluorescent using a filter set for Cy7. Z-stacks were max projected and stitched using ImageJ and Matlab with customized algorithms (https://github.com/yinqingl/image_analysis). ImageJ cell counter was used to manually count RetroBead labeled cells colocalized with the different FISH probes. Maps of cell localization were generated based on counting density.
Patch-seq
Slice preparation for Patch-Seq
Coronal slices (250 μm) were obtained from Pvalb-tdTomato mice at 25-30 p.n. days. Mice were anesthetized via isoflurane inhalation and perfused transcardially using ice-cold saline containing (in mM): 194 sucrose, 30 NaCl, 4.5 KCl, 1.2 NaH2PO4, 0.2 CaCl2, 2 MgCl2, 26 NaHCO3, and 10 D-(+)-glucose saturated with 95% O2 and 5% CO2, pH7.4, 320-340 mOsm/L. Slices were cut using a slicer (Leica Microsystems, VT1200 S) and then incubated for 10min in a holding chamber (Scientific System Design Inc., USA, #BSK4) at 32 °C with regular artificial cerebral spinal fluid (aCSF) containing the following in mM: 136 NaCl, 3.5 KCl, 1 MgCl2, 2.5 CaCl2, 26 NaHCO3 and 11 glucose saturated with 95% O2 and 5% CO2, followed by at least one hour recovery at room temperature (21–25 °C) before recording.
Electrophysiological recordings and cell content extraction
To obtain electrophysiology and transcriptome data from single neurons, additional modifications were made to the original Patch-seq protocol59,60 in order to improve recording of TRN neurons and RNA recovery. A series of pilot experiments were carried out to test various protocol modifications, including 1) the inclusion of RNase inhibitor in the intracellular patch-clamp solution, 2) silanization of the glass capillaries used for patch-clamping, 3) inclusion of the nucleus during the extraction process, 4) pipette tip size and 5) volume of intracellular solution. These protocols were compared based on electrophysiology recording stability, quality, and cDNA quality measured by BioAnalyzer (Agilent, High Sensitivity DNA Kit, #5067-4626). The following protocol was selected and was used to collect data. Glass capillaries were autoclaved prior to pulling patch-clamp pipettes, all work surfaces including micromanipulator pieces were thoroughly cleaned with DNA-OFF (Takara, #9036) and RNase Zap (Life Technologies, #AM9780) and great care was taken to maintain an RNase-free environment during sample collection. Recording pipettes of 2–4 MΩ resistance were filled with RNase-free intracellular solution containing: 120 mM potassium gluconate, 12 mM KCl, 10 mM HEPES, 1.1 mM EGTA, 4 mM MgATP, 0.3 mM Na3GTP, and 1 U/μl recombinant RNase inhibitor (TaKaRa, #2313A), pH ~7.3. To maximize RNA recovery, it was critical to use a small volume of intracellular solution in the patch-clamp pipette (ideally less than 1 μl, but certainly less than 2 μl). RNA was collected at the end of the recording (typically 15–20 min from break-in to RNA extraction) by applying light suction until the cell had visibly shrunken and cell content entered the pipette. The entire nucleus and most of the cytoplasm could often be found entering the pipette, and this was associated with a high yield of cDNA. The contents of the pipette were ejected by applying positive pressure into an RNase-free PCR tube containing 20 ul of TCL buffer with 10% beta-mercaptoethanol and snap frozen on dry ice. The tip of the pipette was broken and left in the same collection tube. The samples were transferred to −80 °C until further processing. We used a procedure similar to that described in the “Single nucleus RNA library construction and sequencing” section, with the modification that all reagents used in Smart-seq2 protocol were scaled up 3 times, to construct Patch-seq RNA sequencing libraries.
Morphology reconstruction
Brain slices containing biocytin-filled neurons were post-fixed in 4% paraformaldehyde in sodium phosphate-buffer (PBS, pH 7.5) at 4 °C. Slices were washed 4 times in PBS and cleared using “CUBIC reagent 1”59,61 (25% urea, 25 wt% N,N,N’,N’-tetrakis(2-hydroxypropyl) ethylenediamine and 15 wt% polyethylene glycol mono-p-isooctylphenyl ether/Triton X-100) for 2 days. After 5-7 washes in PBS, biocytin localization was visualized using streptavidin-conjugated with Alexa-488 (Thermo Fisher Scientific, #S32354). Slices were then re-washed in PBS and submerged in “CUBIC reagent 2” (50% sucrose, 25% urea, 10 wt% 2,20,20’-nitrilotriethanol and 0.1% v/v% Triton X-100) for further clearing. Post-hoc neuroanatomy and neuronal reconstructions were performed using 20x and 60x objectives. Z-stack serial images were acquired on a NikonTi Eclipse inverted microscope equipped with an Andor CSU-W1 confocal spinning disc unit and an Andor DU-888 EMCCD camera. Images were collected at 1 μm z-step intervals. The images were imported into Fiji ImageJ (https://imagej.net/Fiji). Individual cells were traced and 3-D reconstruction made using the open source Simple Neurite Tracer plugin in the Fiji ImageJ package. Total neurite arbor size and branching was measured within Fiji ImageJ. The skeletonized neuron from Simple Neurite Tracer was used to run Sholl analysis on each traced neuron, with the center of the cell body as the origin. The Sholl analysis was performed with Fiji ImageJ using the linear method with a sphere separation of 1 μm and no normalization.
In vivo CRISPR/Cas9 functional genetic screening
Construction of the sgRNA expression vector
The sgRNA expressing vector (AAV:ITR-U6-sgRNA(backbone)-hSyn-EGFP-KASH-WPRE-shortPA-ITR) was constructed based on the AAV:ITR-U6-sgRNA(backbone)-hSyn-Cre-2A-EGFP-KASH-WPRE-shortPA-ITR (pAAV60231) (Addgene, Plasmid #60231)62. Briefly, to remove the Cre from pAAV60231, pAAV60231 was digested by Acc65I and EcoRI (New England Biolabs, #R0599 and #R3101) and the plasmid backbone was agarose gel purified. EGFP-KASH was PCR amplified from pAAV60231 with primer pair o_BsaI_Acc65I_EGFP_f, o_BsaI_EcoRI_KASH_r (primer sequences in Supplementary Table S6). The amplified product was digested with BsaI (New England Biolabs, #R3535) and purified. The sgRNA expressing vector was constructed by ligating the digested backbone and the PCR product using T4 ligase (New England Biolabs, #M0202). The sequence of the sgRNA expressing vector was verified by Sanger sequencing.
Selection of the CRISPR/Cas9 targets
We selected targets from three sources, (1) the top differentially expressed genes between Spp1+ and Ecel1+ TRN Pvalb+ neurons; (2) the top differentially expressed genes between Pvalb+ neurons from TRN and from other brain regions; (3) top risk genes of schizophrenia identified in GWAS studies and de novo mutations found in autism genetic studies. Among the differentially expressed genes, we mainly focused on ion channels and neurotransmitter receptors. A total of 34 genes were chosen and grouped into 7 pools (Supplementary Table S3). Additionally, we added a TRN non-expressing gene IghE as a negative control.
Design and cloning of the sgRNA library
Five exon-targeting sgRNAs were designed for each gene using Benchling (https://benchling.com). The top 5 sgRNAs with highest predicted on-target efficiency and lowest predicted off-target rate were chosen (https://benchling.com) (Supplementary Table S7). Multiple sgRNAs were designed to target a single gene in order to increase the chance for knockout and to reduce off-target rate. Specifically, for on target, multiplex sgRNA targeting would have higher chance of introducing an exon deletion than a single sgRNA targeting; for off-target, any off-target site would be targeted by no more than one sgRNA whose abundance is reduced to 20% in 5-plex design, leading to reduced off-target rates. The sgRNAs were synthesized individually (Integrated DNA Technologies) and cloned into the sgRNA-expressing AAV vector (AAV:ITR-U6-sgRNA(backbone)-hSyn-EGFP-KASH-WPRE-shortPA-ITR) as previously described62. Briefly, primers (Supplementary Table S6) for each sgRNA were phosphorylated and annealed by T4 Polynucleotide Kinase (New England Biolabs, #M0201). The sgRNA library backbone was digested with SapI endonuclease (New England Biolabs, #R0569), and annealed sgRNA inserts were cloned into the backbone by Golden Gate assembly. Then, assembly reactions were transformed into Mix & Go competent E. coli (Zymo Research, #T3001) according to the manufacturer’s directions. To verify the sgRNA insert sequences, the sgRNA were individually sequenced from the U6 promoter using the U6-fwd primer (Supplementary Table S6).
To make pooled sgRNA libraries, sgRNA targeting selected genes were pooled and concentrated by isopropanol precipitation. Pooled sgRNA libraries were electroporated at 50–100 ng/μl using Endura Electrocompetent cells (Lucigen, #60242) according to the manufacturer’s instructions, and plated on square assay agar plates with Ampicillin. The bacterial cultures were grown for 14hr and were scraped and collected in LB medium. Midiprep was made using Qiagen Plasmid Plus Midiprep Kit (Qiagen, #12945). The AAV virus serotype AAV2/1 for each pooled sgRNA library was prepared by the Boston Children’s Hospital Viral Core (Boston, MA, USA).
Surgery for the CRISPR AAV viral injection
21-25 days old Cas9 mice39 were anesthetized with isoflurane and placed in a small animal stereotaxic apparatus (David Kopf Instruments). Animals were injected bilaterally a volume of 180 nl of pooled AAV1/2. Two injection points were chosen for each hemisphere to cover most of the TRN at coordinates: AP −0.7, ML 1.65 and DV −3.2/−3.55. The incision was closed with Vetbond and postoperative care was provided as described above. Mice were allowed 10 days of recovery before electrophysiological recordings were performed.
Electrophysiology
Horizontal slices (250 μm) were obtained from injected mice at 30-35 p.n. days. Mice were anesthetized via isoflurane inhalation and perfused transcardially with cold saline containing (in mM): 194 sucrose, 30 NaCl, 4.5 KCl, 1.2 NaH2PO4, 0.2 CaCl2, 2 MgCl2, 26 NaHCO3, and 10 D-(+)-glucose saturated with 95% O2 and 5% CO2, pH=7.4, 320-340 mOsm/L. Slices were cut using a slicer (Leica Microsystems, VT1200S) and then incubated for 10 minutes in a holding chamber (Scientific System Design Inc., #BSK4) at 32 °C with regular aCSF containing the following in mM: 136 NaCl, 3.5 KCl, 1 MgCl2, 2.5 CaCl2, 26 NaHCO3 and 11 glucose saturated with 95% O2 and 5% CO2, followed by at least one hour recovery at room temperature (21–25 °C) before recording.
We performed whole cell patch-clamp recordings with borosilicate glass pipettes (King Precision Glass, #KG33) heat polished to obtain direct current resistances of ~4–6 MΩ. Pipettes were filled with an internal solution containing in mM: 120 K-Gluconate, 2 MgCl2, 10 HEPES, 0.5 EGTA, 2 Na2ATP, and 0.2 Na3GTP. The recordings were made with a microelectrode amplifier with bridge and voltage clamp modes of operation (Molecular Devices, Multiclamp 700B). Cell membrane potential was held at −60 mV, unless otherwise specified. Signals were low-pass filtered at 2 kHz and sampled at 10–20 kHz with a Digidata 1440A (Molecular Devices, USA), and data were stored on a computer for subsequent off-line analysis. Cells with the series resistance (Rs, typically 8–12 MΩ) changed by >20% were excluded for data analysis. In addition, cells with Rs more than 20 MΩ at any time during the recordings were discarded. AAV1/2 labeled neurons were identified for recordings on the basis of GFP expression visualized with a microscope equipped with GFP filter (Olympus, BX-51WI).
CRISPR knockout efficiency and specificity
TRN perturbation by Gamma6 expression
Construction of Gamma6 and control vectors
To construct LV_syn_DIO_gamma6_2a_mCherry, two PCR amplicons DIO-Gamm6-P2A and mCherry-P2A-DIO were amplified from LV_syn_gamma6_2a_mCherry using primer pairs, o_BamHI_DIO_mCherry_f, o_ACCT_p2A_r, and o_ACCT_p2A_f, o_EcoRI_DIO_gamma6_r (Supplementary Table S6). The backbone was constructed by digesting LV_syn_DIO_gamma6_2a_mCherry with BamHI (New England Biolabs, #R3136) and EcoRI and gel-purified. The two PCR amplicons and the digested backbone were ligated in a golden gate reaction using BsmBI (Thermo Fisher Scientific, #ER0451) and T4 ligase. The constructed plasmid was verified by Sanger sequencing.
To construct LV_syn_DIO_mCherry, amplicon DIO mCherry was cloned from LV_syn_DIO_gamma6_2a_mCherry using primer pair, o_BamHI_DIO_mCherry_f, o_EcoRI_DIO_mCherry_r. The amplicon was combined with the LV_syn_DIO_gamma6_2a_mCherry backbone digested by BamHI and EcoRI in a golden gate reaction using BsmBI and T4 ligase. The constructed plasmid was verified by Sanger sequencing.
Surgery for Gamma6 viral injection
Pvalb-Cre or VGat-IRES-Cre mice at 21-25 p.n. days were used for in vitro electrophysiological validation and VGat-IRES-Cre mice of 8-10 weeks old were used for in vivo recordings. Each mouse was deeply anesthetized with isoflurane and similar procedures as described in the “Connectivity mapping, Surgery” section were followed. Retrograde cre-dependent LV-syn-DIO-gamma6-2a-mCherry (titer 1.6x10⁹ IU/ml, MGH Viral Vector Core, MA, USA) or control LV-syn-DIO-mCherry (2.6x10⁹ IU/ml, MGH Viral Vector Core) lentivirus was FuG-B2 pseudo-typed (pFUGB2) and was injected at the following coordinates for each mouse VPM: AP −1.4, ML 1.5 and DV −3.6; POm: AP −1.6, ML 1.3, DV −3.2. A total volume of 180nl was injected at each desired depth at the speed of 20nl per second.
In vitro validation of Gamma6 perturbation
In vitro electrophysiological recording were performed similarly as described in the section “In vivo CRISPR/Cas9 functional genetic screening, Electrophysiology”. Additionally, T-type mediated calcium current recordings were performed in voltage clamp mode with a modified aCSF containing in mM: 120 NaCl, 3 KCl, 20 TEA-Cl, 5 CsCl, 10 HEPES, 1 4-AP, 2 MgCl2 and 1 CaCl2. To ensure calcium current isolation, we used a CsMeSO4 based internal solution containing in mM: 130 CsMeSO4, 10 EGTA, 5 MgCl2, 10 TEA-Cl, 5 Na2ATP and 10 HEPES.
EEG recordings
8- to 10-week-old VGat-IRES-Cre mice were deeply anesthetized with a 1% to 1.5% isoflurane. After retrograde cre-dependent LV-syn-DIO-gamma6-2a-mCherry (titer 1.6x10⁹ IU/ml, MGH Viral Vector Core) or control LV-syn-DIO-mCherry (2.6x10⁹ IU/ml, MGH Viral Vector Core) was injected using a nanoinjector, a screw EEG electrode (Pinnacle Technology, Inc., #8403) was implanted into the skull above the primary somatosensory cortex, S1 (AP: −1.8 and ML: +3.0 mm) using a stereotaxic device (David Kopf Instruments). A reference electrode was screwed in the occipital region of the skull, and stainless-steel electromyography (EMG) electrodes were placed in the nuchal muscle. All the electrodes were connected to a head-mount (Pinnacle Technology, #8201-SS) and secured by using dental cement. The mice were allowed to recover for at least 2 weeks. Spontaneous EEG/EMG signals were recorded for 48 hours with a differential amplifier (Pinnacle Technology, 8200-K1-SL amplifier). All signals were digitized at a sampling frequency of 1,000 Hz, filtered (1–100 Hz bandpass for EEG; 10–1 kHz bandpass for EMG), and acquired using the Sirenia Acquisition program (Pinnacle Technology). Data was analyzed offline using Matlab (MathWorks, R2016a). The spectral power was calculated in 0.5-Hz bins (fast Fourier transform with Hamming window) with artifact-free 4-hour EEG signals from each animal. The power for spectral band was normalized in reference to the power of the entire EEG spectrum (1–100 Hz) in each animal and averaged across all the animals in the same treatment.
Sleep architecture, spindle detection and analysis
Sleep spindles were identified as previously described2. Briefly, using a semi-automated process, one 12h light-period of freely moving behavior was classified for each animal into three different states based on simultaneous EEG and EMG recordings: wake, non-rapid-eye-movement (NREM) sleep, and rapid-eye-movement (REM) sleep. Wake periods were identified by high EMG activity, and REM sleep was determined by low EMG activity and a high EEG theta/delta power ratio. The remaining epochs were treated as slow wave sleep (SWS). Minimum criteria for Wake and SWS were > 16 s and REM was > 5 s. NREM sleep bout durations were compared between groups using non-parametric statistics (Wilcoxon rank-sum and Kolmogorov-Smirnov test). For spindle detection, EEG recordings were filtered within the spindle frequency band (9-15 Hz), and its Hilbert transform (MATLAB function “hilbert”) was calculated. The envelope of the signal (1 s smoothing) was used as a basis for spindle detection. A threshold of one standard deviation (SD) was applied, and each threshold crossing was initially included. These events were subsequently visually inspected. Visualization was done aided by a time-frequency plot of the EEG signal and was performed blinded to experimental groups. Events < 0.5 s were excluded from analysis, as in standard practice63. Spindle count was normalized to time spent in NREM sleep, and spindle duration distributions were compared between groups using non-parametric statistics (Wilcoxon rank-sum and Kolmogorov-Smirnov test, respectively).
Statistical analysis
All data extracted from the analysis of the different experiments were transferred to GraphPad Prism for analysis and graphing, unless otherwise stated. Data are presented as mean ± SD. All error bars indicate Standard Deviation of the Mean (SD) unless otherwise stated. A Shapiro-Wilk test was applied to the original data to assess normality of data distribution. Group results were compared by using a two-sided unpaired Student’s t test. The significance level for all tests was p < 0.05. Researchers were blinded for the injection sites in the RetroBeads quantifications. Researchers were blinded for the experimental conditions in the EEG recordings and analysis. All electrophysiological recording and data analysis in the first round of CRISPR/Cas9 experiments were performed with researchers blinded to treatment conditions.
Extended Data
Extended Data Figure 1. Expression patterns of Gad2 and Pvalb across TRN.
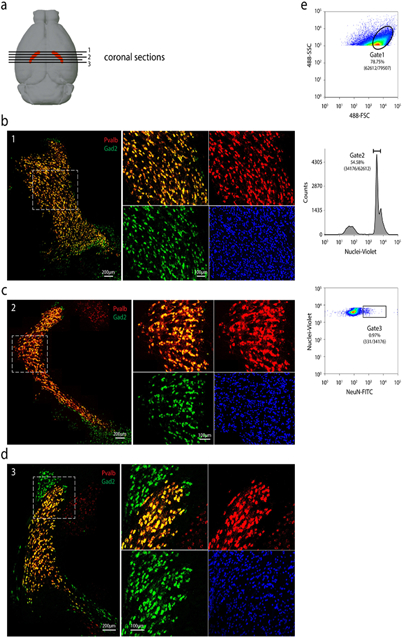
(a) Schematic of positions of coronal sections shown along the anterior to posterior axis (indicated by numbers). RNA-FISH co-staining of Gad2 and Pvalb in anterior (b), medial (c), and posterior (d) coronal sections. For each position: Left: overview of the RNA-FISH co-staining in TRN; Right: Zoom-in view of the boxed area in the left panel. For (b), (c), and (d), repeated with n = 2. (e) Representative FACS plot showing gating strategy used in sorting single nuclei for RNA sequencing. Repeated with n = 53 plate-based sorting.
Extended Data Figure 2. Identification of Gad2+ cell types.
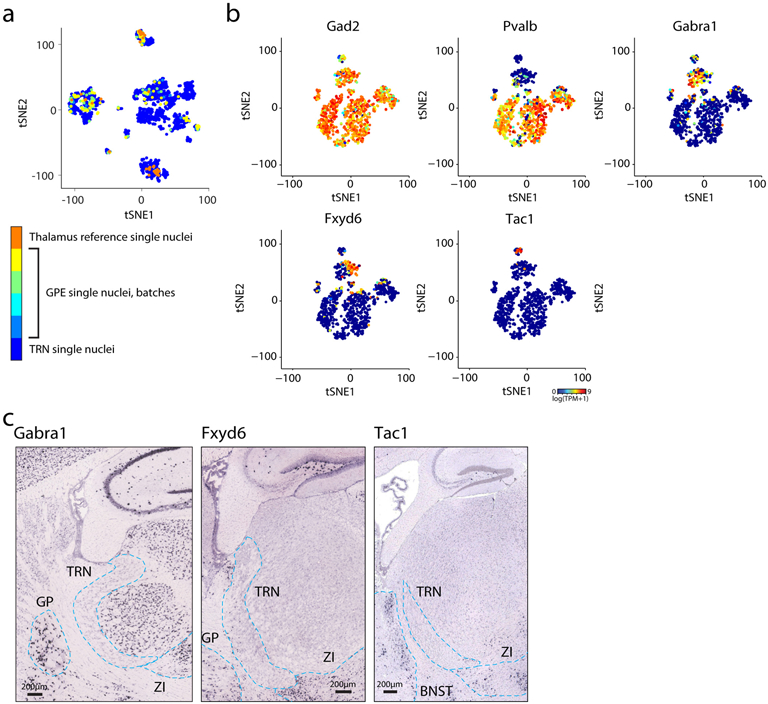
(a) t-SNE embedding of 1687 single nuclei as in Fig. 1a. Single nuclei are colored by dissection sources as indicated by the color bar on the right. Different batches of dissections from the external part of globus pallidus (GPE) are colored differently. n = 1,687 nuclei. (b) t-SNE embedding of nuclei showing expression levels (pseudo-color) of marker genes for each cluster. The three small clusters exhibiting dramatically less Pvalb expression, but enriched with a combination of markers including Gabra1, Fxyd6, Tac1. n = 868 nuclei. (c) ISH image in sagittal view of selected markers shown in b. Images obtained from Allen Brain Atlas (https://portal.brain-map.org/). Dashed lines indicate boundaries of TRN and the neighboring GABAergic nuclei. GP: globus pallidus; ZI: zona incerta; BNST: bed nucleus of the stria terminalis.
Extended Data Figure 3. Binarized expression pattern of Spp1 and Ecel1 represents transcriptomic gradient.
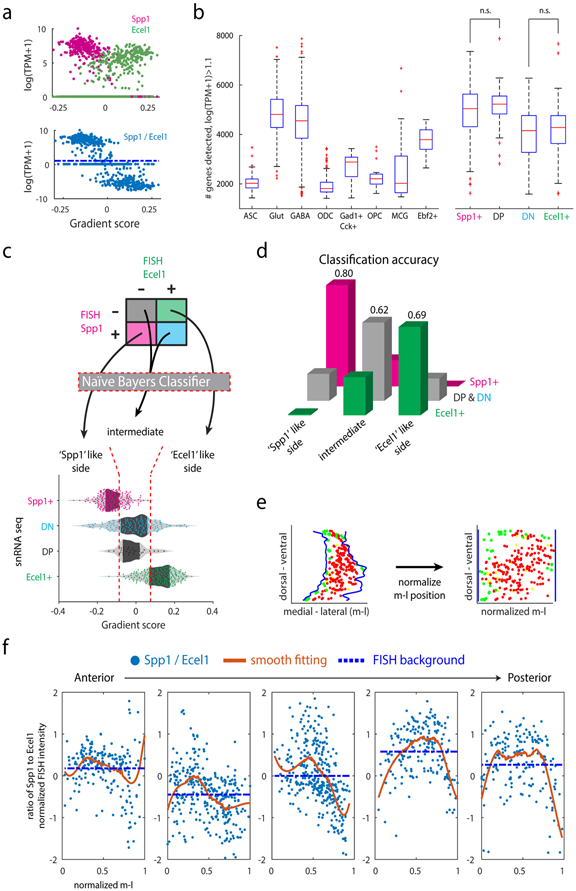
(a) Expression levels of Spp1 and Ecel1 (upper) and log(Spp1/Ecel1) (lower) in individual cells along the transcriptomic gradient, showing binary pattern of Spp1 and Ecel1 correlated with the gradient score. (b) Number of genes detected for the major cell types and TRN subpopulations, showing that the DP and DN are of quality comparable to other cell populations. nASC=124, nGlut=226, nGABA=868, nODC=388, nGad1+Cck+=9, nOPC=23, nMCG=28, nEbf2+=21 nuclei. Between Spp1+ and DP, p=0.1787; DN and Ecel1+, p=0.2897, two-sided ranksum test. n.s.: not significant. No adjustment for multiple testing was applicable. Box plots shows 25th, 50th, 75th percentiles, and the whiskers extend to the most extreme data points, ‘+’ are taken as outliers (Matlab R2017a). (c) Schematics of naïve Bayes classifiers to assign Spp1+, Ecel1+, DP and DN neurons into segments of the transcriptomic gradient. (d) Classification accuracy of the naïve Bayes classifiers. Shown are the probability of assigning Spp1+ to ‘Spp1’ segment, DP & DN neuron to the intermediate segment, and Ecel1+ to ‘Ecel1’ segment respectively. n=671 nuclei total, nSpp1+=264, nDP+DN=195, nEcel1+=212 neurons. (e) Schematics for normalization of medial-lateral position of individual neurons in FISH images. Blue line: TRN boundary; Red dots: Pvalb+Spp1+ neurons; Green dots: Pvalb+Ecel1+ neurons; Yellow dots: DP neurons; DN are not shown in the schematics. (f) Scatter plots showing log(Spp1/Ecel1) in individual Pvalb+ neurons at normalized medial-lateral position in selected tFISH images along anterior to posterior TRN, corresponding to Fig. 2c. m-l: medial-lateral position; Blue dots: individual cells; Solid red line: smooth fitting of blue data points, showing inverted-’U’ shape; Dashed blue line: mean of blue data points, indicating the difference in the FISH background of Spp1 and Ecel1 channel in different images.
Extended Data Figure 4. Injection sites in distinct thalamic relay nuclei and corresponding cortical projections.
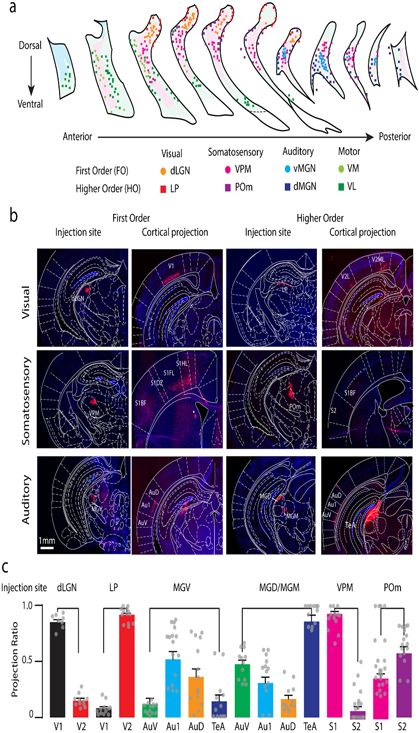
(a) The positions of retrogradely labeled neurons traced from different thalamic relay nuclei indicated by different colors are shown in the coronal view of TRN section series arranged from anterior to posterior. The light green and the magenta shaded areas indicate the distribution of typical Ecel1+ and Spp1+ neurons, respectively. VPM, ventral posterior medial; dLGN, lateral geniculate nucleus (dorsal part); POm, posterior-medial; LP, lateral posterior-lateral part; dMGN, medial geniculate-dorsal part; vMGN, medial geniculate-ventral part; VM, ventromedial; VL, ventrolateral. n = 3 mice per region. (b) Panoramic view of coronal sections showing the injection sites and cortical projection for each FO and HO thalamic nuclei. V1: primary visual cortex; V2L: secondary visual cortex lateral part; V2ML: secondary visual cortex medial-lateral part; S1BF: primary somatosensory cortex barrel field; S1DZ: primary somatosensory cortex dysgranular zones; S1FL: primary somatosensory cortex forelimb; S1HL: primary somatosensory cortex hindlimb; S2: secondary somatosensory cortex; AuV: secondary auditory cortex ventral area; Au1: primary auditory cortex; AuD: secondary auditory cortex dorsal area; MGD: medial geniculate nuclei dorsal part; MGM: medial geniculate nuclei medial part; TeA: temporal cortex, association area. n = 3 mice per region. (c) Quantification of the projection ratio between the primary and higher-order secondary/tertiary cortical areas for different thalamic injection sites. ndLGN=12 slices/2 mice, nLP=12 slices/2 mice, nMGV=15 slices/2 mice, nMGD/MGM=12 slices/2 mice, nVPM=12 slices/2 mice, nPOm=12 slices/2 mice. Bars represent mean ± SEM and raw data points.
Extended Data Figure 5. Distribution of TRN neurons according to molecular gradient score.
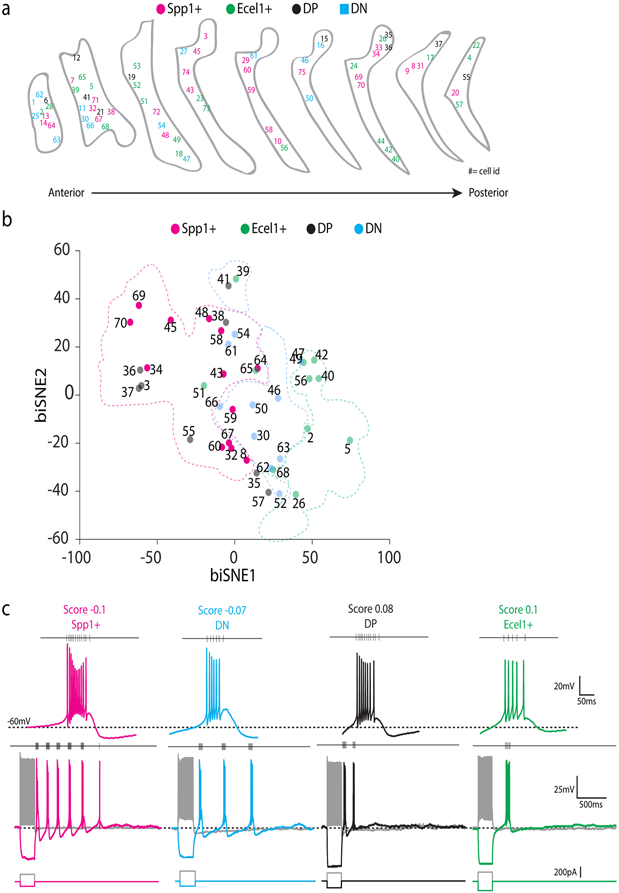
(a) The anatomical distribution of Patch-seq recorded neurons in coronal sections of TRN along the anterior-posterior axis. The cells were labeled with different colored numbers as indicated (Spp1+, magenta, Ecel1+, green, DP, black and DN, blue). Numbers indicate cell id. Shown are n=76 cells/5 mice, data collected by 2 experimenters. (b) biSNE embedding of the collected TRN neurons for Patch-seq showing molecular gradient pattern with Spp1+ (magenta), Ecel1+ (green), and the intermediate sub-populations DP (blue) and DN (black). Shown are subset of neurons from a batch of n=68 neurons/5 mice. (c) Representative voltage changes in response to hyperpolarizing current step injections. Spp1+ neurons (magenta) show robust rebound burst firings elicited by hyperpolarization with high firing frequencies within a burst. When a similar protocol is applied, most of the Ecel1+ neurons (green) show only one rebound burst with lower firing frequencies within a burst than Spp1+ neurons. DN (blue) and DP (black) neurons present intermediate properties. nEcel1+ = 15, nSpp1+ = 29, nDN = 9, nDP = 10 neurons.
Extended Data Figure 6. TRN neurons exhibit difference in action potential properties and morphology.
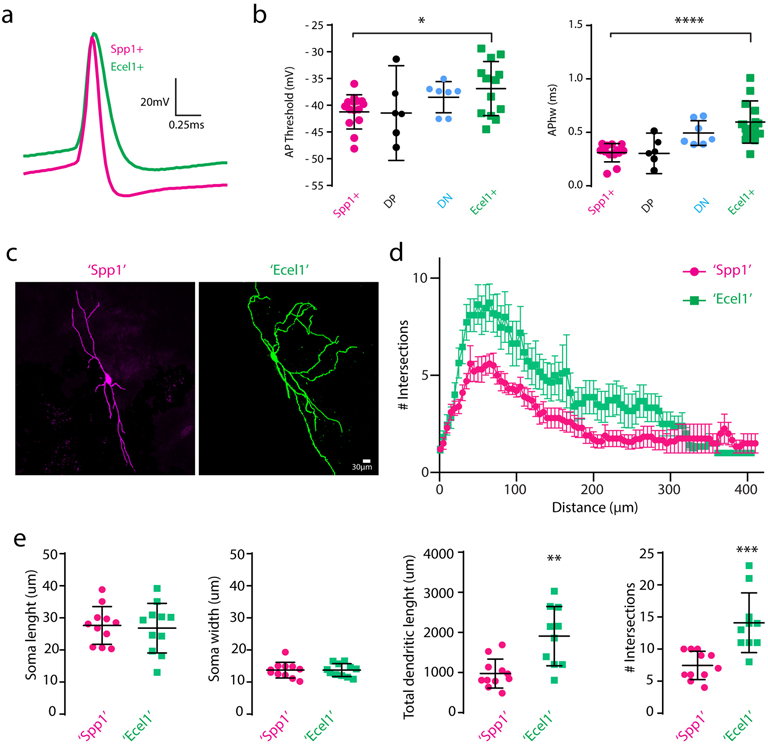
(a) Zoom-in view of a representative single action potential traces of Spp1+ and Ecel1+ neurons. (b) Summary of action potential (AP) threshold (p=0.015, two-sided unpaired t-test) and half-width of AP (APhw) (p= 7.08×10⁵, two-sided unpaired t-test). For (a) and (b), nSpp1=12, nEcel1=13, nDP=6, nDN=7 neurons from 5 mice. Plots represent mean ± SD and raw data points. (c) Example of Spp1+ like (‘Spp1’) (magenta) and Ecel1+ like (‘Ecel1’) (green) neuron morphology. (d) Sholl analysis of the dendritic complexity. (e) Summary of the soma length and width, total dendritic length and maximum number of intersections in Spp1+ like (‘Spp1’) and Ecel1+ like (‘Ecel1’) neurons (Mean ± SD. Dendritic length, p=0.0014. Number of intersections, p=0.0004, two-sided unpaired t-test). For (c), (d), and (e), n’Spp1’=11 neurons/4 mice, n’Ecel1’=10 neurons/4 mice.
Extended Data Figure 7. AAV-mediated pooled in vivo CRISPR screening.
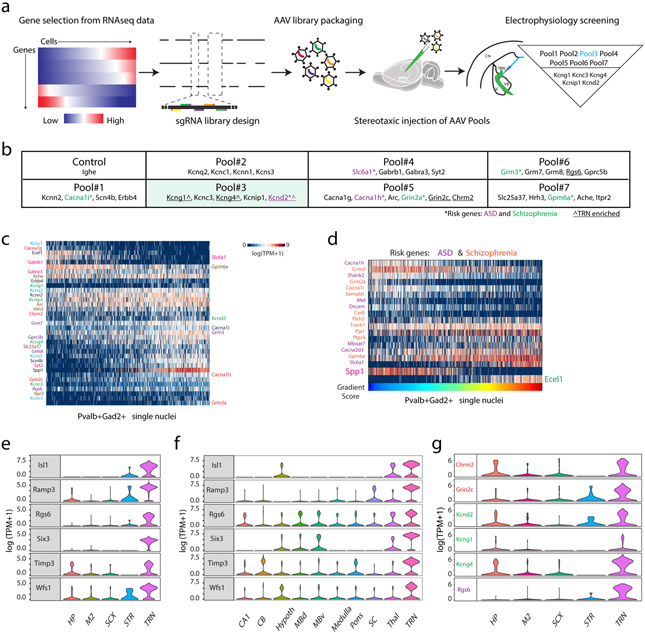
(a) Schematics of the AAV-mediated pooled CRISPR/Cas9 in vivo screen. (b) List of pools and genes selected for knockout in the CRISPR/ Cas9 screening. TRN enriched refers to genes differentially expressed between Pvalb+ neurons from TRN and from M2 cortex, somatosensory cortex, striatum, and hippocampus. (c) A heat map showing the expression pattern of the selected genes in the TRN neurons. The selected disease-risk genes are labeled on the right side. (d) A heat map showing the differentially expressed disease-risk genes in Spp1+ versus Ecel1+ neurons: autism spectrum disorder (ASD, purple) and Schizophrenia (orange). (e) Violin plots showing a list of genes differentially expressed between Pvalb+ neurons in TRN compared and Pvalb+ neurons in the four other brain regions including hippocampus (HP), secondary motor cortex (M2), somatosensory cortex (SCX), and striatum (STR). (f) Violin plots confirming the TRN-enriched gene list as shown in panel (e) in additional brain regions using the mousebrain.org datasets. CB: cerebellum; Hypoth: hypothalamus; MBd: medial basal nucleus dorsal part; MBV: medial basal nucleus ventral part; SC: spinal cord; Thal: thalamus. (g) Violin plots showing selected differentially expressed disease-risk genes compared to the Pvalb+ neurons in the other four brain regions as indicated. HP: hippocampus; M2: secondary motor cortex; SCX: somatosensory cortex; STR: striatum. For (e) and (g), nHP=90, nM2=97, nSCX=116, nSTR=13, nTRN=671 cells; For (f), nCA1=136, nCB=477, nHypoth=156, nMBb=331, nMBv=209, nMedulla=121, nPons=199, nSC=69, nThal=54, nTRN=501 cells. The violin plots width is based off of a Gaussian kernel density estimate of the data (estimated by the standard density function in R with default parameters), scaled to have maximum width equal to 1.
Extended Data Figure 8. Pooled in vivo CRISPR/Cas9 screening reveals gene sets contributing to TRN bursting firing properties.
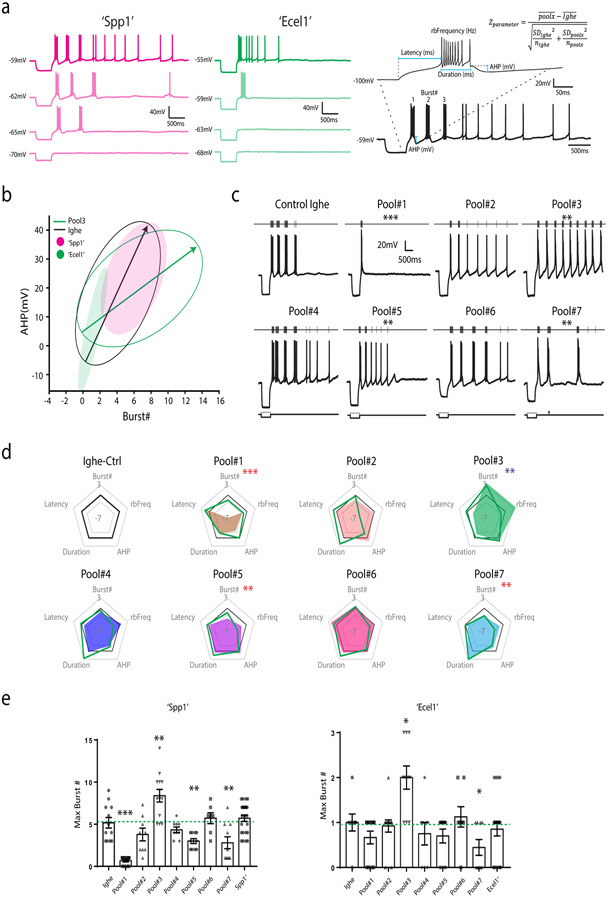
(a) Representative current-clamp recording traces of Spp1+ like (‘Spp1’, magenta) and Ecel1+ like (‘Ecel1’, green) neurons held at different membrane potentials. The trace with the maximum number of bursts was selected for measuring different burst properties and calculating the Z-score (shown in the right). (b) Plot showing confidence interval ellipses for classifying Spp1+ like (‘Spp1’) and Ecel1+ like (‘Ecel1’) neurons based on the AHP and the number of rebound bursts. (c) Representative rebound burst traces of recorded neurons after knocking out different sets of genes via CRISPR-Cas9 gene editing. Traces show rebound bursting activity changes in response to hyperpolarizing current step injections. TRN neurons exhibited distinct changes in their firing patterns after knockout of different gene groups. (d) Radar plots of 5 electrophysiological parameters illustrated in (a), showing the deviation of perturbed group to the control after knocking out sets of genes in the pooled approach. Positive changes show an increase towards a parameter, while negative changes show a decrease when compared to control. Green line indicates deviations in Ecel1+ like neurons and color shades indicates deviations in Spp1+ like neurons. (e) Summary of the maximum number of rebound bursts of TRN neurons elicited by comparable hyperpolarizing current step injection as described in Fig. 4b after different sets of genes were knocked out0 in the pooled approach in Spp1+ like (‘Spp1’) vs. Ecel1+ like (‘Ecel1’) neurons (‘Spp1’ Pool1, p = 4.8742×10⁷; Pool3, p=0.0033; Pool5, p=0.0088; Pool7, p=0.0065. ‘Ecel1’ Pool3, p=0.0081; Pool7, p=0.023, two-sided unpaired t-test). Bars represent the mean ± SEM. For (a)-(e): ‘Spp1’ Ighe n=12, Pool1 n=12, Pool2 n=9, Pool3 n=13, Pool4 n=9, Pool5 n=10, Pool6 n=9, and Pool7 n=10 cells; ‘Ecel1’ Ighe n=9, Pool1 n=12, Pool2 n=13, Pool3 n=10, Pool4 n=8, Pool5 n=10, Pool6 n=8, and Pool7 n=9 cells from 24 mice (3 mice per pool).
Extended Data Figure 9. Characterization and validation of in vivo CRISPR/Cas9 screening reveals key genes contributing to TRN bursting firing properties.
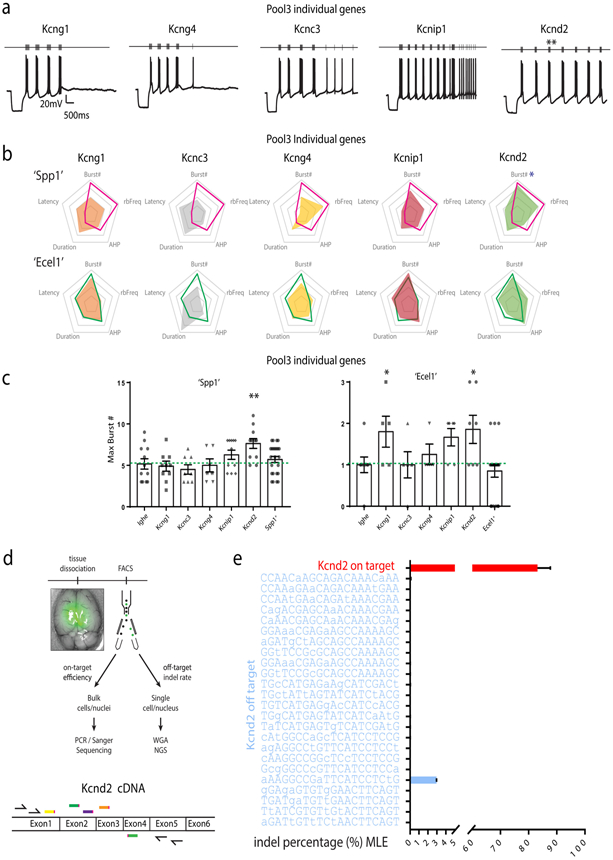
(a) Representative rebound burst traces of recorded neurons after knocking out different individual genes from Pool3 via CRISPR/Cas9 gene editing. Knocking out of Kcnd2 recapitulates the effects of Pool#3. (b) Radar plots for Pool3 individual gene. Top: Changes in Spp1+ like (‘Spp1’) neurons, pink line showing the effect of the Pool3 gene knock out and color shades showing the effect produced by individual gene knock out. Bottom: Changes in Ecel1+ like (‘Ecel1’) neurons, green line showing the Pool3 gene radar plot and color shades showing the changes produced by individual gene knockout. Kcnd2 knockout closely recapitulates the effect of Pool3 in both populations. (c) Summary of the maximum number of rebound bursts of TRN neurons elicited by comparable protocols after individual genes from Pool3 were knockout in Spp1+ like (‘Spp1’) vs. Ecel1+ like (‘Ecel1’) neurons (‘Spp1’ Kcnd2, p=0.0095. ‘Ecel1’ Kcng1, p=0.0088; Kcnd2, p=0.019, two-sided unpaired t-test). Bars represent the mean ± SEM. For (a)-(c), ‘Spp1’ Kcng1 n=6, Kcnc3 n=6, Kcng4 n=5, Kcnip1 n=7, Kcnd2 n=7; ‘Ecel1’ Kcng1 n=10, Kcnc3 n=8, Kcng4 n=9, Kcnip1 n=11, Kcnd2 n=11. (d) Schematics of the analysis for on-target and off-target efficiency. Upper: analysis flowchart. WGA: whole genome amplification; NGS: next generation sequencing. Lower: schematics of sgRNA design and primers for on-target analysis for Kcnd2 knockout. Five sgRNA were designed in Exon2, Exon3, and Exon4. As the length spanned by the leftmost sgRNA and the rightmost sgRNA exceeds the NGS analysis limit, nested PCR combined with Sanger sequencing was used for on-target efficiency analysis. Primers for the nested PCR are shown as black arrows in Exon1 and Exon5. (e) Bar chart showing the on-target efficiency (5 sgRNA pooled) analyzed by nested PCR and Sanger sequencing (control: n=96 nuclei, viral injected: n=384 nuclei) and off-target rate for the top predicted (see methods) off-target loci of each sgRNA analyzed by NGS (n=1600 cells and 72000 nuclei). Predicted off-target sequences are shown with mismatched bases in lower case. Bar plots represent maximum likelihood estimation (MLE) and upper Wilson score intervals, no raw data point applicable69 (Supplementary Information).
Extended Data Figure 10. Gamma6 expression and its perturbation effect in the TRN cells.
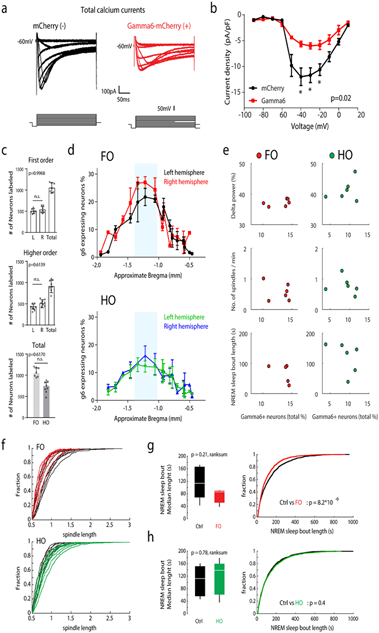
(a) Calcium currents measured in control (black traces) and with Gamma6 expression (red traces). (b) Summarized current density versus voltage relations showing that Gamma6 expressing TRN neurons exhibit smaller calcium current densities than controls (p=0.02, two-sided unpaired t-test, data presented as mean ± SEM). For (a) and (b), n=6 neurons/3 mice. (c) Quantification of retrogradely labeled cells (p=0.6170, n.s, not significant, two-sided unpaired t-test) and (d) their percentage of total PV+ neurons in the series of coronal slices from injected animals. L: left hemisphere; R: right hemisphere; g6: Gamma6; FO: first order; HO: higher order. For (c) and (d), n=7 for each experimental condition, data presented as mean ± SEM. For (c), plots are overlaid with raw data points. (e) Scatter plots showing Gamma6 expressing percentage and the effect size for individual animals. Upper row: Delta power percentage; Middle row: Number of spindles per minutes in NREM; Lower row: median length of sleep bout in NREM in seconds; Dots: animals with retrograde Gamma6 injection in FO (Red) and HO (Green) somatosensory thalamic nucleus. n=6 for each conditions. (f) Cumulative distribution of sleep spindle length for each individual animal with retrograde Gamma6 injection in FO (upper) and HO (lower) somatosensory thalamic nuclei, corresponding to Fig. 5h. Summary of median length of NREM sleep bouts with retrograde Gamma6 injection in FO (g) and HO (h) somatosensory thalamic nuclei. Right: two-sided Wilcoxon rank-sum test; Left: Kolmogorov-Smirnov test. For data in (f), (g), and (h), ncontrol (FO)=8, nGamma6 (FO)=8, ncontrol (HO)=7, nGamma6 (HO)=8. Box plots represent minima, 25th, 50th, 75th percentiles, maxima.
Supplementary Material
1. Supplementary Discussion
In vivo CRISPR/Cas9 screen reveals key genes regulating electrophysiological diversity in TRN.
2. Supplementary Methods
CRISPR knockout efficiency and specificity.
3. Supplementary Table S1.
Summary of Intrinsic membrane properties of TRN neurons with Patch-seq.
4. Supplementary Table S2.
Stereotactic coordinates applied for the thalamic relay nuclei.
5. Supplementary Table S3.
Selected genes included in the pooled CRISPR/Cas9 in vivo screen.
6. Supplementary Table S4.
Summary of rebound burst properties of TRN neurons following the viral mediated pooled CRISPR/Cas9 in vivo screening.
7. Supplementary Table S5.
Summary of rebound burst properties of TRN neurons following the viral mediated Pool 3 individual gene knockout with CRISPR/Cas9 system.
8. Supplementary Table S6.
Primer sequences.
9. Supplementary Table S7.
Design of sgRNA targets.
10. Supplementary Table S8.
CRISPR screen efficiency and specificity.
Acknowledgements
We thank the entire three laboratories of G.F. Z.F., and J.L. for discussions and support. We thank Ryan Kast for helpful comments on this manuscript, Morgan Fleishman and Marcela Palomero-Rivero for technical support, the Broad Flow Cytometry Facility for nucleus sorting, and Feng Zhang for CRISPR/Cas9 constructs. This work in the laboratory of G.F. was supported by the Simons Center for the Social Brain at MIT, the Stanley Center for Psychiatric Research at the Broad Institute of MIT and Harvard, Hock E. Tan and K. Lisa Yang Center for Autism Research at MIT, James and Patricia Poitras Center for Psychiatric Disorders Research at MIT, the McGovern Institute for Brain Research at MIT and NIH/NIMH grant R01NS098505, R01NS113245. The work in the laboratory of Z.F. was supported by the Stanley Center for Psychiatric Research at the Broad Institute of MIT and Harvard. The work in the laboratory of J.L. was supported by the Stanley Center for Psychiatric Research and the Klarman Cell Observatory at the Broad Institute of MIT and Harvard. The work in the laboratory of M.M.H. was supported by the Simons Center for the Social Brain at MIT, the Stanley Center for Psychiatric Research at the Broad Institute, the McGovern Institute for Brain Research at MIT, the Pew Foundation, the Human Frontiers Science Program and NIH grants R01NS098505, R01MH107680. Y.L. was supported by the McGovern-IDG Institute for Brain Research at Tsinghua University.
Footnotes
Competing interests
The authors declare no competing interests.
Data availability
Sequencing data for this study is available through the Gene Expression Omnibus GSE145273. Code for the snRNA-Seq analyses and the associated t-SNE mappings are made available through Github at (https://github.com/yinqingl). All additional data, code, and plasmids are available from the authors upon reasonable request.
Ethics statement
All experiments were done in accordance with NIH guidelines and approved by the Broad Institute and MIT Institutional Animal Care and Use Committee (CAC # 041602419 MIT, CAC# 000806141 Broad Institute).
References
- 1.Dong P et al. A novel cortico-intrathalamic circuit for flight behavior. Nat Neurosci 22, 941–949, doi: 10.1038/s41593-019-0391-6 (2019). [DOI] [PubMed] [Google Scholar]
- 2.Halassa MM et al. State-dependent architecture of thalamic reticular subnetworks. Cell 158, 808–821, doi: 10.1016/j.cell.2014.06.025 (2014). [DOI] [PMC free article] [PubMed] [Google Scholar]
- 3.McAlonan K, Cavanaugh J & Wurtz RH Attentional modulation of thalamic reticular neurons. J Neurosci 26, 4444–4450, doi: 10.1523/JNEUROSCI.5602-05.2006 (2006). [DOI] [PMC free article] [PubMed] [Google Scholar]
- 4.Pinault D The thalamic reticular nucleus: structure, function and concept. Brain Res Brain Res Rev 46, 1–31, doi: 10.1016/j.brainresrev.2004.04.008 (2004). [DOI] [PubMed] [Google Scholar]
- 5.Sherman SM & Guillery RW The role of the thalamus in the flow of information to the cortex. Philos Trans R Soc Lond B Biol Sci 357, 1695–1708, doi: 10.1098/rstb.2002.1161 (2002). [DOI] [PMC free article] [PubMed] [Google Scholar]
- 6.Ferrarelli F & Tononi G The thalamic reticular nucleus and schizophrenia. Schizophr Bull 37, 306–315, doi: 10.1093/schbul/sbq142 (2011). [DOI] [PMC free article] [PubMed] [Google Scholar]
- 7.Krol A, Wimmer RD, Halassa MM & Feng G Thalamic Reticular Dysfunction as a Circuit Endophenotype in Neurodevelopmental Disorders. Neuron 98, 282–295, 8 [DOI] [PMC free article] [PubMed] [Google Scholar]
- 8.Saletin JM, Coon WG & Carskadon MA Stage 2 Sleep EEG Sigma Activity and Motor Learning in Childhood ADHD: A Pilot Study. J Clin Child Adolesc Psychol 46, 188–197, doi: 10.1080/15374416.2016.1157756 (2017). [DOI] [PMC free article] [PubMed] [Google Scholar]
- 9.Steullet P et al. The thalamic reticular nucleus in schizophrenia and bipolar disorder: role of parvalbumin-expressing neuron networks and oxidative stress. Mol Psychiatry 23, 2057–2065, doi: 10.1038/mp.2017.230 (2018). [DOI] [PMC free article] [PubMed] [Google Scholar]
- 10.Halassa MM et al. Selective optical drive of thalamic reticular nucleus generates thalamic bursts and cortical spindles. Nat Neurosci 14, 1118–1120, doi: 10.1038/nn.2880 (2011). [DOI] [PMC free article] [PubMed] [Google Scholar]
- 11.Latchoumane CV, Ngo HV, Born J & Shin HS Thalamic Spindles Promote Memory Formation during Sleep through Triple Phase-Locking of Cortical, Thalamic, and Hippocampal Rhythms. Neuron 95, 424–435 e426, doi: 10.1016/j.neuron.2017.06.025 (2017). [DOI] [PubMed] [Google Scholar]
- 12.Wimmer RD et al. Thalamic control of sensory selection in divided attention. Nature 526, 705–709, doi: 10.1038/nature15398 (2015). [DOI] [PMC free article] [PubMed] [Google Scholar]
- 13.Brunton J & Charpak S Heterogeneity of cell firing properties and opioid sensitivity in the thalamic reticular nucleus. Neuroscience 78, 303–307 (1997). [DOI] [PubMed] [Google Scholar]
- 14.Clemente-Perez A et al. Distinct Thalamic Reticular Cell Types Differentially Modulate Normal and Pathological Cortical Rhythms. Cell Rep 19, 2130–2142, doi: 10.1016/j.celrep.2017.05.044 (2017). [DOI] [PMC free article] [PubMed] [Google Scholar]
- 15.Contreras-Rodriguez J, Gonzalez-Soriano J, Martinez-Sainz P, Marin-Garcia P & Rodriguez-Veiga E Neurochemical heterogeneity of the thalamic reticular and perireticular nuclei in developing rabbits: patterns of calbindin expression. Brain Res Dev Brain Res 144, 211–221 (2003). [DOI] [PubMed] [Google Scholar]
- 16.Cox CL, Huguenard JR & Prince DA Heterogeneous axonal arborizations of rat thalamic reticular neurons in the ventrobasal nucleus. J Comp Neurol 366, 416–430, doi: (1996). [DOI] [PubMed] [Google Scholar]
- 17.Lam YW & Sherman SM Functional organization of the thalamic input to the thalamic reticular nucleus. J Neurosci 31, 6791–6799, doi: 10.1523/JNEUROSCI.3073-10.2011 (2011). [DOI] [PMC free article] [PubMed] [Google Scholar]
- 18.Lee SH, Govindaiah G & Cox CL Heterogeneity of firing properties among rat thalamic reticular nucleus neurons. J Physiol 582, 195–208, doi: 10.1113/jphysiol.2007.134254 (2007). [DOI] [PMC free article] [PubMed] [Google Scholar]
- 19.Spreafico R, de Curtis M, Frassoni C & Avanzini G Electrophysiological characteristics of morphologically identified reticular thalamic neurons from rat slices. Neuroscience 27, 629–638 (1988). [DOI] [PubMed] [Google Scholar]
- 20.Hou G, Smith AG & Zhang ZW Lack of Intrinsic GABAergic Connections in the Thalamic Reticular Nucleus of the Mouse. J Neurosci 36, 7246–7252, doi: 10.1523/JNEUROSCI.0607-16.2016 (2016). [DOI] [PMC free article] [PubMed] [Google Scholar]
- 21.Liu J et al. Activation of Parvalbumin Neurons in the Rostro-Dorsal Sector of the Thalamic Reticular Nucleus Promotes Sensitivity to Pain in Mice. Neuroscience 366, 113–123, doi: 10.1016/j.neuroscience.2017.10.013 (2017). [DOI] [PubMed] [Google Scholar]
- 22.Kaiser T, Ting JT, Monteiro P & Feng G Transgenic labeling of parvalbumin-expressing neurons with tdTomato. Neuroscience 321, 236–245, doi: 10.1016/j.neuroscience.2015.08.036 (2016). [DOI] [PMC free article] [PubMed] [Google Scholar]
- 23.Habib N et al. Div-Seq: Single-nucleus RNA-Seq reveals dynamics of rare adult newborn neurons. Science 353, 925–928, doi: 10.1126/science.aad7038 (2016). [DOI] [PMC free article] [PubMed] [Google Scholar]
- 24.Shekhar K et al. Comprehensive Classification of Retinal Bipolar Neurons by Single-Cell Transcriptomics. Cell 166, 1308–1323 e1330, doi: 10.1016/j.cell.2016.07.054 (2016). [DOI] [PMC free article] [PubMed] [Google Scholar]
- 25.Astori S et al. The Ca(V)3.3 calcium channel is the major sleep spindle pacemaker in thalamus. Proc Natl Acad Sci U S A 108, 13823–13828, doi: 10.1073/pnas.1105115108 (2011). [DOI] [PMC free article] [PubMed] [Google Scholar]
- 26.Guillery RW Anatomical evidence concerning the role of the thalamus in corticocortical communication: a brief review. J Anat 187 ( Pt 3), 583–592 (1995). [PMC free article] [PubMed] [Google Scholar]
- 27.Sherman SM The thalamus is more than just a relay. Current Opinion in Neurobiology 17, 417–422, doi: 10.1016/j.conb.2007.07.003 (2007). [DOI] [PMC free article] [PubMed] [Google Scholar]
- 28.Ojima H Terminal morphology and distribution of corticothalamic fibers originating from layers 5 and 6 of cat primary auditory cortex. Cereb Cortex 4, 646–663 (1994). [DOI] [PubMed] [Google Scholar]
- 29.Lisman JE Bursts as a unit of neural information: making unreliable synapses reliable. Trends Neurosci 20, 38–43, doi: 10.1016/S0166-2236(96)10070-9 (1997). [DOI] [PubMed] [Google Scholar]
- 30.Steriade M, McCormick DA & Sejnowski TJ Thalamocortical oscillations in the sleeping and aroused brain. Science 262, 679–685 (1993). [DOI] [PubMed] [Google Scholar]
- 31.Huguenard JR & McCormick DA Thalamic synchrony and dynamic regulation of global forebrain oscillations. Trends Neurosci 30, 350–356, doi: 10.1016/j.tins.2007.05.007 (2007). [DOI] [PubMed] [Google Scholar]
- 32.McCormick DA & Bal T Sleep and arousal: thalamocortical mechanisms. Annu Rev Neurosci 20, 185–215, doi: 10.1146/annurev.neuro.20.1.185 (1997). [DOI] [PubMed] [Google Scholar]
- 33.Contreras D & Steriade M Spindle oscillation in cats: the role of corticothalamic feedback in a thalamically generated rhythm. J Physiol 490 ( Pt 1), 159–179 (1996). [DOI] [PMC free article] [PubMed] [Google Scholar]
- 34.Crunelli V et al. Dual function of thalamic low-vigilance state oscillations: rhythm-regulation and plasticity. Nat Rev Neurosci 19, 107–118, doi: 10.1038/nrn.2017.151 (2018). [DOI] [PMC free article] [PubMed] [Google Scholar]
- 35.Fernandez LM et al. Thalamic reticular control of local sleep in mouse sensory cortex. Elife 7, doi: 10.7554/eLife.39111 (2018). [DOI] [PMC free article] [PubMed] [Google Scholar]
- 36.Hansen JP et al. Calcium channel gamma6 subunits are unique modulators of low voltage-activated (Cav3.1) calcium current. J Mol Cell Cardiol 37, 1147–1158, doi: 10.1016/j.yjmcc.2004.08.005 (2004). [DOI] [PubMed] [Google Scholar]
- 37.Chu PJ, Robertson HM & Best PM Calcium channel gamma subunits provide insights into the evolution of this gene family. Gene 280, 37–48 (2001). [DOI] [PubMed] [Google Scholar]
- 38.Pellegrini C, Lecci S, Luthi A & Astori S Suppression of Sleep Spindle Rhythmogenesis in Mice with Deletion of CaV3.2 and CaV3.3 T-type Ca(2+) Channels. Sleep 39, 875–885, doi: 10.5665/sleep.5646 (2016). [DOI] [PMC free article] [PubMed] [Google Scholar]
- 39.Platt RJ et al. CRISPR-Cas9 knockin mice for genome editing and cancer modeling. Cell 159, 440–455, doi: 10.1016/j.cell.2014.09.014 (2014). [DOI] [PMC free article] [PubMed] [Google Scholar]
- 40.Lo Giudice Q, Leleu M, La Manno G & Fabre PJ Single-cell transcriptional logic of cell-fate specification and axon guidance in early-born retinal neurons. Development 146, doi: 10.1242/dev.178103 (2019). [DOI] [PubMed] [Google Scholar]
- 41.Sansom SN & Livesey FJ Gradients in the brain: the control of the development of form and function in the cerebral cortex. Cold Spring Harb Perspect Biol 1, a002519, doi: 10.1101/cshperspect.a002519 (2009). [DOI] [PMC free article] [PubMed] [Google Scholar]
- 42.Cembrowski MS et al. Spatial Gene-Expression Gradients Underlie Prominent Heterogeneity of CA1 Pyramidal Neurons. Neuron 89, 351–368, doi: 10.1016/j.neuron.2015.12.013 (2016). [DOI] [PubMed] [Google Scholar]
- 43.Harris KD et al. Classes and continua of hippocampal CA1 inhibitory neurons revealed by single-cell transcriptomics. PLoS Biol 16, e2006387, doi: 10.1371/journal.pbio.2006387 (2018). [DOI] [PMC free article] [PubMed] [Google Scholar]
- 44.Munoz-Manchado AB et al. Diversity of Interneurons in the Dorsal Striatum Revealed by Single-Cell RNA Sequencing and PatchSeq. Cell Rep 24, 2179–2190 e2177, doi: 10.1016/j.celrep.2018.07.053 (2018). [DOI] [PMC free article] [PubMed] [Google Scholar]
- 45.Shah S, Lubeck E, Zhou W & Cai L seqFISH Accurately Detects Transcripts in Single Cells and Reveals Robust Spatial Organization in the Hippocampus. Neuron 94, 752–758 e751, doi: 10.1016/j.neuron.2017.05.008 (2017). [DOI] [PubMed] [Google Scholar]
- 46.Stanley G, Gokce O, Malenka RC, Sudhof TC & Quake SR Continuous and Discrete Neuron Types of the Adult Murine Striatum. Neuron, doi: 10.1016/j.neuron.2019.11.004 (2019). [DOI] [PubMed] [Google Scholar]
- 47.Lee SC, Patrick SL, Richardson KA & Connors BW Two functionally distinct networks of gap junction-coupled inhibitory neurons in the thalamic reticular nucleus. J Neurosci 34, 13170–13182, doi: 10.1523/JNEUROSCI.0562-14.2014 (2014). [DOI] [PMC free article] [PubMed] [Google Scholar]
- 48.Pinault D, Bourassa J & Deschenes M The axonal arborization of single thalamic reticular neurons in the somatosensory thalamus of the rat. Eur J Neurosci 7, 31–40 (1995). [DOI] [PubMed] [Google Scholar]
- 49.Schmitt LI & Halassa MM Interrogating the mouse thalamus to correct human neurodevelopmental disorders. Mol Psychiatry 22, 183–191, doi: 10.1038/mp.2016.183 (2017). [DOI] [PMC free article] [PubMed] [Google Scholar]
References for Methods
- 50.Krishnaswami SR et al. Using single nuclei for RNA-seq to capture the transcriptome of postmortem neurons. Nat Protoc 11, 499–524, doi: 10.1038/nprot.2016.015 (2016). [DOI] [PMC free article] [PubMed] [Google Scholar]
- 51.Kim D et al. TopHat2: accurate alignment of transcriptomes in the presence of insertions, deletions and gene fusions. Genome Biol 14, R36, doi: 10.1186/gb-2013-14-4-r36 (2013). [DOI] [PMC free article] [PubMed] [Google Scholar]
- 52.Li B & Dewey CN RSEM: accurate transcript quantification from RNA-Seq data with or without a reference genome. BMC Bioinformatics 12, 323, doi: 10.1186/1471-2105-12-323 (2011). [DOI] [PMC free article] [PubMed] [Google Scholar]
- 53.Langmead B & Salzberg SL Fast gapped-read alignment with Bowtie 2. Nat Methods 9, 357–359, doi: 10.1038/nmeth.1923 (2012). [DOI] [PMC free article] [PubMed] [Google Scholar]
- 54.Zeisel A et al. Molecular Architecture of the Mouse Nervous System. Cell 174, 999–1014 e1022, doi: 10.1016/j.cell.2018.06.021 (2018). [DOI] [PMC free article] [PubMed] [Google Scholar]
- 55.Finak G et al. MAST: a flexible statistical framework for assessing transcriptional changes and characterizing heterogeneity in single-cell RNA sequencing data. Genome Biol 16, 278, doi: 10.1186/s13059-015-0844-5 (2015). [DOI] [PMC free article] [PubMed] [Google Scholar]
- 56.Banerjee-Basu S & Packer A SFARI Gene: an evolving database for the autism research community. Dis Model Mech 3, 133–135, doi: 10.1242/dmm.005439 (2010). [DOI] [PubMed] [Google Scholar]
- 57.Pardinas AF et al. Common schizophrenia alleles are enriched in mutation-intolerant genes and in regions under strong background selection. Nat Genet 50, 381–389, doi: 10.1038/s41588-018-0059-2 (2018). [DOI] [PMC free article] [PubMed] [Google Scholar]
- 58.Kamentsky L et al. Improved structure, function and compatibility for CellProfiler: modular high-throughput image analysis software. Bioinformatics 27, 1179–1180, doi: 10.1093/bioinformatics/btr095 (2011). [DOI] [PMC free article] [PubMed] [Google Scholar]
- 59.Cadwell CR et al. Electrophysiological, transcriptomic and morphologic profiling of single neurons using Patch-seq. Nat Biotechnol 34, 199–203, doi: 10.1038/nbt.3445 (2016). [DOI] [PMC free article] [PubMed] [Google Scholar]
- 60.Fuzik J et al. Integration of electrophysiological recordings with single-cell RNA-seq data identifies neuronal subtypes. Nat Biotechnol 34, 175–183, doi: 10.1038/nbt.3443 (2016). [DOI] [PMC free article] [PubMed] [Google Scholar]
- 61.Susaki EA et al. Advanced CUBIC protocols for whole-brain and whole-body clearing and imaging. Nat Protoc 10, 1709–1727, doi: 10.1038/nprot.2015.085 (2015). [DOI] [PubMed] [Google Scholar]
- 62.Joung J et al. Genome-scale CRISPR-Cas9 knockout and transcriptional activation screening. Nat Protoc 12, 828–863, doi: 10.1038/nprot.2017.016 (2017). [DOI] [PMC free article] [PubMed] [Google Scholar]
- 63.Purcell SM et al. Characterizing sleep spindles in 11,630 individuals from the National Sleep Research Resource. Nat Commun 8, 15930, doi: 10.1038/ncomms15930 (2017). [DOI] [PMC free article] [PubMed] [Google Scholar]
Associated Data
This section collects any data citations, data availability statements, or supplementary materials included in this article.
Supplementary Materials
1. Supplementary Discussion
In vivo CRISPR/Cas9 screen reveals key genes regulating electrophysiological diversity in TRN.
2. Supplementary Methods
CRISPR knockout efficiency and specificity.
3. Supplementary Table S1.
Summary of Intrinsic membrane properties of TRN neurons with Patch-seq.
4. Supplementary Table S2.
Stereotactic coordinates applied for the thalamic relay nuclei.
5. Supplementary Table S3.
Selected genes included in the pooled CRISPR/Cas9 in vivo screen.
6. Supplementary Table S4.
Summary of rebound burst properties of TRN neurons following the viral mediated pooled CRISPR/Cas9 in vivo screening.
7. Supplementary Table S5.
Summary of rebound burst properties of TRN neurons following the viral mediated Pool 3 individual gene knockout with CRISPR/Cas9 system.
8. Supplementary Table S6.
Primer sequences.
9. Supplementary Table S7.
Design of sgRNA targets.
10. Supplementary Table S8.
CRISPR screen efficiency and specificity.


